Abstract
In order to apply laser cladding technology to the complex surface processing of hot-working dies, this study developed a numerical model for curved surface laser cladding along various scanning trajectories under multi-physics coupling considering the dynamics of the molten pool, cladding parameters (scanning speed and laser power), Marangoni effect, and solid–liquid phase transition. Utilizing this model and by altering cladding parameters, the temperature field and the variation in coating thickness along various scanning trajectories were studied as well as the interaction between the two. The following discoveries were made. Variations in scanning trajectories lead to differences in the coating thickness of curved surface laser cladding. Regardless of the combination of cladding parameters, the coating thickness of scanning from top to bottom is always less than that from bottom to top, with a difference of approximately 0.05 mm. The temperature field and coating thickness influence each other. The Marangoni effect induced by the temperature field is the primary cause of coating thickness growth, while the coating thickness affects thermal transfer from the thermal source, ultimately influencing the temperature field. Employing a greater laser power or a slower scanning speed, or a combination of greater laser power and slower scanning speed, can increase the coating thickness and its maximum temperature in curved surface laser cladding. The model, when contrasted with experimental data, exhibits a comprehensive discrepancy of 3.49%, signifying its high precision and practical engineering applicability.
1. Introduction
Laser cladding technology, an advanced form of additive manufacturing [1], significantly enhances the surface characteristics of a substrate by leveraging the synergistic effects of high-energy laser beams and cladding materials, resulting in metallurgical bonding [2] on the substrate surface [3]. This technology has demonstrated superior performance in improving the tribological properties [4], mechanical properties [5], and corrosion resistance [6] of the substrate. Additionally, laser cladding offers a cleaner production environment and more straightforward equipment, which have led to its increasing application across various fields [7].
As a producer of automotive body panels, hot-working dies are subjected to long-term service under high temperatures and pressures [8], making them highly susceptible to surface wear that ultimately leads to scrapping [9]. Laser cladding technology can effectively repair or enhance the surface properties of hot-working dies, thereby achieving the goal of extending their service life [10,11].
During the curved surface laser cladding process, the evolution of the coating thickness is influenced by cladding parameters [12], Marangoni effect [13], the dynamics of the molten pool [14], and solid–liquid phase transition [15]. The coating thickness can affect the thermal transfer of high-energy lasers towards the substrate [16], thereby affecting the temperature field. Conversely, the temperature field also impacts the Marangoni effect, which arises from surface tension gradients, and subsequently influences the growth of the coating thickness.
Currently, research on laser cladding encompasses a spectrum of methodologies, ranging from numerical simulations to experimental studies, and includes a synergistic combination of both numerical modeling and experimental research.
Han et al. [17] employed experimental methods to analyze the influence of laser cladding parameters on the phase composition, forming quality, and wear resistance of the coating, concluding that the upper part of the coating is predominantly composed of equiaxed crystals, while the lower part is primarily characterized by columnar crystals. In order to conduct numerical simulation of laser cladding repair of the propeller, Izumi et al. [18] developed a three-dimensional finite element model including conduction, convection, contact, and radiation heat transfer and believed that the numerical simulation method could well predict the residual stress of laser cladding. Huang et al. [19] proposed a method to control the laser spot size in the process of laser cladding of curved parts and analyzed the microstructure, microhardness, adhesion properties, and wear resistance of the coating prepared by this method. Ji et al. [20] employed an integrated approach of numerical simulation and experimental research to investigate the impact of defocus distance on the quality of laser cladding formation and established a process map for surface characteristics. Kang et al. [21] integrated numerical simulation with experimental studies to analyze residual stresses in laser-clad steel pipes, devising a streamlined model for stress prediction. Jian et al. [22] used optical microscopy, scanning electron microscopy, and X-ray diffraction instruments to characterize the coatings produced by various improved laser cladding processes. Jie et al. [23] established a numerical model considering the effect of light beam and powder to simulate and analyze the non-isothermal flow during laser cladding. To enhance the service life of railway components, Kendall et al. [24] employed laser cladding for surface strengthening and utilized neutron diffraction to measure residual stress. Li et al. [25] incorporated WC into a Ni alloy and experimentally examined the fracture morphology and residual stress of the Ni-based cladding layer with varying WC concentrations. Lian et al. [26] carried out laser cladding on the crankshaft, studied the influence of scanning rate on flatness through the combination of experiment and numerical simulation, and verified the accuracy of the established numerical model by using variance analysis and experiment. Liu et al. [27] developed a numerical model to elucidate the relationship between overlap rate and cladding layer morphology in laser cladding of gear-curved surfaces and conducted a comparative analysis of the laser cladding experiment of gear with Ni-based powder and the model. Shrivastava et al. [28] established a finite element numerical model for laser cladding and utilized this model to predict the deformation of Inconel-625 coatings on AISI 1020 substrate. Lv et al. [29] developed a temperature field numerical model via finite element analysis and employed cellular automata to simulate microstructure growth in laser-clad IN718 alloy.
In order to repair the irregularity of turbine blade surface, Raj et al. [30] used variance analysis to study the influence of process parameters on dilution rate and hardness and obtained the optimal combination of process parameters. Liu et al. [31] leveraged Marangoni flow to control the bonding and flatness at the cladding interface and investigated the fracture mechanisms of T15 steel powder coatings with varying CeO2 concentrations. Shu et al. [32] developed a laser cladding regression model that incorporates shear strength and laser energy density and experimentally examined the wear resistance and interfacial bonding characteristics of the resulting cladding layer. Wang et al. [33] carried out a numerical model for predicting residual stress and validated it by calculating the stress in laser-clad components using X-ray diffraction technology. Tamanna et al. [34] developed a three-dimensional finite element thermomechanical numerical model to predict residual stress in titanium alloy substrates undergoing laser cladding and elucidated the variation in molten pool depth. Xue et al. [35] investigated the impact of thermal input on the dynamic behavior of the molten pool in the CMT process on curved surfaces and established the optimal range of process parameters. Wang et al. [36] employed spline curve fitting to capture the surface characteristics of curved components for laser cladding and subsequently analyzed the quality of the cladding through SEM.
Laser cladding temperature field and the coating thickness significantly influence the mechanical properties of the workpiece [36] as well as post-processing operations [37]. Moreover, the surfaces of most laser-clad components are not neat planes. Laser power and scanning speed are the cladding parameters that enable precise control in laser cladding [38,39]. Numerical simulation of the laser cladding process can significantly reduce economic costs and also effectively study the dynamic process [40]. Therefore, for curved surface laser cladding, investigating the patterns of temperature field and coating thickness by modulating cladding parameters can effectively satisfy the practical requirements of engineering applications. Simultaneously, for hot-working dies, research on the evolution patterns of coating thickness in curved surface laser cladding is not extensively available, and numerical models established for temperature field in curved surface laser cladding are relatively rudimentary.
In this study, a numerical model for curved surface laser cladding along various scanning trajectories was established, considering the multi-physics coupling of molten pool dynamics, cladding parameters, Marangoni effect, and solid–liquid phase transition. Utilizing this model and by altering cladding parameters, the temperature field and the variation in coating thickness along various scanning trajectories were studied, as well as the interaction between the two.
2. Numerical Modeling for Curved Surface Laser Cladding
2.1. Material Selection and Thermal Properties
AISI H13 stands out as the predominant material for intricate hot-working die surfaces and is widely recognized in the field of mechanical engineering [41]. The chemical composition is determined by a German-made AAS (Atomic Absorption Spectrometer) of model AAS CONTR AA300, as shown in Table 1. Owing to its superior mechanical and tribological characteristics, the potential for AISI H13 to be utilized in an ever-expanding array of scenarios is evident. Consequently, AISI H13 was selected as the substrate material for laser cladding in this study.

Table 1.
The composition of the AISI H13 material in terms of its chemical elements (wt.%).
For the laser cladding process to achieve an excellent metallurgical bond with the substrate material, it is essential to select a powder with chemical composition closely resembling that of the substrate material. Fe901 powder material, as shown in Table 2, has a chemical composition by AAS similar to AISI H13, and Fe-based metals are also known for their superior tribological properties [42], mechanical properties [43], and cost advantages. Therefore, Fe901 was selected as cladding powder for laser cladding in this study.
Table 2.
The composition of the Fe901 material in terms of its chemical elements (wt.%).
Based on the chemical makeup of both the powder and the substrate, the phase diagram [44,45] and JMatPro simulation [46] were used to calculate, and the thermal physical properties of powder and substrate were obtained through interpolation technology, as depicted in Figure 1.
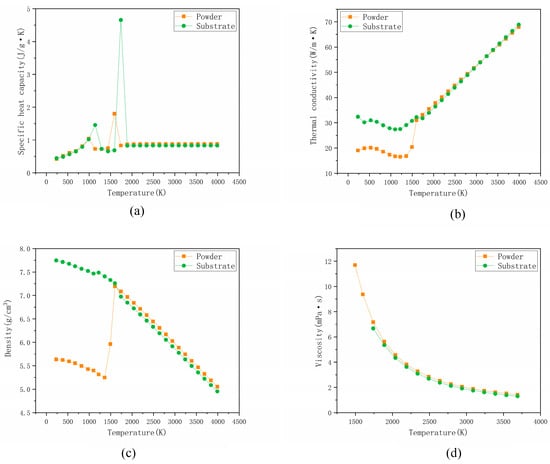
Figure 1.
The thermal properties of powder and substrate. (a) specific heat capacity, (b) thermal conductivity, (c) density, (d) viscosity.
2.2. Multi-Physics Coupling Numerical Model for Curved Surface Laser Cladding
Figure 2 illustrates the principle of curved surface laser cladding. As observed from the diagram, the laser heat source moves along the normal direction of the substrate’s outer contour, and the cladding powder fed into the beam melts together with the substrate to form a molten pool. This dynamic molten pool is not only influenced by the movement of the light source but also has an inextricable connection with gravity [14].
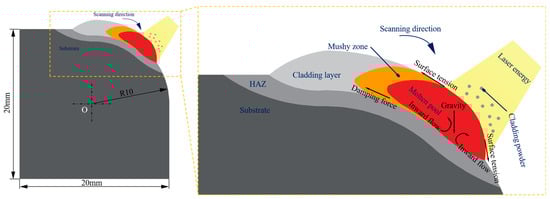
Figure 2.
The principle of curved surface laser cladding.
In addition, the temperature field within the molten pool and its vicinity leads to temperature gradients that create surface tension disparities. These disparities, in turn, induce the Marangoni effect, which ultimately influences the growth of the coating thickness. It is noteworthy that while the laser power in laser cladding parameters dictates the magnitude of photonic energy, the scanning speed within a dynamically moving heat source can influence the effective energy reception of the coating.
To facilitate the computation, the mathematical model described in this document is based on the following presuppositions:
- (1)
- The thermophysical changes during the curved surface laser cladding process are jointly determined by the intrinsic properties of the constituent powder and substrate materials.
- (2)
- The temperature range in the mushy zone is symmetric about the phase transformation temperature, with the liquid phase described as laminar, viscous, and incompressible Newtonian fluid.
- (3)
- The molten pool flows in accordance with the contour of the surface.
- (4)
- Only the powder that falls into the molten pool contributes to the evolution of the cladding layer.
- (5)
- The metallic alloy powder and substrate exhibit isotropic behavior.
- (6)
- This model disregards the effects of material vaporization.
Incorporating the flow characteristics of the molten pool in curved surface laser cladding with prior research [47,48], the continuity equation and momentum equation for the melt pool flow are presented as Equations (1) and (2):
where denotes the material density (g/mm3), represents time (s), signifies the Hamiltonian operator, indicates the velocity of the flow (mm/s), is the pressure (Pa), corresponds to temperature (K), is the dynamic viscosity of a Newtonian fluid (Pa·s), stands for the identity matrix, and represents the body force per unit volume (N/mm3).
Combining the thermal characteristics of the layers in the curved surface laser cladding process with the findings from reference [49], and based on the principles of mass conservation, momentum conservation, and energy conservation, the heat transfer energy equation for the fluid is derived, as shown in Equation (3):
Within this equation, symbolizes the material’s specific heat capacity (J/g·K), conveys the thermal conductivity (W/mm·K), and denotes the heat source (W/mm2).
Taking into account the three primary modes of heat transfer—thermal conduction, convection, and radiation—and aligning with the practical heat transfer scenarios in laser cladding processes along with the findings from reference [50], heat source is alternatively articulated in Equation (4):
In this equation, denotes the laser thermal source (W/mm2), signifies the convective thermal transfer coefficient (W/mm·K), represents the ambient temperature (K), indicates the surface emissivity, and is the Stefan–Boltzmann constant. is utilized to describe laser-induced thermal conduction, is employed to represent heat convection, and is used to depict thermal radiation.
In summary, Equations (1) to (4) collectively govern the system of field equations that describe the heat transfer process in curved surface laser cladding. In order to address the differential equations that regulate this laminar flow thermal transfer, it is crucial to define the correct boundary conditions.
Initial conditions: at = 0, the substrate possesses a uniform initial temperature as depicted in Equation (5):
Under the Neumann boundary condition, the laser energy, as referenced in [51], is represented by the Gaussian distribution model, which is detailed in Equation (6):
Here, symbolizes the laser efficiency, corresponds to the laser power (W), is the characteristic laser spot radius, and stands for the scanning speed (mm/s).
Under the Robin boundary conditions, considering the actual convective thermal transfer at the heated surface during the curved surface laser cladding process, and employing Fourier’s law of heat conduction and Newton’s law of cooling, the thermal transfer equation is derived as illustrated in Equation (7):
Encapsulating the essence, Equations (5) through (7), alongside the material’s physical parameters, synergistically constitute the boundary conditions for the differential equations governing laminar flow thermal transfer, thus ascertaining the existence of a definitive solution within the system.
2.3. Establishment of Cladding Parameters
Based on the requirements of our research group and the established literature [52,53,54], the range of cladding parameters was determined. Numerical modeling was performed using a range of laser power settings—1000 W, 1250 W, 1500 W, 1750 W, and 2000 W—and various scanning velocities—2 mm/s, 4 mm/s, 6 mm/s, 8 mm/s, and 10 mm/s. This parameter selection yielded a total of 25 distinct experimental setups.
3. Results and Discussion
3.1. Impact of Scanning Trajectories and Cladding Parameters on Temperature Field
Figure 3 illustrates flow field and temperature distribution in curved surface laser cladding along various scanning trajectories. It is evident that in both (a) and (b), the highest temperature is located at the position where the laser beam is directly incident. The closer to the beam, the higher the temperature value. This is attributed to the fact that during the laser cladding process, the heat source of the workpiece originates from the continuously moving high-energy laser beam, which is characterized by a Gaussian distribution of beam energy. Consequently, the temperature distribution exhibits a quasi-Gaussian pattern, often described as “high in the center and low around the edges”.
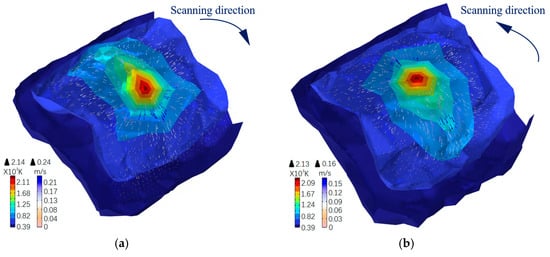
Figure 3.
Flow field and temperature distribution in curved surface laser cladding along various scanning trajectories. (a) Trajectory 1: direction from top to bottom. (b) Trajectory 2: direction from bottom to top.
In Figure 3, the arrows on the surface represent the flow velocity of the point, the direction of the arrows represents the direction of flow velocity, and the color of the arrows represents the flow velocity magnitude. Based on Figure 3, it can be observed that in both (a) and (b), the direction of flow velocity is from regions of higher temperatures to those of lower temperatures. This indicates that the temperature gradient generated by the temperature distribution creates a difference in surface tension across the molten pool, ultimately leading to the Marangoni effect. At the liquid surface of the molten pool, the absorption of thermal energy by molecules due to laser irradiation increases their internal energy, which enhances molecular diffusion. This enhanced diffusion increases the intermolecular spacing, thereby reducing the total intermolecular attraction within a unit volume and ultimately resulting in a decrease in surface tension. As previously mentioned, the temperature exhibits a gradient distribution, causing variations in thermal energy absorption among liquid surface molecules at different locations. In regions of lower temperatures, the absorption of thermal energy by liquid surface molecules is relatively minimal, leading to a more moderate reduction in surface tension. Conversely, in regions of higher temperatures, the absorption of thermal energy is more significant, resulting in a more pronounced decrease in surface tension. Due to the differences in surface tension across the liquid surface of the molten pool, molecules at the region of lower surface tension will migrate towards the region of higher surface tension, thus establishing a flow velocity directed from the higher temperature source to the lower temperature area.
Figure 3 reveals that the closer to the laser irradiation position, the greater the flow velocity, and conversely, the further away, the smaller the flow velocity. This is attributed to the fact that the temperature gradient is more pronounced near the laser irradiation position. The temperature gradient induces a difference in surface tension across the molten pool, which in turn generates the Marangoni effect. The Marangoni effect is stronger closer to the laser beam position compared to areas further away. When the temperature gradient is sufficiently small, the Marangoni effect diminishes, eventually leading to the cessation of molten pool movement. Additionally, as depicted in Figure 1d, which illustrates the relationship between material viscosity and temperature, the molten pool experiences significant flow hindrance at lower temperatures, indicating that the molten pool will solidify after ceasing to flow, forming a boundary of the melt pool with a certain width and thickness. The coating thickness corresponds to the upper boundary of the solidified molten pool.
Comparing Figure 3a,b, the temperature field in the curved surface laser cladding process is quite similar for scanning trajectories from top to bottom and from bottom to top. However, there is a discrepancy in the flow fields. On the surface of the molten pool and its immediate surroundings, the flow velocity is greater for the top-to-bottom scanning direction than for the bottom-to-top scanning direction.
The primary reason for the similar temperature distribution under different scanning trajectories is the use of identical process parameters and materials. However, the flow fields differ due to the influence of surface tension and gravity during the growth of the coating. The interplay of these forces, particularly the additional impact of gravity, is the main driver behind the variations observed in the flow fields for different scanning directions.
When the scanning direction is from top to bottom, gravity, which is perpendicular to the ground, forms an angle with the scanning direction that is less than 90 degrees. This configuration causes gravity to pull the molten pool along the scanning direction, thereby accelerating the flow velocity within the molten pool. Conversely, when the scanning direction is from bottom to top, the angle between the scanning direction and gravity exceeds 90 degrees. In this case, gravity acts to pull the molten pool against the scanning direction, resulting in a decrease in the flow velocity of the molten pool.
Given that the temperature field in the curved surface laser cladding process is quite similar for both top-to-bottom and bottom-to-top scanning trajectories, it suggests that the surface tension distribution is also fundamentally similar. This further indicates that the primary reason for the greater flow velocity around the molten pool surface and its vicinity when scanning from top to bottom, compared to from bottom to top, is the drag effect of gravity.
Figure 4 illustrates the maximum temperature in curved surface laser cladding with varying cladding parameters along trajectory 1, which has a scanning direction from top to bottom. Figure 5 depicts the maximum temperature in curved surface laser cladding with varying cladding parameters along trajectory 2, which has a scanning direction from bottom to top. Upon examining Figure 4a and Figure 5a, it is observed that regardless of the scanning direction, when the laser power is held constant, the maximum temperature decreases with increasing scanning speed; conversely, when the scanning speed is constant, the maximum temperature increases with higher laser power. This phenomenon can be attributed to the fact that a higher laser power delivers greater thermal energy, whereas a higher scanning speed results in a reduced efficiency of thermal energy conversion.
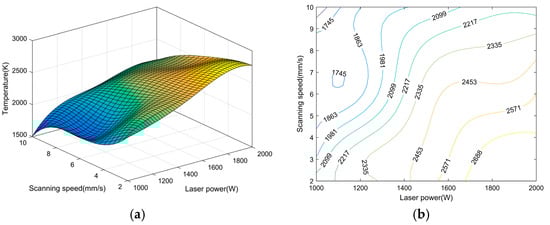
Figure 4.
The maximum temperature in curved surface laser cladding with varying cladding parameters along trajectory 1: scanning direction from top to bottom. (a) three-dimensional statistical chart, (b) contour map.
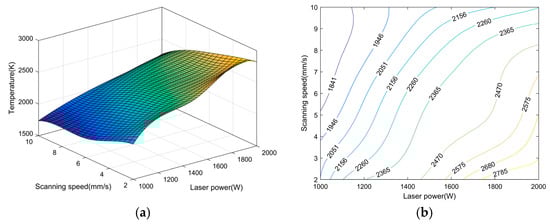
Figure 5.
The maximum temperature in curved surface laser cladding with varying cladding parameters along trajectory 2: scanning direction from bottom to top. (a) three-dimensional statistical chart, (b) contour map.
Figure 4 reveals that during the curved surface laser cladding process, the maximum temperature recorded was 2650 K when the laser power was set to 1750 W and the scanning speed was 4 mm/s, moving from top to bottom. At a reduced laser power of 1500 W with an increased scanning speed of 6 mm/s, the maximum temperature dropped to 2389 K. Further reduction in laser power to 1250 W, coupled with an even higher scanning speed of 8 mm/s, resulted in the lowest maximum temperature of 1911 K among the tested parameters. Across the 25 sets of parameters, the average maximum temperature was calculated to be 2245 K.
Figure 5 reveals that during the curved surface laser cladding process, the maximum temperature recorded was 2503 K when the laser power was set to 1750 W and the scanning speed was 4 mm/s, moving from bottom to top. At a reduced laser power of 1500 W with an increased scanning speed of 6 mm/s, the maximum temperature dropped to 2351 K. Further reduction in laser power to 1250 W, coupled with an even higher scanning speed of 8 mm/s, resulted in the lowest maximum temperature of 1958 K among the tested parameters. Across the 25 sets of parameters, the average maximum temperature was calculated to be 2264 K.
By comparing the extracted values and the data presented in Figure 4 and Figure 5, it is evident that cladding parameters have a significant impact on the maximum temperature achieved in curved surface laser cladding, whereas the influence of the scanning trajectory on the maximum temperature is relatively less pronounced.
This observation is attributed to the fact that the maximum temperature in laser cladding is formed by the continuous transfer and accumulation of temperatures at the top of the cladding layer. The heat transfer largely depends on two factors: firstly, the thermal conductivity as depicted in Figure 1b, and secondly, the size of the heat source determined by laser power and scanning speed. In contrast, the scanning trajectory has a less significant impact on heat transfer and accumulation. Compared to the scanning trajectory and cladding parameters (laser power and scanning speed), when monitoring the maximum temperature as the target in curved surface laser cladding, the influence of cladding parameters should be given priority. This will provide a certain reference for engineering technology applications.
3.2. Impact of Scanning Trajectories and Cladding Parameters on Coating Thickness
Figure 6 illustrates the evolution of the coating thickness in curved surface laser cladding along trajectory 1 with the cladding parameter combination of 1750 W laser power and 4 mm/s scanning speed. The coordinate information of the cladding layer is completed through three steps: finding the midpoint, calculating the length, and converting the units, all by using Nano Measurer. From 0 s to 0.45 s, the coating thickness continuously grows. Specifically, as observed in Figure 6a, at a time of 0.29 s, the cladding layer reaches its maximum thickness of 0.4 mm at a 6.65-degree position. Figure 6b reveals that at 0.44 s, the maximum coating thickness of 0.95 mm occurs at a 10.09-degree position. Figure 6c shows that at 0.45 s, the coating thickness peaks at 0.97 mm at a 10.32-degree position, and as combined with Figure 6d, this thickness is subsequently maintained at 0.97 mm. In conclusion, it is evident that under the cladding parameter combination of a 1750 W laser power and a 4 mm/s scanning speed, the coating achieves a constant thickness of 0.97 mm at 0.45 s in curved surface laser cladding along trajectory 1.
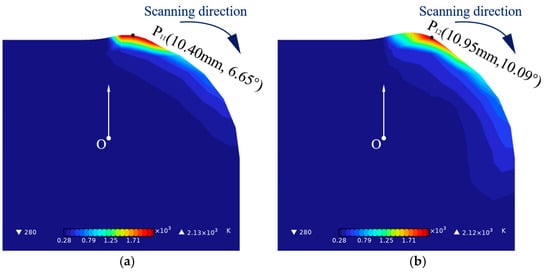
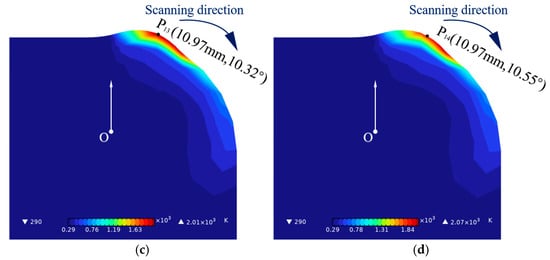
Figure 6.
The evolution of the coating thickness in curved surface laser cladding along trajectory 1 with the cladding parameter combination of 1750 W laser power and 4 mm/s scanning speed. (a) 0.29 s, (b) 0.44 s, (c) 0.45 s, (d) 0.46 s.
Figure 7 illustrates the evolution of the coating thickness in curved surface laser cladding along trajectory 2 with the cladding parameter combination of 1750 W laser power and 4 mm/s scanning speed. From 0 s to 0.40 s, the coating thickness continuously increases. Specifically, as observed in Figure 7a, at a time of 0.29 s, the maximum coating thickness of 0.48 mm is achieved at a 6.65-degree position. Figure 7b shows that at 0.39 s, the maximum coating thickness reaches 0.99 mm at an 8.94-degree position. Figure 7c indicates that at 0.40 s, the maximum coating thickness peaks at 1.02 mm at a 9.17-degree position, and as combined with Figure 7d, this thickness is subsequently maintained. Summing up, it is apparent that under the cladding parameter combination of a 1750 W laser power and a 4 mm/s scanning speed, the cladding layer along trajectory 2 process of curved surface laser cladding reaches a stable thickness of 1.02 mm at 0.40 s.
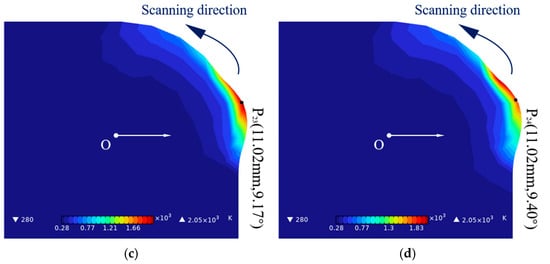
Figure 7.
The evolution of the coating thickness in curved surface laser cladding along trajectory 2 with the cladding parameter combination of 1750 W laser power and 4 mm/s scanning speed. (a) 0.29 s, (b) 0.39 s, (c) 0.40 s, (d) 0.41s.
Comparing Figure 6c with Figure 7c, under the same cladding parameters, both trajectory 1 and trajectory 2 in curved surface laser cladding exhibit the formation of a ramp at the starting point of the coating to the start of the cladding process. At the same time, the heat-affected zone states under the two different trajectories are relatively similar. However, there are certain differences in the following two aspects. Firstly, regarding the constant thickness, the steady-state thickness achieved with the trajectory 1 scanning is less than that with the trajectory 2 scanning. Secondly, concerning the time to reach the constant thickness, the downward scanning takes longer than the upward scanning, indicating that the upward scanning reaches the steady-state thickness earlier. Both scanning paths form a ramp due to the inclusion of volume forces in the momentum equation of our numerical model. Referring to Figure 1c, which illustrates the density variation with temperature, the density gradually increases as the cooling time extends during the molten state, leading to a progressive enhancement of gravitational effects. Coupled with the surface tension resulting from the temperature gradient in the molten pool, the cladding layer surface exhibits a ramp-like shape under the increasing gravity and the differential surface tension at the liquid surface.
The primary reasons for the differences are attributed to the distinct gravitational drag effects in upward and downward scanning curved surface laser cladding processes under the same set of cladding parameters. For upward scanning, the initiation of cladding aligns the gravitational force at 180 degrees to the scanning direction, as previously discussed in Section 3.1, resulting in a strong gravitational drag. In contrast, for downward scanning, the gravitational force is at a 90-degree angle to the scanning direction at the onset of cladding, leading to a weaker gravitational drag effect. The pronounced gravitational drag in upward scanning causes the cladding layer to accumulate towards the lower end, ultimately leading to rapid growth along the normal direction of the curved surface.
Figure 8 illustrates the constant coating thickness in curved surface laser cladding along trajectory 1 with varying cladding parameters, while Figure 9 shows the same for trajectory 2. By examining Figure 8a and Figure 9a, it is observed that regardless of the scanning direction, the constant coating thickness decreases with increasing scanning speed when the laser power is constant; conversely, it increases with increasing laser power when the scanning speed is held constant.
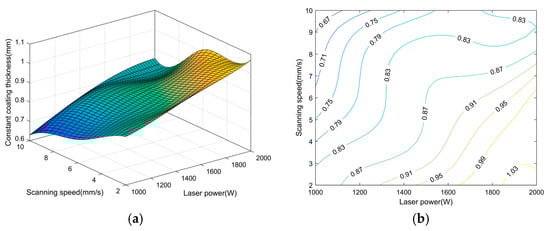
Figure 8.
The constant coating thickness in curved surface laser cladding with varying cladding parameters along trajectory 1: scanning direction from top to bottom. (a) three-dimensional statistical chart, (b) contour map.
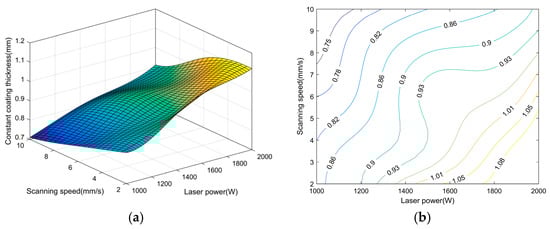
Figure 9.
The constant coating thickness in curved surface laser cladding with varying cladding parameters along trajectory 2: scanning direction from bottom to top. (a) three-dimensional statistical chart, (b) contour map.
Higher laser power provides greater thermal energy, which enhances the utilization rate of powder material. Meanwhile, a slower scanning speed allows for more efficient conversion of thermal energy, thereby amplifying the Marangoni effect and accelerating the evolution rate of the coating in the direction normal to the curved surface.
From Figure 8, it is observed that when the laser power is set to 1750 W with a scanning speed of 4 mm/s during downward curved surface laser cladding, the coating thickness reaches 0.97 mm. At a laser power of 1500 W with a scanning speed of 6 mm/s, the coating thickness is 0.87 mm. With a laser power of 1250 W and a scanning speed of 8 mm/s, the coating thickness is 0.80 mm. Across 25 sets of parameters, the average thickness of the coating is calculated to be 0.8588 mm.
Upon examination of Figure 9, it is noted that when the laser power is 1750 W with a scanning speed of 4 mm/s during upward curved surface laser cladding, the coating thickness is 1.02 mm. At a laser power of 1500 W with a scanning speed of 6 mm/s, the coating thickness measures 0.94 mm. With a laser power of 1250 W and a scanning speed of 8 mm/s, the coating thickness is 0.83 mm. The average thickness of the cladding layer across 25 sets of parameters is determined to be 0.9096 mm.
Incorporating the extracted numerical data along with the illustrations provided in Figure 8 and Figure 9, it is clear that both the cladding parameters and the scanning trajectory collectively influence the coating thickness. Upon comparing Figure 8 and Figure 9, it is observed that across various combinations of cladding parameters, the thickness of the coating in top-to-bottom scanning is consistently lower than that in bottom-to-top scanning. This observation further corroborates the findings presented in Section 3.1. Given that hot-working dies require milling after laser cladding before they can be put into service, a certain allowance for coating thickness is necessary to accommodate the material removal during machining. From the perspective of the two trajectories examined, trajectory 2 is more suitable for laser cladding on the curved surface of hot-working dies.
3.3. Influence of Coating Thickness on Temperature Field
Figure 10 and Figure 11 depict the gap of temperature between substrate and coating at the initial constant coating thickness along trajectories 1 and 2, respectively, with varying cladding parameters. Upon examining Figure 10a and Figure 11a, it is observed that, irrespective of the scanning trajectory, the temperature gap between the coating and the substrate decreases with an increase in scanning speed when the laser power is held constant; conversely, the gap increases with an increase in laser power when the scanning speed is maintained at a fixed level.
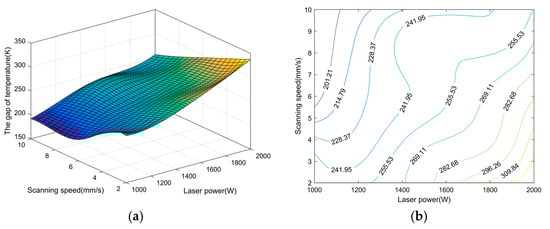
Figure 10.
The gap of temperature between substrate and coating at the initial constant coating thickness along trajectory 1 with varying cladding parameters. (a) three-dimensional statistical chart, (b) contour map.
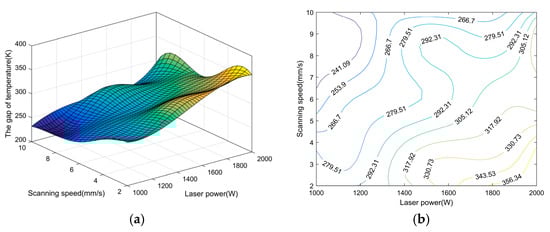
Figure 11.
The gap of temperature between substrate and coating at the initial constant coating thickness along trajectory 2 with varying cladding parameters. (a) three-dimensional statistical chart, (b) contour map.
Upon integrating Figure 8 and Figure 10, it is observed that at a laser power of 1750 W with a scanning speed of 4 mm/s in curved surface laser cladding along trajectory 1, the coating thickness reaches 0.97 mm, with a temperature differential of 276 K between the coating and the substrate. At a reduced laser power of 1500 W and an increased scanning speed of 6 mm/s, the coating thickness is 0.87 mm, with a temperature differential of 246 K. Further reducing the laser power to 1250 W with a scanning speed of 8 mm/s results in a coating thickness of 0.80 mm and a temperature differential of 227 K. Additionally, the Z-value distributions in both Figure 8 and Figure 10 exhibit a high degree of consistency. Collectively, this indicates that the temperature differential between the coating and the substrate increases with the augmentation of the constant coating thickness and, conversely, diminishes with the reduction in the constant coating thickness.
The same conclusion can be reached by performing the above comparison process on Figure 9 and Figure 11. The presence of the coating impedes the transfer of energy from the laser thermal source to the substrate, leading to a reduction in thermal transfer efficiency. As demonstrated in the thermal property data presented in Figure 1b, the material’s thermal conductivity increases with rising temperature. This thermophysical property paradoxically indicates that the coating thickness is a pivotal factor affecting the efficiency of energy transfer from the laser thermal source.
Comparing Figure 10a and Figure 11a, it is observed that under the same set of cladding parameters, the Z-values obtained from top-to-bottom scanning are consistently lower than those from bottom-to-top scanning, indicating a smaller temperature differential between the cladding layer and the substrate for top-to-bottom scans. Concurrently, as discussed in Section 3.2, the coating thickness is also found to be smaller for top-to-bottom scanning. This observation further substantiates, from an alternative perspective, that the thickness of the coating plays a crucial role in determining how effectively thermal energy is transferred from the heat source.
3.4. The Verification Experiment for Curved Surface Laser Cladding
As illustrated in Figure 12a, the laser model employed is the Raycus RFL-C4000X from Wuhan, China, a high-power continuous fiber laser with a rated output power of 4000 W, adjustable power ranges from 10% to 100%, and a central wavelength of 1080 ± 5 nm. As shown in Figure 12b, the six-axis robotic arm utilized is the KUKA KR60 3/FLOOR from Germany, and the positioning device is the KUKA DKP400V2. During the machining process, the positioning table of the positioning machine consistently maintains a horizontal plane with the ground. Concurrently, the laser head, guided by the robotic arm, remains parallel to the normal of the curved surface and moves consistently along the tangential direction of the surface. Drawing on the established commercial applications of the industry partner and the exploratory work conducted by research groups, the following process parameters were determined for the laser cladding experiments: laser power (W)/scanning speed (mm/s) were set at 1250/8, 1500/6, 1750/4, and 2000/2; a laser spot diameter of 4.5 mm; a powder feed rate of 13.5 g/min; and a carrier gas flow rate of 5 L/min. The dimensions of the curved surface laser cladding experimental specimens are consistent with the numerical simulation calculations, as depicted in Figure 2. The cladding powder and substrate are Fe901 and AISI H13, as described in Section 2.1.
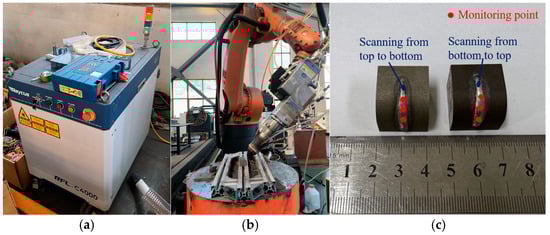
Figure 12.
Laser cladding equipment for curved surface and macroscopic monitoring points under various scanning trajectories. (a) laser, (b) robotic arm, (c) specimens.
In pursuit of precise measurement of the experimental thickness of a surface-melted cladding component, this study employs a combined macro–micro measurement approach. Initially, a coordinate-measuring machine (CMM) is utilized to ascertain the thickness at three distinct points of the coating, as depicted in Figure 12c, and the average thickness, denoted as a, is calculated. Subsequently, a high-definition electron microscope is employed to measure the thickness at three positions of the surface-melted cladding specimen after wire cutting, as illustrated in Figure 13 and Figure 14, and the average thickness, denoted as b, is determined. Taking Figure 13 as an example, b = (L1 + L2 + L3)/3. Ultimately, the experimental thickness is determined by calculating c = (a + b)/2, with c serving as the definitive measure of the experimental thickness.
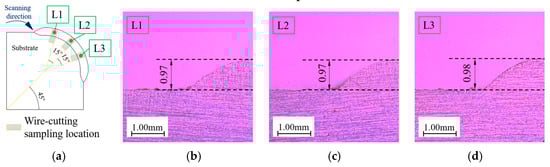
Figure 13.
The microscopic measurement results of coating thickness with the cladding parameter combination of 1750 W laser power and 4 mm/s scanning speed under scanning trajectory 1.(a) cutting location, (b) thickness of L1, (c) thickness of L2, (d) thickness of L3.
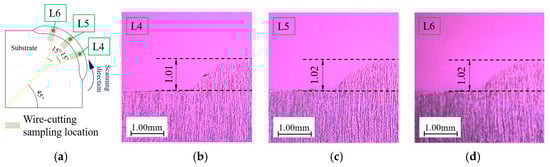
Figure 14.
The microscopic measurement results of coating thickness with the cladding parameter combination of 1750 W laser power and 4 mm/s scanning speed under scanning trajectory 2.(a) cutting location, (b) thickness of L4, (c) thickness of L5, (d) thickness of L6.
Figure 15 illustrates comparison of experimental and simulation data under various scanning trajectories. From the numerical values shown in Figure 15a, it can be calculated that the errors between experiments and simulations for four sets of cladding parameter combinations when scanning from top to bottom are 1.27%, 2.35%, 1.02%, and 1.90%, respectively. From the numerical values shown in Figure 15b, the errors for the same four sets of cladding parameter combinations when scanning from bottom to top are 3.49%, 2.17%, 0.99%, and 0.90%, respectively.
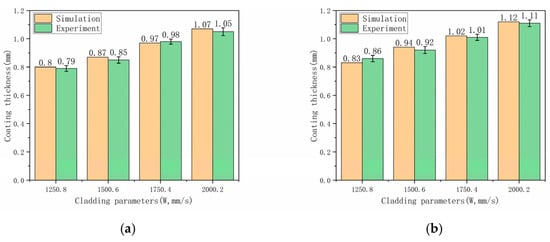
Figure 15.
Comparison of experimental and simulation data under various scanning trajectories. (a) Trajectory 1: direction from top to bottom. (b) Trajectory 2: direction from bottom to top.
To sum up, the overall discrepancy of the numerical model developed in this research is 3.49%, falling below the 5% threshold [55]. This indicates that the model possesses a certain degree of accuracy and can provide a reference for engineering applications.
4. Conclusions
- The temperature field and the growth of the coating thickness in curved surface laser cladding are interdependent. During the process of curved surface laser cladding, the temperature field induces a Marangoni effect due to the temperature gradient, which influences the growth of the coating thickness. Concurrently, the coating thickness affects the energy transfer from the heat source, leading to temperature differences between the surface of the coating and the substrate, thereby impacting the temperature field.
- The cladding parameters, such as laser power and scanning speed, significantly influence the temperature field in curved surface laser cladding. Employing a combination of great laser power and slow scanning speed, or both, can yield elevated temperatures in the cladding process. For scanning trajectories from top to bottom and from bottom to top, using a laser power of 1750 W and a scanning speed of 4 mm/s results in peak cladding temperatures of 2650 K and 2503 K, respectively.
- The cladding parameters, namely laser power and scanning speed, significantly influence the coating thickness in curved surface laser cladding. Utilizing a greater laser power or a slower scanning speed, or a combination of both, can result in a greater thickness of the coating. For scanning trajectories from top to bottom and from bottom to top, employing a cladding parameter combination of 1750 W laser power and 4 mm/s scanning speed, the coating thicknesses are 0.97 mm and 1.02 mm, respectively, with experimental values of 0.98 mm and 1.01 mm. Integrating eight sets of experimental and simulation data comparisons, the comprehensive error is 3.49%, signifying its high precision and practical engineering applicability.
- In curved surface laser cladding, the coating thickness varies with various scanning trajectories. The drag effect of gravity causes the coating thickness to be lower when scanning from top to bottom compared to scanning from bottom to top, with a difference of approximately 0.05 mm. Compared to the differences in coating thickness, the temperature field differences are not significant across various scanning trajectories.
Author Contributions
Conceptualization, W.C.; Methodology, Y.Z.; Software, C.D.; Validation, C.D.; Investigation, Y.Z.; Writing—original draft, C.D.; Writing—review & editing, W.C.; Visualization, Y.Z.; Supervision, W.C. All authors have read and agreed to the published version of the manuscript.
Funding
This work is supported by the National Natural Science Foundation of China (Grant No. 51875263).
Data Availability Statement
The original contributions presented in this study are included in the article. Further inquiries can be directed to the corresponding author(s).
Conflicts of Interest
The authors declare that they have no known competing financial interests or personal relationships that could have appeared to influence the work reported in this paper.
References
- Lee, Y.; Feldhausen, T.; Fancher, C.M.; Nandwana, P.; Babu, S.S.; Simunovic, S.; Love, L.J. Prediction of residual strain/stress validated with neutron diffraction method for wire-feed hybrid additive/subtractive manufacturing. Addit. Manuf. 2024, 79, 103920. [Google Scholar] [CrossRef]
- Nie, M.; Zhang, S.; Wang, Z.; Zhang, H.; Zhang, C.; Chen, H. Development of a novel method for measuring the interfacial bonding strength of laser cladding coatings. Opt. Laser Technol. 2022, 148, 10. [Google Scholar] [CrossRef]
- Yang, X.; Chen, Y.; Zhang, Z.; Liu, Y.; Tao, S.; Li, G.; Chen, H. Study on microstructure and properties of laser-clad Fe-based (Ti, V)C composite coatings. Coatings Technol. 2023, 464, 13. [Google Scholar] [CrossRef]
- Qi, K.; Yang, Y.; Hu, G.; Lu, X.; Li, J. Thermal expansion control of composite coatings on 42CrMo by laser cladding. Surf. Coatings Technol. 2020, 397, 125983. [Google Scholar] [CrossRef]
- Chai, Q.; Zhang, H.; Fang, C.; Qiu, X.; Xing, Y. Numerical and experimental investigation into temperature field and profile of Stellite6 formed by ultrasonic vibration-assisted laser cladding. J. Manuf. Process. 2023, 85, 80–89. [Google Scholar] [CrossRef]
- Mahto, M.K.; Kumar, A.; Vashista, M.; Yusufzai, M.Z.K. Effect of tool offset distance variation and mechanical property evaluation for effective cladding of copper to steel by friction stir cladding. J. Manuf. Process. 2023, 96, 161–175. [Google Scholar] [CrossRef]
- Liu, Y.; Ding, Y.; Yang, L.; Sun, R.; Zhang, T.; Yang, X. Research and progress of laser cladding on engineering alloys: A review. J. Manuf. Process. 2021, 66, 341–363. [Google Scholar] [CrossRef]
- Zhu, L.D.; Xue, P.; Lan, Q.; Meng, G.; Ren, Y.; Yang, Z.; Xu, P.; Liu, Z. Recent research and development status of laser cladding: A review. Opt. Laser Technol. 2021, 138, 106915. [Google Scholar] [CrossRef]
- Li, C.; Zhang, M.; Yu, M.; Han, X. Experimental Study on the Performance of Composite Gradient Reinforced Cladding Layer of Ductile Iron IN625/Co12. J. Mater. Eng. Perform. 2023, 33, 12517–12527. [Google Scholar] [CrossRef]
- Sun, W.; Zhang, D.; Chen, X.; Wang, K.; Zhang, J.; Jia, Y. Effect of the scanning speed of laser cladding on microstructure and mechanical properties of WC/Ni composite coatings. J. Mech. Sci. Technol. 2022, 36, 679–687. [Google Scholar] [CrossRef]
- Lu, H.; Cai, J.; Luo, K.; Xing, F.; Zhang, Q.; Yao, J.; Lu, J. Thermal fatigue life and improvement mechanism of Fe-based coatings on H13 extrusion die by laser additive remanufacturing. Surf. Coatings Technol. 2021, 408, 126808. [Google Scholar] [CrossRef]
- Fetni, S.; Enrici, T.M.; Niccolini, T.; Tran, S.H.; Dedry, O.; Jardin, R.; Duchêne, L.; Mertens, A.; Habraken, A.M. 2D thermal finite element analysis of laser cladding of 316L+WC Composite coatings. Procedia Manuf. 2020, 50, 86–92. [Google Scholar] [CrossRef]
- Li, J.; Li, H.N.; Liao, Z.; Axinte, D. Overlapped wire-fed laser cladding on inclined surfaces: An analytical model considering gravity and a model application. J. Mech. Work. Technol. 2022, 304, 117559. [Google Scholar] [CrossRef]
- Fu, Y.; Gu, H.; Qian, L.; Li, Y.; Tong, Z.; Tao, Y.; Zhang, Z.; Yu, Z.; Ren, X. Laser cladding for pipeline components: Understanding molten pool dynamics and track formation on outer/inner tube surfaces. Opt. Laser Technol. 2024, 179, 14. [Google Scholar] [CrossRef]
- Wang, C.; Zhou, J.; Zhang, T.; Meng, X.; Li, P.; Huang, S. Numerical simulation and solidification characteristics for laser cladding of Inconel 718. Opt. Laser Technol. 2022, 149, 107843. [Google Scholar] [CrossRef]
- Deng, C.Y.; Zhu, Y.X.; Chen, W. Numerical Investigation of the Effects of Process Parameters on Temperature Distribution and Cladding-Layer Height in Laser Cladding. Coatings 2024, 14, 1020. [Google Scholar] [CrossRef]
- Han, T.; Ding, Z.; Feng, W.; Yao, X.; Chen, F.; Gao, Y. Effects of Process Parameters on Microstructure and Wear Resistance of Laser Cladding A-100 Ultra-High-Strength Steel Coatings. Coatings 2024, 14, 669. [Google Scholar] [CrossRef]
- Izumi, T.; Arai, M. Numerical simulation of the 3D propeller repair process by laser cladding of SUS316L on SUS304. J. Manuf. Process. 2023, 98, 234–253. [Google Scholar] [CrossRef]
- Huang, H.; Sun, W.; Huang, Y.; Yu, J. Properties of Curved Parts Laser Cladding Based on Controlling Spot Size. Appl. Sci. 2020, 10, 13. [Google Scholar] [CrossRef]
- Ji, S.; Liu, F.; Shi, T.; Fu, G.; Shi, S. Effects of Defocus Distance on Three-Beam Laser Internal Coaxial Wire Cladding. Chin. J. Mech. Eng. 2021, 34, 45. [Google Scholar] [CrossRef]
- Kang, L.; Zhang, C.; Bradford, M.A.; Liu, X. Residual stresses in circular steel tubular columns repaired by laser-cladding additive manufacturing. Thin-Walled Struct. 2023, 193, 111275. [Google Scholar] [CrossRef]
- Jian, Y.C.; Shi, Y.; Liu, J. Effect of laser pretreatment and laser cladding on the interface bond strength and surface properties of vermicular graphite. J. Mater. Sci. 2022, 57, 6929–6942. [Google Scholar] [CrossRef]
- Jie, D.; Wu, M.; He, R.; Cui, C.; Miao, X. A multiphase modeling for investigating temperature history, flow field and solidification microstructure evolution of FeCoNiCrTi coating by laser cladding. Opt. Laser Technol. 2024, 169, 110197. [Google Scholar] [CrossRef]
- Kendall, O.; Abrahams, R.; Paradowska, A.; Reid, M.; Qiu, C.; Mutton, P.; Schläfer, T.; Yan, W. Influence of multi-layer laser cladding depositions and rail curvature on residual stress in light rail components. Eng. Fail. Anal. 2023, 150, 15. [Google Scholar] [CrossRef]
- Li, W.; Yang, X.; Wang, S.; Duan, D.; Li, F.; Qiao, Y.; Liu, Y.; Liu, X. The effect of WC content on the bonding strength and mechanical properties of WC/Ni60 coatings of brake disc. Opt. Laser Technol. 2022, 149, 11. [Google Scholar] [CrossRef]
- Lian, G.; Liu, Z.; Zhang, Y.; Feng, M.; Chen, C.; Jiang, J. The Forming Control Method of Multi-Track Laser Cladding on Curved Surface. Metals 2020, 10, 16. [Google Scholar] [CrossRef]
- Liu, J.D.; Ba, Z.Y.; Shu, D. Laser Cladding Path Planning for Curved Metal Parts. Metals 2024, 14, 14. [Google Scholar] [CrossRef]
- Shrivastava, A.; Chakraborty, S.S.; Pal, S.K. Thermo-mechanical finite element analysis of single-track deposition of Inconel-625 on AISI-1020 substrate. Mater. Today Proc. 2022, 66, 3859–3864. [Google Scholar] [CrossRef]
- Lv, H.; Li, X.; Li, Z.; Wang, W.; Yang, K.; Li, F.; Xie, H. Investigation on the columnar-to-equiaxed transition during laser cladding of IN718 alloy. J. Manuf. Process. 2021, 67, 63–76. [Google Scholar] [CrossRef]
- Raj, D.; Maity, S.R.; Das, B. Optimization of Process Parameters of Laser Cladding on AISI 410 Using MEREC Integrated MABAC Method. Arab. J. Sci. Eng. 2023, 49, 10725–10739. [Google Scholar] [CrossRef]
- Liu, L.; Wang, G.; Zhang, J.; Wang, L.; Rong, Y. Synchronous optimization of surface flatness and interfacial bonding strength in laser cladding by Marangoni flow. J. Manuf. Process. 2024, 125, 25–37. [Google Scholar] [CrossRef]
- Shu, L.; Gong, J.; Wang, X. Multi-objective optimization of processes for self-lubricating coating by laser cladding based on EWM-AMPSO algorithm and performance research. J. Mater. Sci. 2024, 59, 4000–4018. [Google Scholar] [CrossRef]
- Wang, Q.; Shi, J.; Zhang, L.; Tsutsumi, S.; Feng, J.; Ma, N. Impacts of laser cladding residual stress and material properties of functionally graded layers on titanium alloy sheet. Addit. Manuf. 2020, 35, 101303. [Google Scholar] [CrossRef]
- Tamanna, N.; Kabir, I.R.; Naher, S. Thermo-mechanical modelling to evaluate residual stress and material compatibility of laser cladding process depositing similar and dissimilar material on Ti6Al4V alloy. Therm. Sci. Eng. Prog. 2022, 31, 101283. [Google Scholar] [CrossRef]
- Xue, Z.; Xu, L.; Chen, Z.; Sun, Y.; Zhao, L.; Hao, K.; Han, Y. Formation optimization of downward overlaid Inconel 625 on curved surface of X65 pipeline basing on dynamic behavior of molten pool. J. Mater. Res. Technol. 2023, 25, 6356–6368. [Google Scholar] [CrossRef]
- Wang, X.; Sun, W.; Chen, Y.; Zhang, J.; Huang, Y.; Huang, H. Research on trajectory planning of complex curved surface parts by laser cladding remanufacturing. Int. J. Adv. Manuf. Technol. 2018, 96, 2397–2406. [Google Scholar] [CrossRef]
- Sun, S.; Wang, J.; Xu, J.; Cheng, X.; Jing, C.; Chen, Z.; Ru, H.; Liu, Y.; Jiao, J. Preparing WC-Ni coatings with laser cladding technology: A review. Mater. Today Commun. 2023, 37, 106939. [Google Scholar] [CrossRef]
- Gao, J.; Wu, C.; Hao, Y.; Xu, X.; Guo, L. Numerical simulation and experimental investigation on three-dimensional modelling of single-track geometry and temperature evolution by laser cladding. Opt. Laser Technol. 2020, 129, 106287. [Google Scholar] [CrossRef]
- Mousa, M.; Osman, H.; Azab, A.; El-Gaddar, A.; Baki, F. Characterization of laser cladding functional coatings: An in-situ monitoring and variability analysis approach. Int. J. Adv. Manuf. Technol. 2024, 133, 1155–1183. [Google Scholar] [CrossRef]
- Nie, B.; Xue, Y.; Wang, X.; Ding, Y.; Fu, K.; Zhong, C.; Gui, W.; Luan, B. On the elemental segregation and melt flow behavior of pure copper laser cladding. Surf. Coatings Technol. 2023, 452, 129085. [Google Scholar] [CrossRef]
- Yao, F.P.; Fang, L.J. Thermal Stress Cycle Simulation in Laser Cladding Process of Ni-Based Coating on H13 Steel. Coatings 2021, 11, 203. [Google Scholar] [CrossRef]
- Xi, W.; Song, B.; Sun, Z.; Ma, Z.; Yu, T.; Wang, J. Effect of remelting power and remelting time on the morphological characteristics and mechanical properties of Fe-based clad layer. Opt. Lasers Eng. 2023, 161, 107330. [Google Scholar] [CrossRef]
- Liu, Y.; Li, C.-X.; Huang, X.-F.; Zhang, H.-Y.; Li, C.-J. Investigation on solidification structure and temperature field with novel processing of synchronous powder-feeding underwater laser cladding. J. Mech. Work. Technol. 2021, 296, 117166. [Google Scholar] [CrossRef]
- Chen, L.; Zhao, Y.; Song, B.; Yu, T.; Liu, Z. Modeling and simulation of 3D geometry prediction and dynamic solidification behavior of Fe -based coatings by laser cladding. Opt. Laser Technol. 2021, 139, 107009. [Google Scholar] [CrossRef]
- Li, C.; Yu, Z.; Gao, J.; Zhao, J.; Han, X. Numerical simulation and experimental study of cladding Fe60 on an ASTM 1045 substrate by laser cladding. Surf. Coatings Technol. 2019, 357, 965–977. [Google Scholar] [CrossRef]
- Wu, S.; Liu, Z.; Gong, Y.; Liang, X.; Wu, Y.; Zhao, X. Analysis of the sequentially coupled thermal-mechanical and cladding geometry of a Ni60A-25 %WC laser cladding composite coating. Opt. Laser Technol. 2023, 167, 109595. [Google Scholar] [CrossRef]
- Etsion, I. State of the art in laser surface texturing. J. Tribol. 2005, 127, 248–253. [Google Scholar] [CrossRef]
- Yin, B.F.; Li, X.D.; Fu, Y.H.; Yun, W. Research on Tribological Performance of Cylinder Liner by Micro-Laser Surface Texturing. Adv. Sci. Lett. 2011, 4, 1318–1324. [Google Scholar] [CrossRef]
- Gan, Z.; Yu, G.; He, X.; Li, S. Numerical simulation of thermal behavior and multicomponent mass transfer in direct laser deposition of Co-base alloy on steel. Int. J. Heat Mass Transf. 2017, 104, 28–38. [Google Scholar] [CrossRef]
- Yan, S.; Meng, Z.; Chen, B.; Tan, C.; Song, X.; Wang, G. Prediction of temperature field and residual stress of oscillation laser welding of 316LN stainless steelOpt. Laser Technol. 2022, 145, 107493. [Google Scholar] [CrossRef]
- Youssef, D.; Hassab-Elnaby, S.; Al-Sayed, S.R. New 3D model for accurate prediction of thermal and microstructure evolution of laser powder cladding of Ti6Al4V alloy. Alex. Eng. J. 2022, 61, 4137–4158. [Google Scholar] [CrossRef]
- Luo, D.; Liu, C.; Wang, C.; Wang, Y.; Wang, X.; Zhao, J.; Jiang, S. Optimization of multilayer laser cladding process parameters based on NSGA-II-MOPSO algorithm. Opt. Laser Technol. 2024, 176, 111025. [Google Scholar] [CrossRef]
- Hulka, I.; Uțu, I.D.; Avram, D.; Dan, M.L.; Pascu, A.; Stanciu, E.M.; Roată, I.C. Influence of the Laser Cladding Parameters on the Morphology, Wear and Corrosion Resistance of WC-Co/NiCrBSi Composite Coatings. Materials 2021, 14, 5583. [Google Scholar] [CrossRef] [PubMed]
- Liu, Y.; Li, Q.; Ren, Z.; Jiang, Z.; Luo, H.; Zhang, X. Effect of Process Parameters on Stress Field of Laser Additive Manufacturing. Machines 2022, 10, 1197. [Google Scholar] [CrossRef]
- Chai, Q.; Fang, C.; Hu, J.; Xing, Y.; Huang, D. Cellular automaton model for the simulation of laser cladding profile of metal alloys. Mater. Des. 2020, 195, 109033. [Google Scholar] [CrossRef]
Disclaimer/Publisher’s Note: The statements, opinions and data contained in all publications are solely those of the individual author(s) and contributor(s) and not of MDPI and/or the editor(s). MDPI and/or the editor(s) disclaim responsibility for any injury to people or property resulting from any ideas, methods, instructions or products referred to in the content. |
© 2025 by the authors. Licensee MDPI, Basel, Switzerland. This article is an open access article distributed under the terms and conditions of the Creative Commons Attribution (CC BY) license (https://creativecommons.org/licenses/by/4.0/).