Article

Challenges in Resolubilisation of Rare Earth Oxalate Precipitates Using EDTA

by
Mark Stephen Henderson
,
Laurence Gerald Dyer
* and
Bogale Tadesse
Metallurgical Engineering, Western Australian School of Mines: Minerals, Energy and Chemical Engineering, Curtin University, Locked Bag 30, Kalgoorlie, WA 6432, Australia
*
Author to whom correspondence should be addressed.
Crystals 2025, 15(2), 103; https://doi.org/10.3390/cryst15020103
Submission received: 19 December 2024 / Revised: 9 January 2025 / Accepted: 14 January 2025 / Published: 21 January 2025
(This article belongs to the Special Issue Crystallization and Purification)

Abstract

:
The two-stage process for the treatment of rare earth phosphate minerals, involving an oxalic acid conversion leach and subsequent EDTA dissolution, has been demonstrated as a promising alternative to conventional extraction methods. To underpin a more detailed understanding, this work serves to further develop knowledge of the linkage between the stages and key practical aspects of the operation of the EDTA dissolution. A more detailed treatment of the phenomena observed in the EDTA treatment, characteristics of the solids, mass loss in dissolution, and the impact of parameter alterations in both stages provide greater holistic knowledge of the proposed flowsheet and considerations that will need to be addressed when increasing scale. Acid production (indicated by a pH decrease) in the EDTA dissolution stage was shown to be a feature of the reaction and not of residual acid associated with the solids from the oxalic acid stage. The consistency with which the rare earths were dissolved with respect to the phosphorus provided greater confidence that Nd and Pr (greater dissolution than P) are recovered at a higher efficiency than Ce and La (poorer dissolution than P). This was only not the case at high solids loading across both tests, leading to both oxalate and EDTA-deficient systems, respectively. Under high conversion conditions, it was demonstrated that Nd and Pr recoveries into solution approaching 70% were achieved. This equated to in excess of 17 gL−1 of total rare earths in solution. Solid/liquid separation was shown to be a significant challenge, created by both the fine particle size distribution of the leached residue and the dispersant nature of EDTA.

1. Introduction

Rare earth elements (REE) contained in phosphate mineralisation, specifically a monazite, are amenable to attack by organic acids [1]. Oxalic acid showed considerable promise with the release of the contained rare earth values, which, due to the presence of oxalate, precipitated as insoluble REE oxalates. This presents opportunities for reduced safety risks and energy consumption, as the processing can be completed at lower temperatures than conventional processing, where high-temperature acid or alkaline conditions are employed.
The REE precipitate is amenable to redissolution with several reagents, with ethylene-diamine-tetra acetic acid (EDTA) at elevated pH indicated as a favoured option [2]. Investigations are underway to identify the nature, rate, and extent of reactions, to generate greater insight into the various parameters that influence results, and to establish a detailed understanding of various process steps for achieving acceptable REE recovery using the proposed processing. This information provides a basis for establishing the unit operations necessary, thus allowing the definition of a flowsheet sufficiently developed to be used in piloting campaigns where technical and economic merit can then be assessed.
Results in previous work led to observations that the extent of REE release in EDTA contacting was relatable to the extent of phosphorus dissolution in the oxalic acid treatment step. The first processing step relies on a reaction in which oxalic acid attacks the mineral phosphate with released REE, then forming insoluble oxalates that deport with the residue.
2REPO4 (s) + 3H2C2O4 (aq) → RE2(C2O4)3 (s) + 2H3PO4 (aq)
After oxalic acid leaching of concentrate and subsequent separation of liquid from solids, EDTA treatment of residue results in solubilisation of REE through chelation. Advances in oxalic acid pretreatment are detailed in other works [3], demonstrating a more detailed relationship with conditions, leading to lower-than-expected optimal temperatures. This has also provided further understanding of the limitations of the conversion stage and options to maximise its efficacy or even introduce a level of selectivity.
EDTA is recognised as a strong chelation reagent, with capabilities in soil remediation endeavours with water-soluble complex formation allowing solubilisation and removal of heavy metals being described [4]. Similar mobility enhancement is indicated for EDTA and radioactive wastes [5]. EDTA solubility in water is, however, pH dependent and necessarily alkaline, with a pH of 8 or above required [6].
Complex formation through chelation is proposed to follow a one-to-one complexing reaction with various divalent and trivalent metal ions, cited as well established for complexometric titration evaluations [7]. One-to-one and one-to-two ratios are described for the EDTA complexing reaction for tetravalent thorium [8].
REE in the form of valence three ions purportedly offer up hydrogen ions in complex formation. The reaction thus results in pH changes towards acidic conditions.
C10H16N2O8 + M3+ → MC10H14N2O8 + 3H+
A theoretical study of actinide and lanthanide elements describes a similar one-to-one molar ratio for europium and tri-valent actinides [9] and further indicates the importance of pH in defining the stability of the EDTA lanthanide complexes, which were described as becoming less stable as pH decreased. Another theoretical study also predicted reducing stability for lanthanide EDTA complexes with reducing pH in the range from 11 down to approximately 7 [10].
A primary aim of this EDTA test work was to reaffirm the inter-relationship between phosphorus release to solution by oxalic acid treatment and the extent of recovery of REE to solution by EDTA. Recoveries of lanthanum, cerium, praseodymium, and neodymium, the main REE components in the monazite concentrate, were studied.
A further objective was to review contacting duration requirements, believed to be in the order of a few minutes, as necessary for the development of unit process design parameters. In previous work, the highest concentrations of REE in solution were shown after one hour of EDTA contacting [2]. An implication was that the REE solubilisation reactions had occurred within the first hour, potentially within minutes, or even instantaneously. A report describing subsequent testing suggested REE and EDTA reactions only require a few minutes for effective REE dissolution [11].
Another objective was to develop a greater appreciation of the reactions occurring and reagent usage as required for flowsheet definition. Testing also evaluated the effectiveness of the EDTA step in terms of REE dissolution with and without prior oxalic acid treatment. Previously indicated findings were that REE dissolution in EDTA is proportional to phosphate release by oxalic acid.
The prior oxalic acid treatment solubilised significant amounts of iron, which was expected to be predominantly from goethite. The formation of soluble ferric oxalate complexes was implied [3]. These should be isolated to the filtrate from the oxalic acid step and thus should not be present in significant amounts in the residue introduced to the EDTA treatment step. However, significant unreacted iron oxides remain in the oxalic acid leach residue, and these components are included in the solids sent through to the EDTA treatment [2]. This earlier work also identified that iron was not solubilised to any significant extent by the EDTA treatment. This implies iron oxides remained inert to the EDTA at the pH conditions used.
Ferrous oxalate, unlike the ferric complex, is recognised as insoluble [12]. Hence, ferrous oxalate, if present, may report to oxalic acid leach residue that then feeds to the EDTA step. Both ferric and ferrous ions reportedly form complexes with EDTA [6,13,14]. The lack of solubilisation suggests neither ferric nor ferrous ions were available for complexing with EDTA in significant amounts.
Efforts were also directed at obtaining mass balances that could be used for defining other operational parameters for use in larger-scale testing. The next proposed processing step, production of REE oxide by elevation of pH of the REE-bearing EDTA solution and thermal treatment, was not attempted.

2. Experimental

2.1. Solids Treated

The initial concentrate was the same as used previously [1,3,15]. This was to provide some continuity between experimental campaigns and provide a consistent feed material for results assessment. Concentrate grades, as required for calculating percentage extractions, were determined by XRF analysis. Solids analyses were erratic on occasion, and considerable difficulties were experienced in obtaining repeatable determinations using different methods or, in fact, even using one device. An influence from concentrate grade variability was suspected.
Example oxalic acid leach residue and EDTA residue analyses are also presented in Table 1, which provides the determined grades, with these determined using a Rigaku 200 Supermini XRF machine (Rigaku, Tokyo, Japan). Insufficient final EDTA residue materials were available for the completion of loss on ignition (LOI) determinations, so assumed values of 1 or 2 percent were applied for the XRF determinations.
Samples of initial concentrate and oxalic acid-leached residues were subject to particle size analysis using a Malvern 3000 Hydro EV machine (Malvern Panalytical, Malvern, UK) as reported previously [3]. These confirmed the fine particle size nature of the concentrate material and showed changes to an even finer material after the oxalic acid leaching, with this feeding to the EDTA contacting. A growing presence of sub 1 µm material was identified, and significantly more material less than 10 µm was present. P80 changed from 75 to 47 µm.
XRD analyses of various solids, including initial concentrate, oxalic acid-leached residues, EDTA-treated final residues, and precipitated REE oxalates, were also carried out. These analyses were performed using an Olympus BTX 513 XRD machine (Olympus IMS, Waltham, MA, USA). Diffractograms were interpreted using XPowder Ver. 2010.01.35 PRO software.
Several samples were also submitted to the John de Laeter Centre at Curtin University Bentley Campus for analysis using TIMA and SEM techniques as described and presented previously [3].

2.2. Treatment with EDTA

EDTA experiments were conducted at ambient conditions using 100 mL beakers on a magnetic stirrer. Approximately 5 g samples of solids, weighed on a Sartorius 1207 MP2 scale (Gemini BV Apeldoorn, The Netherlands), were introduced to 50 mL of EDTA, volume adjudged using a measuring cylinder, thus typically a nominal 100 g/L solids loading.
Reagent solutions were prepared with agitation to promote dissolution provided by a magnetic stirrer. The EDTA solution was prepared with reagent-grade disodium EDTA added to deionised water that was brought to approximately pH 10 using 1 M sodium hydroxide. EDTA concentrations of 0.1 M and 0.2 M were tested. Approximately 1 M sodium hydroxide was prepared by adding reagent-grade pellets to deionised water.
Slurry pH measurements were taken using a TPS WP-80 pH meter with an Ionode Model IJ 44A probe (Ionode Electrode, Queensland, Australia). Commercial buffer solutions at pH 4.01 and 7.00 supplied by TPS (Brisbane, Australia) with the meter were used for calibration, along with a Labserve Buffer 10.0 solution, which was used for the higher pH levels in this work. Measurements were taken by immersing the bulb of the probe directly in the slurry.
Oxidation potentials were also measured at various stages using the TPS WP-80 pH meter (TPS, Brisbane, Australia) but with an Ionode Model IJ64 ORP probe (Ionode Electrode, Queensland, Australia) replacing the pH probe. The ORP probe was introduced to Zobel solution at 17 °C measuring approximately 230 mV (Ag/AgCl), providing a reasonable correlation to expected values.

2.3. Solid-Liquid Separation

The separation of mineral solids from EDTA-contacting solutions presented significant challenges resulting from poor settling and filtration characteristics. Several gravity and vacuum filter arrangements with various filter papers, filter membranes, and pre-filters were used. This included Whatman No. 1 and No. 2 filter papers (Whatman plc, Buckinghamshire, UK) graded at 11 µm and 8 µm, respectively; Filterbrand Q5 filter paper graded at 2 to 5 µm; and Millipore membranes graded to 0.8 µm. Glass fibre pre-filters were used in some instances, but this interfered with mass collection as the glass decomposed in the alkaline environment, becoming inseparable from the mineral residue. Where necessary to obtain mineral solids-free filtrate samples, particularly during wash evaluations, use was made of Fisherbrand PVDF 0.22 µm and 0.45 µm syringe filters (Fisher Scientific, Waltham, MA, USA).
Laboratory-scale centrifuging was also explored for separation of solids from liquid using a Sanyo Centaur 2 centrifuge operated at 3300 RPM (Sanyo, Nagano, Japan). This was used for an EDTA slurry and for an EDTA wash filtrate. The method proved unsuccessful in both attempts even though centrifuging is touted as an ultra-filtration technique. All decanted centrifuged solutions had a reddish-brown colouration, and sedimentation occurred upon standing. Difficulties in retrieving the solids from the tubes made this method an unlikely option for this flowsheet development work given the desire for quantitative solids recovery for mass balancing purposes. Hence, centrifuging remained a curiosity and was not explored further.
Flocculation, typically used in industry for solids from solution separation applications, offers the opportunity for bringing dispersed solids together, to form flocs that clump together increasing apparent particle size, thus aiding subsequent settling and filtration [16]. To this end, three different flocculant reagents were tested. This included anionic, non-ionic, and cationic flocculants supplied by SNF Australia.

2.4. Sample Labelling

Sample labelling allowed different test parameters and conditions to be identified. The labelling rationale was as follows. C signified a concentrate sample was used, with the following number identifying the oxalic acid leach test number. F signified feed concentrate sample with the preceding number corresponding to the oxalic acid leach and thus timing when the feed sample was taken. Thus, C6F signifies a concentrate sample taken at the same time as the oxalic acid leach Test C6 was carried out. R was used to indicate the residue was subject to additional washing steps, with the R labelling immediately following the oxalic acid test number indicating the specific oxalic acid leach residue that was subject to rewashing with deionised water prior to EDTA contacting.
Six different approaches to the EDTA contacting or the following residue recovery steps were used. These were identified as follows. E signifies an EDTA test relating to the identified oxalic acid leach residue. The subsequent number ascribed signifies the type of additional treatment.
  • 1—initial trials, pH not controlled, Whatman filter papers, 0.1 M EDTA;
  • 2—Millipore 0.8 µm membranes, 0.1 M EDTA;
  • 3—Millipore membranes and pre-filter, 0.2 M EDTA;
  • 4—as for 3, also with 0.015 percent cationic flocculant at approximately 100 g/t dosing;
  • 5—excessive flocculant using 0.25 percent cationic flocculant;
  • 6—approximately 100 g/t cationic flocculant, floc added to wash water, varied filtration.
The W labelling after E numbering signifies a wash filtrate obtained from a wash step after EDTA treatment. Hence C4E6W2 indicates wash filtrate collected from the second wash during filtration of EDTA-treated residue, where approximately 100 g/t cationic flocculant was used with the addition to the slurry immediately prior to filtration to assist settling and filtration, which was added to the wash water at the same dosing to minimise fines transport through the filter media, with the source of the feed material for EDTA treatment originating as residue from oxalic acid leaching in Test C4.
The A symbol signified a neat solution from testing after solids from liquid separation. This was for primary filtrate prior to any dilution step. This symbol fell away for the diluted sample. Hence Test C1E1A indicated neat filtrate from EDTA treatment of oxalic acid leach residue from Test C9. This was reduced to C1E1 for the diluted sample sent to analysis. This option was used to simplify the recording of sample information for analysis purposes.
On rare occasions, a B symbol was used when a second dilution was carried out, either to a different dilution factor, with a different diluent, or after a different time interval. Here, for example, an A sample could be taken and immediately diluted, while a B sample dilution was completed several hours or even days later. This checked the repeatability of dilution and also allowed investigation of the impact of leaving a sample to stand before dilution. The meaning of the use of this B symbol is described for the specific test where it was used.

2.5. Solution Analysis

Diluted solution samples were submitted for chemical analyses. These analyses for a range of elements, including phosphorus, iron, lanthanum, cerium, neodymium, praseodymium, and thorium, along with aluminium, calcium, and magnesium, were completed using Inductively Coupled Plasma (ICP) Optical Emission Spectrometry (OES), with these ICP-OES analyses carried out with an Agilent 5100 Synchronous Vertical View machine (Agilent Technologies, Santa Clara, CA, USA).

3. Results and Discussions

3.1. EDTA Treatment Results

An aim of this work was to confirm the relationship between phosphate dissolution in oxalic acid and the extent of REE dissolution in EDTA. The duration of contacting the solids with EDTA was also examined, and further testing was conducted over periods varying from 15 to 30 min. Another aim was to develop a greater appreciation of the reactions occurring and reagent usage, again as required for flowsheet definition.
In the first instance, a one-for-one molar requirement for EDTA complexes and chelate formation with the precipitated REE was assumed [13]. The feed phosphorus content based on XRF analysis results obtained in previous endeavours was also employed (recognised in subsequent solids analyses to reflect low neodymium content). An expected extent of release from phosphate mineralisation as indicated by phosphorus dissolution in oxalic acid treatment at 50 percent was also applied.
On this basis and using Reaction (1), it was predicted that 0.1 M EDTA would provide an equimolar solution for solubilisation of REE content. This also assumed a one-for-one molar requirement for EDTA complex formation for cerium ion, which could be present in a tri- or tetravalent form, given that cerianite mineral, CeO2, has elsewhere been identified in the ore [17]. Hence, the testing was working with a deficit of EDTA.
The 0.1 M EDTA contacting was initially allowed to proceed for approximately 16 min, during which time slurry pH and Eh measurements were taken. Figure 1 summarises selected pH measurements from several tests. The pH measurements were taken within four 4 min periods. Time 0 was prior to the addition of the oxalic acid leach residue. The values shown at 4 min were taken during the period from 0 to 4 min, contributing to the variability in response observed. This measurement pattern was replicated for 4 to 8 min, 8 to 12 min, and 12 to 16 min. After 16 min, the pH had dropped to approximately 5.5 or 5.6 when treating these oxalic acid leach residues. The data also identifies the lack of response for concentrate samples not subjected to oxalic acid treatment.
Contacting concentrate with EDTA solution where this had not received prior oxalic acid treatment resulted in slurry pH exhibiting negligible change. Analytical results also indicated little REE solubilisation, with only minor amounts, at levels of a few ppm (less than 5), detected in solution, this implying the REE minerals remain unaffected by EDTA contacting without prior oxalic acid treatment.
Conversely, a significant slurry pH change was evident for the oxalic acid leach residues. Results stabilised with pH in the order of approximately 5.5 regardless of the extent of prior oxalic acid leaching. Inadequate washing of acidic components from the oxalic acid leach residue was initially suspected as a potential interference and a contributor to the observed pH decreases. Hence, rewashing of residue prior to EDTA treatment was carried out. This rewashing did not make an impact on this acidic final pH position in the EDTA. The pH change was normal behaviour conforming to expectations in terms of Reaction (2).
Oxidation potentials of the initial solutions and the various EDTA slurries were also measured, with these falling in a range from 220 to 450 mV (Ag/AgCl). Different Eh starting points were observed for each test. There was a trend of increasing Eh with test progression, but repeatable measurements were not achieved.
Of concern in these preliminary tests was the occurrence of precipitation of a white substance in filtrates of EDTA-contacted residues from the oxalic acid leaching tests. Initial filtrates free of mineral solids were typically a pale blue-grey but clouded on standing for several hours. Extensive precipitation occurred after several days. Precipitation was slow, with occurrence worsening as standing time increased.
This effect can be seen in the images presented in Figure 2, where the two images were taken after EDTA treatments yielding solutions C2E1A and C4E1A. The image on the left was taken on completion of Test C4E1, and solution C2E1A had been left standing for approximately one hour. The C2E1A solution was initially clear, the same as C4E1A, but subsequently became decidedly clouded. The image on the right was taken approximately three hours later, and both solutions were clouded.
Precipitation in primary filtrate had an adverse effect on REE concentrations and prevented assessment of the degree of release of REE in comparison with the extent of phosphorus dissolution in the oxalic acid leach step. In the first instance, and using analytical results with the highest recorded levels for a single-stage oxalic acid leach residue, concentrations of EDTA-soluble REE were roughly half of expected. The final pH values of the EDTA solutions were around 5.5, acidic, and at levels that will result in insoluble REE oxalates [2]. Precipitation worsened on further standing, so the reaction is slow.
Acidic solution conditions are the primary cause for the poor recovery of REE to solution, but it was also suspected that an inadequate availability of EDTA could have contributed to the poor response, in light of the low neodymium content analysis that was used as a basis for calculation and the potential presence of tetravalent cerium and the assumption of a one-to-one EDTA requirement that may have been inadequate.
Subsequently, 0.2 M EDTA concentrations were used, and these higher concentration solutions yielded greater REE solubilisation, less decrease in slurry pH, and could be used to achieve solubilisation without incurring significant precipitation issues. The first test utilising 0.2 M EDTA witnessed only a small pH decrease from 10.0 to 9.0 over the entire 30 min period while the formation of white precipitate did not occur. There was still no white precipitate in the primary filtrate two weeks later. An alkaline dilution was carried out with 0.5 M sodium hydroxide solution, thus achieving a clear diluted sample that was sent for analysis. This result supported the use of either higher initial EDTA concentrations, better control of solution pH levels, or utilisation of both these conditions.
Testing did not include an investigation of whether pH manipulation of the lower strength 0.1 M EDTA solution could achieve the required REE solubilisation, so reagent requirements for this oxalic acid-leached ore material remain to be optimised but fall in the range from 0.1 to 0.2 M for treating material at 100 g/L solids loading.
Care needs to be taken to maintain alkaline conditions. Any form of change to acidic conditions resulted in the formation of precipitates. Even dilution with deionised water proved inappropriate. Precipitates when formed were difficult to redissolve. A small amount of white precipitate collected by filtration of a diluted sample that was acidic was subjected to XRD analysis.
Results in Figure 3 depict diffraction patterns for a sample from the current work and a sample from a previous investigation where synthetic REE oxalate crystals were formed and analysed [2]. Similar diffraction patterns were realised, confirming REE oxalates reprecipitated where pH decreased to acidic conditions. Slight differences in the patterns are evident, and efforts to identify reasons that probably relate to differences in components present remain to be explored.
The threshold pH level for precipitation was not clearly defined. However, the main focus was determining the interrelationship between phosphorus dissolution in oxalic acid leaching and EDTA recovery of REE, and hence testing examined response where pH was adjusted to between 9 and 10, while alkaline dilutions were used in subsequent endeavours.
For the next set of experiments, 50 mL of 0.2 M EDTA was used to treat approximately 5.0 g of oxalic acid leach residues, with pH adjusted to 9.0 or above using 1 M sodium hydroxide. In these and the earlier tests, pH was seen to decrease, and the solubilisation reaction was not necessarily instantaneous. Sodium hydroxide additions were loosely consistent with different extents of phosphorus dissolution in the oxalic acid leach step, with the amounts added increasing as the extent of prior dissolution increased. The final pH in these tests was stable after 30 min, implying reactions were complete. Precipitates did not form during or after these tests where pH remained above 9.
Various flocculant trials pertaining to solids recovery were also completed after the contacting had finished. This was where the approximately 100 g/t dosing was indicated as adequate for minimising losses to filtrates and was adopted as the norm for further testing.
Aliquots of primary filtrates were taken for dilution, typically with sodium hydroxide solution made up to pH 10. In one instance, 0.5 M sodium hydroxide was used. Both options maintained solubility of the contained REE and avoided precipitate formation. The diluted solutions also remained stable. Dilution with pH 10 sodium hydroxide solution was used in subsequent testing as the norm.
Table 2 summarises select chemical analysis results embracing a range of elements. Significant calcium solubilisation occurred, along with extensive REE dissolution. It could be expected that oxalate also dissolved and entered solution, although this was not specifically tested or demonstrated. Iron and phosphorus were not solubilised to any significant extent, remaining at concentrations below 100 mg/L.
There was broad alignment across the results for specific oxalic acid leach residues. There were slight differences, with these extending to nearly 10 percent for one component, notably C9E3 and C9E6 for lanthanum. Typically, however, differences for the REE were less than 10 percent. These were raw data results with no correction for the small alkali and flocculant additions, which, once applied, should draw results into alignment.
A trend of increasing REE solubilisation with increased phosphorus dissolution in the preceding oxalic acid leach step was evident. Another important factor was highlighted in one test where sodium hydroxide solution was alkaline to pH 10 but without EDTA present. The lack of REE dissolution demonstrated that sodium hydroxide alone is not capable of effecting REE re-dissolution.
Aluminium and magnesium were both solubilised by the EDTA treatment. These were only present in minor amounts in the concentrate and oxalic acid leach residues. Solubilisation in the EDTA solution was extensive.
Another factor emerging from this EDTA experimentation was that allowing the sample to stand overnight when pH was over 9 did not suffer precipitation, and the solution remained stable. This was unlike the situation where pH had dropped to acidic conditions in the first series of EDTA tests and the solution was left to stand with extensive precipitate formation over a period of hours.
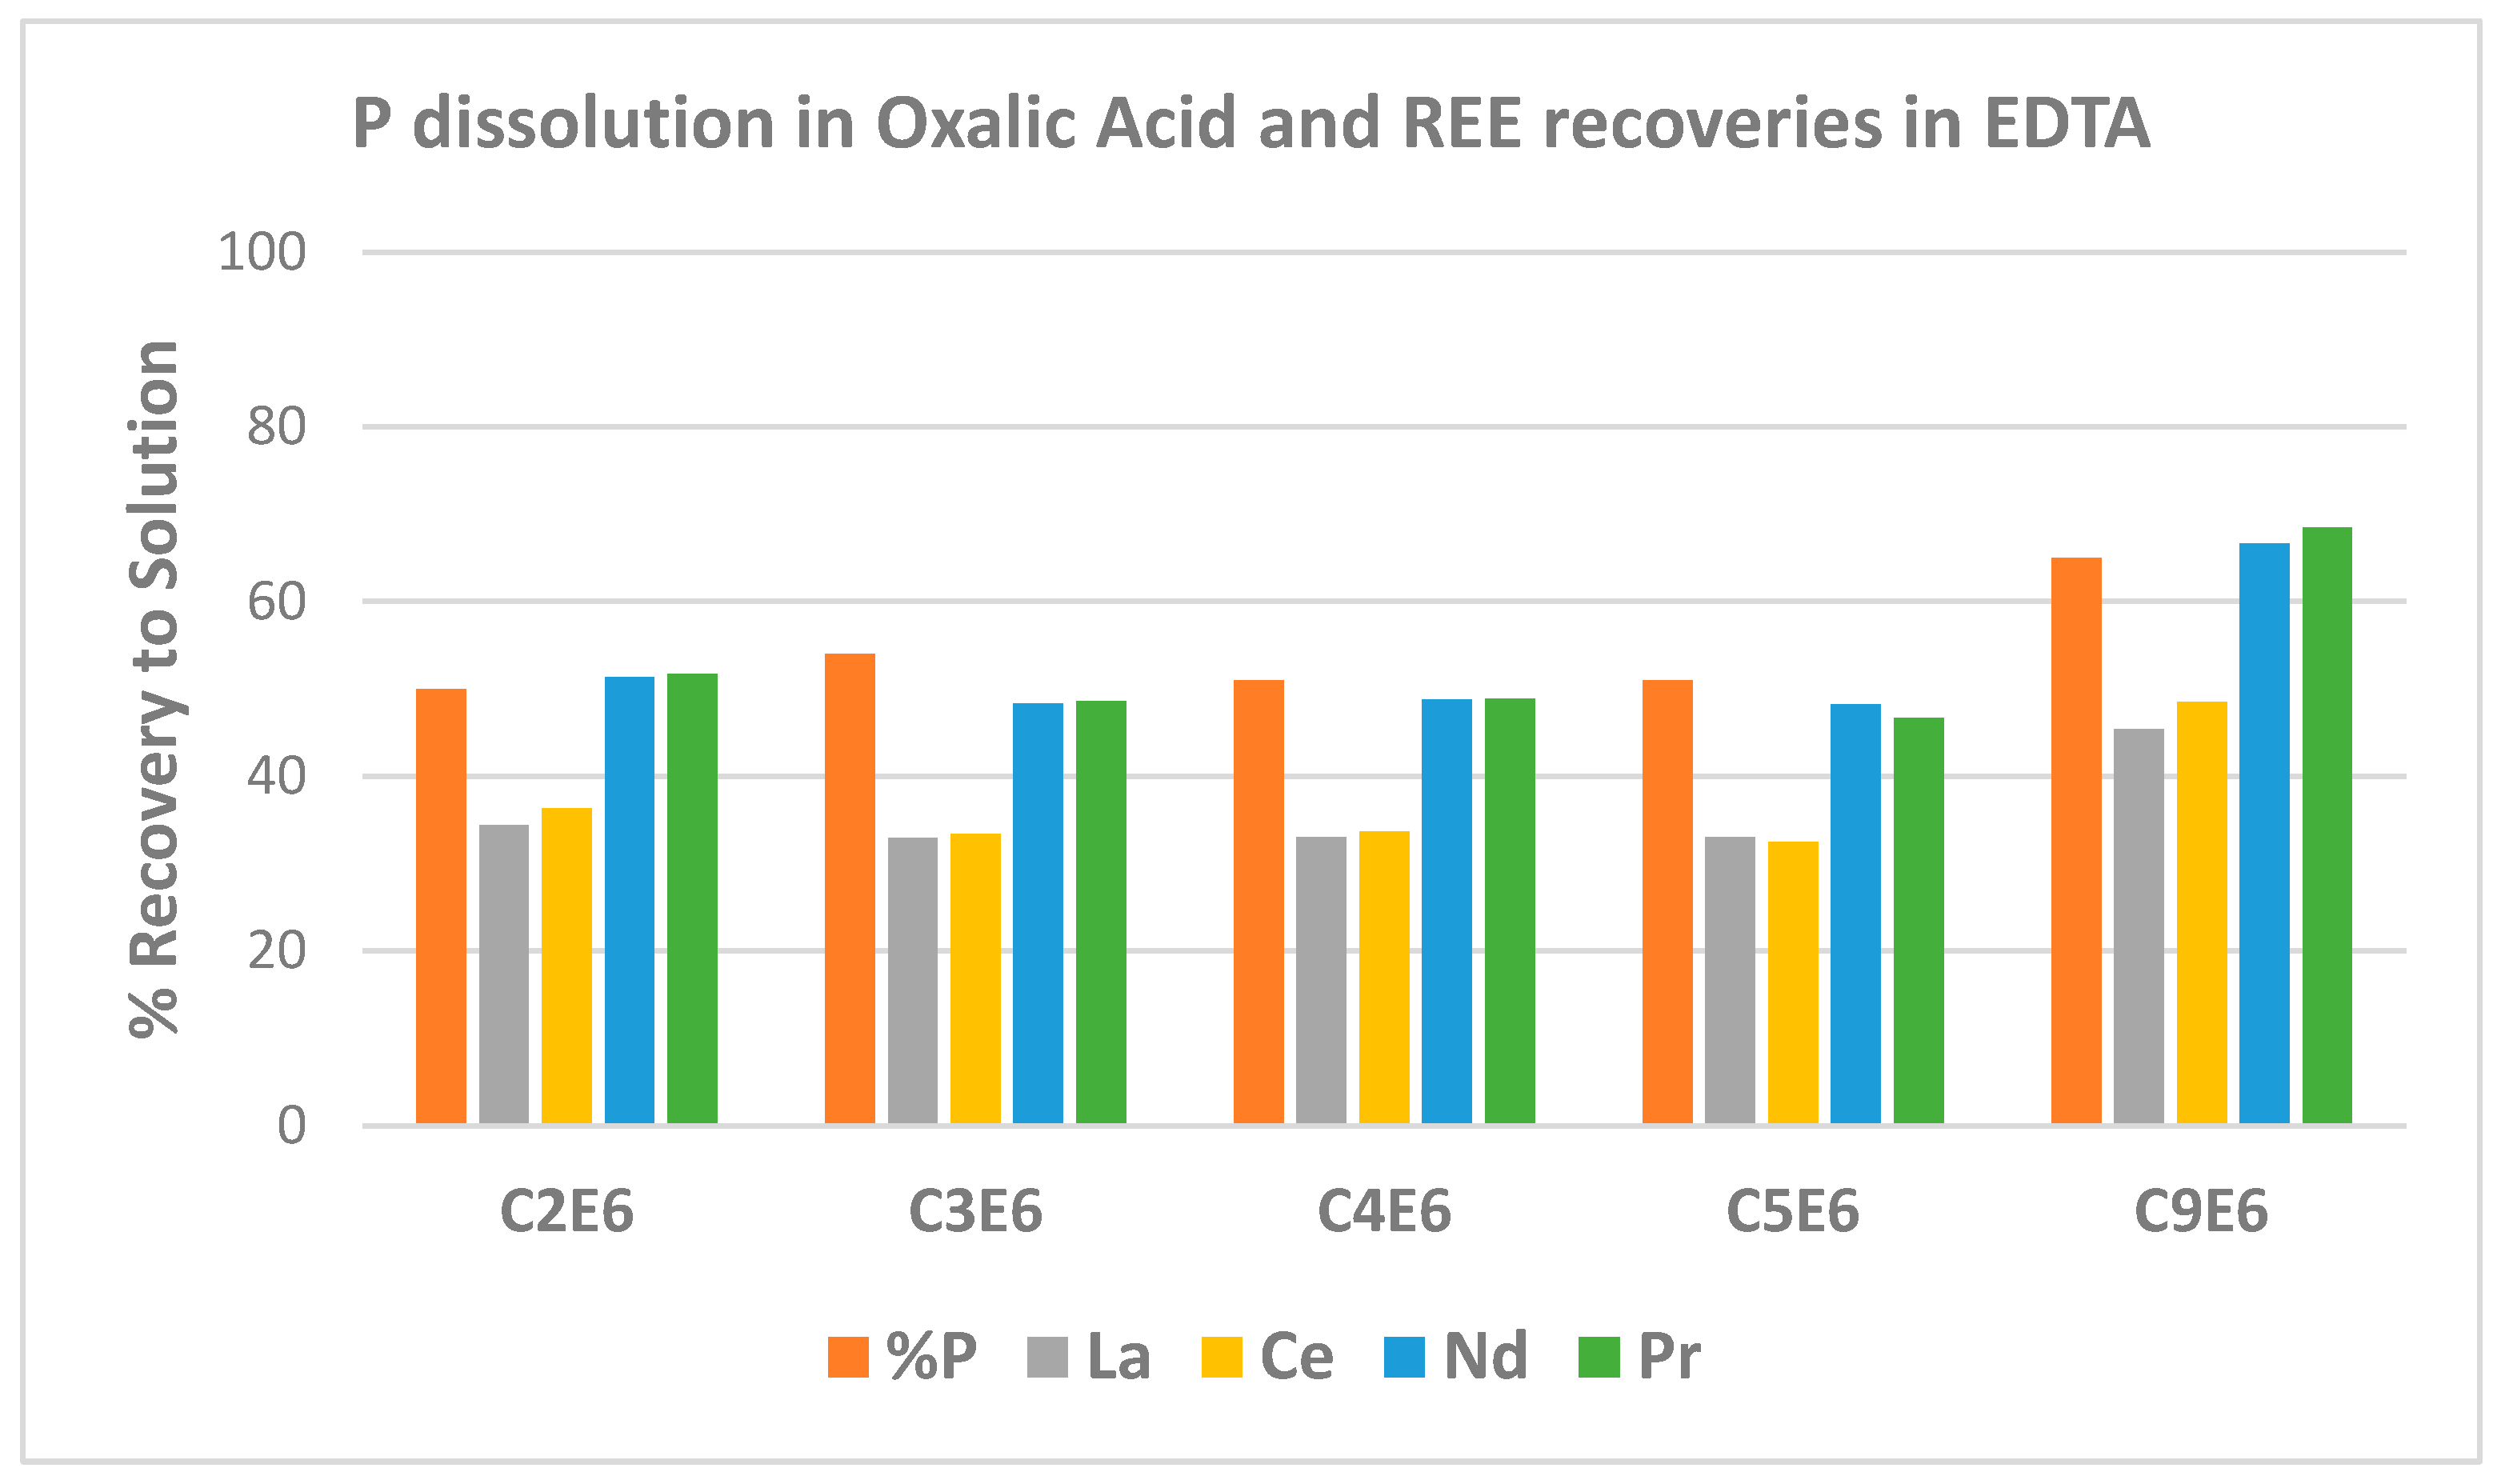
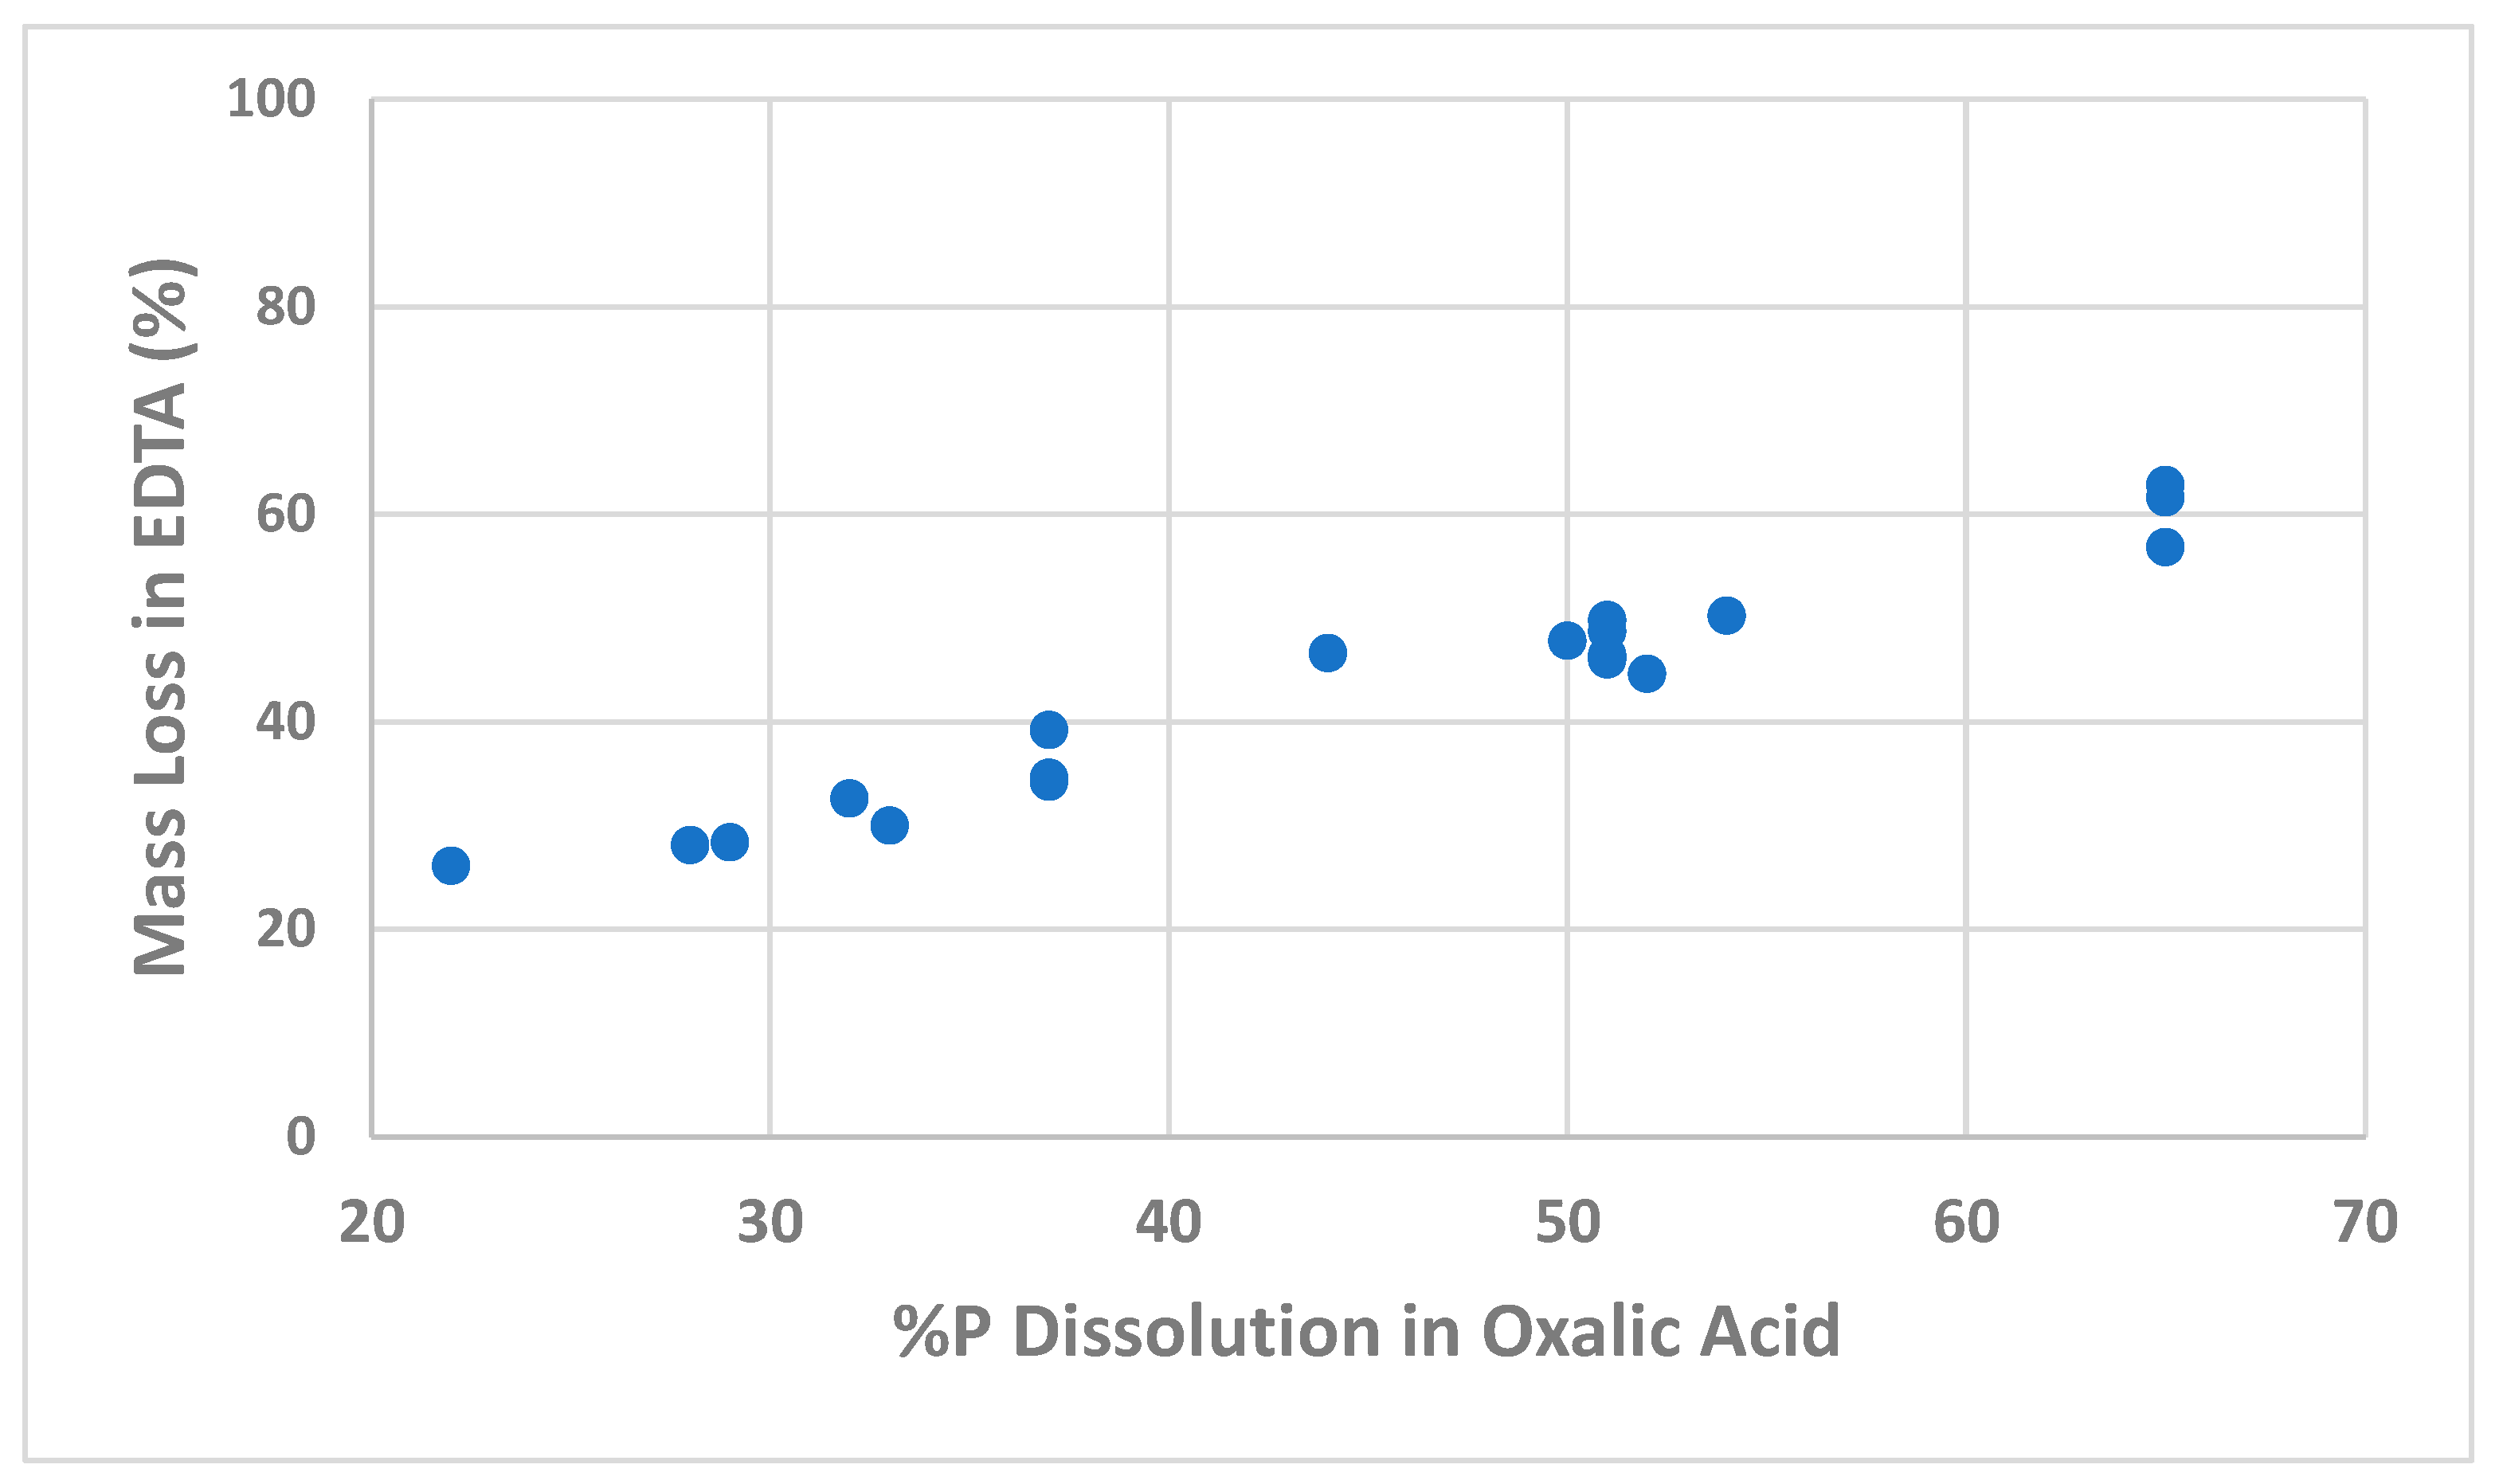
The percentage dissolution of REE and phosphorus achieved across the oxalic acid leach and EDTA treatment steps was calculated, with phosphorus dissolution occurring in oxalic acid and REE dissolving in EDTA. The values determined were based on the solids analyses shown above, where it must be acknowledged that considerable variability in determinations was experienced. However, noting these reservations, Figure 4 summarises some of the percentage dissolution results. The responses shown were achieved for oxalic acid leach residues where solids loadings of 100 g/L concentrate in oxalic acid were used.
Test C2 was carried out at 65 °C while the others were kept at 45 °C. Tests C3 and C4 were carried out over extended periods of 96 and 72 h, respectively, while Test C5 treated residue contacted with recycled oxalic acid, which was made up with oxalic acid reagent but where no attempt was made to remove phosphorus or iron from solution before it was reused. Test C9 results were after three stages of leaching with fresh oxalic acid used for each stage.
There were only minor differences in results across temperatures and residence times in the oxalic acid leaching in the temperature range from 45 °C to 65 °C, and a minimum of 24 h residence time was utilised. The only significant improvement was seen when a multi-stage treatment approach was utilised where fresh oxalic acid was introduced for each stage, as was the approach for Test C9.
On a molar basis, the amount of phosphorus dissolved by the oxalic acid leach step was typically calculated at levels more than the molar dissolution of the four REE in the EDTA contacting. The pH of the EDTA slurries was not returned to the original levels before introducing the oxalic acid leach residues, only being increased to above 9 and not brought back to 10. The amounts of alkali used were considerably less than the molar amounts of total REE dissolved in these tests. Alkali addition thus only provided no more than an indicator of performance. Hence, the extent of acid generation predicted by reaction 2 remains to be quantified.
Solids analyses were erratic on occasion, and repeatable results proved challenging. However, it is evident that REE solubilisation follows phosphorus dissolution relatively closely. The values determined do not entirely correspond, however, with less REE being solubilised. Leaching of other REE components such as samarium, europium, gadolinium, yttrium, and dysprosium remains to be investigated and will contribute to some extent. Yet another explanation is the presence of a phosphorus mineral low in REE content that also leaches in the oxalic acid. Apatite, or alumino-phosphate of low REE content, for instance, could fit this observation.
Neodymium and praseodymium recoveries were greater than the extent of phosphorus dissolution in oxalic acid, with the trade-off appearing to be less dissolution of lanthanum and cerium. This is likely beneficial given the higher values of the neodymium and praseodymium components. Again, caution is expressed in terms of using definitive statements regarding the extent of leaching given solids analysis challenges. However, results indicate selectivity for neodymium and praseodymium components could be engendered through appropriate selection of operating conditions in the oxalic acid leach step.
While not shown, thorium followed REE. However, actinide analysis is subject to further refinement in terms of repeatable and accurate analytical determinations for solids. Both thorium and uranium were present only at ppm levels and were thus subject to difficult analytical determinations. Analysis using ICP-MS techniques, which are reportedly sensitive to ppb levels, is currently under investigation.
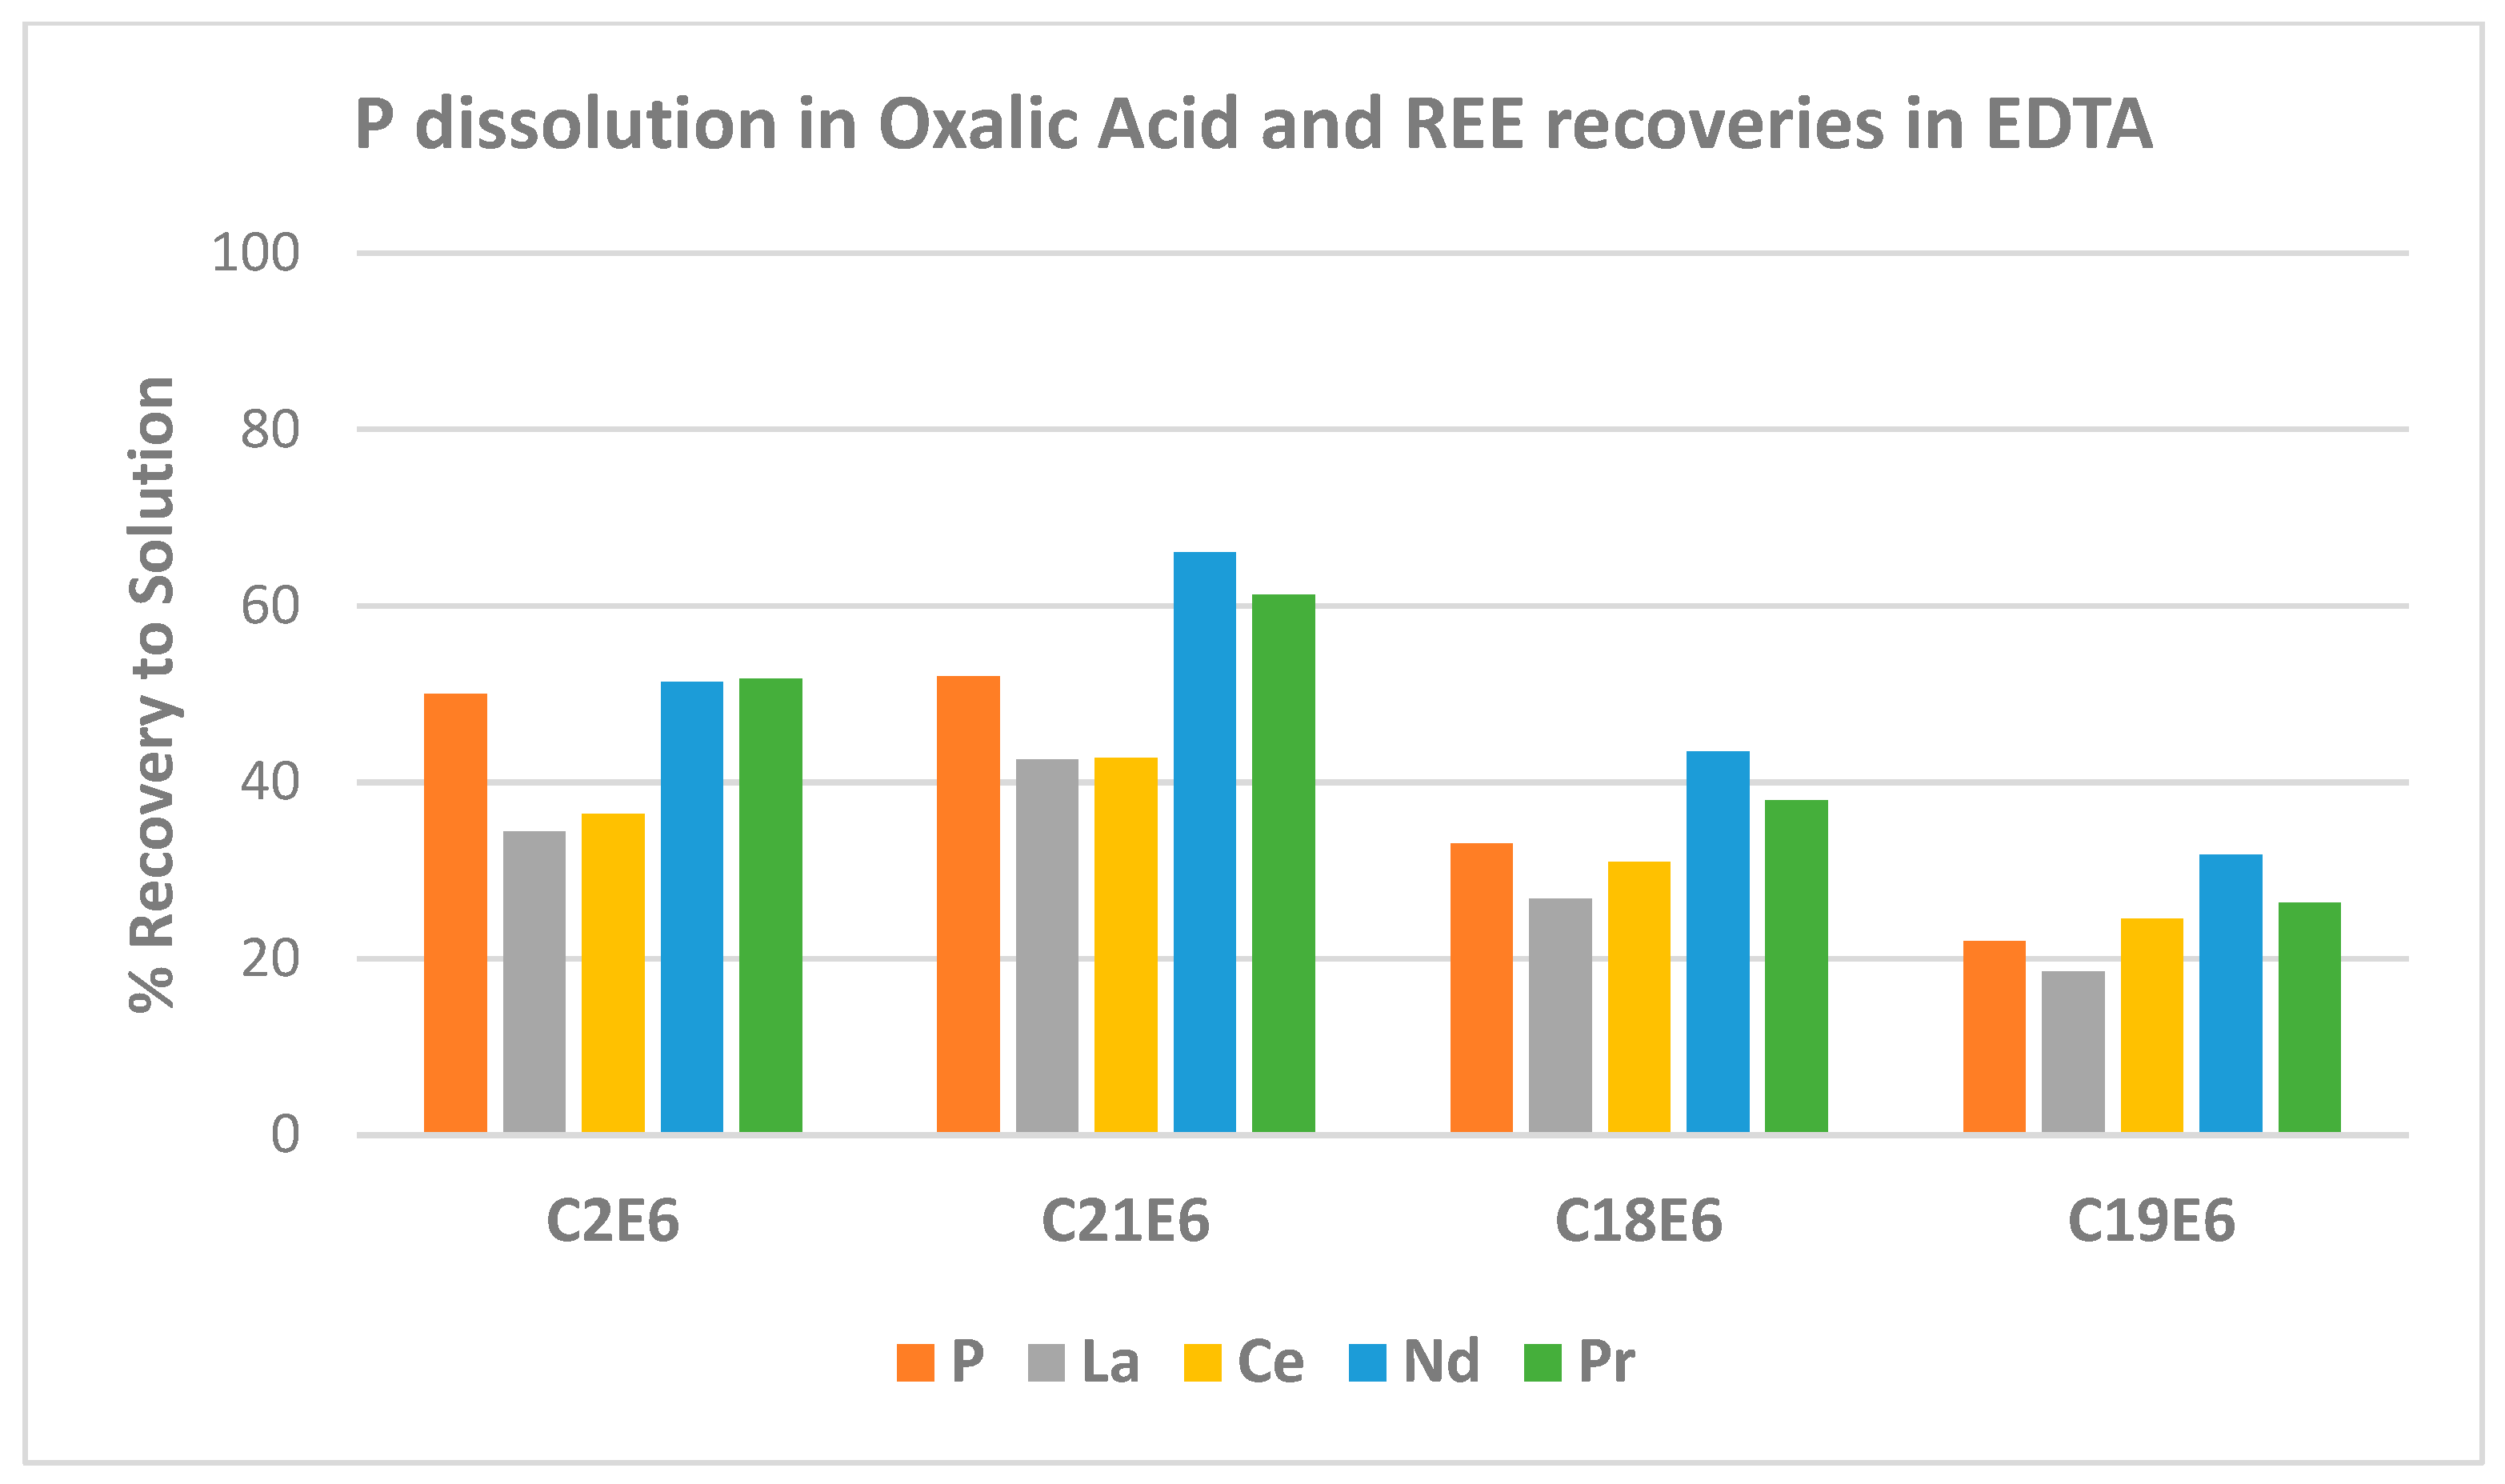
Solids loadings in the oxalic acid leach step had a noticeable effect on the recovery of REE in the EDTA step. Figure 5 summarises several results obtained, these at an oxalic acid leaching temperature of 65 °C. Both C2 and C21 were oxalic acid leaches carried out with solids loadings of 100 g/L. Test C2 was carried out over 24 h while the other tests were conducted over 48 h. The solids loading was increased to 200 and 300 g/L, respectively, for tests C18 and C19. The same trends were also evident in the curves generated for tests conducted at 45 °C and 55 °C that also examined the three solids loading scenarios.
The relative extent of release of phosphorus decreased significantly using the higher solids loadings of 200 and 300 g/L. This ties in with a limitation attributed to an oxalate availability issue during oxalic acid leaching [3]. In the high solids loading tests, less REE dissolution was effectively realised, aligning with reduced phosphorus release in the earlier oxalic acid leach step.
The extent of dissolution of REE in EDTA at the high solids loadings also follows the same pattern of greater solubilisation of neodymium and praseodymium as was seen at the 100 g/L solids loadings. The main difference was the diminishing returns for phosphorus solubilisation in oxalic acid and REE solubilisation in EDTA resulting from increasing the solids loading.
A significant finding was an improvement in REE solubilisation in EDTA in Test C21E6 than evident for Test C2E6. The oxalic acid leach in Test C21 included rod milling mid-test with the original solid and liquid components returned to the leach reactor for a further 24 h of leaching. There were insignificant differences between the two results in terms of phosphorus dissolution in the oxalic acid leach step. Phosphorus concentration after 24 h was 3.2 g/L in Test C2, increasing to 3.4 g/L in C21 after 48 h. This increase could be ascribed to the increased duration from 24 to 48 h. However, the REE appear more amenable to dissolution in EDTA with the milling step included. Neodymium and praseodymium dissolution in this EDTA treatment step nearly matched the dissolution achieved after three stages of oxalic acid in Test C9E6.
Replication of this milling step to ensure repeatability is required. However, the superior response after milling could evidence destruction of an ash layer build-up that passivated the mineral surface or release from material where different REE distributions exist in various size fractions that come into play through the milling. Differences in mineralogy and variations in the distribution of the REE in the monazite warrant further investigation.
XRD analyses of concentrate, oxalic acid leach residue, and final residue after EDTA contacting were also completed. A comparison of the diffractograms for these samples with the REE oxalate precipitate is shown in Figure 6. The peaks for various species at 2-theta angles have been identified: O noted for REE oxalate precipitate [1,2]; M for monazite; G for goethite; F against small peaks aligning with the presence of florencite; and U for an as-yet-unidentified species that appear associated with REE oxalates.
These diffractograms show that as the oxalic acid leach progresses, formation of REE oxalate occurs. The peaks for the REE oxalate then disappear in the EDTA contacting as expected with the resolubilisation of REE. A significant issue identified was that the final residue after the oxalic acid and EDTA treatment was indicated to contain significant monazite and goethite, with essentially the same peaks occurring as were found for the initial concentrate.
This was significant as it indicated only partial decomposition of the contained monazite. Hence, restricted phosphorus dissolution in the oxalic acid leaching does not appear to be due to the presence of a different type of REE-bearing mineralisation but simply monazite that remained unaffected by the oxalic acid leach.
Mineralogical phase identifications using TIMA and reported previously indicated monazites with at least two different signatures, one that appeared to preferentially leach while the other remained relatively inert. The disappearing “monazite” more susceptible to dissolution may have contained greater neodymium and praseodymium, which then led to elevated dissolution of these two elements. Continued phase identification and definitions of mineralogy to further explore this observation are warranted.
Washing of residue after the EDTA contact was also investigated. Table 3 presents select solution concentrations in wash solutions that were affected up to three times using sodium hydroxide at pH 10 and with cationic flocculant added to the wash solution to provide a constant flocculant dosing of approximately 100 g/t solids.
By the third wash, residual soluble REE species were typically removed to low levels, with these decreasing to approximately 3 percent or less of the concentrations present in the original primary filtrate. Of note was that concentrations in the third wash of the test, where excessive flocculant was used, contained the highest residual concentrations of the various elements. It was observed that greater solution entrainment as flocculant dosing increased, albeit to excessive levels, that then hindered removal during washing.
REE concentrations in the third wash solution were typically reduced to low levels. However, there was no specific measure of the possibility of a bypass occurring during the filtration, which could result in solution being retained with the solids and which was not effectively drawn or flushed from the solids in this wash process. Although reasonable evidence of effective washing exists, evaluation of washing from the perspective of ensuring pregnant solution was effectively removed from the solids in all cases still requires further experimentation.
While REE was removed, iron, phosphorus, and magnesium, at low levels in primary filtrate, may have been solubilised from the solids to a minor extent during the washing process. For example, in one test, neodymium was reduced from 3012 mg/L in primary filtrate to 1164 mg/L in the first wash, 75 mg/L in the second wash, and 10 mg/L in the third and final wash water. The iron concentrations for the same wash filtrates only dropped from 67 mg/L to 33 mg/L to 47 mg/L to 20 mg/L. Phosphorus concentrations increased in the first and second wash filtrates before reducing in the third wash filtrate. Magnesium concentrations hardly changed at all, although these were at low levels in all filtrates, primary as well as wash.
Adjustment of pH with 1 M sodium hydroxide was initially only carried out at varying intervals and with alkali addition only to the extent necessary for the slurry to remain above 9.0. Alkali additions were typically made from 5 to 15 min from the commencement of the test. Reduction of this reaction time was possible, and in the next series of tests, 0.5 M sodium hydroxide solution was used along with a goal to bring pH back close to the pH of the EDTA prior to the addition of ore.
In several tests, the sodium hydroxide to raise pH was added within 10 min, with pH remaining stable for the remainder of the 30 min test. One was even stable after 5 min. This confirms only short residence times are necessary for the solubilisation of REE.
A 30 min residence time is an overestimate, and it appears possible to safely reduce this to 10 min as a design parameter. However, testing is warranted, particularly the option of using an automated dosing system. Specifically, evaluation of continuous addition to evaluate further reduction in residence times should be attempted. Molar usage rates were not sufficiently distinct to allow comparison with the extent of solubilisation.
Further testing could also establish the lower pH limit where solubility decreases since careful pH control and adjustment will be necessary to ensure solubilisation of available REE. Another option, that of effecting separation of mineral solids from the EDTA solution, with this followed by the addition of oxalate and pH, decrease to promote precipitation as a potential solution cleaning step, not examined here, could also be explored to determine whether any benefits are available. This, however, does seem unlikely given the difficult filtration as well as difficult REE redissolution once the solution is returned to alkaline conditions.
The use of pH control during EDTA contacting using lower strength 0.1 M concentration EDTA could also be tested, thereby establishing requirements with greater certainty. Results did not clearly demonstrate a one-for-one molar ratio between REE content, EDTA, and alkali usage. In particular, the EDTA requirements for cerium, which can exist as a tetravalent species, remain to be established. Nevertheless, the use of excess EDTA, as used here with 0.2 M concentration, was successful. Hence, 0.2 M EDTA with pH adjusted to between 9 and 10 is regarded as suitable as design parameters, subject to further refinement.
While 1 M sodium hydroxide was used for pH adjustment, it remained to be seen whether this was the most suitable option. Sodium ions may influence behaviour across the entire leach system, and a sodium control mechanism will be needed. These factors will need investigation.

3.2. Mass Recoveries

Masses recovered from selected tests treating 5.0 g oxalic acid-leached residues are recorded in Table 4. The oxalic leach step was conducted at 45 °C with 100 g/L solids loadings. The exception was for Test C2E6, where feed material was treated in oxalic acid at 65 °C. Mass reductions were in accord with phosphorus dissolution responses in the prior oxalic acid leach step. Ultimately, mass changes due to REE oxalate dissolution into EDTA were in the order of up to 60 percent, not dissimilar to the extent of phosphorus released to solution in the oxalic acid leaching step.
Figure 7 provides a graphical representation of mass changes in the EDTA treatment as a function of phosphorus dissolution in the prior oxalic acid leaching step. The relationship between the two is confirmed with an almost direct correlation. The variability evident is expected to be due to mass recovery inefficiencies due to the difficult filtrations that were completed with only small amounts of material involved. Differences due to inconsistencies between phosphorus and REE contents released by the oxalic acid are not evident here and can only be expected to come into clear view with larger scales of operation.
Mass balances were attempted for some of the EDTA tests. Line entries in Table 5 show the mass input first in concentrate to oxalic acid, then the mass in one of the oxalic acid leach residue solids introduced to the EDTA step. Subsequent entries include the mass outputs in EDTA residue solids and in the final EDTA solution. These pertain to the three-stage oxalic acid leach test residue that was then subjected to EDTA treatment.
Neodymium is used as an example to clarify. The concentrate feed contained 309 mg, and the C9 residue held 302 mg, consistent with precipitation as insoluble oxalate. The C9E3 residue contained 102 mg, while the 206 mg in the final solution from the EDTA contacting yielded a total output of 308 mg of neodymium. The differences in the various steps were minor.
Results were also satisfactory for praseodymium. However, they were not as good for cerium or lanthanum, with errors in overall extraction from concentrate amounting to near 7 and 15 percent, respectively. These differences were expected to stem from variability in the various solids analyses.
Phosphorus and iron, where the combined output of C9E3 and solution should match the input introduced in C9, were of concern. Difficulties in solids analysis, as referred to above, were experienced with differences across different techniques identified. Specifically, the XRF results described here were identified as trending to under- and overestimation of phosphorus and iron, respectively.
Solids analyses require further investigation as repeatability was not ensured. Indeed, the same fused bead yielded different results in different XRF analysis exercises. This has played a role in the inaccuracies experienced. Calibration in a specifically developed program for the XRF machine has been identified as potentially offering at least a partial solution.
The actinides, results omitted from the table, are at low concentrations, borderline ppb levels, and are therefore not yet available given the analytical technique used. Magnesium in solids was also near the detection limit with levels less than 1 percent. Aluminium and calcium were also subject to considerable differences between input and output through EDTA treatment.
However, given this sensitivity to solids analyses, the data presented provides an acceptable understanding for allowing a flowsheet design to be taken to the next stage of development. Further testing will improve the mass balancing information.

3.3. Solid-Liquid Separation

Solids at times passed through the filter requiring recycling with filtrates returned to the filter several times before an accumulation of solids allowed a solids-free filtrate to be obtained. A significant impact on recovery was the loss of fines during the washing of solids. Typical practice in early tests was to rinse residual solids after EDTA contacting in the beaker into the filter and then wash the solids in the filter with deionised water. While collection of a primary filtrate that was free of mineral solids could be realised, when rinse and wash water was added, solids often started to pass through the filter paper, with a fine sediment subsequently observed in wash filtrates. In later tests, sodium hydroxide solution at pH 10 was more appropriately used for washing, with this also experiencing similar solids release.
EDTA is recognised as an anti-coagulant in medical applications [18]. Hence, dispersant properties could be expected, promoting dissociation of fine particles, and these smaller than the filter paper grading size were then free to pass through the filter papers. While it remained impossible to discern individual particles, often an apparent solution colour change from a reddish-brown to a pale blue-grey was accompanied by sedimentation for filtrates from EDTA treatment of oxalic acid-leached residues. This slow settling over periods ranging from days to weeks implies a colloidal nature, this in turn conforming to the presence of particles with sizes of 1 µm or less [19]. Sedimentation was in accord with the presence of fine particulate matter, not immediately observable, that simply passed through the filter paper [20].
Both cationic and non-ionic flocculants were able to induce settling of solids. Use of cationic flocculant allowed successful filtration with Whatman No. 1 and No. 2 filter papers in some instances. Flocculant strength ranging from 0.25 percent down to 0.015 percent solution was used. Dosage levels were excessive, typically over 100 g/t in most instances. Optimisation will be required to improve this to lower levels for commercial applications. On balance, however, flocculant use offered potential for obtaining mineral-free filtrates.
Occasionally in initial testing, mineral-solids-free primary filtrates could be obtained without using flocculant. However, this was typically for tests where solutions had become acidic and REE oxalate precipitation had occurred. The acidic conditions likely resulted in improved filtration performance, while the precipitate could have also provided some agglomeration behaviour, further promoting this performance.
Filtrations were typically completed using a 47 mm diameter Buchner funnel. Indicative filtration rates were between 0.3 and 1.0 L/min/m2 for the collection of primary filtrates using a filter membrane graded to 0.8 µm. Extremely slow filtering material was implied [21]. Filtration rates for EDTA alkaline slurries were essentially an order of magnitude slower than those pertaining to the recovery of oxalic acid leach residues [3]. Rates also deteriorated significantly during residue washing.
Testing also explored wash efficiencies after EDTA contact with cationic flocculant added to the wash water. This was relatively successful, with only minor concentrations of various elements detected in the final wash solutions. A three-wash protocol sufficed. Successfully used wash ratios for each wash cycle were approximately 20 percent of the primary filtrate volume. The addition of flocculant to wash solution prior to use stopped or at least limited the extent to which fines passed through the filter media on introduction of the wash water.
The first and second wash filtrates of the tests, including EDTA, were typically more laden with sedimentation than the primary filtrates and typically had a brown colouration. Filtrates from a third wash, where completed, typically had a pale brown colouration with trace or no sedimentation. Only one wash was completed for the solids from the test with pH 10 sodium hydroxide and no EDTA, and a mineral-solids-free wash filtrate was obtained, lending support to the claim of dispersant properties of EDTA.
An observation during these tests was the curling of the filter paper as the vacuum was disconnected and a lifting of the filter paper. In some instances, this lifting behaviour was even observed on the initial introduction of alkaline solution to the filter system. This lifting allowed passage of solids to filtrate by direct bypass, and along with the observed passage of fines through filter paper or membrane, contributed to the difficulties in obtaining comprehensive solids recovery from solution with conventional laboratory filtration equipment.
Another key factor was highlighted in the test with sodium hydroxide solution made alkaline to pH 10 but without EDTA present. The filtration was also problematic and difficult. Filter paper curling and lifting also occurred, and filtration rates remained slow. Difficult filtration of iron oxy hydroxide forms at elevated pH levels and ambient temperatures has been reported elsewhere [22]. This in turn aligns with the observed move away from alkaline systems for processing high-iron-content rare earth ore materials [23].
Difficulties in isolating and recovering residues after filtration led to the adoption of a method whereby the filter pot assembly with the filter paper or filter membrane and pre-filter in place was weighed before and after filtration, with the filter assembly allowed to dry at ambient conditions. While still relatively small at the laboratory scale of operation, losses may have a significant impact on mass balancing predictions. Passage of fines through the filter papers, which happened in most but not all experiments, was relatively restricted by using a cationic flocculant, with a loss of around 6 percent to primary filtrate indicated in one test.
Predictions of mass flows for developing a processing flowsheet using experimental mass recovery information should be satisfactory, provided loss occurrence is acknowledged. The determination of particle size of the feed to the EDTA system must be a reported parameter, while further testing should include an assessment of the extent of loss. In practice, it is conceivable that fines losses through the filter media over the entire filtration cycle will occur with the final loss outcome corresponding with the sub-size component of the ore feed material. A separation and recovery option to deal with this sub-size material will be required.
Fine solids lost may be of a somewhat different composition than the bulk of the slurry being filtered. Often, solids passing through filter media were typically of a paler colouration than the bulk solids. This may be consistent with losses of certain types of iron oxides, goethite as opposed to hematite or magnetite, for instance. It could also imply differences in REE phosphate content. Insufficient quantities of this type of material have been collected to date to allow characterisation, but this should be an area of further investigation.
Another factor observed during the filtrations was that the Erlenmeyer filter flask containing wash water often became cold to touch. In one test, the temperature of the wash filtrate, combined from three washes, dropped from 22 °C to 15 °C. The most likely cause was water evaporative cooling under vacuum, conditions which continued for considerable time.

4. Conclusions

Consistent demonstration of the linkage between phosphorus dissolution in oxalic acid and rare earth dissolution in EDTA allows for a level of predictability based on oxalate conversion. This, however, is currently only applicable to the sample of flotation concentrate used for this work. Other source materials with different mineralogical associations, (such as) higher apatite contents, would need their own level of calibration. The elevated Nd and Pr recoveries relative to La and Ce were also consistent across most tests. The exception was the high solids content tests that would be starved in oxalate, these displayed slightly different behaviour. However, mass balancing becomes even more difficult at higher solids loadings.
Excess EDTA and pH control were shown to be vital; these are required to ensure full solubilisation of the rare earth oxalate crystals. Excess EDTA not only provides a supply of reagent if additional complexation is required (higher than expected conversion or EDTA-soluble gangue) but also supports buffering against acid generation as part of the process. Where a high proportion of the solids are composed of re-precipitated oxalates, the acid generation potential is significant. This also suggests that operating at a pH above 10 may be beneficial to the stability of the system.
Mass losses demonstrated a strong relationship to rare earth recovery, which has not been tracked in previous works. These significant mass losses, in conjunction with fine initial particle sizes, variable morphology, and the dispersant nature of EDTA, were shown to lead to very poor solid/liquid separation characteristics. Multiple flocculants were tested with the cationic reagent, demonstrating promise. However, meaningful improvements in filtration only occurred with excessive dosage. This is a property of the system that will be vital to address in upscaling the process to avoid reagent and metal losses and improve the water balance.

Author Contributions

Conceptualization, M.S.H. and L.G.D.; methodology, M.S.H. and L.G.D.; validation, M.S.H., L.G.D. and B.T.; formal analysis, M.S.H.; investigation, M.S.H.; resources, L.G.D.; data curation, M.S.H.; writing—original draft preparation, M.S.H.; writing—review and editing, M.S.H., L.G.D. and B.T.; visualization, M.S.H. and B.T.; supervision, L.G.D. and B.T.; project administration, L.G.D.; funding acquisition, L.G.D. All authors have read and agreed to the published version of the manuscript.

Funding

This research was supported by an Australian Research Training Program (RTP) Scholarship provided by the Commonwealth Government of Australia.

Data Availability Statement

The raw data supporting the conclusions of this article will be made available by the authors on request.

Acknowledgments

This research is supported by an Australian Research Training Program (RTP) Scholarship. Appreciation is expressed to staff and postgraduate students at Curtin University, Western Australia School of Mines (WASM), Kalgoorlie Campus, for guidance, support, and assistance with machine operation and various analyses. Assistance from staff at the John de Laeter Centre at Bentley Campus in Perth for the TIMA results is also greatly appreciated.

Conflicts of Interest

The authors declare no conflicts of interest.

References

  1. Lazo, D.E.; Dyer, L.G.; Alorro, R.D.; Browner, R. Treatment of monazite by organic acids I: Solution conversion of rare earths. Hydrometallurgy 2017, 174, 202–209. [Google Scholar] [CrossRef]
  2. Lazo, D.E.; Dyer, L.G.; Alorro, R.D.; Browner, R. Treatment of monazite by organic acids II: Rare earth dissolution and recovery. Hydrometallurgy 2018, 179, 94–99. [Google Scholar] [CrossRef]
  3. Henderson, M.S.; Dyer, L.G.; Tadesse, B. Understanding limitations to monazite dissolution in oxalic acid. J. Artic. 2025. submitted for publication. [Google Scholar]
  4. Chaturvedi, N.; Dhal, N.K.; Patra, H.K. EDTA and citric acid-mediated phytoextraction of heavy metals from iron ore tailings using Andrographis paniculate: A comparative study. Int. J. Min. Reclam. Environ. 2014, 29, 33–46. [Google Scholar] [CrossRef]
  5. Cartwright, A.J.; May, C.C.; Worsford, P.J.; Keith-Roach, M.J. Characterisation of thorium-ethylenediamminetetraacetic acid and thorium-nitrilotriacetic acid species by electrospray ionisation-mass spectroscopy. Anal. Chim. Acta 2007, 590, 125–131. [Google Scholar] [CrossRef]
  6. Helmenstein, A. How to Make EDTA Solution. 2020. Science Notes. Available online: https://sciencenotes.org/how-to-make-edta-solution/ (accessed on 20 September 2022).
  7. Zhai, J.; Bakker, E. Complexometric titrations: New reagents and concepts to overcome old limitations. Analyst 2016, 141, 4252–4261. [Google Scholar] [CrossRef]
  8. Athavale, V.T.; Saraiya, S.C.; Sundaram, A.K. Thorium–EDTA complexes—A conductometric study. Anal. Chim. Acta 1960, 23, 200–201. [Google Scholar] [CrossRef]
  9. Thakur, P.; Xiong, Y.; Borkowski, M.; Choppin, G.R. Improved thermodynamic model for interaction of EDTA with trivalent actinides and lanthanide to ionic strength of 6.60 m. Geochim. Cosmochim. Acta 2014, 133, 299–312. [Google Scholar] [CrossRef]
  10. O’Brien, R.D.; Summers, T.J.; Kaliakin, D.S.; Cantu, D.C. The solution structures and relative stability constants of lanthanide—EDTA complexes predicted from computation. Phys. Chem. Chem. Phys. 2022, 24, 10263–10271. [Google Scholar] [CrossRef] [PubMed]
  11. Dyer, L.G. Project 541—Organic Acid Leach System for Rare Earth Extraction Technology Development; Progress Report, Bottle roll experiments, Personal communication; Minerals Research Advancing Western Australia: East Perth, WA, Australia, 2020. [Google Scholar]
  12. Tarasova, I.I.; Dudeney, A.W.L.; Pilurzu, S. Glass sand processing by oxalic acid leaching and photocatalytic effluent treatment. Miner. Eng. 2001, 14, 639–646. [Google Scholar] [CrossRef]
  13. Sinex, S.A. EDTA—A Molecule with a Complex Story. Prince George’s Community College. Molecule of the Month—March 2004. Available online: www.chm.bris.ac.uk/motm/edta/edtah.htm (accessed on 20 September 2022).
  14. Nkuna, R.; Ijoma, G.N.; Tonderayi, S.; Matambo, T.S. Applying EDTA in chelating excess metal Ions to Improve Downstream DNA Recovery from Mine Tailings for Long-Read Amplicon Sequencing of Acidophilic Fungi Communities. J. Fungi 2022, 8, 419. [Google Scholar] [CrossRef] [PubMed]
  15. Henderson, M.S.; Dyer, L.G.; Alorro, R.D. Flowsheet Development for treatment of rare earth ores. In Proceedings of the IMPC Asia-Pacific Conference 2022, Melbourne, VIC, Australia, 22–24 August 2022; AusIMM: Carlton, VIC, Australia, 2022. [Google Scholar]
  16. IECA (Australia). Coagulants and Flocculants Fact Sheet. 2018. Available online: https://www.austieca.com.au/documents/item/818 (accessed on 5 April 2022).
  17. Anderson, C.; Mushidi, J. Surface Chemistry and Flotation Behavior of Monazite, Apatite, Ilmenite, Quartz, Rutile, and Zircon with Octanohydroxamic Acid. In Proceedings of the Beneficiation of Phosphates VIII, Cape Town, South Africa, 29 April–4 May 2018; Available online: http://dc.engconfintl.org/phosphates_viii/44 (accessed on 5 April 2022).
  18. Banfi, G.; Salvagno, G.L.; Lippi, G. The role of ethylenediamine tetraacetic acid (EDTA) as in vitro anticoagulant for diagnostic purposes. Clin. Chem. Lab. Med. (CCLM) 2007, 45, 565–576. [Google Scholar] [CrossRef] [PubMed]
  19. Shaw, D.J. Introduction to Colloid and Surface Chemistry, 2nd ed.; Butterworths: London, UK, 1976. [Google Scholar]
  20. Divanshi, G. Difference Between True Solution, Colloidal Solution, and Suspension. 2019. Available online: https://biodifferences.com/difference-between-true-solution-colloidal-solution-and-suspension.html (accessed on 6 April 2022).
  21. Perry, R.H.; Chilton, C.H. Chemical Engineers Handbook, 5th ed.; McGraw-Hill: New York, NY, USA, 1973. [Google Scholar]
  22. Cambala, M.; Hruskova-Hasan, M.; Mileusnic, M. A comparison of different rinsing methods upon selective dissolution of iron (oxy)hydroxides in soils/sediments. Min. Geol. Pet. Eng. Bulletin 2017, 32, 9–14. [Google Scholar] [CrossRef]
  23. Huang, X.; Li, H.; Long, Z.; Liu, Y.; Zhao, N.; Zhang, G. A Process of Smelting Monazite Rare Earth Ore Rich in Fe. Google patent WO 2009021389A1, 19 February 2009. Available online: https://patents.google.com/patent/WO2009021389A1/en (accessed on 28 January 2021).
Figure 1. EDTA treatment pH measurements (0.1 M EDTA, pH not controlled).
Crystals 15 00103 g001
Figure 2. Primary filtrates from two different tests (EDTA leach solutions of residues C2 and C4) (a) shortly after filtration and (b) after sitting for several hours, highlighting slow precipitation of solution components.
Crystals 15 00103 g002
Figure 3. XRD pattern for REE oxalate precipitate from EDTA contacting solution (a) and (b) are duplicates, (c) synthetic REE oxalate [2]. Lines indicate common primary reflections in the patterns.
Crystals 15 00103 g003
Figure 4. Recovery to solution by oxalic acid and EDTA (0.2 M EDTA; 100 g/L solids loading in EDTA).
Crystals 15 00103 g004
Figure 5. Influence of solids loading (0.2 M EDTA; 100 g/L solids loading for C2E6 and C21E6); (200 g/L and 300 g/L solids loadings for C18E6 and C19E6 respectively).
Crystals 15 00103 g005
Figure 6. XRD diffractogram for solids through oxalic acid and EDTA contacting (a) REE oxalate (b) EDTA residue (c) oxalic acid leach residue (d) concentrate.
Crystals 15 00103 g006
Figure 7. Phosphorus dissolution in oxalic acid and mass loss in EDTA.
Crystals 15 00103 g007
Table 1. Composition of concentrate and residues (%).
SampleLa2O3CeO2Pr6O11Nd2O3P2O5Fe2O3MnOAl2O3CaOMgO
Concentrate10.8518.082.017.2114.3926.621.202.822.200.48
Oxalic Residue10.3716.712.097.275.0113.460.262.431.65ND
EDTA Residue9.1716.941.255.0413.6736.430.615.570.630.43
Concentrate with significantly greater Nd content than reported previously. The content is approximately 0.19% in feed, not always detected in residues (limit of detection issue). Significant mass loss in the EDTA step where REE solubilised.
Table 2. Concentrations after 0.2 M EDTA contacting (mg/L).
SampleLaCePrNdPFeAlCaMgTh
C2E3B34305492829316613534612862375
C2E432785323839325812653611245354
C2E630295097820302112643610724349
C2E6B30095106812299011623510404348
C3E630454917809298712613512935324
C4E333055087839322612613712276328
C4E432445027828316412583512106322
C4E529774774789290312603412555324
C4E630564951815301217673612975330
C5E330564773778297912623611555304
C5E430264682767294812633511495307
C9E3438672421147429114724612673465
C9E442486974110541919824611403481
C9E6391766751066384811814512164464
C5E53816ND4ND31-
Test C2E3B dilution with 0.5 M sodium hydroxide. All others diluted with sodium hydroxide solution at pH 10. Sample C2E6 was diluted immediately, while C2E6B was diluted after standing overnight. Dy was also measured in these tests, generally in a range from 45 to 60 mg/L, with greater solubilisation as phosphorus dissolution in preceding oxalic acid treatment increased. Significant thorium concentrations. Test C5E5 was conducted using alkaline solution with no EDTA. Shading highlights different experimental campaigns, CXE3 and CXE4 were filtered directly while CXE5 and CXE6 were filtered after the addition of cationic flocculant. Analytical data with no volume correction for alkali and floc addition. “ND” for Not Detected.
Table 3. EDTA contacting wash filtrate analyses (mg/L).
SampleLaCePrNdPFeAlCaMgTh
C4E6W11232191931411649333174924124
C4E6W2821272075124753739
C4E6W391521032031221
W1 signifies first wash, W2 second wash, and W3 third wash. All wash water diluted sodium hydroxide solution at pH 10.
Table 4. Residue masses after EDTA contacting of oxalic leach residues.
TestRecovered Mass (g)Comments
C2E62.61Solids released through filter paper during washing. Greatest sedimentation in first wash filtrate.
C3E62.49Greatest sedimentation in second wash filtrate.
C4E62.51Second wash the worst for solids passing to filtrate.
C4E52.68Second wash the worst for solids passing to filtrate.
C9E62.16Minor solids released through filter paper during washing.
C9E31.86Solids in wash through Millipore membrane with pre-filter, no flocculant.
C9E41.92Solids in wash through Millipore membrane with pre-filter, flocculant used.
C5E54.64Difficult filtration and significant losses incurred in both filtration attempts. Noticeable lifting of filter paper when vacuum discontinued. Exterior losses on filter paper incurred after first filtration.
Minor losses of variable amounts to filtrates. Tests C9E3 and C9E4 filtered using 0.8 mm Millipore membrane, others using Fisherman Q5 filter paper. C5E5 was conducted using sodium hydroxide without EDTA.
Table 5. Mass balance for Test C9 (mg).
SampleLaCePrNdPFeAlCaMg
Concentrate46273683309314931757914
C9428660843021064566257
C9E31843252410214160170119
Solution21035757206142650
Disclaimer/Publisher’s Note: The statements, opinions and data contained in all publications are solely those of the individual author(s) and contributor(s) and not of MDPI and/or the editor(s). MDPI and/or the editor(s) disclaim responsibility for any injury to people or property resulting from any ideas, methods, instructions or products referred to in the content.

