1. Introduction
Copper has extensively served as a dominant conductor material due to its excellent electrical conductivity (100% IACS according to the International Annealed Copper Standard) and workability [
1,
2]. However, its limitations include resource scarcity, high cost, and heavy weight, Posing a bottleneck to the development of modern power and transportation industries (i.e., smart grids, new energy vehicles) [
3,
4]. As a result, finding high-performance aluminum alloys as alternative conductors has become an urgent priority for achieving lightweight, low-cost, and sustainable development [
5].
Owing to their low Density, superior specific strength, and good electrical conductivity, aluminum and its alloys have found widespread application in industries such as electric wires and cables. As conductor materials for cables, these alloys must possess high electrical conductivity and sufficient mechanical strength. Currently, for medium and low-voltage cable conductor applications, 8xxx series aluminum alloys have become increasingly common, as they maintain high conductivity while exhibiting superior tensile strength and creep resistance compared to 1xxx series alloys. However, 8xxx series alloys have difficulty Simultaneously maintaining high electrical conductivity during the process of enhancing strength, restricting their broader application. By contrast, while traditional 6xxx series aluminum alloys offer high tensile strength and have shown promising development potential, their conductivity levels have demonstrated challenging to improve and sufficiently to meet the requirements of the Chinese National Standard “GB/T 30552-2014 Aluminum Alloy Wires.” [
6] Consequently, their application in medium and low-voltage cable conductors, where conductivity requirements are high, remains limited.
To address this challenge, researchers have increasingly focused on Al-Mg-Si (6xxx series) alloys. Si and Mg serve as the primary alloying elements in 6xxx series alloys, which can be strengthened by the precipitation of metastable β″ phases during annealing. Current research on these key elements has primarily concentrated on optimizing the Mg/Si ratio to balance strength and conductivity [
7]. Although the theoretical role of Mg and Si is well understood, the optimal Mg/Si ratio remains unclear. Theoretically [
7], at an Mg/Si ratio of 1.73, Mg and Si elements can precisely form the stoichiometric Mg
2Si phase. When the Mg/Si ratio exceeds 1.73 (Mg excess), the surplus Mg atoms dissolved in the matrix will increase lattice distortion, leading to a significant decrease in electrical conductivity. Conversely, at an Mg/Si ratio of less than 1.73 (Si excess), this alloy is also known as Si-rich 6xxx series aluminum alloy. Current research in this field has predominantly focused on compositional designs with near-stoichiometric Mg/Si ratios ≈ 1.73 (e.g., 6101, 6201 alloys) or on performance enhancement by microalloying with elements such as Cu, Ag, or rare earths [
8]. However, these approaches still have difficulty breaking through the technical bottleneck of Simultaneously achieving both electrical conductivity ≥ 61% IACS and tensile strength ≥ 120 MPa. For example, the conductivity of 6201 alloy is typically in the range of 52–56% IACS [
9]. Although it exhibits high strength, it fails to meet the high conductivity requirements of medium and low-voltage cables. Conversely, certain [
8] xxx series alloys with high Fe (1.5–2.2 wt%) and high Si (0.8–1.4 wt%) content have shown slightly improved conductivity, but they often suffer from insufficient strength and bending performance [
10]. In previous studies on high-Si 6xxx series aluminum alloys, Gupta et al. [
11] found that excess Si did not alter the precipitation sequence, structure, or lattice parameters of metastable precursors in Al-Mg-Si alloys. However, it did change the Mg/Si ratio within clusters and zones, affecting their Size, number density, distribution, and stability. Excess Si also further inhibited the formation of the equilibrium Mg
2Si phase. While investigating the influence of the Mg/Si ratio on Al-Mg-Si alloys, Xu et al. [
7,
12] observed that a lower Mg/Si ratio accelerated the precipitation kinetics, increasing the nucleation rate and density of precipitates. Faster precipitation kinetics can facilitate the more efficient removal of solute atoms from the alloy matrix, reducing their concentration in solid solution. Nevertheless, research on the coupling mechanism between microstructural evolution and strength–conductivity properties in alloys with low magnesium content, specifically doped with Silicon, remains scarce.
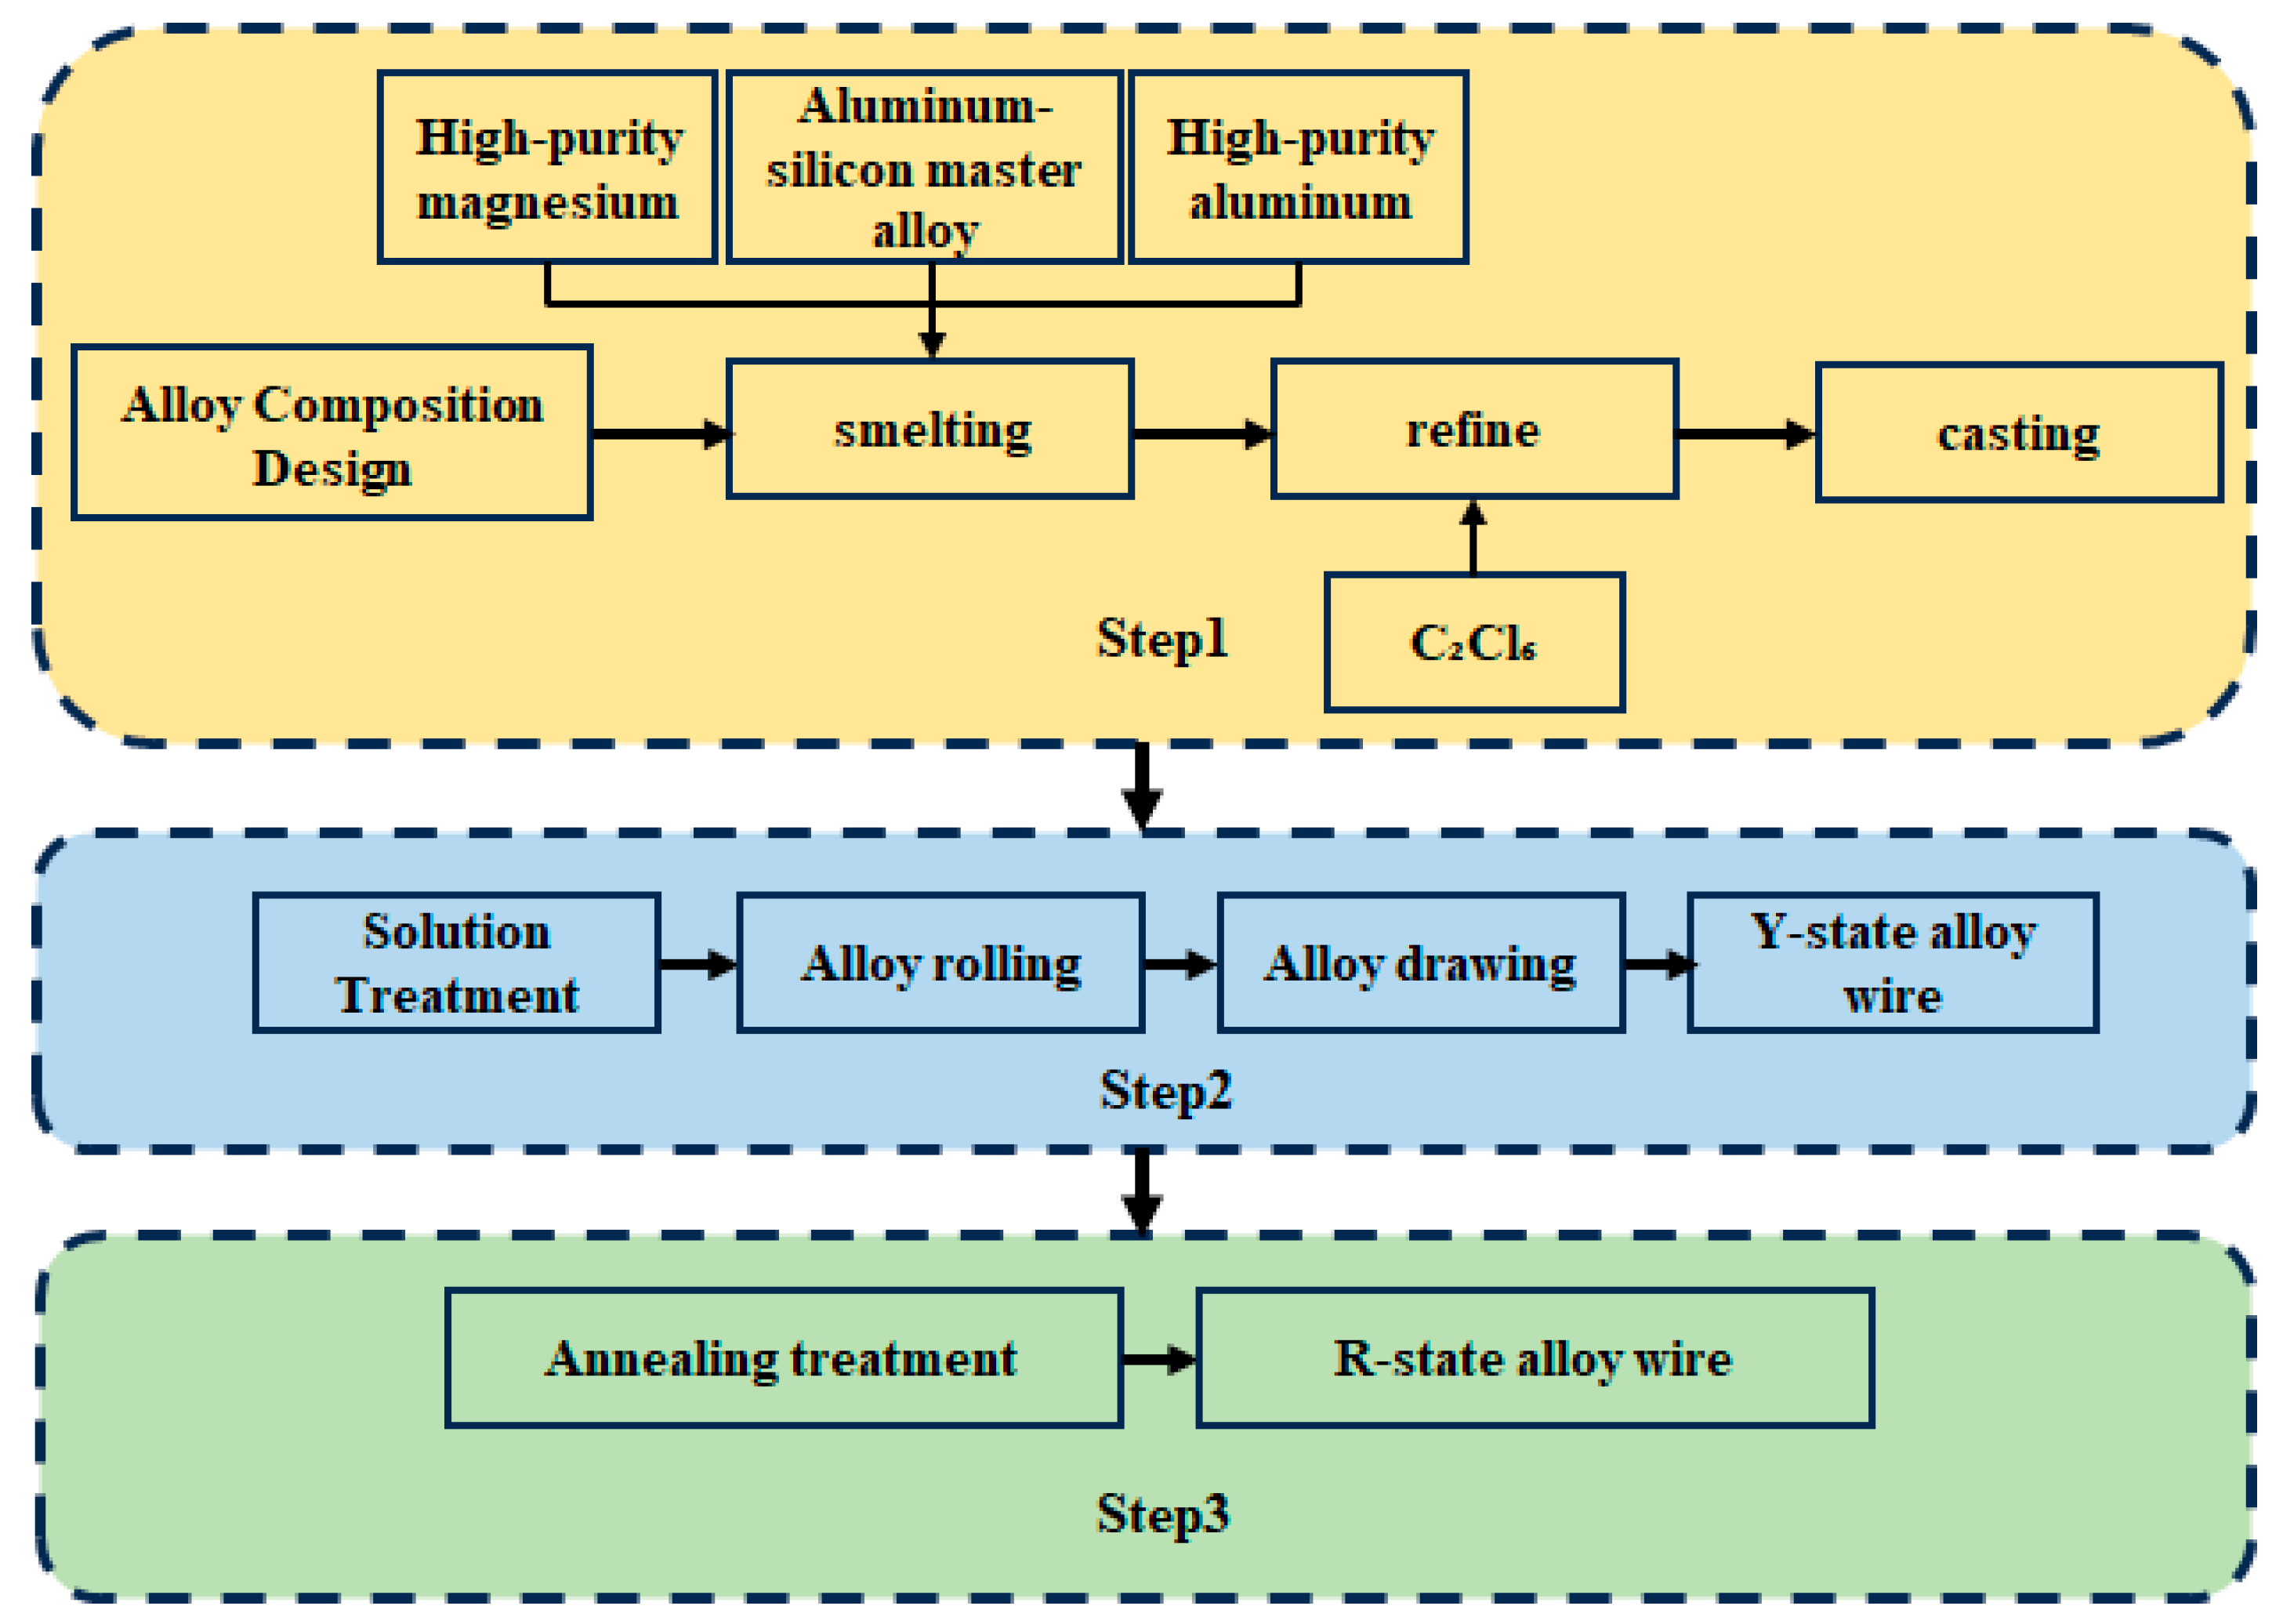
This study addressed the core conflict between strengthening via alloying and the consequent degradation of conductivity in aluminum alloy conductor materials. We systematically investigated the regulatory effects of different Si contents (0.4–1.0%) and annealing processes at 250 °C (1–13 h) on microstructural evolution by designing a high-Silicon, low-magnesium compositional system. The research focused on revealing new pathways for synergistically optimizing strength and conductivity from a multi-scale mechanistic perspective, encompassing solute atom-dislocation interactions, precipitation kinetics, and recrystallization behavior.
3. Property Evolution
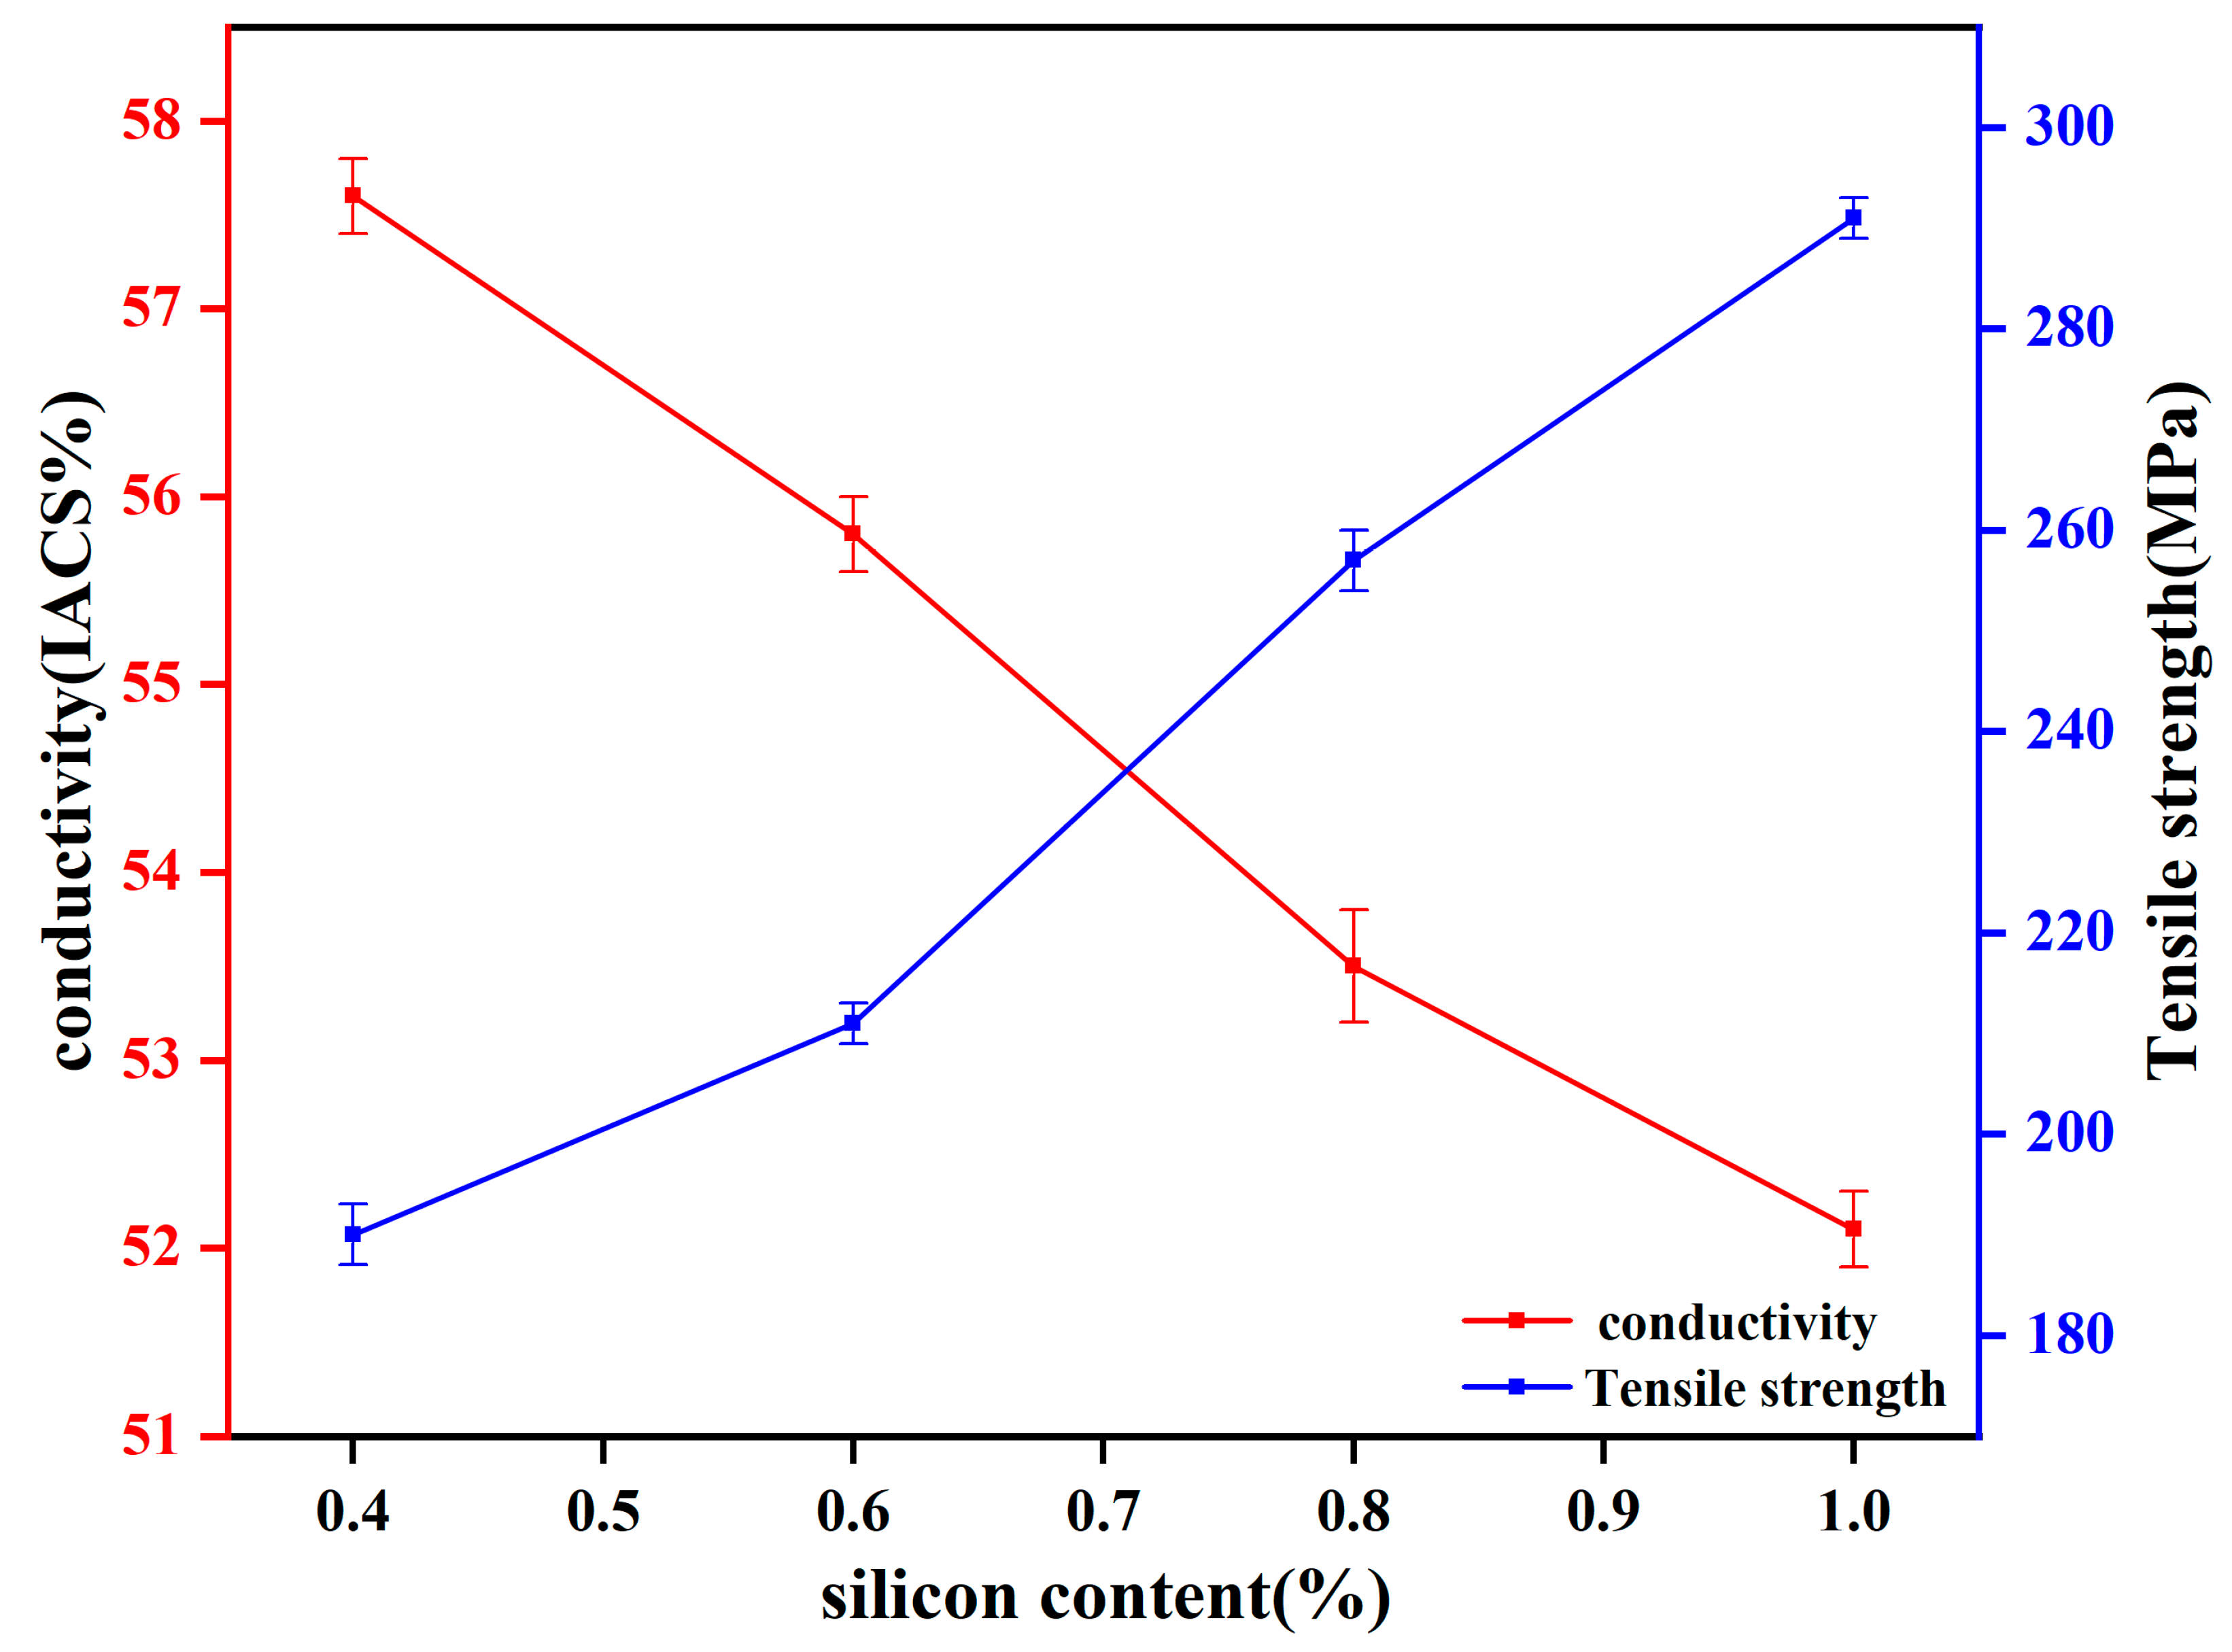
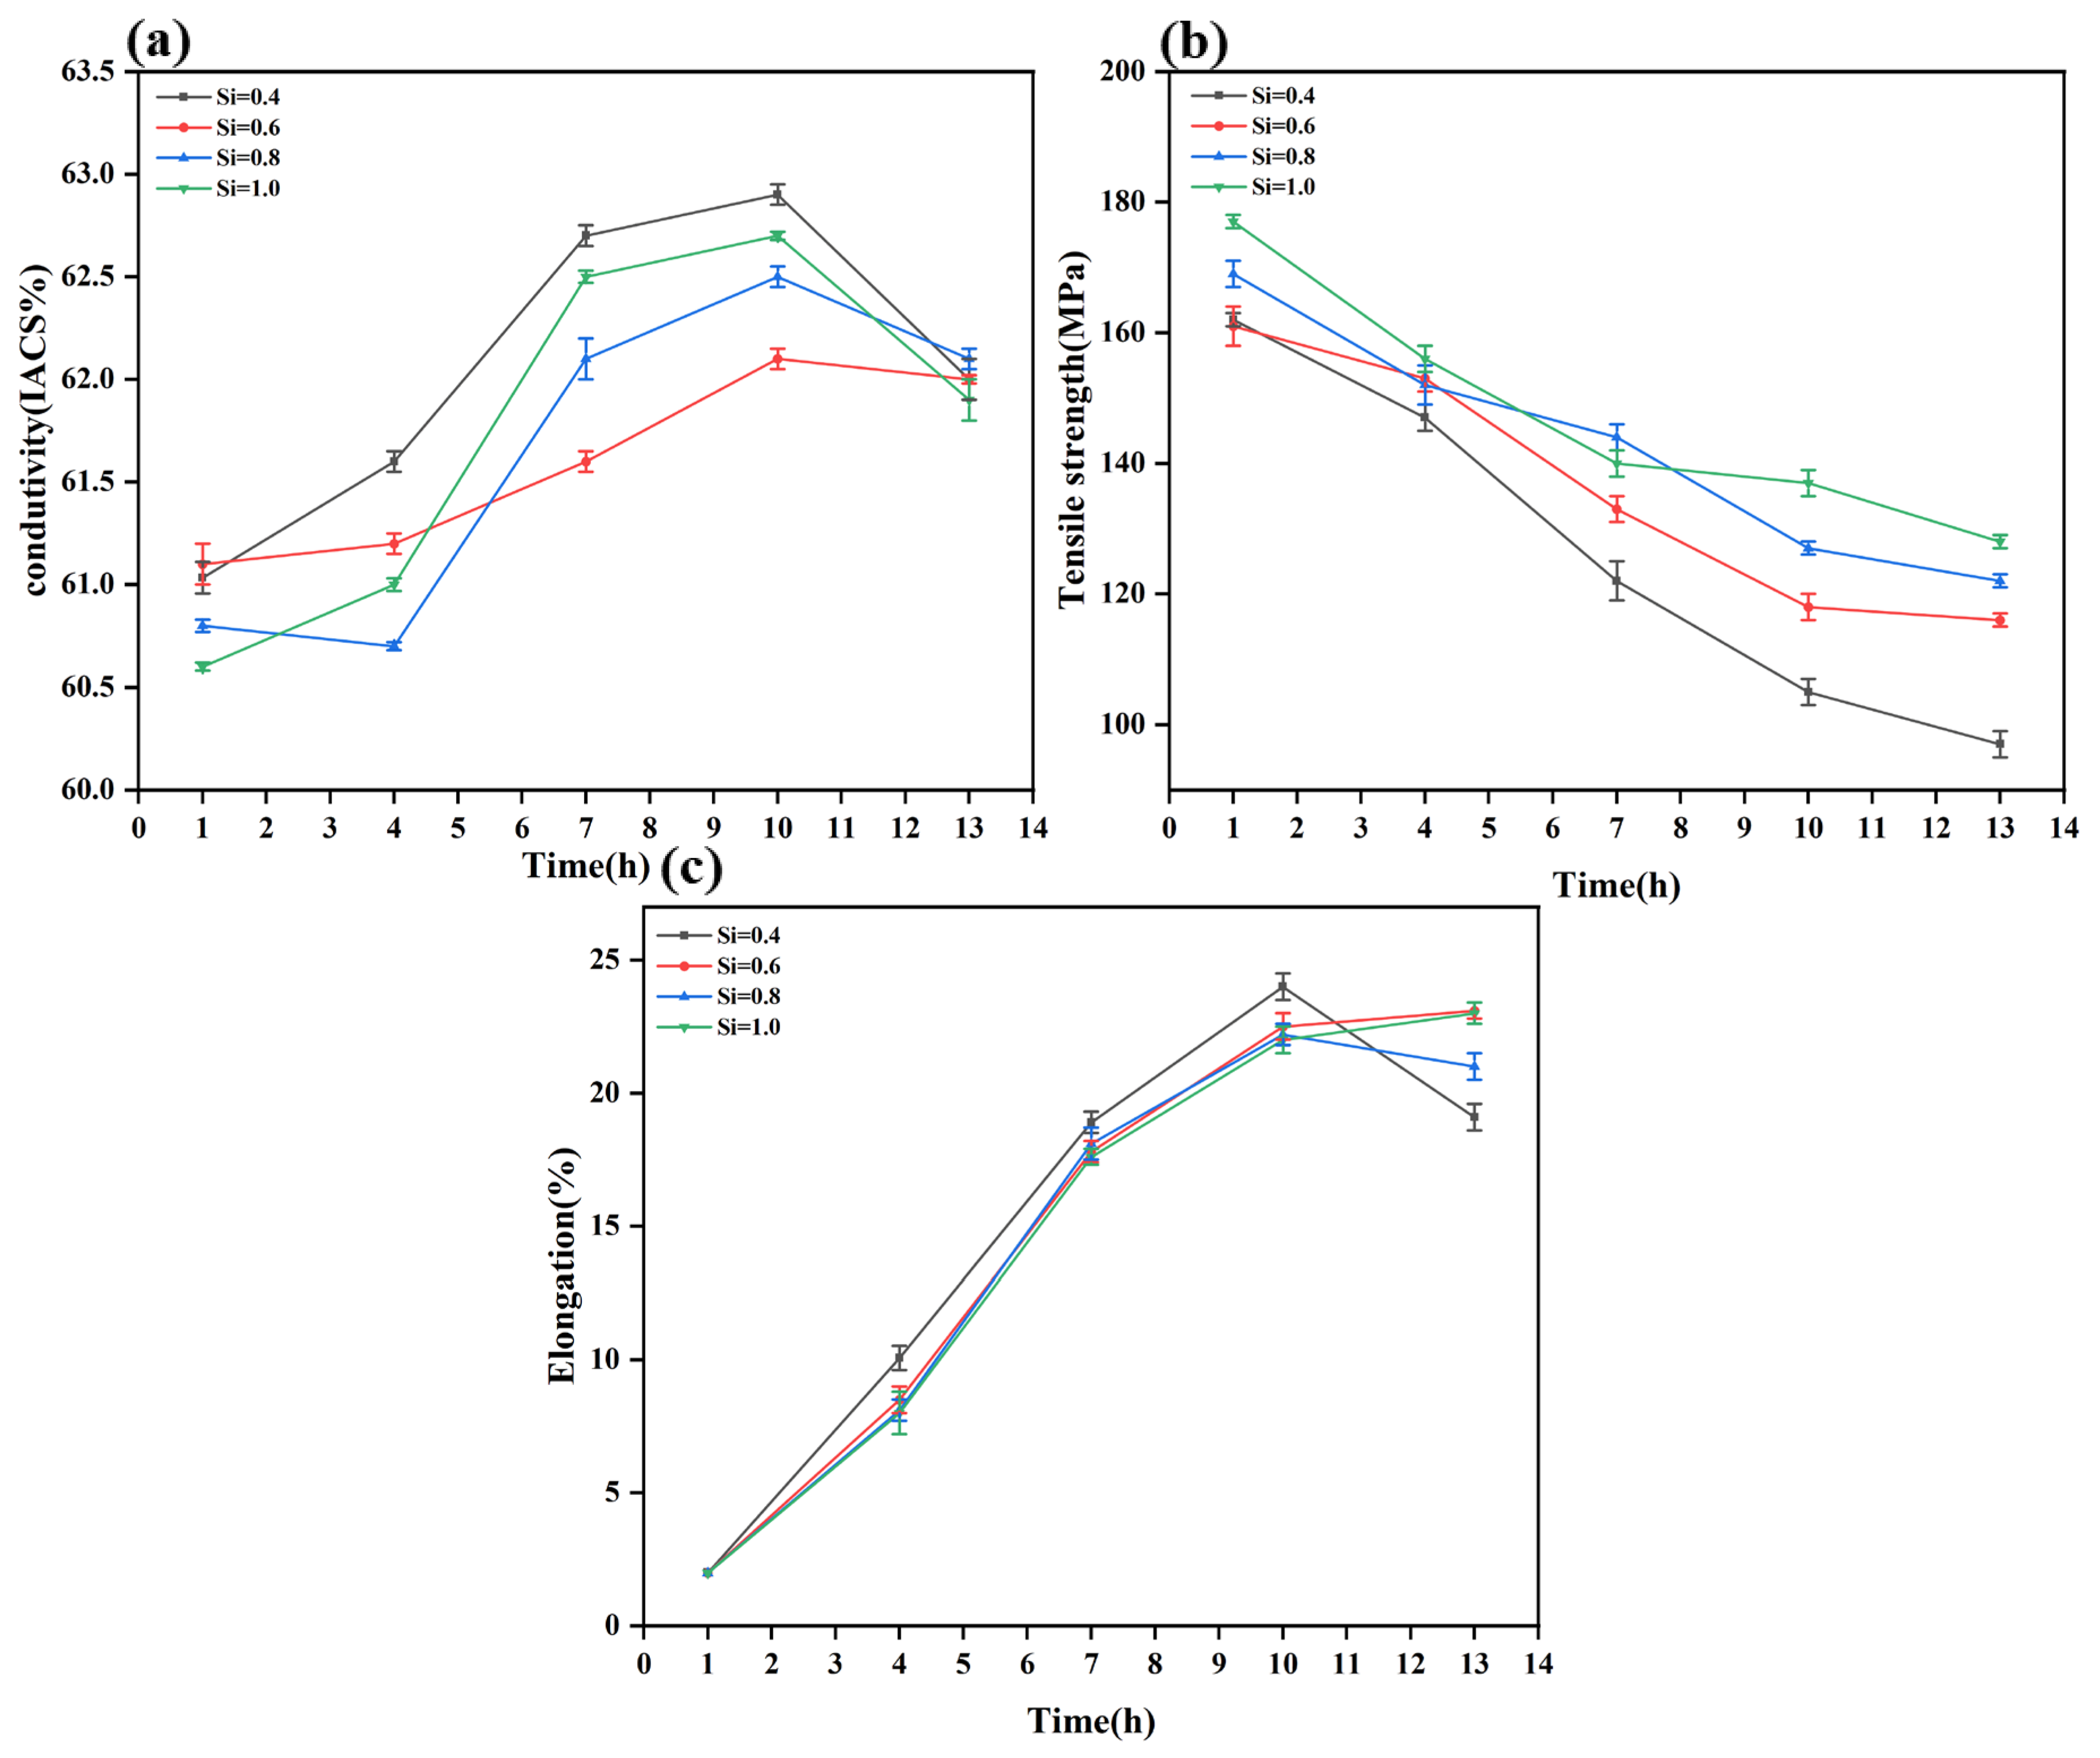
Figure 2 and
Figure 3 present the macroscopic properties of the alloy under different conditions.
Figure 2 presents the performance of the Y-state aluminum alloy wires, where the strength continuously increased, while the electrical conductivity decreased with increasing Si content.
The properties in this state were predominantly governed by solute atoms and dislocations introduced by cold deformation. According to the yield strength in Equation (2) [
15,
16], the increase in strength at this processing stage primarily originated from
[
17,
18,
19] and
:
where
is the strength increment contributed by solute atoms, and
is the strength increment resulting from dislocations retained after cold working or recovery. As the Si content increased,
also increased, whereas the dislocation density ρ in
[
20,
21] remained relatively consistent across all samples. Consequently, the strength gradually increased with higher Si content under this specific processing condition.
The decline in electrical conductivity was primarily attributed to
and
, with
Signifying resistivity increments induced by solute atoms and
denoting the contribution from dislocations. According to Equations (3) [
22] and (4), an increase in Si content left
unchanged; however, it elevated the solute-induced resistivity, accounting for the observed reduction in conductivity:
Figure 3 illustrates the in properties of the R-state aluminum alloy wires with increasing annealing time, where the strength gradually decreased, while both electrical conductivity and elongation increased (except the 250 °C/13 h condition). This evolution was fundamentally governed by the concurrent processes of recovery/recrystallization and precipitation. Recovery/recrystallization led to a reduction in dislocation density (ρ), whereas the precipitation process altered key parameters such as the volume fraction (
) and Size (r) of secondary phases, as well as the solute concentration (C) in the matrix. According to Equations (2) and (5) [
23,
24]
After annealing at 250 °C for 1 h, the properties showed no significant fluctuations, indicating that recovery was the dominant process, with only a slight decrease in dislocation density, while recrystallization and substantial precipitation did not initiate. The study found that after annealing at 250 °C for 10 h, the material exhibits an optimal combination of strength and electrical conductivity. However, when the annealing time was extended to 13 h, the electrical conductivity dropped sharply, accompanied by a slight decrease in strength.
Under the 250 °C/10 h condition, the recovery stage was essentially complete, and recrystallization began to act in synergy with precipitation. The fine precipitates (i.e., GP zones or β″ phases) formed during this stage could effectively provide precipitation strengthening25. According to Equations (2) and (6) [
23,
24],
where
is a constant and
denotes the strength increment resulting from the impediment of dislocation motion by grain boundaries, as the precipitate Size (d) decreased, an increase in
compensated for the strength loss. Concurrently, precipitation reduced the solute atom concentration (C) in the matrix, weakening electron scattering and consequently leading to a further enhancement in electrical conductivity [
25].
By contrast, under the 250 °C/13 h condition, the recrystallization process was nearly complete, resulting in a low dislocation density, and the material’s strength primarily relied on precipitation strengthening. However, prolonged annealing induced Ostwald ripening [
26,
27,
28] of the precipitates, increasing their average radius (r) and potentially slightly decreasing their volume fraction (
), which weakened the precipitation strengthening effect and caused a slight strength reduction. More importantly, some precipitates transformed from a coherent state (e.g., β″) to a semi-coherent or incoherent state (e.g., β′ or equilibrium β phase). The enhanced interfacial scattering at incoherent boundaries between these precipitates and the matrix Significantly increased electron scattering, resulting in a substantial decline in electrical conductivity.
In summary, the alloy containing 1.0% Si exhibited superior overall mechanical and electrical properties across all annealing durations, and the treatment at 250 °C for 10 h was identified as the optimal condition.
Figure 4 compares the mechanical and electrical properties of both the R-state after annealing at 250 °C for 10 h and the Y-state Al-xSi-Mg (x = 0.4, 0.6, 0.8, and 1.0) wires. Prior to annealing treatment, the tensile strength of the cold-deformed Y-state Al-xSi-Mg wires increased with increasing Si content, measuring 190, 211, 257, and 291 MPa, respectively. However, due to the work-hardening effect induced by cold deformation, the plasticity deteriorated Significantly. The Y-state wires primarily failed via brittle fracture, and their elongation was uniformly recorded as 2% due to their exceedingly low plasticity. Conversely, the electrical conductivity decreased with increasing Si content, with values of 57.6%, 55.8%, 53.5%, and 52.1% IACS, respectively. Following annealing treatment, the mechanical and electrical properties of the R-state Al-xSi-Mg wires showed Significant changes compared to the Y-state. The tensile strengths decreased to 105, 118, 127, and 137 MPa, corresponding to reduction ratios of approximately 44.7%, 44.1%, 50.5%, and 52.9% compared to their Y-state counterparts, indicating that the strength after annealing was approximately half of the post-cold-deformation level. In terms of plasticity, the elongation of the annealed R-state wires remained high across all compositions, measuring 24%, 22.5%, 22.2%, and 22%, respectively. The substantial recovery in plasticity was attributed to the weakening of the work-hardening effect after annealing treatment.
Electrical conductivity was also Significantly enhanced after annealing treatment. The conductivities of the R-state Al-xSi-Mg (x = 0.4, 0.6, 0.8, and 1.0) wires reached 62.9%, 62.1%, 62.5%, and 62.7% IACS, respectively, representing increases of 9.2%, 11.2%, 16.8%, and 20.3% compared to their Y-state. This indicated that higher Si content not only improved mechanical performance but also led to a greater relative enhancement in conductivity gain during the annealing process. Among the R-state Al-xSi-Mg wires, the Al-1.0Si-Mg alloy demonstrated the best overall comprehensive properties, achieving tensile strength 32 MPa higher than that of the Al-0.4Si-Mg alloy, with a negligible reduction in electrical conductivity of only 0.2% IACS.
4. Microstructure Evolution
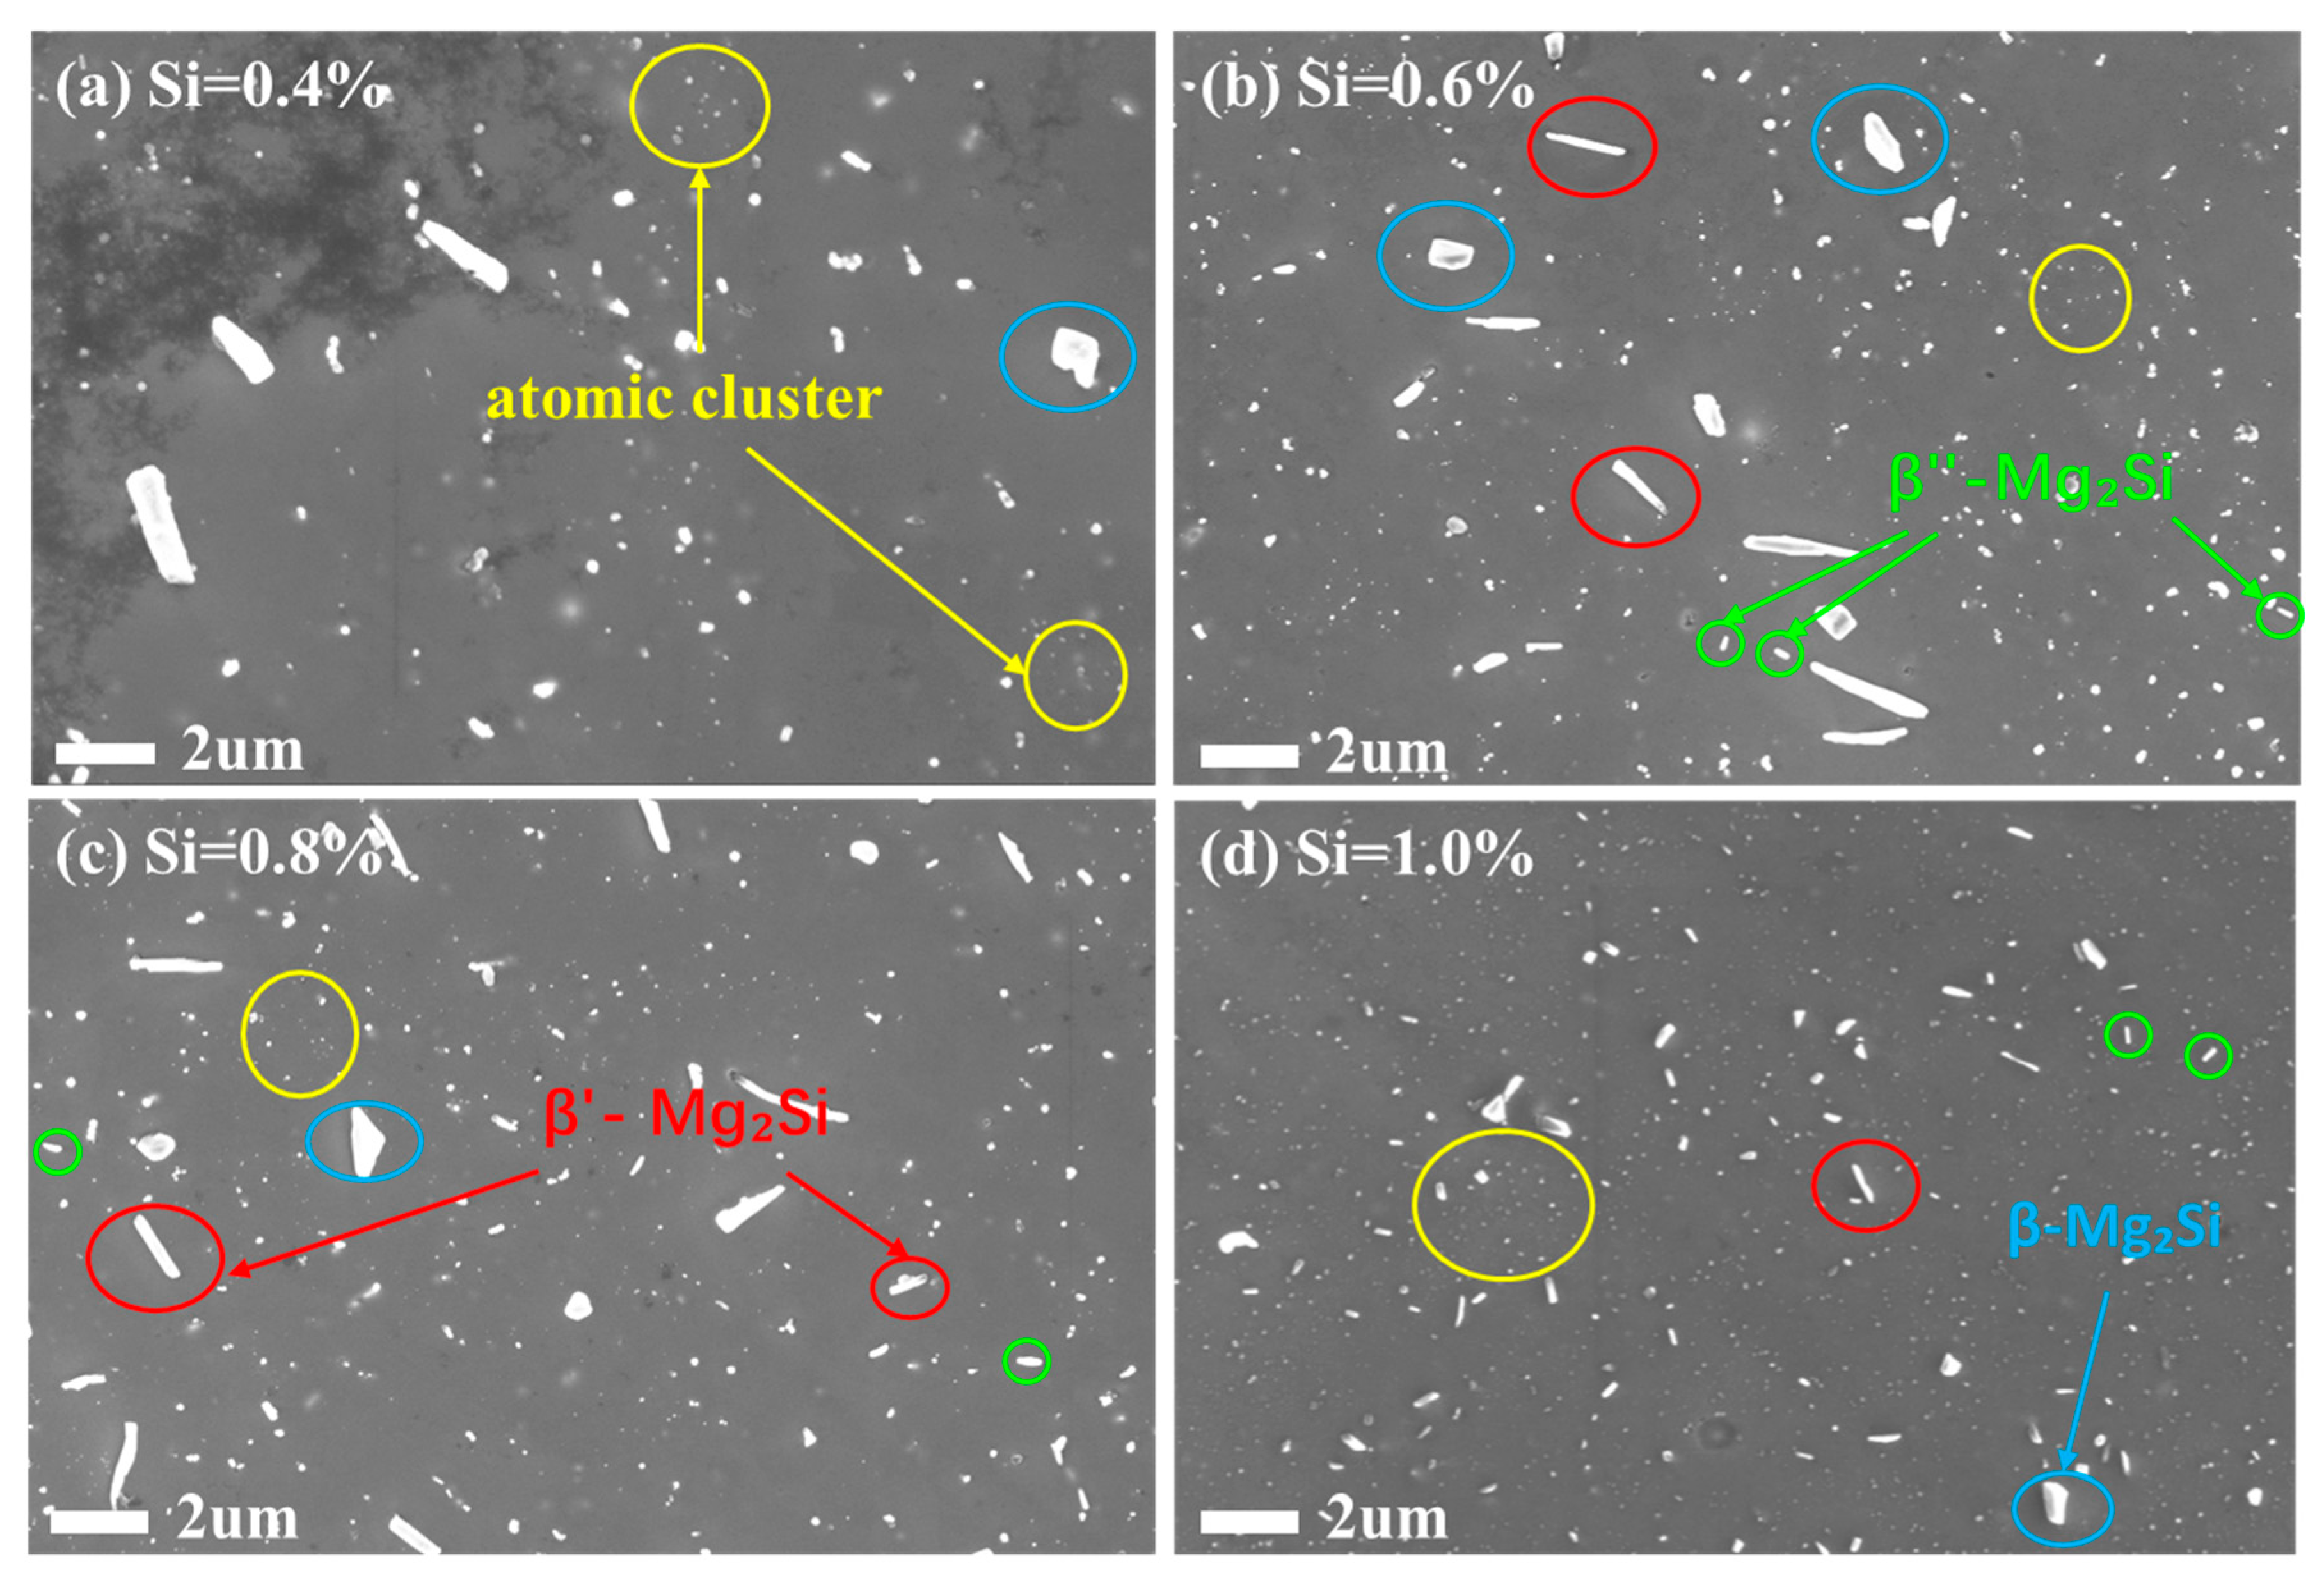
Figure 5 presents the SEM images of the alloys with different Silicon contents after annealing at 250 °C for 10 h. Microstructural characterization was conducted to verify the structural origins of the a forementioned property variations.
When the Si content was 0.4%, the number of precipitates was relatively low, and their Size was larger. This could be attributed to the lower Si content resulting in a weaker precipitation driving force, allowing sufficient time for precipitate growth and leading to coarser particles. Precipitates formed non-uniformly at high-energy Sites such as grain boundaries and dislocation lines, exhibiting localized segregation. Consequently, the strength was the lowest at this composition because the contribution from was weak, while the electrical conductivity was the highest due to minimal electron scattering from solute atoms (lowest ). As the Si content increased to 0.6% and 0.8%, the higher Si concentration provided more nucleation Sites for precipitates, Significantly increasing their number and density. The higher nucleation density, coupled with the increased Si content, led to a gradual reduction in precipitate Size and an improved distribution uniformity within the matrix, resulting in a gradual enhancement in strength. The slightly lower conductivity at 0.6% Si could be attributed to a slight increase in electron scattering from residual solute atoms. The recovery of conductivity at 0.8% Si was likely because the increased solute content enhanced the precipitation driving force, enabling most solute atoms to precipitate out. This yielded a purer matrix with fewer scattering centers, allowing the electrical conductivity to increase.
At 1.0% Silicon content, the precipitates achieved an ideal, finely dispersed distribution within the matrix, accompanied by a refined grain Size. The average grain Size was approximately 11.2 μm. The corresponding properties for this condition were as follows: a tensile strength of 137 MPa and an electrical conductivity of 62.7% IACS. The peak strength was likely attributed to the most potent precipitation strengthening effect (). Notably, the loss in electrical conductivity was minimal, only 0.2% IACS lower than the 0.4% Si alloy. This could be explained by the high Si content promoting the extensive precipitation of solute atoms, which Significantly reduced lattice distortion within the matrix, thereby minimizing electron scattering and preserving high conductivity.
As shown in
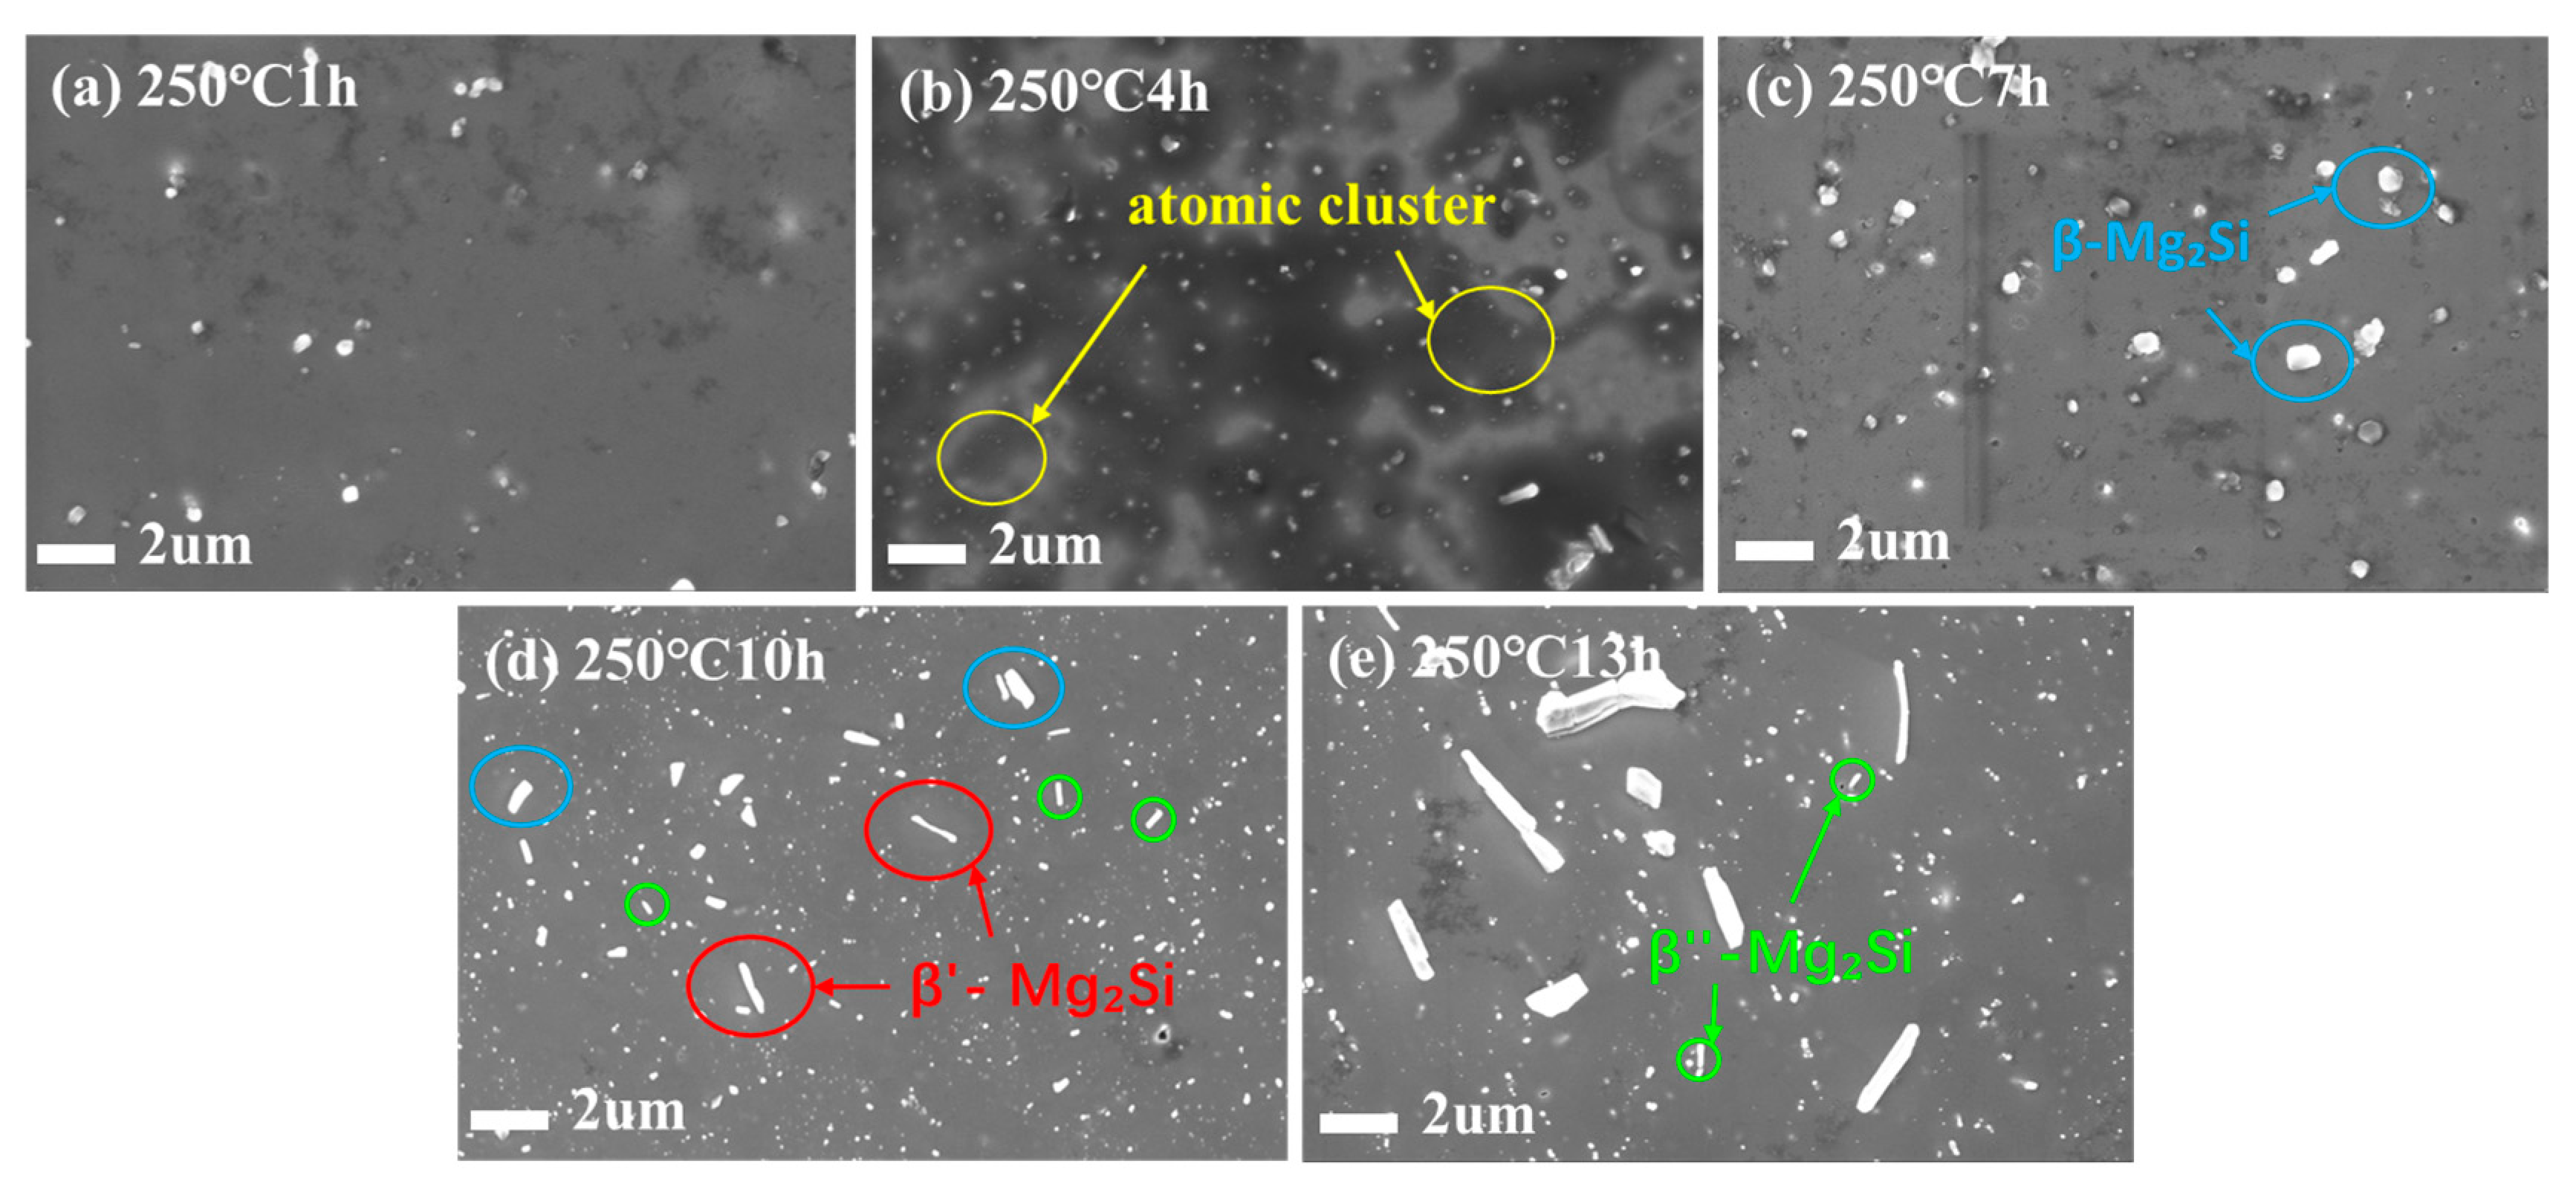
Figure 6a–e, SEM characterization was performed on the Al-1.0Si-Mg alloy subjected to different annealing times. After 1 h of annealing, the precipitates were likely in the early stages of nucleation, exhibiting extremely small Sizes and low quantities, which possibly made them difficult to resolve clearly under SEM. At this stage, only recovery occurred, resulting in high strength, low conductivity, and very low plasticity. This high strength was primarily due to Significant contributions from
and
, caused by high dislocation density. This same high density of tangled dislocations strongly scattered electrons, leading to low conductivity, and impeding the movement of new dislocations, making further plastic deformation difficult. This resulted in very low elongation and brittle fracture characteristics. In the 4 to 7 h annealing range, the recovery and recrystallization processes intensified. With prolonged time, the number and Size of precipitate phases increased. Needle-like or granular precipitates were clearly observed, uniformly distributed within the matrix and at grain boundaries. Correspondingly, the strength gradually decreased, while both electrical conductivity and elongation recovered, and the strength declined gradually, and both the electrical conductivity and elongation showed a recovering trend. At 10 h, the precipitates achieved an ideal state: fine-Sized, uniformly distributed, and with a very high density, yielding the best comprehensive properties. After 13 h of annealing, both the strength and conductivity decreased. Significant coarsening of the precipitates was evident, with a reduction in fine nanoscale phases and their transformation into larger, equilibrium phases, identified as stable β-Mg
2Si and Si particles based on EDS analysis and the well-established precipitation sequence for this alloy system. Grain boundaries also possibly coarsened slightly due to a weakened pinning effect, leading to the observed degradation in properties.
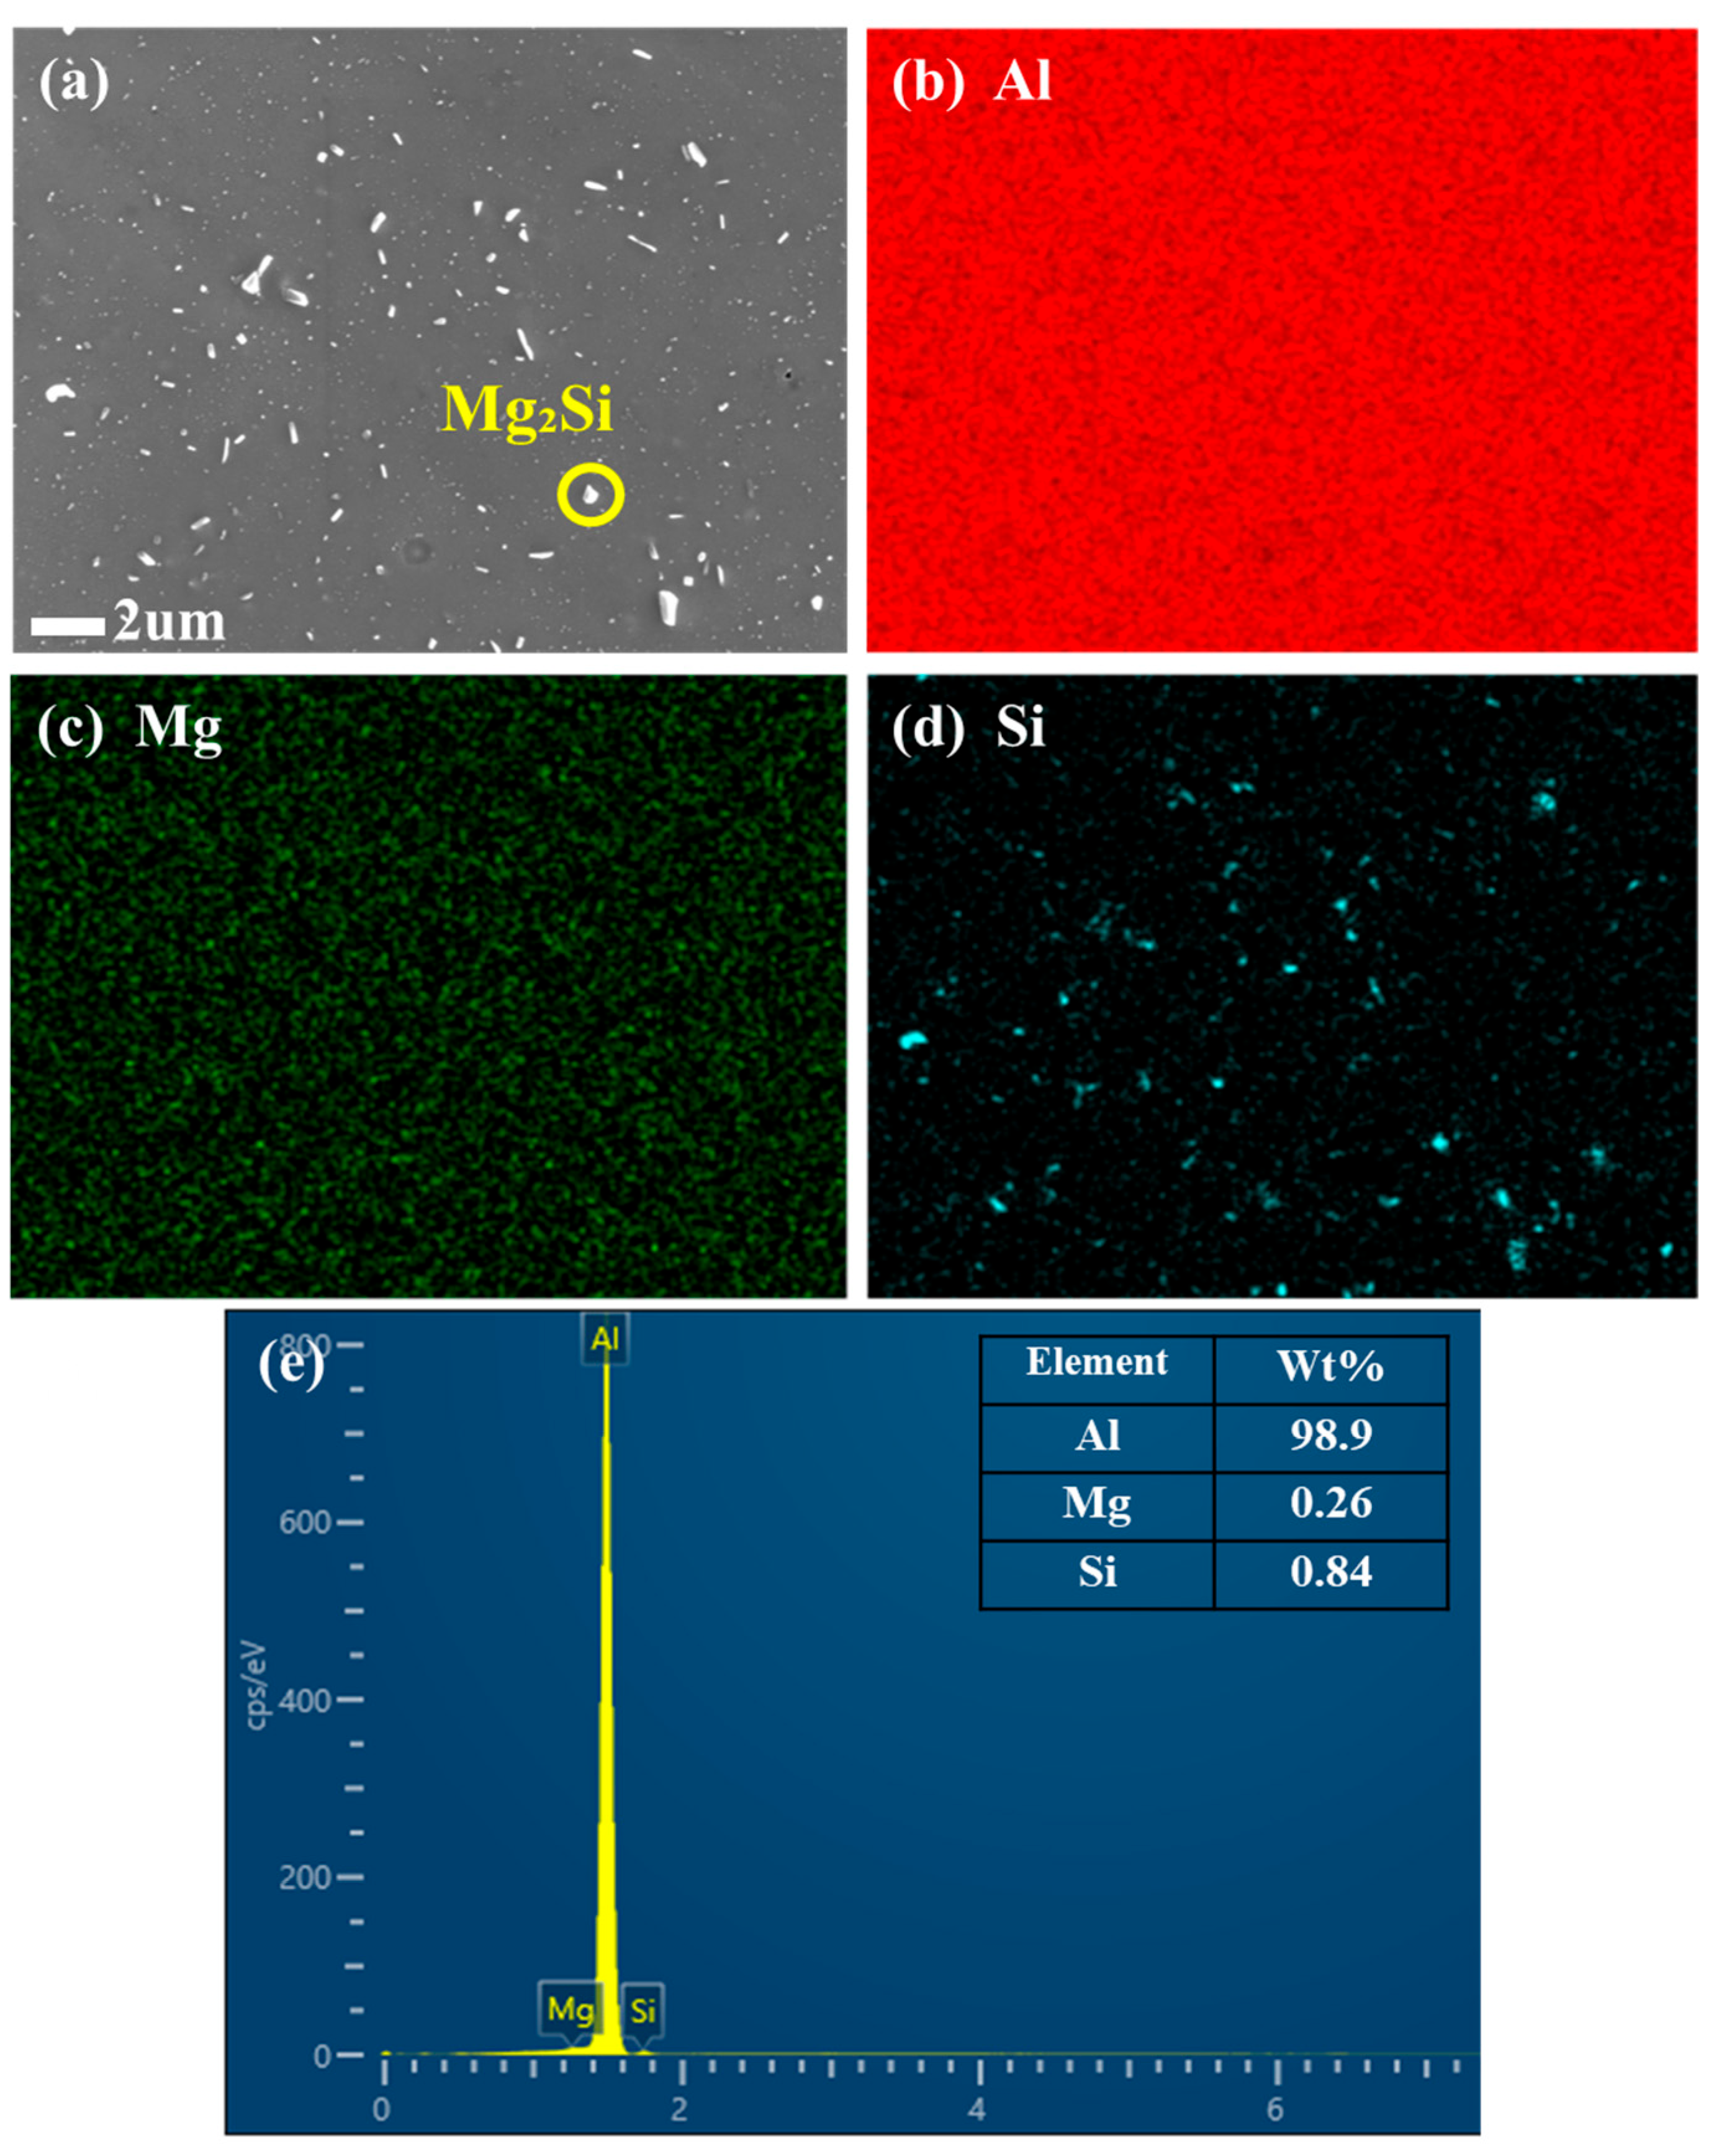
EDS angle forming was performed on Al-1.0 Si-mg alloy annealed at 250 °C for 10 h, and the EDS analysis results are shown in
Figure 7a–e.
Figure 7b–d is the surface scan of the sample. It can be seen that the matrix is basically Al, the Mg element in
Figure 7c is uniformly distributed in the matrix, and the analysis of
Figure 7d shows that the nanoparticle precipitation is mainly composed of Si.
Figure 7e EDS results of the surface scan, and electron scans of the Silicon-rich phase indicated by the yellow circles in
Figure 7a. This indicates that the precipitation of Si-rich phase is not only the aggregation of Si atoms. The detection of Al and Mg elements in the precipitates showed that the extensive precipitation of Si atoms induced the Simultaneous precipitation of other alloying elements in the matrix. This process reduces the solid solubility of these alloying elements and thus purifies the aluminum matrix. Furthermore, although the direct effect of the nanoscale precipitates on the resistivity is negligible, the precipitation of the Silicon-rich phase positively promotes the reduction in the resistivity by inducing the depletion of solute atoms (Si, Mg) in the matrix. At the same time, the precipitation strengthening effect provided by these precipitates improves the tensile strength.
Combining SEM and EDS role modeling, the AL-1Si-Mg alloy exhibits the best overall properties at 250 °C 10 h. Therefore, a more detailed structural examination was performed. Grain structure and defect density are considered to be the key parameters to control the electrical and mechanical behavior of aluminum alloy conductors.
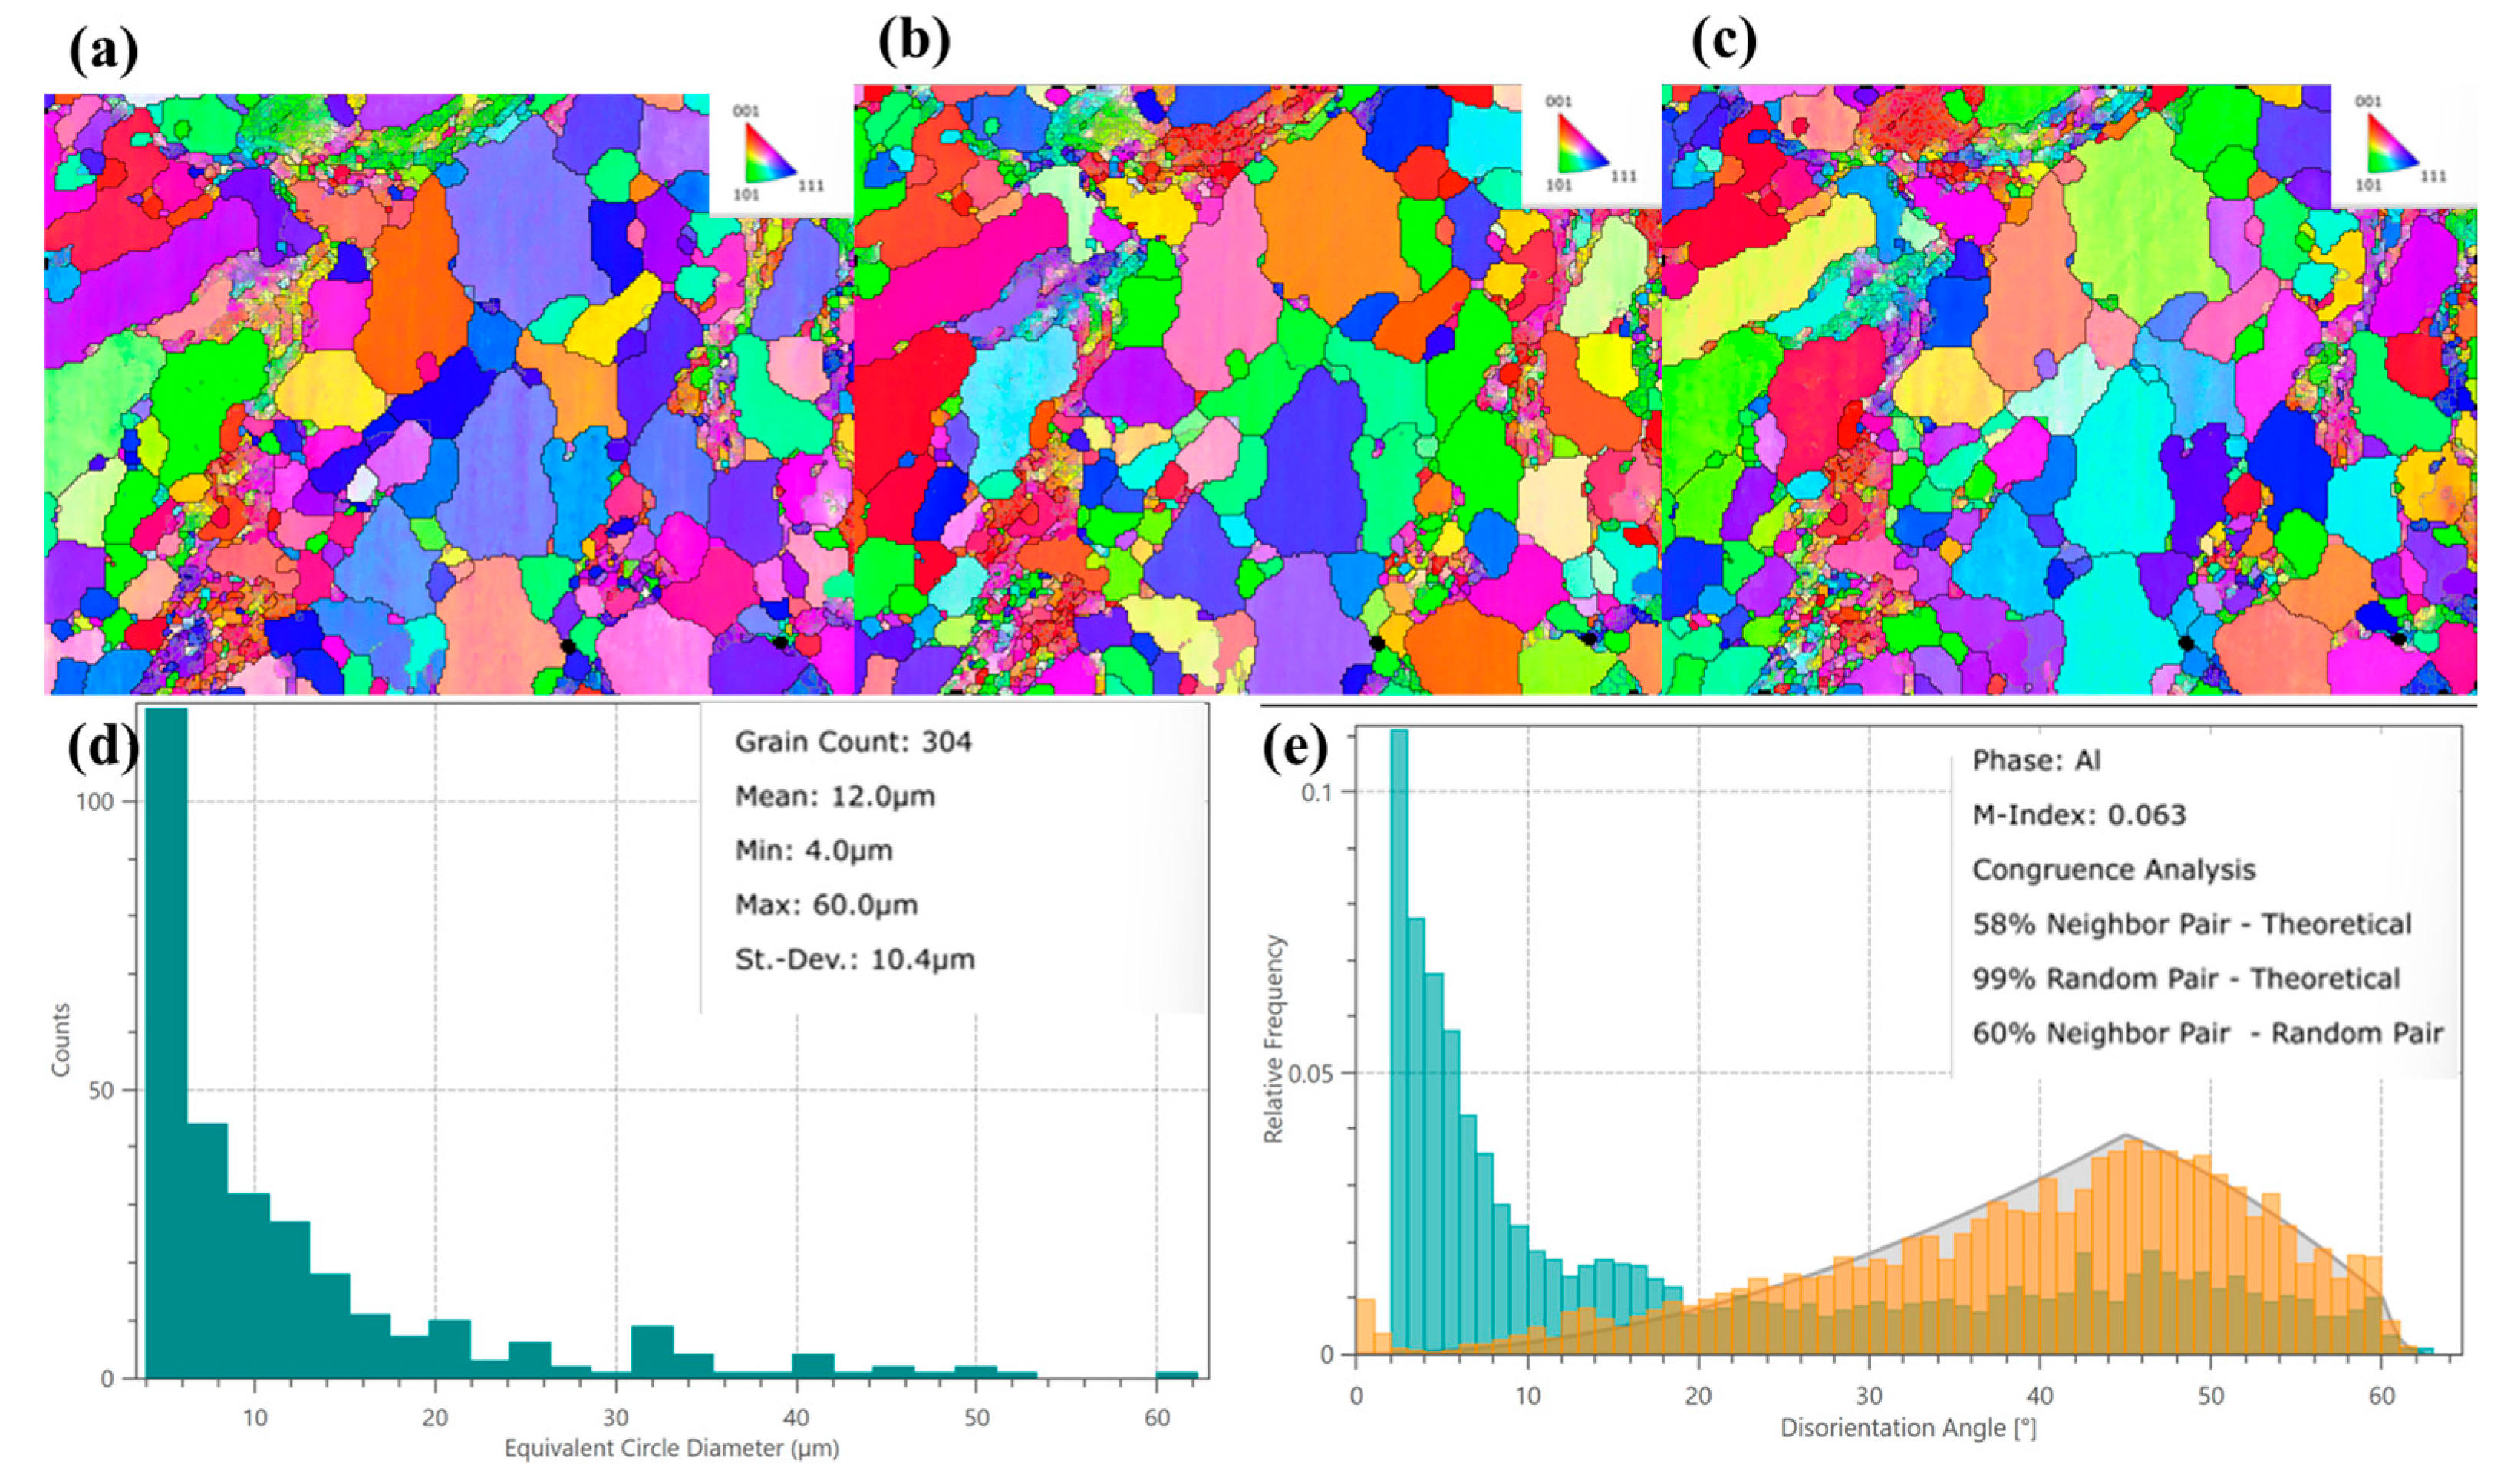
Figure 8 and
Figure 9 show that the Al-0.8 Si-Mg alloy was annealed at 250 °C for 10 h, and
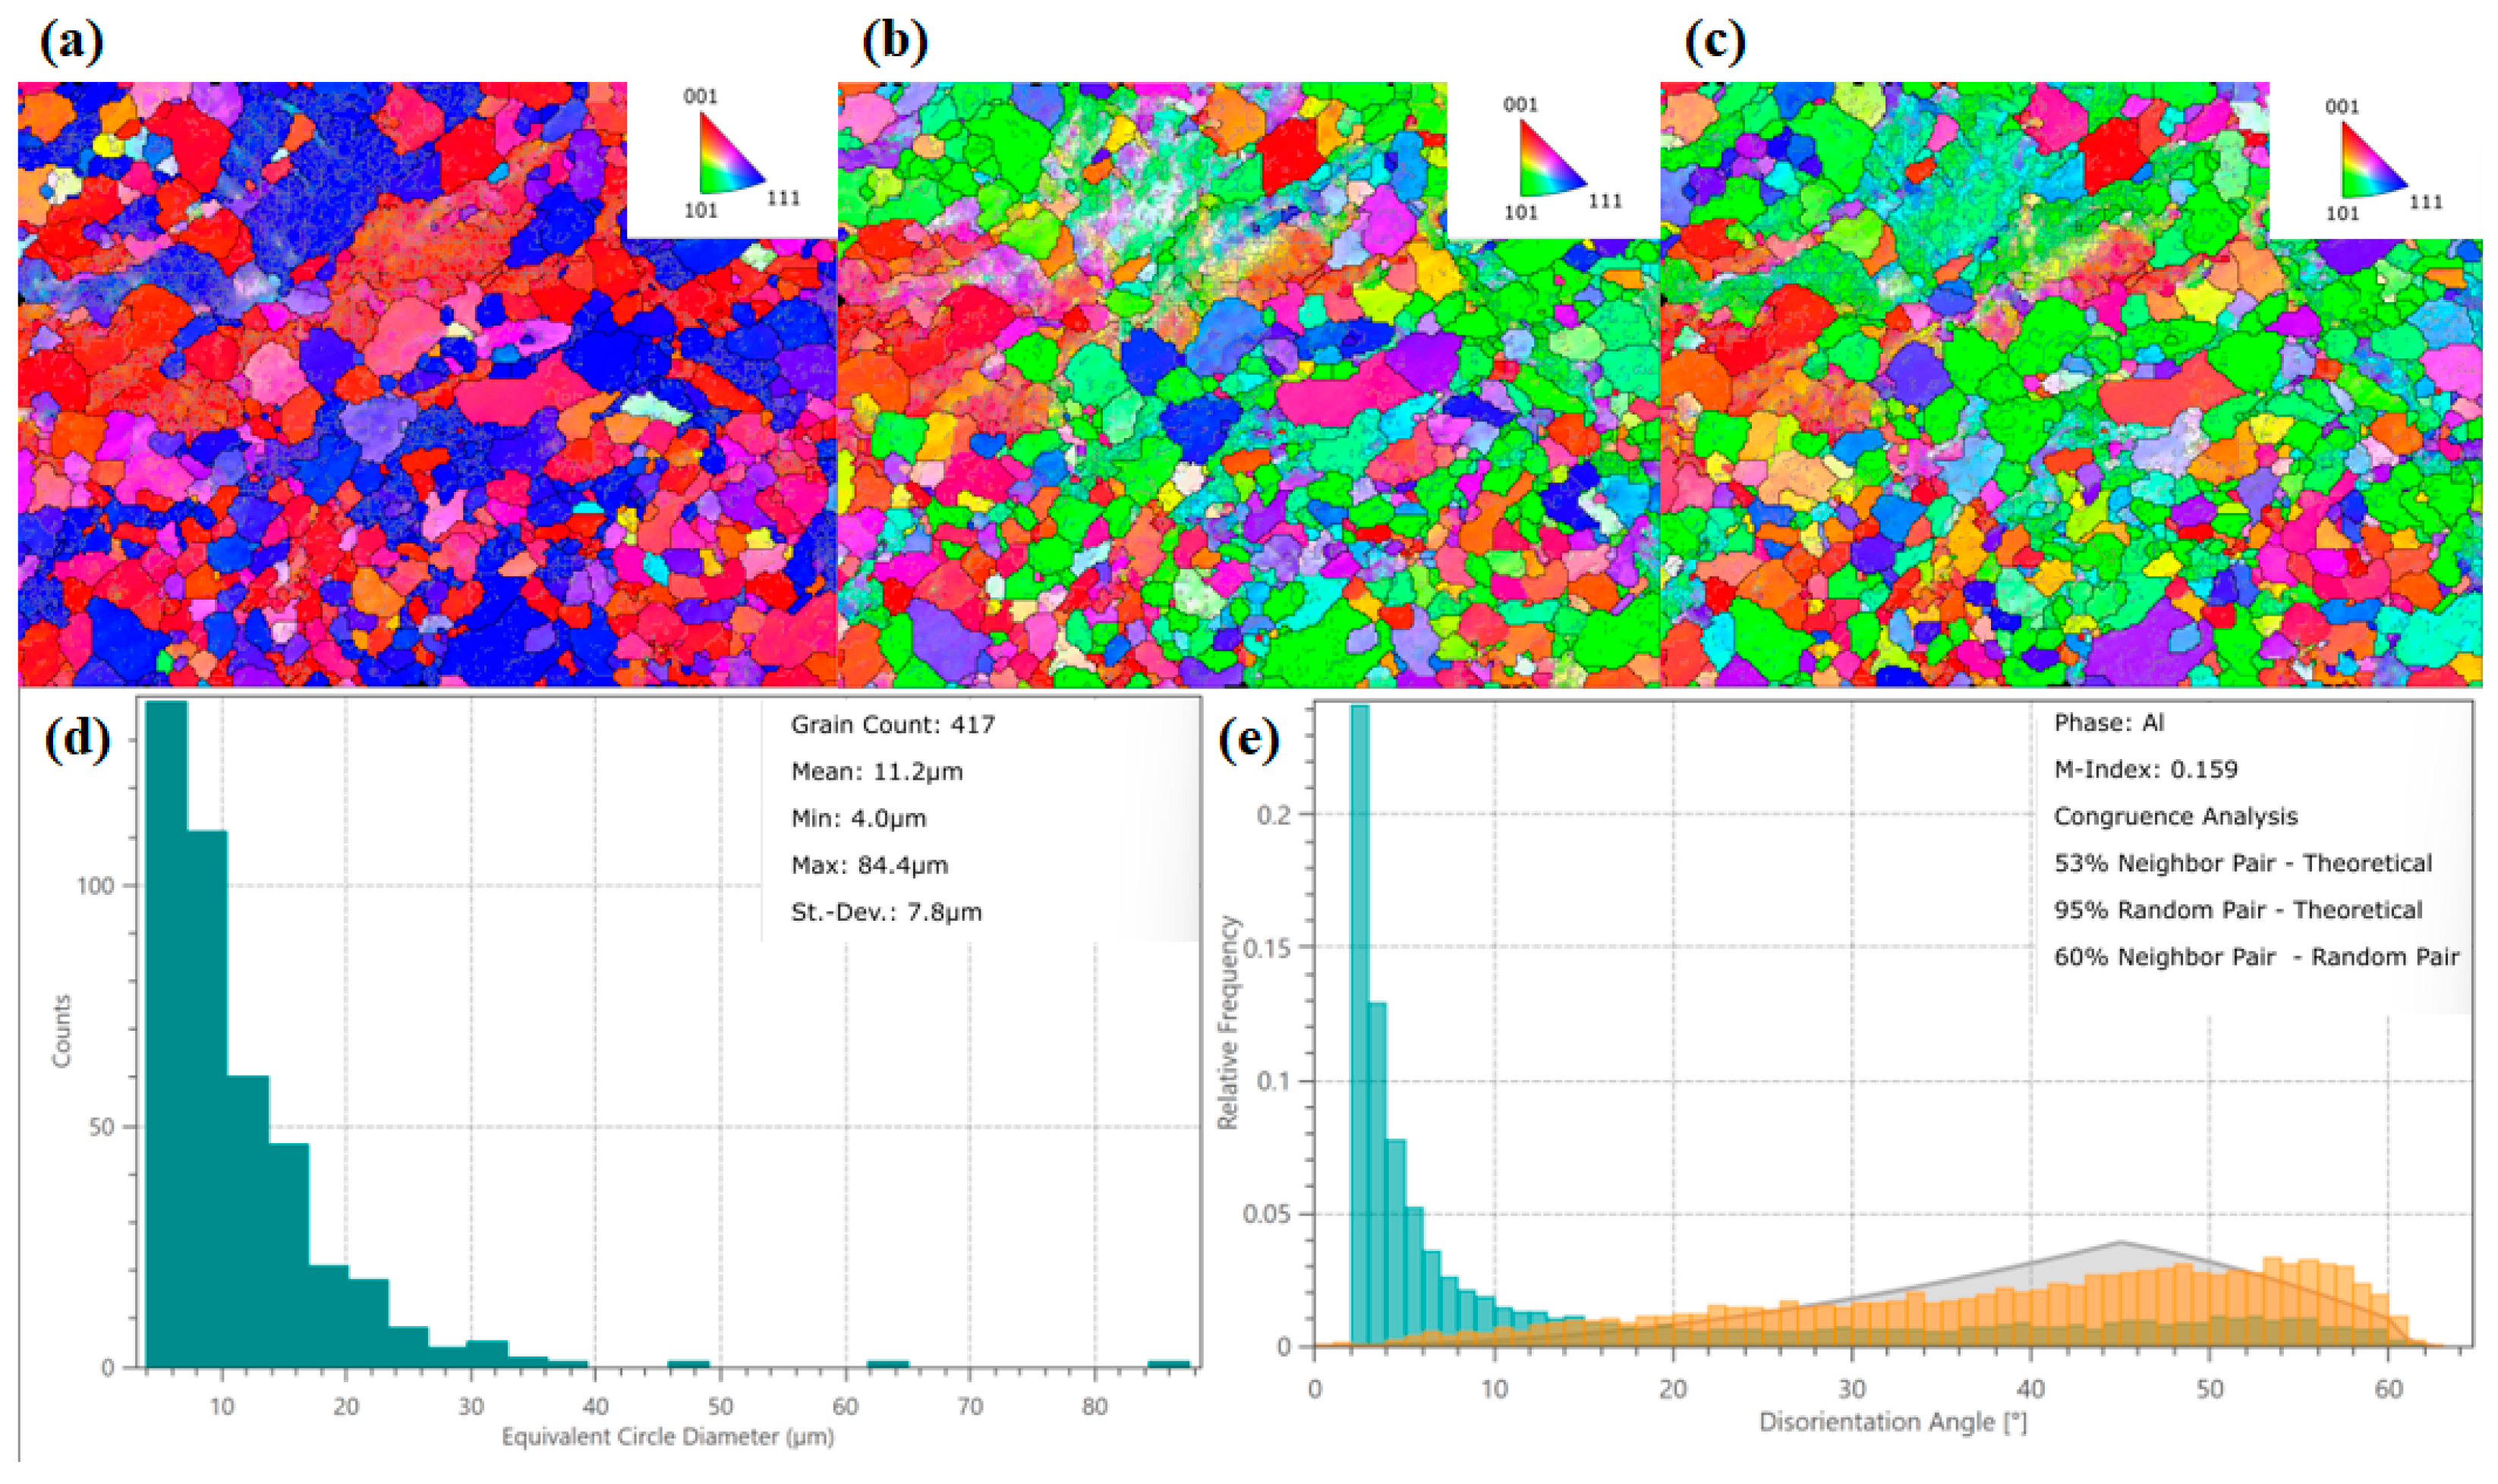
Figure 10 and
Figure 11 show that the Al-1 Si-Mg alloy was annealed at 250 °C for a reasonable 10 H, the system roles of the sections are modeled using electron backscatter diffraction (EBSD).
This analysis yielded essential microstructural parameters, including grain morphology, Size distribution, and misorientation. The experimental results revealed marked changes in grain topology following heat treatment, which in turn exerted a profound influence on both the electrical transport behavior and mechanical performance of the conductor. As shown in
Figure 8a–c, inverse pole figure (IPF) mappings (along the X-, Y-, and Z-directions) with grain boundary overlays vividly illustrate the crystallographic orientation distribution within individual grains and grain boundary features. The IPF-X map (
Figure 8a) shows a microstructure dominated by <001> and <111> orientations (consistent with cube/rotated cube texture components typical of rolled/annealed Al alloys), reflecting the material’s processing history. Cube-oriented grains reduce anisotropy, lower yield strength, decrease electrical resistivity, and improve ductility, while rotated cube textures enhance yield strength (at the cost of ductility and moderate resistivity increase). The coexistence of these textures under the current processing parameters balances mechanical and electrical properties. Meanwhile, IPF-Y (
Figure 8b) and IPF-Z (
Figure 8c) mappings display a relatively uniform polycrystalline orientation distribution along their respective directions, minimizing localized stress concentrations from anisotropic deformation. Additionally, randomly oriented grain boundaries act as crack-propagation obstacles, potentially improving fatigue resistance.
From the equivalent circle diameter (ECD) distribution (
Figure 8d), 304 grains were analyzed. The average ECD is 12.0 μm (fine-grained), and the Hall–Petch relationship suggests this fine grain Size contributes to high strength (preventing sharp strength decline). The grain Size distribution is inhomogeneous: most grains are small, with some grains grow abnormally. Concurrently, fine secondary phase particles may precipitate, pinning grain boundaries to limit excessive growth and strengthening via precipitation hardening. Solute atom precipitation from the matrix reduces solute concentration, decreasing electron scattering and enhancing electrical conductivity. The grain boundary misorientation angle distribution (
Figure 8e) shows: (1) The neighbor-pair histogram (blue–green) has a high peak in the low-angle region (<15°), with relative frequency exceeding the theoretical Mackenzie curve (gray). Up to 58% of adjacent grain pairs have misorientation angles < 15°, acting as a strong strengthening source (hindering dislocation motion). (2) The high-angle region (>30°) has lower frequency than the theoretical value. (3) The random-pair distribution (orange) nearly overlaps with the theoretical gray curve (coincidence ~95%), and the M-Index (0.063) indicates a slight texture (overall orientation remains relatively random). This weak texture implies isotropic properties, beneficial for applications like wires.
As shown in
Figure 10a–c, inverse pole figure (IPF) mappings along the X-, Y-, and Z-directions, overlaid with grain boundary information, offered a vivid visualization of the crystallographic orientation distribution within individual grains [
29] and grain boundary characteristics. The orientation findings illustrated how crystallographic orientations were distributed relative to the sample’s macroscopic reference directions [
30]. The IPF-X mapping in
Figure 10a revealed a microstructure predominantly characterized by <001> and <111> orientations, indicative of potential cube or rotated cube texture components. These textures are typically found in rolled and annealed aluminum alloys, aligning with the material’s processing history. Cube-oriented grains generally contributed to reduced anisotropy, lower yield strength, decreased electrical resistivity, and improved ductility. In comparison, rotated cube textures enhanced yield strength at the expense of ductility and with a moderate increase in resistivity. The coexistence of these two texture components under the present processing parameters led to a favorable balance of mechanical and electrical properties. Moreover, the IPF-Y and IPF-Z mappings (
Figure 10b,c) displayed a polycrystalline orientation distribution along the respective directions, demonstrating relatively uniform grain orientations without pronounced preferential alignment. This homogeneity mitigated localized stress concentrations that could arise from anisotropic deformation. In addition, the presence of randomly oriented grain boundaries acted as obstacles to crack propagation, which possibly contributed to enhanced fatigue resistance.
According to the equivalent circle diameter (ECD) distribution in
Figure 10d, a total of 417 grains were statistically analyzed. The average ECD of the grains was 11.2 μm, which was classified as a fine grain Size. According to the Hall–Petch relationship, finer grains contributed to higher material strength. This was a key reason why the strength remained at a relatively high level without a sharp decline in this state. The grain Size distribution was somewhat inhomogeneous, with the majority concentrated in the smaller Size range alongside the presence of some larger grains. This microstructural feature was typical of the initial stage following complete recrystallization. Concurrently with recrystallization, fine secondary phase particles precipitated. These precipitates could pin grain boundaries, inhibiting excessive grain growth, while also contributing to strength via precipitation hardening. Simultaneously, the precipitation of solute atoms from the matrix reduced the solute concentration within the matrix, decreasing electron scattering and further enhancing electrical conductivity. The grain boundary misorientation angle distribution map in
Figure 10e revealed that the histogram for neighbor pairs (in blue–green) exhibited an abnormally high peak in the low-angle region (<15°), with a relative frequency Significantly exceeding the theoretical Mackenzie curve (in gray). In contrast, the frequency in the high-angle region (>30°) was lower than the theoretical value. The distribution curve for random pairs (in orange) almost completely overlapped with the theoretical gray curve (with a coincidence level of 95%). In the neighbor pair distribution, up to 85% of adjacent grain pairs had a misorientation angle less than 15°. The presence of a high fraction of low-angle grain boundaries was a significant strengthening source, as they could effectively hinder dislocation motion. The random pair distribution matched the theoretical random distribution with a high coincidence of 95%, and the M-Index was 0.159. This value indicated the presence of a slight texture in the sample; however, the overall grain orientation distribution remained relatively random. The absence of a strong texture implied that the material’s properties were isotropic [
31,
32], which was beneficial for products such as wires.
According to the analysis of
Figure 8,
Figure 9,
Figure 10 and
Figure 11, it can be seen that the average grain size is larger than 1.0% at the Si content of 0.8%, which may be due to the lack of precipitation strengthening, when the amount of Si addition is small, the SI phase is precipitated in a small process, the number is small, and the size is large. The pinning effect of these particles on the grain boundary is weakened, and the migration of the grain boundary cannot be effectively inhibited, resulting in some grains (especially large grains) growing preferentially (abnormally) [
33]. Si atoms are easy to segregate at grain boundaries. When the amount of Si added is small, the concentration of Si atoms segregated at grain boundaries is low, and the resistance of grain boundary migration is reduced (segregated Si usually increases grain boundary energy and hinders migration). Therefore, the grain boundaries of large grains are more likely to break through the “Pinning” and grow abnormally. From the EBSD results of
Figure 8, although the average grain size (12.0 μm) is fine, there is a coexistence of “Some large grains (up to 60.0 μm)” and “A large number of small grains (up to 4.0 μm)”. It can be seen that although the degree of recrystallization is quite complete at such processing times and temperatures, the grain size changes due to the different doping of SI, abnormally large grains reduce the strength of the material (in the Hall-Petch relationship, the coarser the grains, the lower the strength), but may improve the plasticity (larger grains have greater deformation compatibility). However, the “High fraction of fine grains” (12 μm on average) can still maintain a high intensity through the Hall-Petch effect, and the abnormal growth is only a local phenomenon. At the same time, the abnormally grown grains will lead to the decrease in grain boundary area, the weakening of electron scattering, and the increase in electrical conductivity. However, the dislocation density in large grains is low, and the stress concentration during deformation increases, may reduce fatigue properties (contradicting the ideal case of “Random grain boundaries retarding crack growth”).
5. Conclusions
This study systematically investigated the multilevel coupling mechanisms among composition, processing, microstructure, and properties in Al-Mg-Si alloys by varying the Si content (0.4–1.0 wt%) and applying a combined process of homogenization solution treatment-cold rolling/drawing-controlled annealing. With increasing Si content, the tensile strength of the Y-state wires increased Significantly from 190 to 291 MPa; however, the electrical conductivity decreased from 57.6% IACS to 52.1% IACS, accompanied by very low elongation. After annealing at 250 °C for 10 h, the R-state wires maintained high electrical conductivity (≥62.1% IACS) and good plasticity (elongation ≥ 22%), while the tensile strength remained at 105–137 MPa. The Al-1.0Si-Mg alloy exhibited the best overall performance. Elevated Si content noticeably enhanced the precipitation potential of the alloy. At 0.4% Si, the microstructure contained sparse, coarse precipitates, resulting in minimal precipitation strengthening (), the lowest strength (105 MPa), yet the highest electrical conductivity (62.9% IACS). IncreaSing the Si content to 1.0% intensified the precipitation driving force, refining the precipitates, and increasing their number density, which Significantly enhanced strength. Concurrently, the high Si content promoted sufficient solute dissolution, reducing lattice distortion and minimizing the loss of conductivity, which was only 0.2% IACS lower than the 0.4% Si alloy. The cold working process introduced a high dislocation density to produce the Y-state, which was responsible for its high strength but also led to high electrical resistivity. The annealing process was governed by competition between recovery, recrystallization, and precipitation. Short-time annealing (1 h) involved only recovery, causing negligible property changes. After 10 h at 250 °C, recrystallization was essentially complete, drastically reducing dislocation density, Numerous nanoscale precipitates, which are inferred to be β″ and Si-rich phases, provided substantial precipitation strengthening and purified the matrix, which reduced electron scattering. It is important to note that a direct quantification of the strengthening contributions, particularly from nanoscale precipitates, requires detailed Transmissions Electron Microscopy (TEM) investigation. Such analysis, while beyond the scope of this current work, is critical for future validation of the mechanistic models. Direct observation and confirmation of these nanoscale precipitates via transmission Electron Microscopy (TEM) will be a key objective of our future research. Under this optimal 250 °C/10 h window, the high-Si (1.0%) alloy developed a fine-grained recrystallized structure (average Size of ~11.2 μm), contributing to grain boundary strengthening (). Precipitates predominantly consisted of Si-rich nanophases (up to 39.55 wt% Si), which effectively scavenged Mg atoms from the solid solution. This high-Si + controlled annealing strategy successfully achieved a strength–conductivity synergy: accelerated precipitation kinetics reduced the solid–solution strengthening () but enhanced precipitation strengthening (), while recrystallization eliminated dislocation forests, collectively optimizing the performance balance. Ultimately, the Al-1.0Si-Mg alloy in the R-state demonstrated good synergy between strength and conductive properties, meeting the comprehensive performance requirements for power system wires. This offered a solution with direct engineering application value for substituting copper conductors, promoting the lightweight and low-carbon development of power systems.
