Article

3D Study of Microstructural Influences on Retained Austenite Transformation in Q&P 1180 Steel

by
Isaac Chelladurai
1,
Emily V. White
2,
Michael P. Miles
3,
Eric R. Homer
1,
Anil K. Sachdev
4 and
David T. Fullwood
1,*
1
Department of Mechanical Engineering, Brigham Young University, Provo, UT 84602, USA
2
Independent Researcher, West Allis, WI 53219, USA
3
Department of Manufacturing Engineering, Brigham Young University, Provo, UT 84602, USA
4
Global Research and Development, General Motors, Warren, MI 48092, USA
*
Author to whom correspondence should be addressed.
Crystals 2025, 15(12), 1015; https://doi.org/10.3390/cryst15121015
Submission received: 3 November 2025 / Revised: 19 November 2025 / Accepted: 21 November 2025 / Published: 25 November 2025

Abstract

Advanced TRIP steels offer an attractive combination of strength and ductility because of the transformation-induced plasticity (TRIP) phenomenon. The retained austenite (RA) embedded in quenched and partitioning (Q&P) 1180 steel provides vital ductility, relating to the propensity of these grains to transform under applied deformation. It is well known that the characteristics of the RA grains (size, shape, orientation, etc.) have a strong influence on their stability, but few studies consider the accurate 3-dimensional character of the grains, due to the cost of extracting 3D data. This study observes the characteristics of RA grains in Q&P 1180 steel before and after applying tensile deformation. EBSD maps of serial sectioned layers are reconstructed using DREAM3D. The influence of 3D morphology and other factors on transformation of RA is studied. Apart from relatively traditional metrics, a novel shear affinity factor is introduced as a metric to describe the ease of transformation for an RA grain. The 3D nature of the information collected allows accurate classification of grain shape into the traditional globular/spherical and lamellar/lath categories, along with disk and needle shapes, and enables quantification of the evolution of the shape distributions.

1. Introduction

Third-generation advanced high-strength steels (3GAHSS) are promising candidates for lightweight automotive structures due to their ideal combination of high strength and relatively large ductility. The recent development of quenched and partitioned (Q&P) 3GAHSS [1] promises a less expensive way to manufacture a new family of these advanced steels. Q&P steels have high strengths of up to 1400 MPa, and elongations of 16–18% under tension.
Q&P steels exhibit the TRIP (transformation-induced plasticity) phenomenon, via the transformation of austenite, retained in the microstructure, into martensite. The manufacturing process consists of complete austenitization of the steel followed by quenching below the martensite start temperature but above the martensite finish temperature. The final step of partitioning the carbon from the high concentrations in the martensite to the remaining austenite is accomplished by either keeping it at the quench temperature (one-step) or raising the temperature slightly (two-step) [2]. The increased level of carbon in the retained austenite allows it to become stable at room temperature [3]. Though TRIP steels are not new, the low cost of the Q&P steels warrants further microstructural development [4].
While the influence of the TRIP effect is generally seen to have a positive effect on material ductility and formability, the detailed relationships between the steel microstructure and the evolution of the TRIP effect are only partly understood. A guiding principle has been that a slow rate of retained austenite (RA) transformation throughout the deformation process is desirable to achieve ideal hardening rates and thereby obtain maximum ductility [5]. However, the optimal microstructure for obtaining such a controlled transformation is still under investigation and is needed to guide microstructural design of improved steels for automotive applications.
Previous research in this area has predominantly employed 2D characterization techniques to determine factors that play a significant role in the stability and resultant transformation rate of RA. The carbon content of the RA is one of these important factors; low carbon concentration in RA grains results in rapid transformation into martensite, while high carbon concentration makes them more stable [6,7]. Another important factor is generally agreed to be RA grain size, where larger-sized grains are known to transform faster than small grains. Similarly, lamellar-shaped RA grains are found to be more stable than globular RA grains [8,9]. With respect to the influence of the crystallographic orientation of the RA grain, the more aligned a {111} plane is with the plane of maximum shear, the easier the grain will transform [10]. Furthermore, the characteristics of neighboring grains can affect a grain’s likelihood of transformation; if an RA grain is surrounded by hard martensite laths, these may provide shielding against localized stresses that might cause transformation [11,12]. Finally, when the steel is strained at higher temperatures, there is a reduction in the fraction of RA that is transformed [13,14]. Of these factors, carbon content, RA grain size, and morphology are generally considered to be most influential on the TRIP effect. In this study we focus on the factors that are particularly amenable to a 3D EBSD study—i.e., 3D morphology and combined effects of morphological features with other factors such as crystal orientation. By performing serial sectioning and 3D reconstruction of Q&P 1180 steel for unstrained and tensile strained samples, correlations between morphology and transformation are identified in order.
Two types of RA grain morphology are typically identified in the literature, classified as lamellar and globular [4,15]. At low strains, microstructures with globular, or equiaxed, RA grains are shown to have higher work-hardening rates, due to the ease of transformation of the RA with this morphology; however, the material fails once the hardening capacity has been exhausted. On the other hand, microstructures with lamellar RA grains are shown to have more even work-hardening behavior across the range of deformation, arising from the desired slower transformation rate, and hence display improved ductility [15].
Observation of the different morphologies and orientations along with their behavior under deformation is most often accomplished by using 2D characterization techniques, potentially combining various approaches (for example [16,17]). It has been proposed that 2D techniques can be coupled with stereological approaches to arrive at 3D statistics of the structure [18]; but these approaches are typically limited to lower-order moments of microstructural distributions and are not able to predict the higher-order moments [19]. Hence, accurate instantiations that include grain morphology, local neighborhood information, and grain boundary network information cannot be accurately acquired using them.
This study arrives at 3D microstructures by reconstruction from stacked sets of 2D data following a similar approach to that proposed by Zaefferer et al. [20]. 3D EBSD is a relatively well-established technique that can be undertaken with focused ion beam [21] or mechanical serial sectioning [22]. The 2D data is serially captured by characterizing surfaces of different adjacent sections using EBSD in an SEM. Alignment of the slices can be problematic, but there have been several recent advances in this area [23]. The serial sectioning method is time and labor intensive but provides an accurate representation of the overall microstructure. Accurate 3D instantiations provide invaluable information about the RA grains that is not typically obtained from single 2D datasets. This data can then be combined and correlated with other orientation-based information.
Beyond morphology, RA grain orientation affects the stability of the grain (i.e., the propensity to transform). If an RA grain is oriented favorably, it can promote shear along a habit plane. It has been reported that as the RA subsequently transforms, it can be divided into packets of martensitic lath having the same habit plane. Each packet can further be subdivided into laths having the same crystallographic orientation [24,25]. The crystallographic orientation relationships (OR) between the RA and resultant martensite packets are defined using the Kurdjumov–Sachs (K-S) relationship in this analysis [26]. The K-S relationship is one of the most frequently cited ORs for relating FCC and BCC crystal structures, and has been found to be prevalent in low-carbon steels [27]. This OR defines 24 different variants of lath martensite. Assuming this relationship between austenite and martensite, Morito et al. [28,29,30] obtained the transformation strain for each martensite variant using the phenomenological theory of martensite crystallography developed by Kelly [31]. Based on Morito’s work, the habit plane of (0.497 0.711 0.497) and transformation shear direction of [−0.234 0.662 −0.712] were identified and used in this analysis. The directionality of RA grains in the unstrained and strained samples, with respect to the loading direction, is analyzed along with its interdependence with the 3D microstructure morphology described above.

2. Materials and Methods

The Q&P 1180 steel used in this study was manufactured by Bao Steel, Shanghai, China, for General Motors Lightweight metals research group. This steel has a chemical composition consisting of 0.19% C, 2.8% Mn, 1.6% Si and Fe, with trace amounts of Cr, Mo, Ni, Ti, and Al. An ASTM E8 type tensile sample was cut from a 1 mm thick rolled sheet metal such that the rolling direction of the sheet was perpendicular to the applied loading direction. The sample was subjected to uniaxial tension to ~8.4% strain. From a previous study, this was noted to be a strain level at which there is significant partial transformation of the RA grains initially present in the microstructure [32].
Samples from the deformed dog bone and from unstrained material were embedded in epoxy and polished manually. Polishing was accomplished using a LECO® semi-automatic polisher (LECO, St. Joseph, MI, USA) with silicon carbide papers of grit sizes 600, 800, and 1200. The final polishing was performed with 1 µm colloidal silica, which was then quickly washed with ethanol, soap and water to prevent surface staining. After the initial polish process, conical fiducial marks were applied to the surface of both samples using a Vickers micro-hardness tester to mark 100 × 100 µm2 square areas where the EBSD scans were to be performed. The depth of the impression was measured using a Keyence 3D laser interferometer, allowing the amount of material removed between each scan to be determined during subsequent serial sectioning. EBSD was performed over an area of 40 × 40 µm2 with a step size of 0.08 µm using a Zeiss Genesis FIB-SEM (focused ion beam—scanning electron microscope, Zeiss, Maple Grove, MN, USA) and an EDAX® EBSD data acquisition system (EDAX, Mahwah, NJ, USA). The microscope was operated at 20 kV voltage, and EBSD data was captured at 2 × 2 binning. Analysis of the EBSD data was performed using the EDAX OIM Analysis® software package, version 8.0. Any data point with a confidence interval less than 0.1 was removed to reduce the noise in the data collected. This process of polishing, measuring the depth of the fiducial, and collection of EBSD data was repeated 9 times in two regions on the unstrained sample (18 sections total) and 16 times in one region of the strained sample. The total depth of the 3-dimensional volume elements, calculated using a Keyence 3D laser interferometer (Keyence, Itasca, IL, USA), was 1.529 µm and 1.309 µm for the two locations in the unstrained sample, with an average of 170 nm and 150 nm removed between each section in the two locations, respectively. For the strained sample, 3.24 µm of material was removed at an average of 173 nm between each section. The single volume captured for the strained sample (compared with two volumes observed for the unstrained material) was made possible, as the technique was improved during the study. The total volume was selected to be approximately the same for both strained and unstrained, with a similar number of martensite grains in each case.
The next step of the process involved taking the individual 2D EBSD data and stacking each layer to reconstruct an accurate 3D microstructure using DREAM3D version 6.0.0 [33,34]. DREAM3D also identifies a range of microstructural attributes that can give insights into the material behavior [35,36]. The statistical differences in the 3D morphological and other attributes before and after straining are extracted to give insights into correlations between microstructure and likelihood of RA transformation.
When DREAM3D reconstructs an RA grain/feature, it represents its shape as an ellipsoid where the major axis is labelled as the a-axis and the minor axis the c-axis; the length of the a-axis is greater than the length of the b-axis, which is greater than the length of the c-axis. The resultant aspect ratios, b/a and c/b, can be used to classify grain shape. For the purpose of the current study, RA grain shapes are classified as seen in Figure 1.
In the 2D EBSD dataset and 3D reconstruction, many RA grains were too small for accurate shape determination. The resolution in the x-y surface plane was 0.08 µm for both unstrained and strained datasets. The resolution along the z axis (i.e., the average distance between the sections) was about 165 nm for the unstrained data, and about 173 nm for the strained data. Thus, one pixel of data in such a volumetric representation is approximately 0.0011 µm3. The minimum size of RA grains in the actual reconstructed dataset is one pixel, which contains no useful information concerning the shape of the grain. Hence, to ensure the accuracy of the grain shape metrics, we introduced a size threshold of 125 (53) pixels for a grain. As such, the minimum size for a reconstructed RA grain was 0.14 µm3, while the average RA grain volume (across all samples) was 0.41 µm3.

3. Results

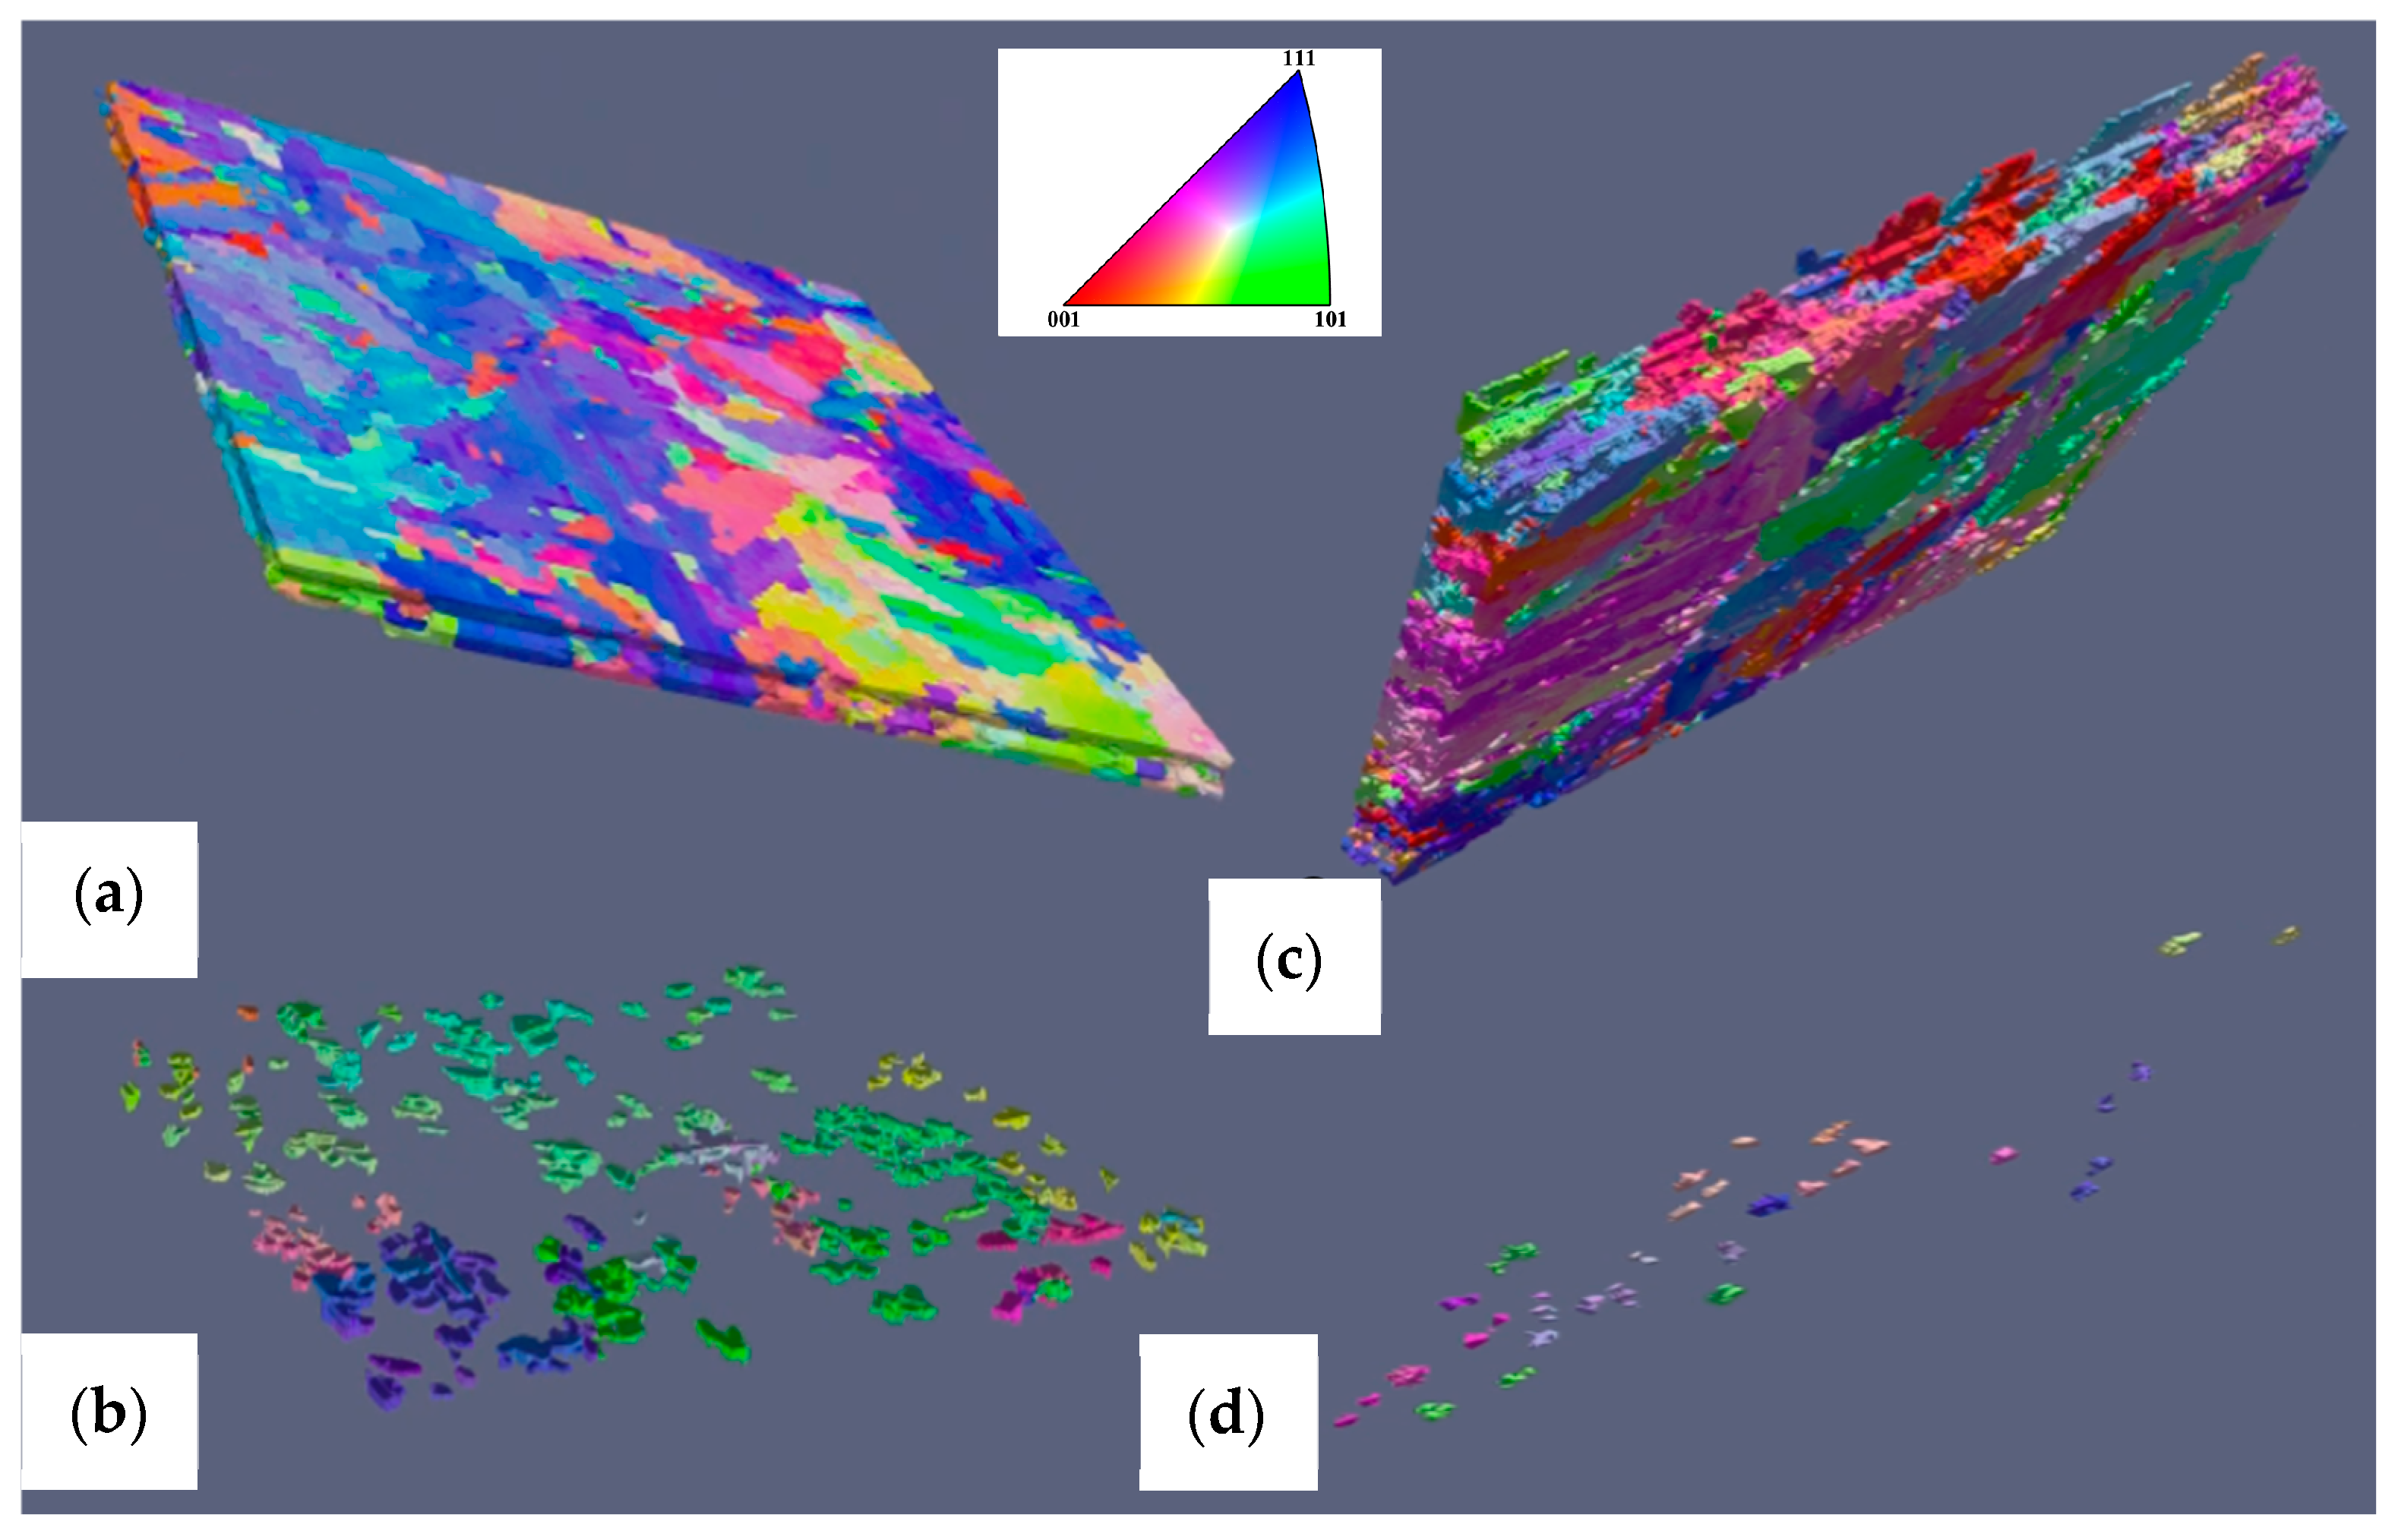
Using the 3D reconstruction, the number of RA grains were identified within each sample using the size requirements described above. An image of this reconstruction can be seen in Figure 2, where both the strained and unstrained samples are shown as well as an image with only the RA grains within each. The number of RA grains was determined to be the following: 358 for the unstrained and 27 for the strained samples. While the number of characterized grains in the strained sample seems small, the resultant distributions of morphology metrics are well represented by the set, as will be seen. Figure 3 illustrates the distribution of grain volumes for the entire set of unstrained RA grains, as well as for the subset of unstrained RA grains within the same size range as the strained sample (272 of the original 358 grains). The latter distribution was compared with the volume distribution from the strained sample, and the results look remarkably similar. A K-S test comparing the two distributions resulted in a p value of 0.29; i.e., the distribution of volumes from the strained sample can be considered as coming from the same distribution as that of the unstrained sample.
The volume distributions indicate that larger grains all transform at this level of strain (we note that larger grains might have been detected if a larger sample volume had been taken; nevertheless, the observed distribution does indicate that the probability of finding a significant number of larger grains is small). However, it seems puzzling that the smaller grains, which reduced in number from 272 to 27, still have the same volume distribution. One potential scenario is that the smaller grains transform evenly across the size distribution—which is odd, given that grains above 0.55 μm3 all transformed (at least to some extent); it would seem more likely that the larger of the small grains would also transform. Alternatively, it may be the case that all previous small grains transformed, and the remnants of partially transforming larger grains had this characteristic distribution of volume fractions. It is commonly assumed that smaller RA grains tend to transform first (e.g., [6,8]); a recent in situ study of Q&P 1180 steel demonstrated that smaller grains transformed first, but were statistically replaced with the remnants of transforming larger grains [37].
In terms of the shapes of RA grains, Figure 4 shows the distributions of RA grains across the shape categories shown in Figure 1; again, the distribution of strained RA grains is compared with the unstrained RA grains within the same size range. The biggest change in the distribution relates to the fairly balanced number of lath- and needle-shaped grains in the unstrained sample, which changes to a significantly higher proportion of needle-shaped grains in the strained sample. The observation is interesting in light of previous observations that lamellar grains transform more slowly than other shapes (at least, more slowly than globular shapes) [15]; presumably the referenced study included both needle and lath shapes in the lamellar category. The p-value for a K-S test on the two distributions was 0.02, indicating statistically different distributions. Given the relatively close relationship between the two shapes, this may not be a hugely significant observation. Nevertheless, it demonstrates the value of obtaining the 3D characteristics of the grains for the comparison.
In terms of the numerical values of the axes ratios for the equivalent ellipses relating to the RA grains, the distributions of b/a ratios are almost equivalent (p = 0.66); the distributions of c/a ratios are almost significantly different (p = 0.06); but the distributions of the c/b ratios are significantly different (p = 0.004), with a shift to the right between the unstrained and strained samples (Figure 5), associated with more acicular-shaped grains.
A final example of information that requires 3D characterization involves the direction of the main (‘a’) axis of the equivalent ellipse for each RA grain. Figure 6 shows the distribution of misorientation angle between this main axis and the direction of tensile loading for the smaller RA grains ( 0.51 μm3) for both samples. The distributions are clearly very similar, with a maximum frequency of misorientation at about 70°. The p-value from the K-S test was 0.40, indicating no significant difference between the distributions from the two samples.
The statistics for the average misorientation between an RA grain and its neighbors are also improved by the 3D characterization approach, in the sense that more neighbors are sampled for each grain. The distributions for the unstrained and strained samples are given in Figure 7 for the smaller grains. Again, the distributions are similar, with the most common value being between 40° and 50° in both cases, and the second most common value lying between 30° and 40°. However, the K-S p-value for the two distributions is 0.04; hence the distributions are statistically different.
Finally, we consider two RA grain characteristics that do not require the 3D characterization, but that both distinguish the initial and final sets of RA grains. The first involves the maximum Schmid factor for the available slip systems. Figure 8 compares the distributions for small unstrained sample grains and the strained sample RA grains. There is a dramatic drop in the maximum Schmid factor for the observed RA grains. The K-S p-value when comparing the two distributions is 1 × 10⁻¹⁰, indicating significantly different distributions. As for the discussion relating to distributions of grain volume, this could be interpreted in different ways. It could be that small grains with high Schmid factors transformed, leaving behind those with low Schmid factors. On the other hand, it could be that most small grains have transformed completely, while larger grains with low Schmid factors have only partially transformed, leaving remnant small RA grains.
Figure 9 considers a similar metric, in what will be called the shear affinity factor (SAF). It quantifies the propensity for shear on the available habit planes, rather than the slip planes, based upon the assumption that a higher shear load on the habit plane increases the likelihood of transformation. This Schmid-like factor for all 24 variants in the K-S orientation relationship was calculated and the maximum value reported as the SAF for the RA grain as follows:
s h e a r   a f f i n i t y   f a c t o r =   max i = 1 : 24 c o s θ i · c o s λ i   ,
where i is the number of a given variant, θ the angle of the habit plane, and λ is shape strain direction with the tensile axis of the sample. As for the maximum Schmid factor discussion, the SAF distribution for the unstrained sample lies significantly above the post-strain distribution. The p-value for the K-S test is 6 × 10⁻⁵, indicating significant differences in the statistics for the two datasets.

4. Discussion

Table 1 summarizes the RA grain attributes of most interest from the 3D characterization, along with the p-value from a K-S test comparing the distribution for small grains (<0.51 μm3) in the unstrained sample with RA grains in the strained sample (which are also in the same size range). Key differences can be seen in distributions relating to grain shape (specifically, an increase in needle-shaped grains, and commensurate drop in number of lath-shaped grains), which is also reflected in the shift to the right in the c/b distribution; the change in distribution for average misorientation with neighbors is slightly significant, although visually the main trends are the same, while the shifts towards lower maximum Schmid factor and shear affinity factor are both very significant.
When combined with the results from Adams et al. [37] on the same material, it appears that small grains transform first, but are statistically replaced by the remnants of large grains (this was observed in the Adams paper via in situ testing). The larger grains that don’t fully transform generally have lower maximum Schmid factors and SAFs, and tend to leave needle-shaped RA remnants. The SAF, introduced to capture the resolved stress on the habit plane (associated with the transformation process), does not appear to be better correlated with the transformation process than the original Schmid factor (p-values for both of them are very small).

Potential Bias in the Data

The identification of accurate correlations between microstructural morphology/features and RA transformation depends upon obtaining an unbiased set of statistics from the unstrained and strained samples. Many of the RA grains in the 3D dataset contact one of the surfaces of the 3D volume, indicating that information is missing for part of the grain. Within the reconstructed element, three fourths of the RA grains touch a surface for the unstrained sample, and for the strained sample two thirds of the reconstructed grains touch a surface. As such, an inherent bias may be present in the dataset due to the cropping of gains by the surfaces. Most of the c-axes align closely with the through thickness direction; the average angle from the c-axis to the through thickness was 12.7° across all strained and unstrained samples. The distribution of both the a-axis and c-axis lengths for both samples was used to understand the impact of this bias on the analysis. One would expect that the grains touching the surface would potentially have shorter axes lengths due to the cropping. As seen in Figure 10, the distributions of lengths of RA grains that touch the surface does not significantly move to the left (i.e., indicating smaller/cropped grains) compared with the lengths of RA grains not touching the surface in both the a-axis and c-axis cases. Presumably, most grains that are significantly cropped by the presence of the surface subsequently fall below the size required to remain in the dataset.

5. Conclusions

Two snapshots of 3D grain characteristics have been analyzed for Q&P 1180 steel, before and after applying tensile strain. While individual grains could not be tracked, leaving uncertainty in the analysis of the resultant statistics, when combined with a recent in situ study of the same material, the following clear conclusions can be made:
  • Over 90% of RA grains had transformed after application of 8.4% tensile strain.
  • While small RA grains transform first (according to [37]), these grains are statistically replaced by the remnants of partially transformed larger RA grains—and, as observed in this study, more commonly from the remnants of larger grain with lower maximum Schmid factor and lower shear affinity factor. These observations also indicate that RA grains with high maximum Schmid factor and SAF are more likely to both transform and to fully transform.
  • The shear affinity factor, defined in terms of resolved stress onto the habit planes, rather than the slip planes, was introduced as a potential better indicator of likelihood of transformation than the regular Schmid factor. However, the statistics do not indicate a better correlation with the likelihood of transformation.
  • The size distribution across the range of smaller grains (<0.51 μm3) remained approximately constant between the unstrained and the strained samples.
  • Similarly, the fractions of spherical (or ‘globular’) and disk-shaped small grains remained relatively constant; but the relative ratio of lath- and needle-shaped grains changed significantly, with a marked upward trend in the needle-shaped grain population.
  • The distribution of misorientation of the major axis of the best-fit ellipse from the tensile direction remained constant after straining, and the average misorient from neighbors of RA grains was most commonly in the range of 40–50° before and after straining, potentially indicating that this misorientation metric is not a significant contributor to the propensity to transform.
The 3D study has provided new insights, with observations relating to volume, shape, and alignment not readily accessible from only a 2D study.
We note that the number of RA grains in the strained sample is relatively small (27 that were deemed large enough for analysis), which may affect the results; nevertheless, the comparisons of pre- and post-strain morphology distributions, which are often statistically indistinguishable, indicate that the observed grains appear to be reasonably representative. Future studies could also analyze the same variables under different loading conditions, as uniaxial tension is the least effective loading in transforming RA grains, according to one source [32]. Understanding the physical relation between morphology and loading conditions could help reveal additional relationships necessary to design an optimal microstructure for steels with both high strength and high ductility.

Author Contributions

Conceptualization, A.K.S., I.C. and D.T.F.; methodology, I.C.; formal analysis, I.C. and D.T.F.; resources, M.P.M., A.K.S. and D.T.F.; data curation, I.C. and D.T.F.; writing—original draft preparation, I.C.; writing—review and editing, E.V.W. and D.T.F.; visualization, D.T.F. and E.V.W.; supervision, D.T.F.; project administration, M.P.M., E.R.H., A.K.S. and D.T.F.; funding acquisition, M.P.M., E.R.H., A.K.S. and D.T.F. All authors have read and agreed to the published version of the manuscript.

Funding

This work was supported by the National Science Foundation grants DMR 1507095 and CMMI 2147126.

Data Availability Statement

Data is available upon request from the corresponding author.

Conflicts of Interest

Anil K. Sachdev was employed by the Global Research and Development, General Motors. The remaining authors declare that the research was conducted in the absence of any commercial or financial relationships that could be construed as a potential conflict of interest.

Abbreviations

The following abbreviations are used in this manuscript:
RARetained austenite
TRIPTransformation-induced plasticity
EBSDElectron backscatter diffraction
Q&PQuenched and partitioned
3GAHSSThird generation advanced high-strength steels
K-SKurdjumov–Sachs
SAFShear affinity factor
OROrientation relationships
SEMScanning electron microscopy
FIB-SEMFocused ion beam—scanning electron microscope
IPFInverse pole figure

References

  1. Edmonds, D.V.; He, K.; Rizzo, F.C.; De Cooman, B.C.; Matlock, D.K.; Speer, J.G. Quenching and partitioning martensite—A novel steel heat treatment. Mater. Sci. Eng. A-Struct. 2006, 438, 25–34. [Google Scholar] [CrossRef]
  2. Speer, J.G.; Matlock, D.K.; Wang, L.; Edmonds, D.V. Quenched and Partitioned Steels. Ref. Modul. Mater. Sci. Mater. Eng. 2014, 1, 217–225. [Google Scholar]
  3. Santofimia, M.J.; Zhao, L.; Sietsma, J. Overview of Mechanisms Involved During the Quenching and Partitioning Process in Steels. Metall. Mater. Trans. A 2011, 42, 3620–3626. [Google Scholar] [CrossRef]
  4. Diego-Calderon, I.d.; Sabirov, I.; Molina-Aldareguia, J.M.; Fojer, C.; Thiessen, R.; Petrov, R.H. Microstructural design in quenched and partitioned (Q&P) steels to improve their fracture properties. Mater. Sci. Eng. A 2016, 657, 136–146. [Google Scholar] [CrossRef]
  5. Chiang, J.; Boyd, J.D.; Pilkey, A.K. Effect of microstructure on retained austenite stability and tensile behaviour in an aluminum-alloyed TRIP steel. Mater. Sci. Eng. A-Struct. 2015, 638, 132–142. [Google Scholar] [CrossRef]
  6. Shen, Y.F.; Qiu, L.N.; Sun, X.; Zuo, L.; Liaw, P.K.; Raabe, D. Effects of retained austenite volume fraction, morphology, and carbon content on strength and ductility of nanostructured TRIP-assisted steels. Mater. Sci. Eng. A-Struct. 2015, 636, 551–564. [Google Scholar] [CrossRef]
  7. De Knijf, D.; Fojer, C.; Kestens, L.A.I.; Petrov, R. Factors influencing the austenite stability during tensile testing of Quenching and Partitioning steel determined via in-situ Electron Backscatter Diffraction. Mater. Sci. Eng. A-Struct. 2015, 638, 219–227. [Google Scholar] [CrossRef]
  8. Xiong, X.C.; Chen, B.; Huang, M.X.; Wang, J.F.; Wang, L. The effect of morphology on the stability of retained austenite in a quenched and partitioned steel. Scr. Mater. 2013, 68, 321–324. [Google Scholar] [CrossRef]
  9. Jimenez-Melero, E.; van Dijk, N.H.; Zhao, L.; Sietsma, J.; Offerman, S.E.; Wright, J.P.; van der Zwaag, S. Martensitic transformation of individual grains in low-alloyed TRIP steels. Scr. Mater. 2007, 56, 421–424. [Google Scholar] [CrossRef]
  10. Tirumalasetty, G.K.; van Huis, M.A.; Kwakernaak, C.; Sietsma, J.; Sloof, W.G.; Zandbergen, H.W. Deformation-induced austenite grain rotation and transformation in TRIP-assisted steel. Acta Mater. 2012, 60, 1311–1321. [Google Scholar] [CrossRef]
  11. Jacques, P.J.; Ladriere, J.; Delanny, F. On the influence of interactions between phases on the mechanical stability of retained austenite in transformation-induced plasticity multiphase steels. Metall. Mater. Trans. A Phys. Metall. Mater. Sci. 2001, 32, 2759–2768. [Google Scholar] [CrossRef]
  12. Li, W.-S.; Gao, H.-Y.; Nakashima, H.; Hata, S.; Tian, W.-H. In-situ EBSD study of deformation behavior of retained austenite in a low-carbon quenching and partitioning steel via uniaxial tensile tests. Mater. Charact. 2016, 118, 431–437. [Google Scholar] [CrossRef]
  13. Wang, X.D.; Huang, B.X.; Rong, Y.H.; Wang, L. Microstructures and stability of retained austenite in TRIP steels. Mater. Sci. Eng. A-Struct. 2006, 438, 300–305. [Google Scholar] [CrossRef]
  14. Blonde, R.; Jimenez-Melero, E.; Zhao, L.; Wright, J.P.; Bruck, E.; van der Zwaag, S.; van Dijk, N.H. High-energy X-ray diffraction study on the temperature-dependent mechanical stability of retained austenite in low-alloyed TRIP steels. Acta Mater. 2012, 60, 565–577. [Google Scholar] [CrossRef]
  15. Chiang, J.; Lawrence, B.; Boyd, J.D.; Pilkey, A.K. Effect of microstructure on retained austenite stability and work hardening of TRIP steels. Mater. Sci. Eng. A-Struct. 2011, 528, 4516–4521. [Google Scholar] [CrossRef]
  16. Haidemenopoulos, G.N.; Constantinou, M.; Kamoutsi, H.; Krizan, D.; Bellas, I.; Koutsokeras, L.; Constantinides, G. Probing the Evolution of Retained Austenite in TRIP Steel During Strain-Induced Transformation: A Multitechnique Investigation. JOM 2018, 70, 924–928. [Google Scholar] [CrossRef]
  17. Burja, J.; Lindič, J.; Batič, B.Š.; Nagode, A. Temperature-Dependent Martensitic Transformation in Cold-Rolled AISI 304 Stainless Steel. Crystals 2025, 15, 652. [Google Scholar] [CrossRef]
  18. Russ, J.C.; DeHoff, R.T. Practical Stereology, 2nd ed.; Kluwer Academic/Plenum: New York, NY, USA, 2000; p. 381. [Google Scholar]
  19. Dehoff, R.T. Quantitative Serial Sectioning Analysis—Preview. J. Microsc. 1983, 131, 259–263. [Google Scholar] [CrossRef]
  20. Zaefferer, S.; Elhami, N.-N.; Konijnenberg, P. 18—Electron backscatter diffraction (EBSD) techniques for studying phase transformations in steels. In Phase Transformations in Steels; Pereloma, E., Edmonds, D.V., Eds.; Woodhead Publishing: Cambridge, UK, 2012; Volume 2, pp. 557–587. [Google Scholar]
  21. Groeber, M.A.; Haley, B.K.; Uchic, M.D.; Dimiduk, D.M.; Ghosh, S. 3D reconstruction and characterization of polycrystalline microstructures using a FIB-SEM system. Mater. Charact. 2006, 57, 259–273. [Google Scholar] [CrossRef]
  22. Sun, Z.; Tsai, S.-P.; Konijnenberg, P.; Wang, J.-Y.; Zaefferer, S. A large-volume 3D EBSD study on additively manufactured 316L stainless steel. Scr. Mater. 2024, 238, 115723. [Google Scholar] [CrossRef]
  23. Britton, T.B.; Jiang, J.; Guo, Y.; Vilalta-Clemente, A.; Wallis, D.; Hansen, L.N.; Winkelmann, A.; Wilkinson, A.J. Tutorial: Crystal orientations and EBSD—Or which way is up? Mater. Charact. 2016, 117, 113–126. [Google Scholar] [CrossRef]
  24. Marder, A.R.; Krauss, G. Morphology of Martensite in Iron-Carbon Alloys. ASM Trans. 1967, 60, 651–660. [Google Scholar]
  25. Marder, J.M.; Marder, A.R. Morphology of Iron-Nickel Massive Martensite. ASM Trans. 1969, 62, 1–10. [Google Scholar]
  26. Kral, M.V. Proeutectoid ferrite and cementite transformations in steels. In Phase Transformation in Steels: Fundamentals and Diffusion-Controlled Transformations; Pereloma, E.V., Edmonds, D.V., Eds.; Woodhead Publishing Series in Metals and Surface Engineering; Woodhead Publishing Ltd.: Cambridge, UK, 2012; Volume 1, pp. 225–275. [Google Scholar]
  27. Kelly, P.M.; Jostsons, A.; Blake, R.G. The Orientation Relationship between Lath Martensite and Austenite in Low-Carbon, Low-Alloy Steels. Acta Metall. Mater. 1990, 38, 1075–1081. [Google Scholar] [CrossRef]
  28. Morito, S.; Tanaka, H.; Konishi, R.; Furuhara, T.; Maki, T. The morphology and crystallography of lath martensite in Fe-C alloys. Acta Mater. 2003, 51, 1789–1799. [Google Scholar] [CrossRef]
  29. Morito, S.; Saito, H.; Ogawa, T.; Furuhara, T.; Maki, T. Effect of austenite grain size on the morphology and crystallography of lath martensite in low carbon steels. ISIJ Int. 2005, 45, 91–94. [Google Scholar] [CrossRef]
  30. Morito, S.; Adachi, Y.; Ohba, T. Morphology and Crystallography of Sub-Blocks in Ultra-Low Carbon Lath Martensite Steel. Mater. Trans. 2009, 50, 1919–1923. [Google Scholar] [CrossRef]
  31. Kelly, P.M. Crystallography of Lath Martensite in Steels. Mater. Trans. JIM 1992, 33, 235–242. [Google Scholar] [CrossRef]
  32. Cramer, J.; Adams, D.; Miles, M.P.; Fullwood, D.T.; Homer, E.R.; Brown, T.; Mishra, R.K.; Sachdev, A. Effect of strain path on forming limits and retained austenite transformation in Q&P 1180 steel. Mater. Sci. Eng. A-Struct. 2018, 734, 192–199. [Google Scholar] [CrossRef]
  33. Brahme, A.; Alvi, M.H.; Saylor, D.; Fridy, J.; Rollett, A.D. 3D reconstruction of microstructure in a commercial purity aluminum. Scr. Mater. 2006, 55, 75–80. [Google Scholar] [CrossRef]
  34. Saylor, D.M.; Fridy, J.; El-Dasher, B.S.; Jung, K.Y.; Rollett, A.D. Statistically representative three-dimensional microstructures based on orthogonal observation sections. Metall. Mater. Trans. A 2004, 35, 1969–1979. [Google Scholar] [CrossRef]
  35. Rollett, A.D.; Campman, R.; Saylor, D. Three dimensional microstructures: Statistical analysis of second phase particles in AA7075-T651. Mater. Sci. Forum 2006, 519–521, 1–10. [Google Scholar] [CrossRef]
  36. Wang, S.Y.; Holm, E.A.; Suni, J.; Alvi, M.H.; Kalu, P.N.; Rollett, A.D. Modeling the recrystallized grain size in single phase materials. Acta Mater. 2011, 59, 3872–3882. [Google Scholar] [CrossRef]
  37. Adams, D.; Behling, M.; Miles, M.P.; Homer, E.R.; Sachdev, A.K.; White, E.V.; Fullwood, D.T. Characterization of the Factors Influencing Retained Austenite Stability in Q&P Steels via In-situ EBSD. Met. Trans. A 2023, 54, 1355–1363. [Google Scholar]
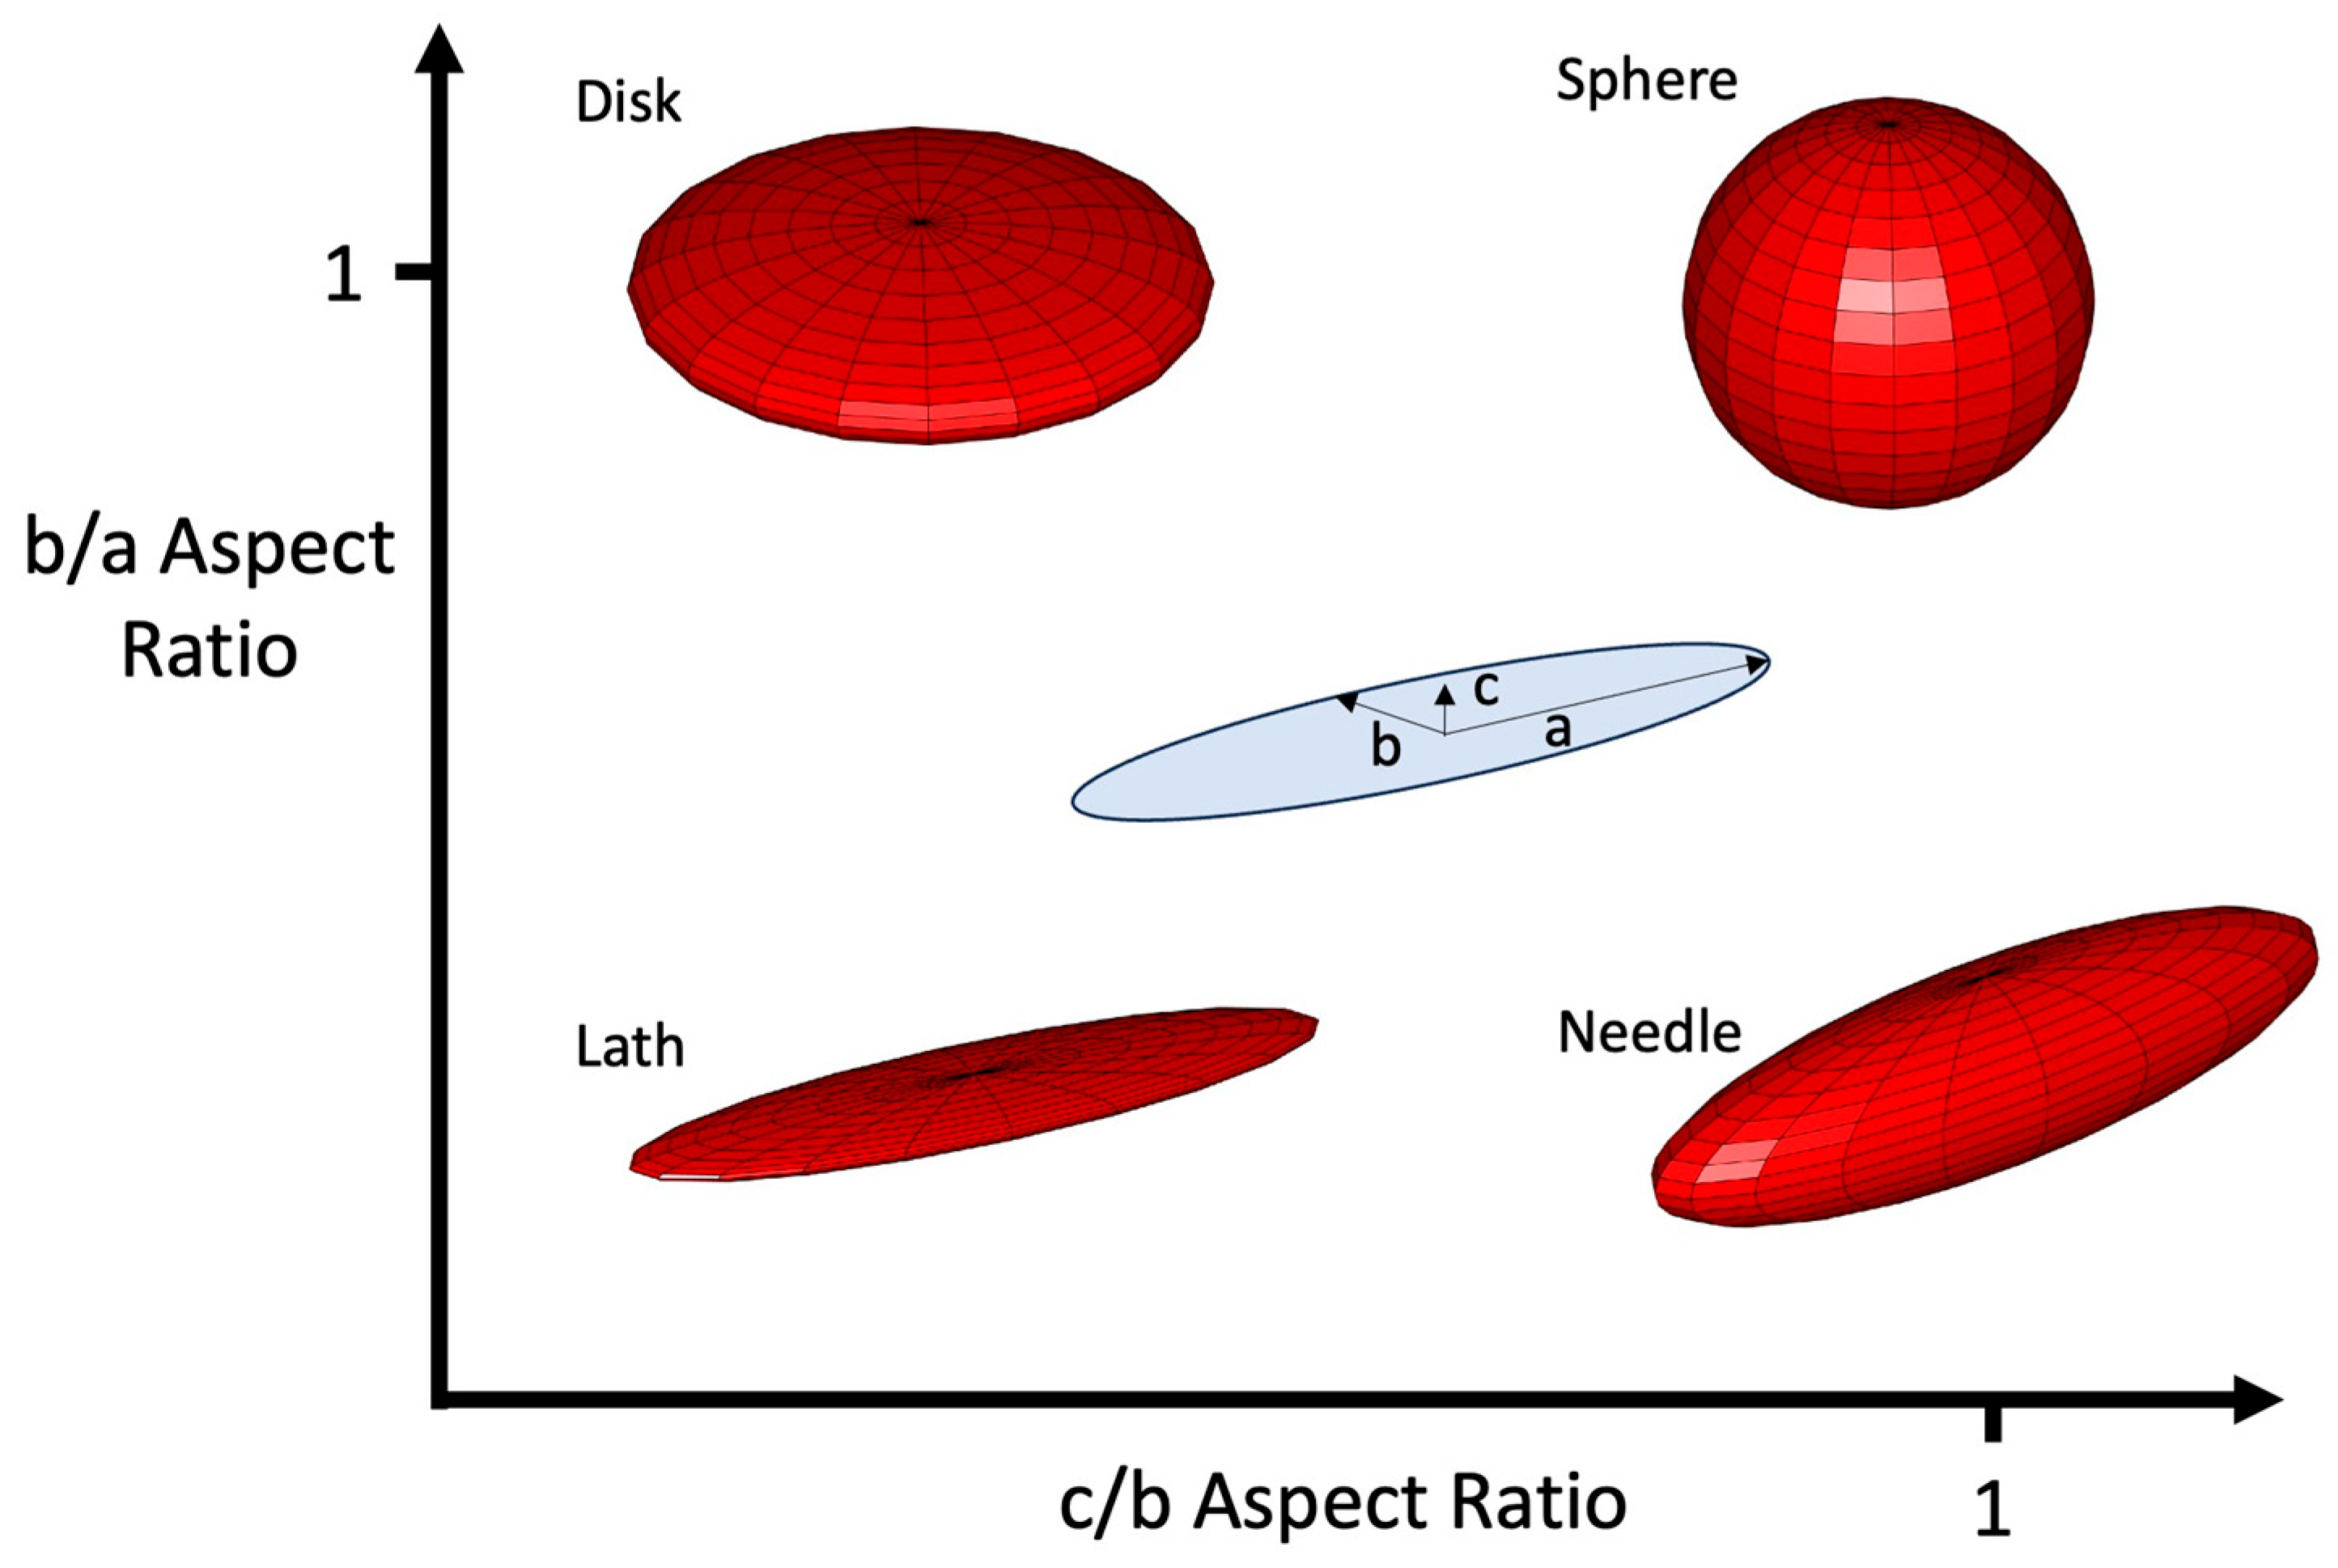
Figure 1. Morphological classification of RA grains based on aspect ratios. The boundaries between the different shape classifications are assumed to occur at an aspect ratio of 0.5.
Crystals 15 01015 g001
Figure 2. DREAM3D reconstructions of both the strained and unstrained samples: (a) The inverse pole figure (IPF) map of one region of the unstrained sample with all grains shown; (b)The RA grains from the same region of the unstrained sample; (c) The IPF of a region of the strained sample (all grains); (d) The RA grains from the same region of the strained sample (before filtering).
Crystals 15 01015 g002
Figure 3. Volume distributions for RA grains from the following: (a) the entire unstrained sample; (b) the smaller RA grains from the same sample; (c) the strained sample.
Crystals 15 01015 g003
Figure 4. Distribution of RA grain shapes (according to the classification scheme in Figure 1) for the following: (a) unstrained sample, which only includes the 272 RA grains in the same size range as those in the strained sample; (b) strained sample.
Crystals 15 01015 g004
Figure 5. Distributions of (a) b/a; (b) c/a; (c) c/b ratios for RA grains in the size range of 0–0.51 μm3 for unstrained (top) and strained (bottom) samples.
Crystals 15 01015 g005
Figure 6. Distributions of misorientation of the grain major axis from the tensile direction for RA grains in the size range of 0–0.51 μm3 for the following: (a) unstrained; (b) strained samples.
Crystals 15 01015 g006
Figure 7. Distributions of average misorientation of neighbor grains for RA grains in the size range of 0–0.51 μm3 for the following: (a) unstrained; (b) strained samples.
Crystals 15 01015 g007
Figure 8. Distributions of maximum Schmid factor for RA grains in the size range of 0–0.51 μm3 for the following: (a) unstrained; (b) strained samples.
Crystals 15 01015 g008
Figure 9. Distributions of SAF for RA grains in the size range of 0–0.51 μm3 for: (a) unstrained; (b) strained samples.
Crystals 15 01015 g009
Figure 10. Distributions of a-axis length/2 (a) and c-axis length/2 (b) for all RA grains in the unstrained (top) and strained (bottom) samples.
Crystals 15 01015 g010
Table 1. RA grain attributes extracted from DREAM3D with their p-value from a K-S test.
RA Grain Attributesp-Value
Volume of grain0.29
Grain shape0.02
Aspect ratio b/a0.66
Aspect ratio c/a0.06
Aspect ratio c/b0.004
Misorientation of major axis from tensile direction0.40
Average misorientation from neighboring grains0.04
Maximum Schmid factor1 × 10−10
Shear affinity factor6 × 10−5
Disclaimer/Publisher’s Note: The statements, opinions and data contained in all publications are solely those of the individual author(s) and contributor(s) and not of MDPI and/or the editor(s). MDPI and/or the editor(s) disclaim responsibility for any injury to people or property resulting from any ideas, methods, instructions or products referred to in the content.