Article

Particle Size-Dependent Mechanical Behaviors of Disordered Copper Nanoparticle Assemblies: A Molecular Dynamics Study

1
School of Science, Xi’an University of Architecture and Technology, Xi’an 710055, China
2
School of Materials Engineering, Jiangsu University of Technology, Changzhou 213001, China
*
Author to whom correspondence should be addressed.
Crystals 2025, 15(12), 1007; https://doi.org/10.3390/cryst15121007 (registering DOI)
Submission received: 22 October 2025 / Revised: 17 November 2025 / Accepted: 20 November 2025 / Published: 23 November 2025
(This article belongs to the Section Inorganic Crystalline Materials)

Abstract

The mechanical behavior of nanoparticle assemblies depends strongly on particle size, yet the underlying mechanisms remain insufficiently understood. In present study, we employ a scheme combining discrete element method (DEM) and molecular dynamics (MD) simulations to examine size-dependent strength and deformation in disordered copper nanoparticle assemblies. Granular packings generated by DEM were transformed into atomic models and subjected to uniaxial compression in MD simulations. Assemblies composed of nanoparticles with radius smaller than ~2.5 nm fully densify during relaxation, forming nanopolycrystalline solids, whereas larger particles preserve porous architectures. This structural divergence governs subsequent deformation. Small-particle assemblies deform through grain boundary migration and grain growth, exhibiting an inverse Hall–Petch-type strength dependence. In contrast, large-particle assemblies deform primarily via interparticle contact evolution and densification, with strength conforming to a Gibson–Ashby-type prediction. A scaling law captures the strength variation across size range in this regime. These results establish the competition between surface energy-driven densification and contact-dominated deformation as the controlling factor in the mechanical response of nanoparticle assemblies, providing guidance for designing nanoparticle-based materials with tailored mechanical performance.

1. Introduction

Metallic nanoparticle assemblies (NPAs) represent an emerging class of materials whose properties stem not only from the intrinsic features of individual nanoparticles but also from their collective organization. By tailoring interparticle interactions and packing configurations, nanoparticles can form ordered superlattices or disordered aggregates that exhibit distinctive electrical, optical, and mechanical behaviors [1,2,3]. Among these, mechanical performance is of particular importance, as it determines the structural reliability and functional stability of NPAs in applications such as flexible devices, sensors, coatings, and nanocomposites [4,5]. For examples, copper NPAs are widely used in such fields as advanced electronics packaging [6,7], printing inks to form conduct lines [8], chip interconnects [9], and current collectors in battery [10], where their mechanical robustness is essential for device durability and performance. Unlike conventional materials, the mechanical response of NPAs arises from complex interactions at particle-particle interfaces, surface adhesion, and collective deformation processes [11,12]. To gain a fundamental understanding of these behaviors, it is necessary to first examine how particle size influences the mechanical response at the single-nanoparticle level, as these intrinsic size effects ultimately underpin the macroscopic behavior of nanoparticle assemblies [13].
Particle size plays a decisive role in shaping the mechanical characteristics of NPAs. For individual nanoparticles, it is well established that their elastic modulus [14,15], yield strength [16,17] and hardness [18] are size-dependent, which originate from such factors as lower density of dislocations and defect sources [19,20], surface stress effects [14], and geometric confinement effects [21]. When these nanoparticles assemble into a continuous network, their size governs not only the intrinsic material properties, but also the geometry of the assembly, affecting the coordination number, interparticle contact area, and packing density [22,23]. These structural variations in turn modulate the overall load transfer efficiency and deformation modes within the assembly [12]. Yet, despite the intuitive link between particle size and mechanical response, the extent and nature of this dependence at the assembly level remain poorly understood.
Existing studies on NPAs have largely concentrated on synthesis methods, structural ordering, or functional performance [8,24,25], with comparatively limited emphasis on their mechanical behavior and its dependence on constituent particle dimensions. A few reports have shown that mechanical stiffness and hardness can be drastically enhanced with particle size decreasing [13], attributed to the variation in packing structure. However, a comprehensive understanding or scaling relation is still absent. This knowledge gap arises partly from experimental difficulties in fabricating assemblies with well-controlled size distributions and characterizing their nanoscale deformation processes. As a result, the mechanisms through which particle size influences collective mechanical performance remain elusive.
The present work seeks to clarify this relationship by systematically examining the particle size-dependent mechanical properties of copper nanoparticle assemblies. Copper is chosen as a modeling material for several reasons: (i) copper is an abundant and cost-effective metal that plays an indispensable role in electronic and structural applications [26,27]; (ii) copper nanoparticles can be readily synthesized through various methods [8,24,25] and possess significant potential for use in electronic packaging and chip interconnects [6,7,9]; and (iii), copper nanoparticles exhibit distinctive size-dependent deformation mechanisms at the single-particle level [28,29]. Despite these advantages, the influence of particle size on the mechanical properties of copper nanoparticle assemblies remains poorly understood. By comparing assemblies composed of nanoparticles with different radii, we reveal how the particle size influences structural packing, interparticle bonding, and the resulting macroscopic mechanical response. These insights illuminate the primary connection between nanoscale particle geometry and the emergent mechanical behavior of their mesoscale assemblies, providing guidance for the rational design of nanoparticle-based materials with controllable and predictable mechanical performance.

2. Material and Methodology

To create the atomic models of nanoparticle assemblies, a two-step scheme was adopted. First, granular simulations were performed to generate disordered sphere packings using the discrete element method (DEM), which was implemented in the granular module of the Large-scale Atomic/Molecular Massively Parallel Simulator LAMMPS [30]. Second, each granular sphere was then scaled to the target size and replaced by a copper nanoparticle with a random crystallographic orientation, yielding the atomic assemblies. Complete modeling details for each step are provided in the following sections.

2.1. Granular Simulation for Constructing Disordered Assembly

In the granular simulations, nanoparticles were modeled as a group of monodisperse hard spheres, with both translational and rotational degrees of freedom. Initially, a total of [27] spheres were randomly placed in a cubic simulation box of sufficient size, with periodic boundary conditions applied in all three directions. Interparticle interactions were modeled using the Hertz-Mindlin contact law with viscous damping [31]. The normal force followed Hertzian elasticity, with damping parameters chosen to yield a restitution coefficient of 0.2, while the tangential force was described by Mindlin’s theory with a tangential stiffness equal to the normal stiffness [31]. A Coulomb friction cutoff (μ = 1.0) was applied to constrain tangential forces, and torques arising from tangential forces were fully considered. Energy dissipation during collisions was handled using the Tsuji damping formulation [32].
The granular system temperature was maintained using a Nosé–Hoover thermostat [33,34], while isotropic barostatting was applied to regulate the simulation cell volume to achieve a randomly dense-packed spheres. Initially each sphere was assigned a random velocity corresponding to the initial temperature, and the simulation was then carried out for 2.0 × 10⁵ time steps. Trajectory data were recorded at regular intervals, and the total linear momentum was periodically removed to prevent artificial drift. By reversibly deforming the simulation box, multiple distinct granular configurations were obtained. Before being converted into atomic models, each granular packing was energy-minimized to avoid significant residual overlaps. Further details on the granular simulation methodology, please refer to reference [30]. After obtaining the granular packings, a bulk single-crystal fcc copper sample was created with a lattice constant of 3.615 Å, and copper nanoparticles were then carved out of this bulk sample with a spherical cutting-surface. Finally, the granular models were scaled according to the desired copper nanoparticle radius in assemblies, and each sphere was replaced by a copper nanoparticle with a randomly assigned crystallographic orientation. This procedure produced a series of disordered assemblies of monodisperse copper nanoparticles. The DEM-generated granular assemblies thus provided the spatial templates for atomic modeling, which were subsequently used in molecular dynamics (MD) simulations to investigate mechanical behaviors under uniaxial compression.

2.2. Atomic Simulation for Uniaxial Compression

Classical atomic MD simulations of uniaxial compressions were employed [35] to investigate the mechanical responses of the nanoparticle assemblies as prepared in Section 2.1. To isolate the effects of particle size, all assemblies shared identical geometrical packing configurations, differing only in particle radius. Figure 1 shows several representative assemblies consisting of nanoparticles with different radii but the same overall structural arrangement. In this study, the particle radius was systematically varied in a range from 1.0 to 6.0 nm, spanning the transition between two deformation regimes identified in preliminary tests: densification-driven deformation in small particles and contact-controlled deformation in larger particles.
Atomic interactions among copper atoms were described by the embedded-atom method (EAM) with a potential parameter set developed by Mishin et al. [36], which has been widely employed for modeling various copper nanostructures with high accuracy and stability [29,37]. Periodic boundary conditions were imposed in all three directions. Depending on the model size, the nanoparticle assemblies contained approximately 1.25 to 2.11 million atoms. Time evolution of the atomic system was implemented within the isothermal–isobaric (NPT) ensemble, with the temperature maintained at 300 K using a Nosé–Hoover thermostat [33,34]. Prior to compression loading, each atomic system was performed with a structural relaxation through conjugate-gradient energy minimization and subsequently equilibrated dynamically at 300 K for approximately 200 ps under zero external pressure. Uniaxial compression tests were then conducted at a strain rate of 1.0 × 10⁸ s−1. It is noted that, the high strain rates inherent to MD simulations generally results in higher absolute stress levels compared with that obtained from experiments [38]. However, the underlying atomic-scale deformation mechanisms remain deterministic, the effects of the high strain rates only shift the absolute magnitude of stress without altering the relative trends associated with particle size.
The virial stress formulation was used to calculate atomic stresses [39], and the compressive stress was taken from the component of pressure tensor along the loading direction. To minimize the influences of thermal fluctuations in small assembly models, the simulation boxes were replicated multiple times along three directions before conducting compression. To monitor the deformation process, the common neighbor analysis (CNA) method was employed to identify atomic defects such as surfaces, interfaces, dislocations, stacking faults, twins, and grain boundaries based on deviations from the perfect lattice [40,41]. During deformation, the fraction of the defective atoms was calculated as the ratio of all non-fcc atoms, identified by the CNA parameter, to the total number of atoms. All atomic configurations and defect structures were visualized using software OVITO, version 3.10 [42].
To characterize the distribution of the plasticity within atomic models, the non-affine squared displacement D2 was adopted [43], which is defined as the residual of the least-squares fit used to determine the local deformation gradient, and expressed as
D 2 = min 1 N i N r i F r 0 2
where r i is the relative position vector of the i-th neighboring atom with respect to a central atom in the current configuration; r 0 is the relative position vector of the same atom in the reference configuration; F is the local deformation gradient tensor; and N is the total neighbors of the central atom. A low D2 value indicates that the local deformation is predominantly elastic, whereas a high D2 value reflects substantial local rearrangements associated with plastic deformation.

3. Results and Discussion

With the above preparations, Section 3.1 compares the overall compressive loading responses and identifies the size-dependent evolution strength evolution. Section 3.2 and Section 3.3 examine the distinct deformation modes in two representative assemblies composed of small and large nanoparticles, respectively. Finally, Section 3.4 establishes a scaling relation that quantifies dependence of strength of nanoparticle assembly on particle size.

3.1. Overall Loading Responses and Particle Size-Dependent Strength

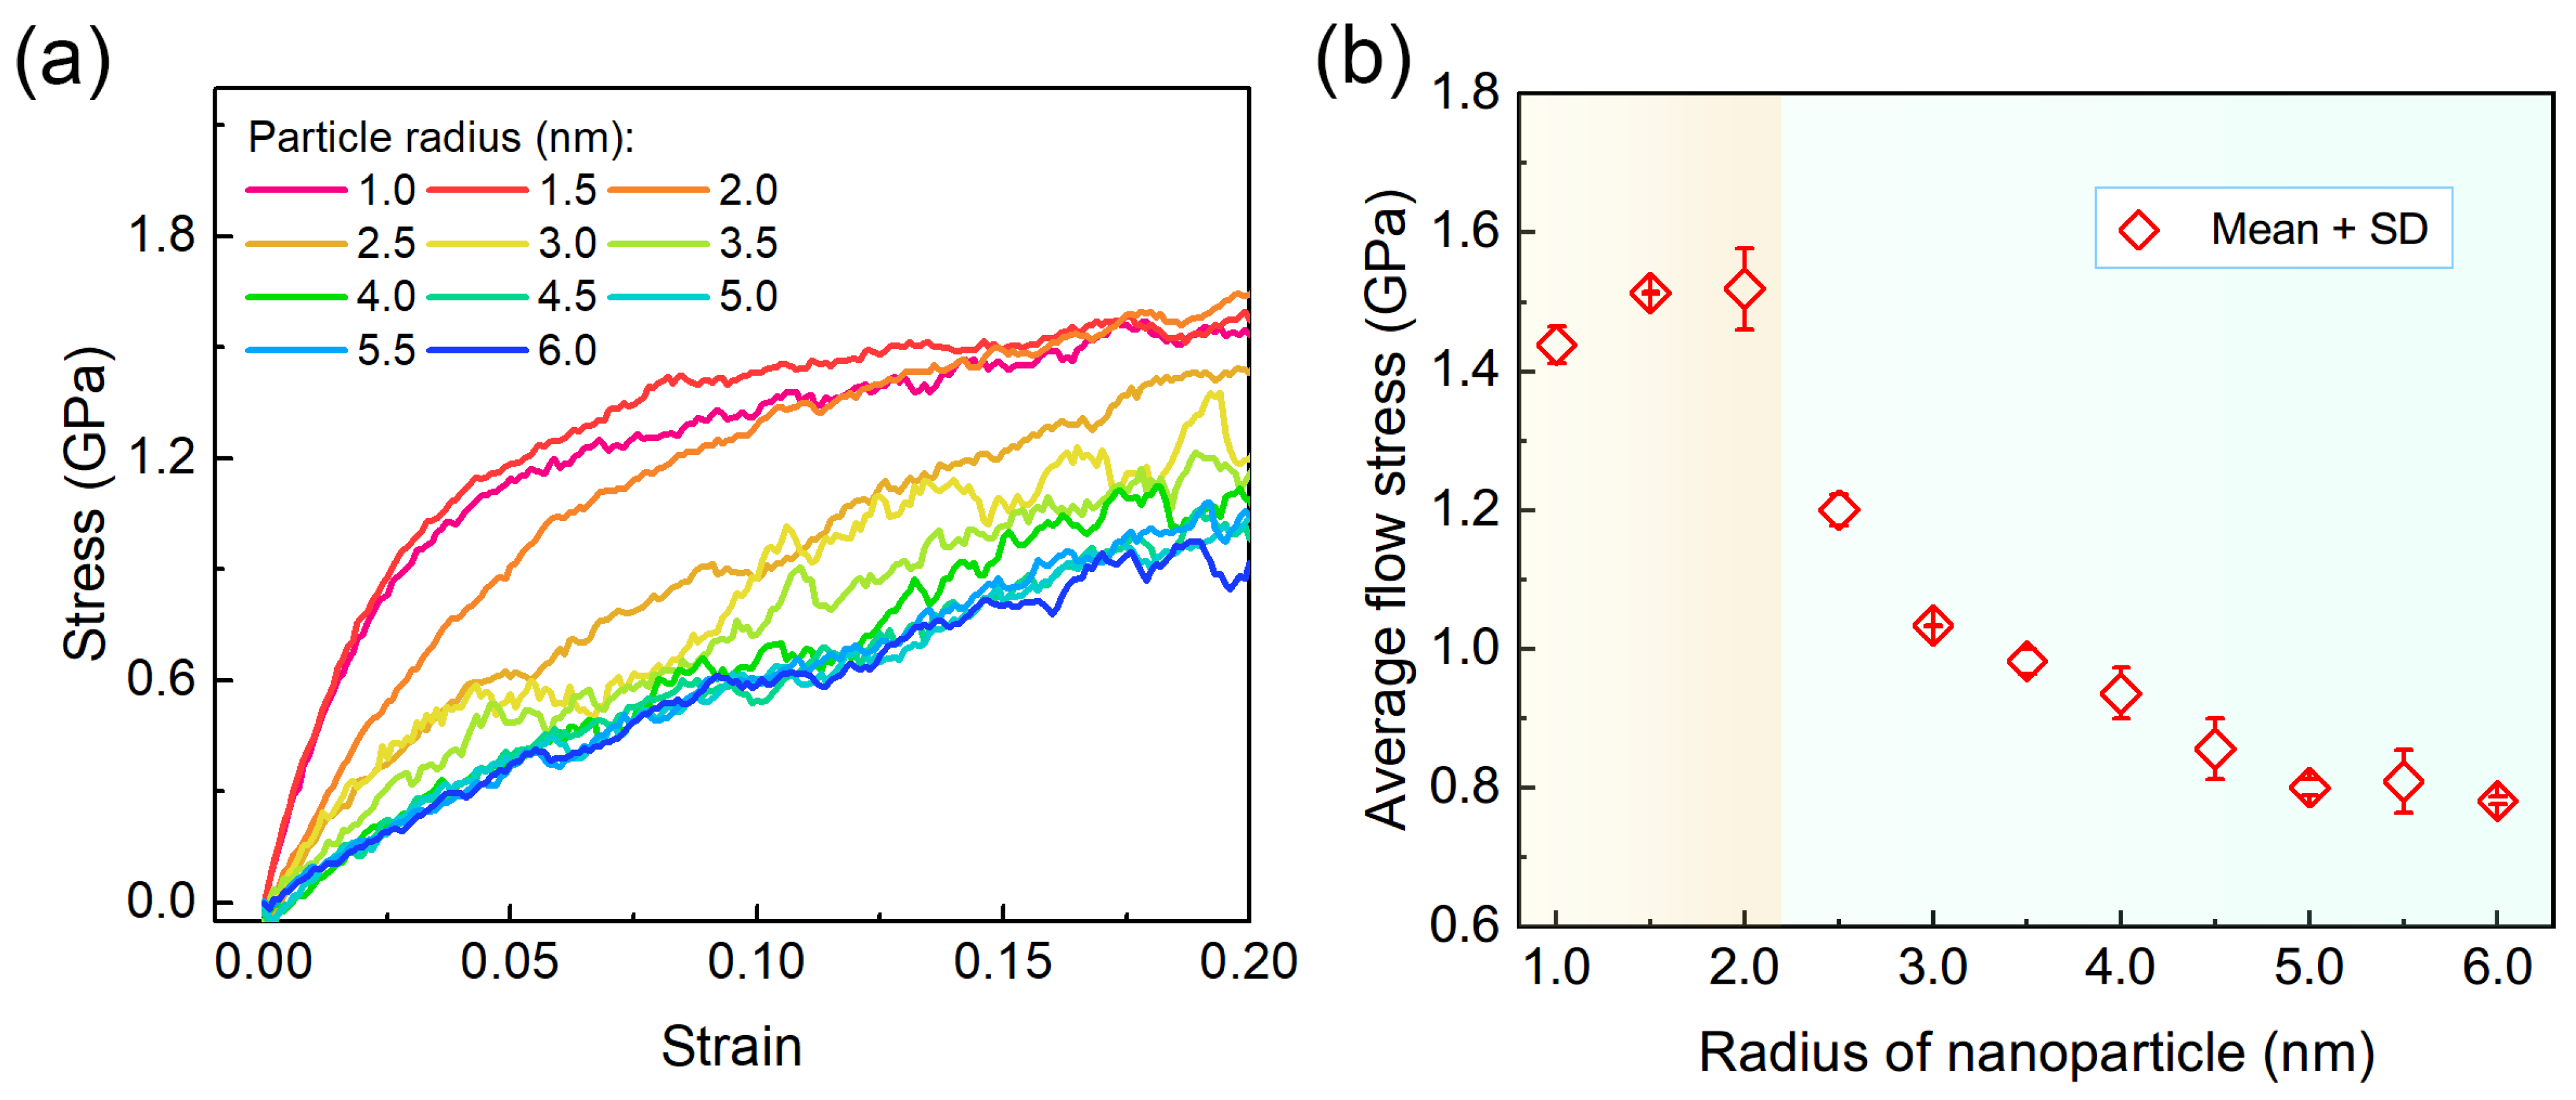
Figure 2a shows the stress–strain curves of assemblies with various particle radii under uniaxial compression. Overall, the stress monotonically increases with the accumulation of compressive strain. In the initial stage (ε < 0.05), the curves are smooth and exhibit steep slopes, indicating elastic-like behavior. While in the subsequent stage, the slopes decrease, and the curves begin to fluctuate with the increasing of strain. In addition, particle size exhibits a pronounced influence on both the magnitude and the evolution characteristics of the stress responses. For example, in the initial stage (ε < 0.05), the assemblies composed of smaller nanoparticles generally display higher stresses and steeper slopes. In the later stage, within the strain range of 0.10 to 0.20, the stress curves tend to approach different flow-stress levels. Specifically, for three assemblies with particle radius of 1.0, 1.5, and 2.0 nm, the flow stress fluctuates in a range of 1.2 to 1.5 GPa, whereas larger-particle assemblies, it fluctuates within a lower but broader range of 0.6 to 1.0 GPa.
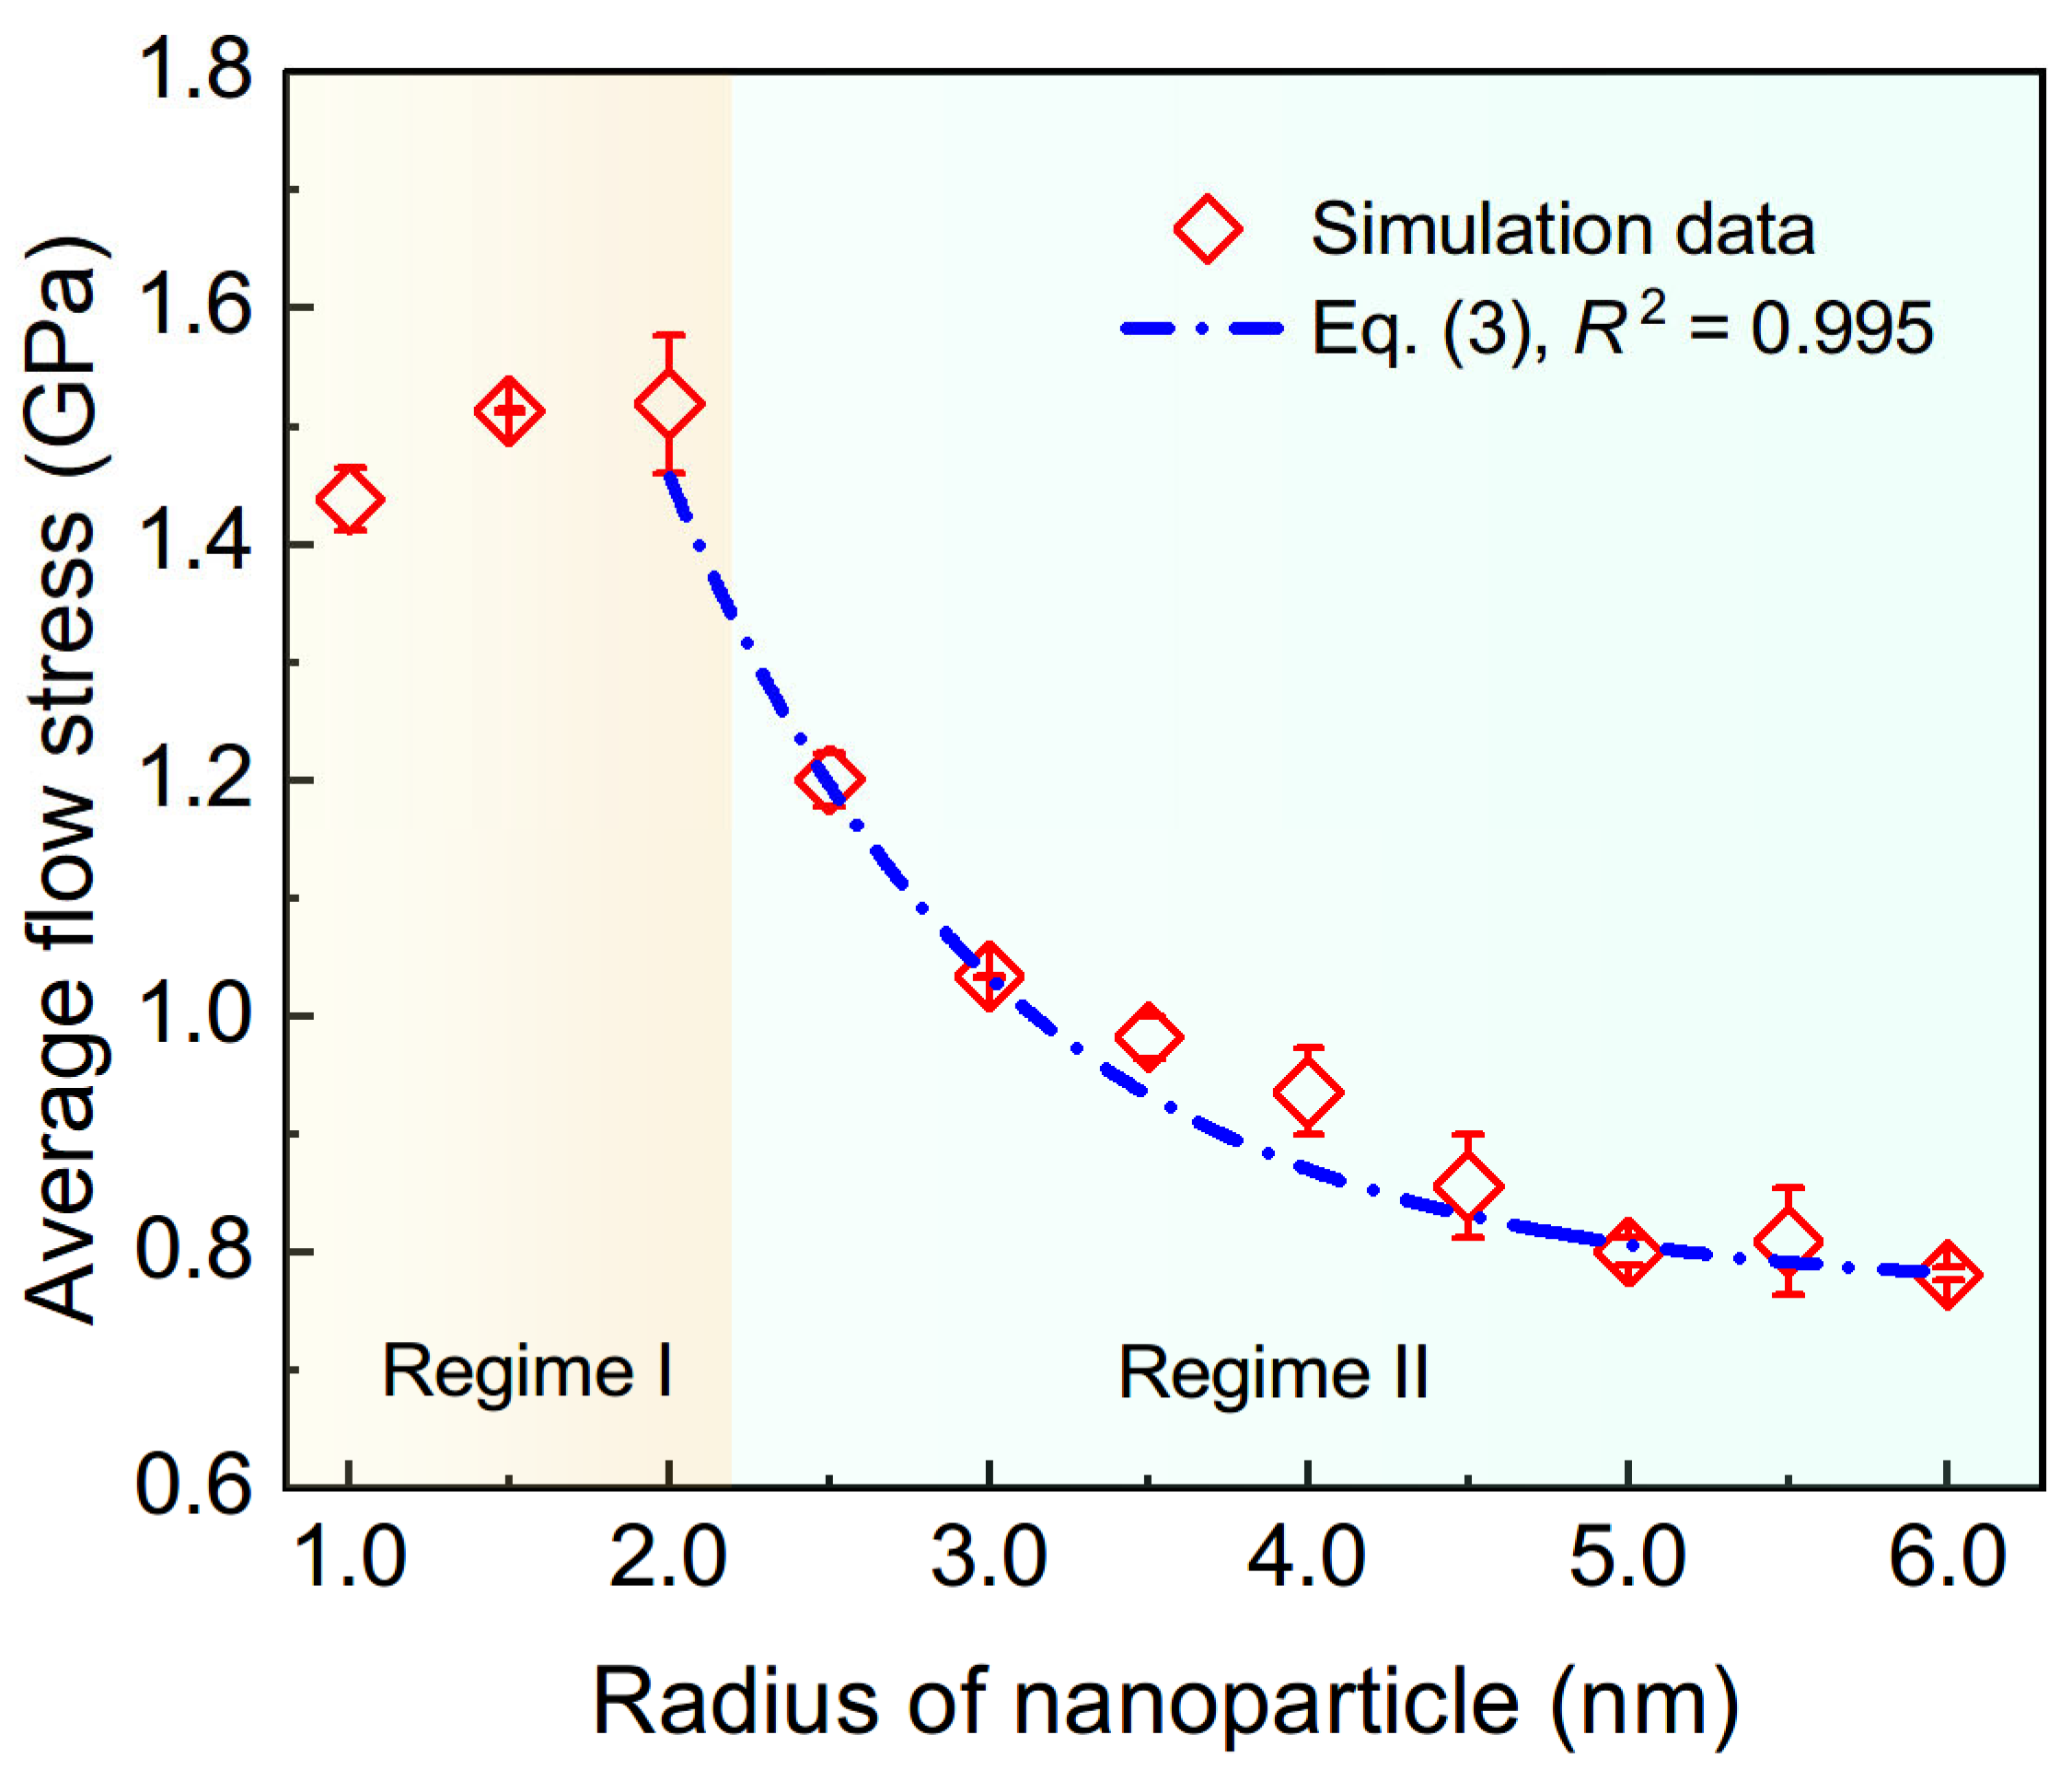
To quantitatively characterize the particle size-dependent loading responses, the variation in the average compressive flow stress is plotted as a function of particle radius in Figure 2b, revealing a pronounced size effect on the strength. The average flow stress is calculated over a strain range of 0.10 to 0.20. As the particle radius decreases from 6.0 nm to 2.0 nm, the flow stress steadily increases from approximately 0.8 to 1.5 GPa. However, a further decrease in nanoparticle radius leads to an inverse trend, i.e., the flow stress decreases with decreasing particle radius. This transition suggests a change in the dominant atomic-scale deformation mechanism. In following sections, two representative models of nanoparticle assemblies, with particle radius of 1.0 and 6.0 nm, are analyzed in detail to reveal the size-dependent deformation mechanisms.

3.2. Deformation Mechanisms in Assemblies with Smaller Particle Size

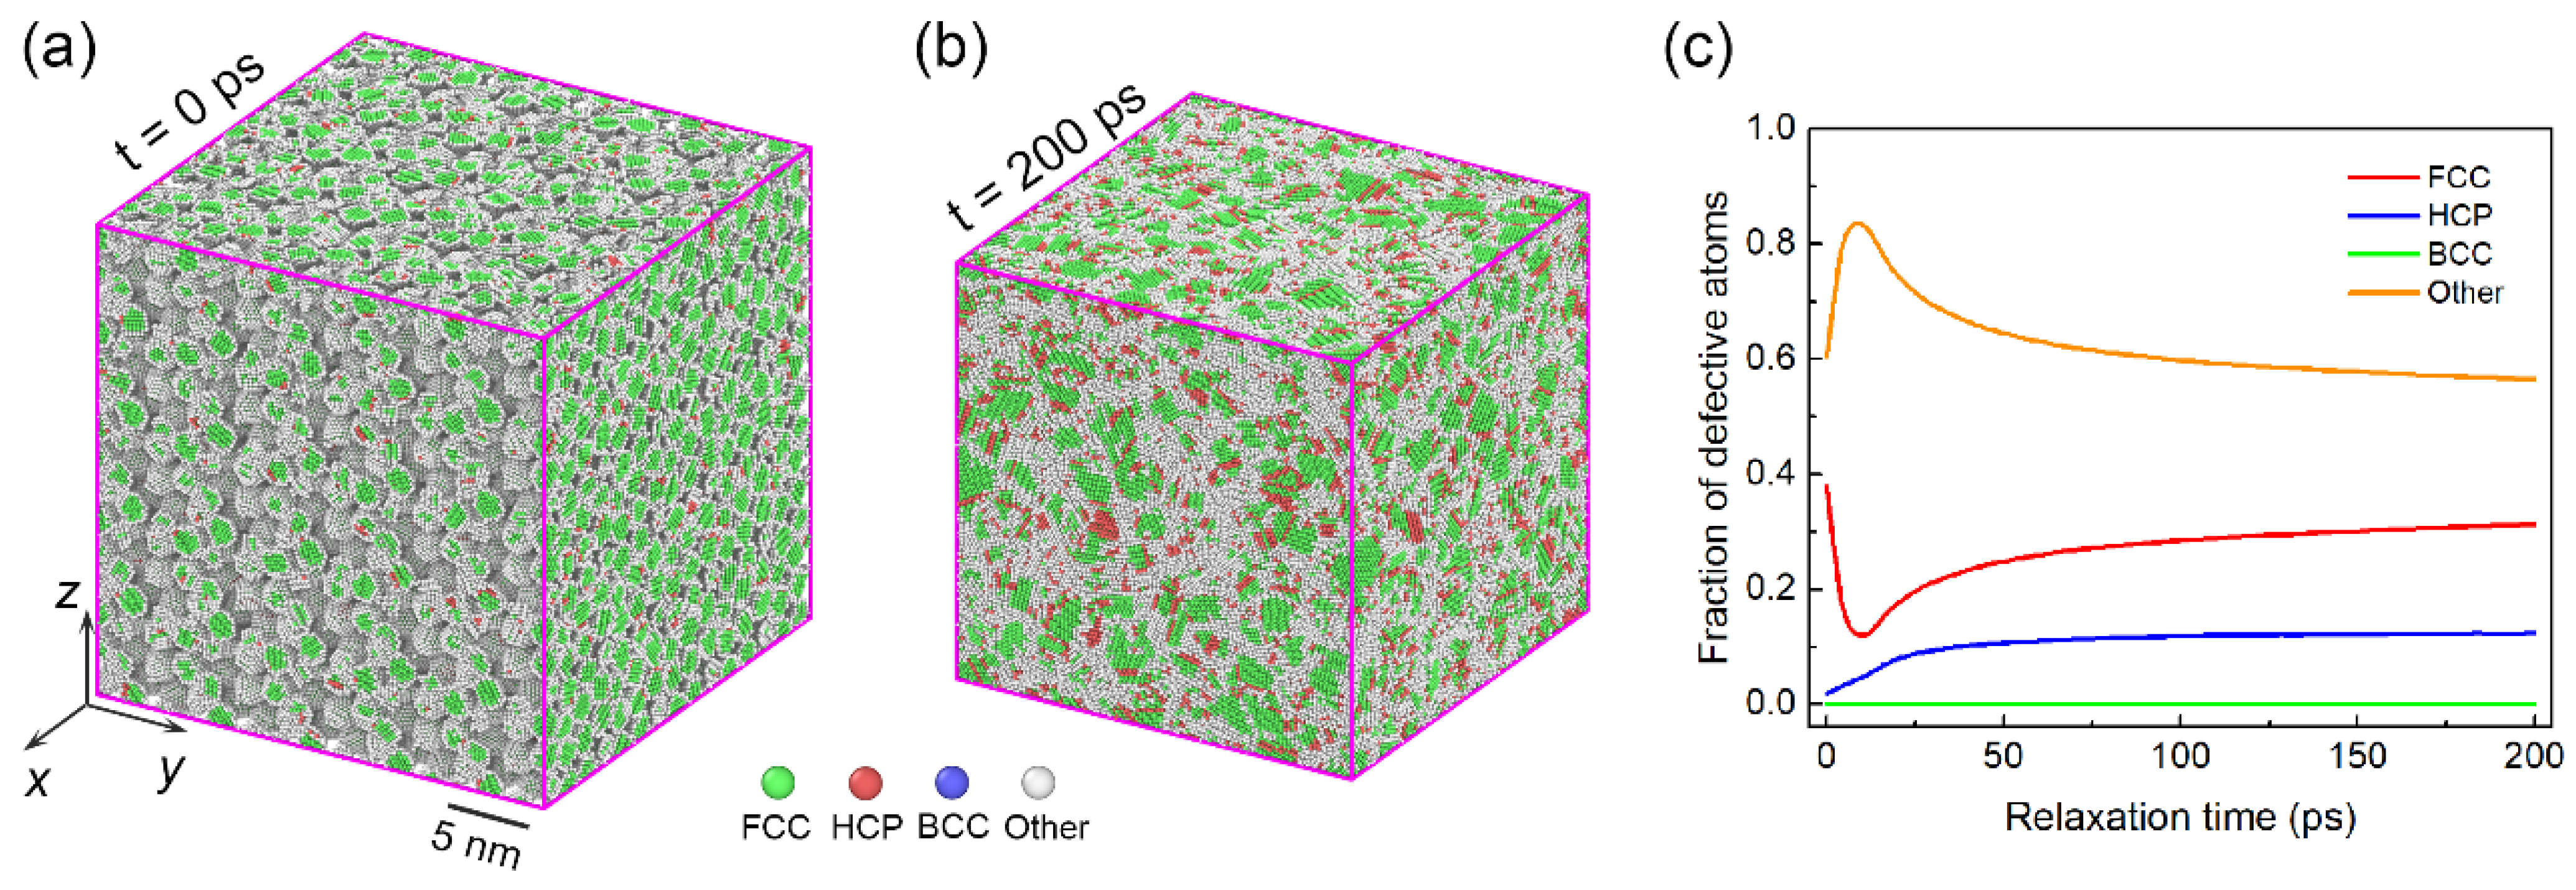
In this section, the nanoparticle assembly with particle radius of 1.0 nm is examined. When the radius of nanoparticle is small, strong interparticle adhesion promotes mechanical sintering among nanoparticles, which further leads to a pronounced shrinkage of the simulation box. Figure 3a shows the initial configuration of the nanoparticle assembly. During a structural relaxation under zero external stress, the voids among nanoparticles eventually disappear, and the individual particles become indistinguishable. Consequently, the entire assembly transforms into a nanopolycrystal-like structure, as shown in Figure 3b. The evolution of the fraction of defective atoms during structural relaxation is presented in Figure 3c. It is noted that, the fraction of the non-crystal atoms (labeled as ‘other’) initially increases to a local maximum and then gradually approaches a stable level. This characteristic arises owing to some atomic dynamic behaviors. In the “as-created” state, the atomic system is in a high-energy state. Upon relaxation, the assembly starts to “collapse” at an accelerating rate. The rapid coalescence of nanoparticles leads to larger atomic displacements and vibrations, causing massive atoms to deviate from the perfect fcc lattice. As a result, a sudden increase in the fraction of non-crystal atoms occurs. In the subsequent equilibration stage, as the kinetic energy is dissipated, the local atomic structures are partially recovered, and thus the fraction of non-crystal atoms decreases and approaches a stable level after reaching a maximum. In this stage, the ultrafine grains gradually grow up till reaching a stable size, accompanied by the recrystallization of the disordered atoms. Meanwhile, the fraction of hcp atoms, composing stacking faults and deformation twins, quickly reaches saturation.
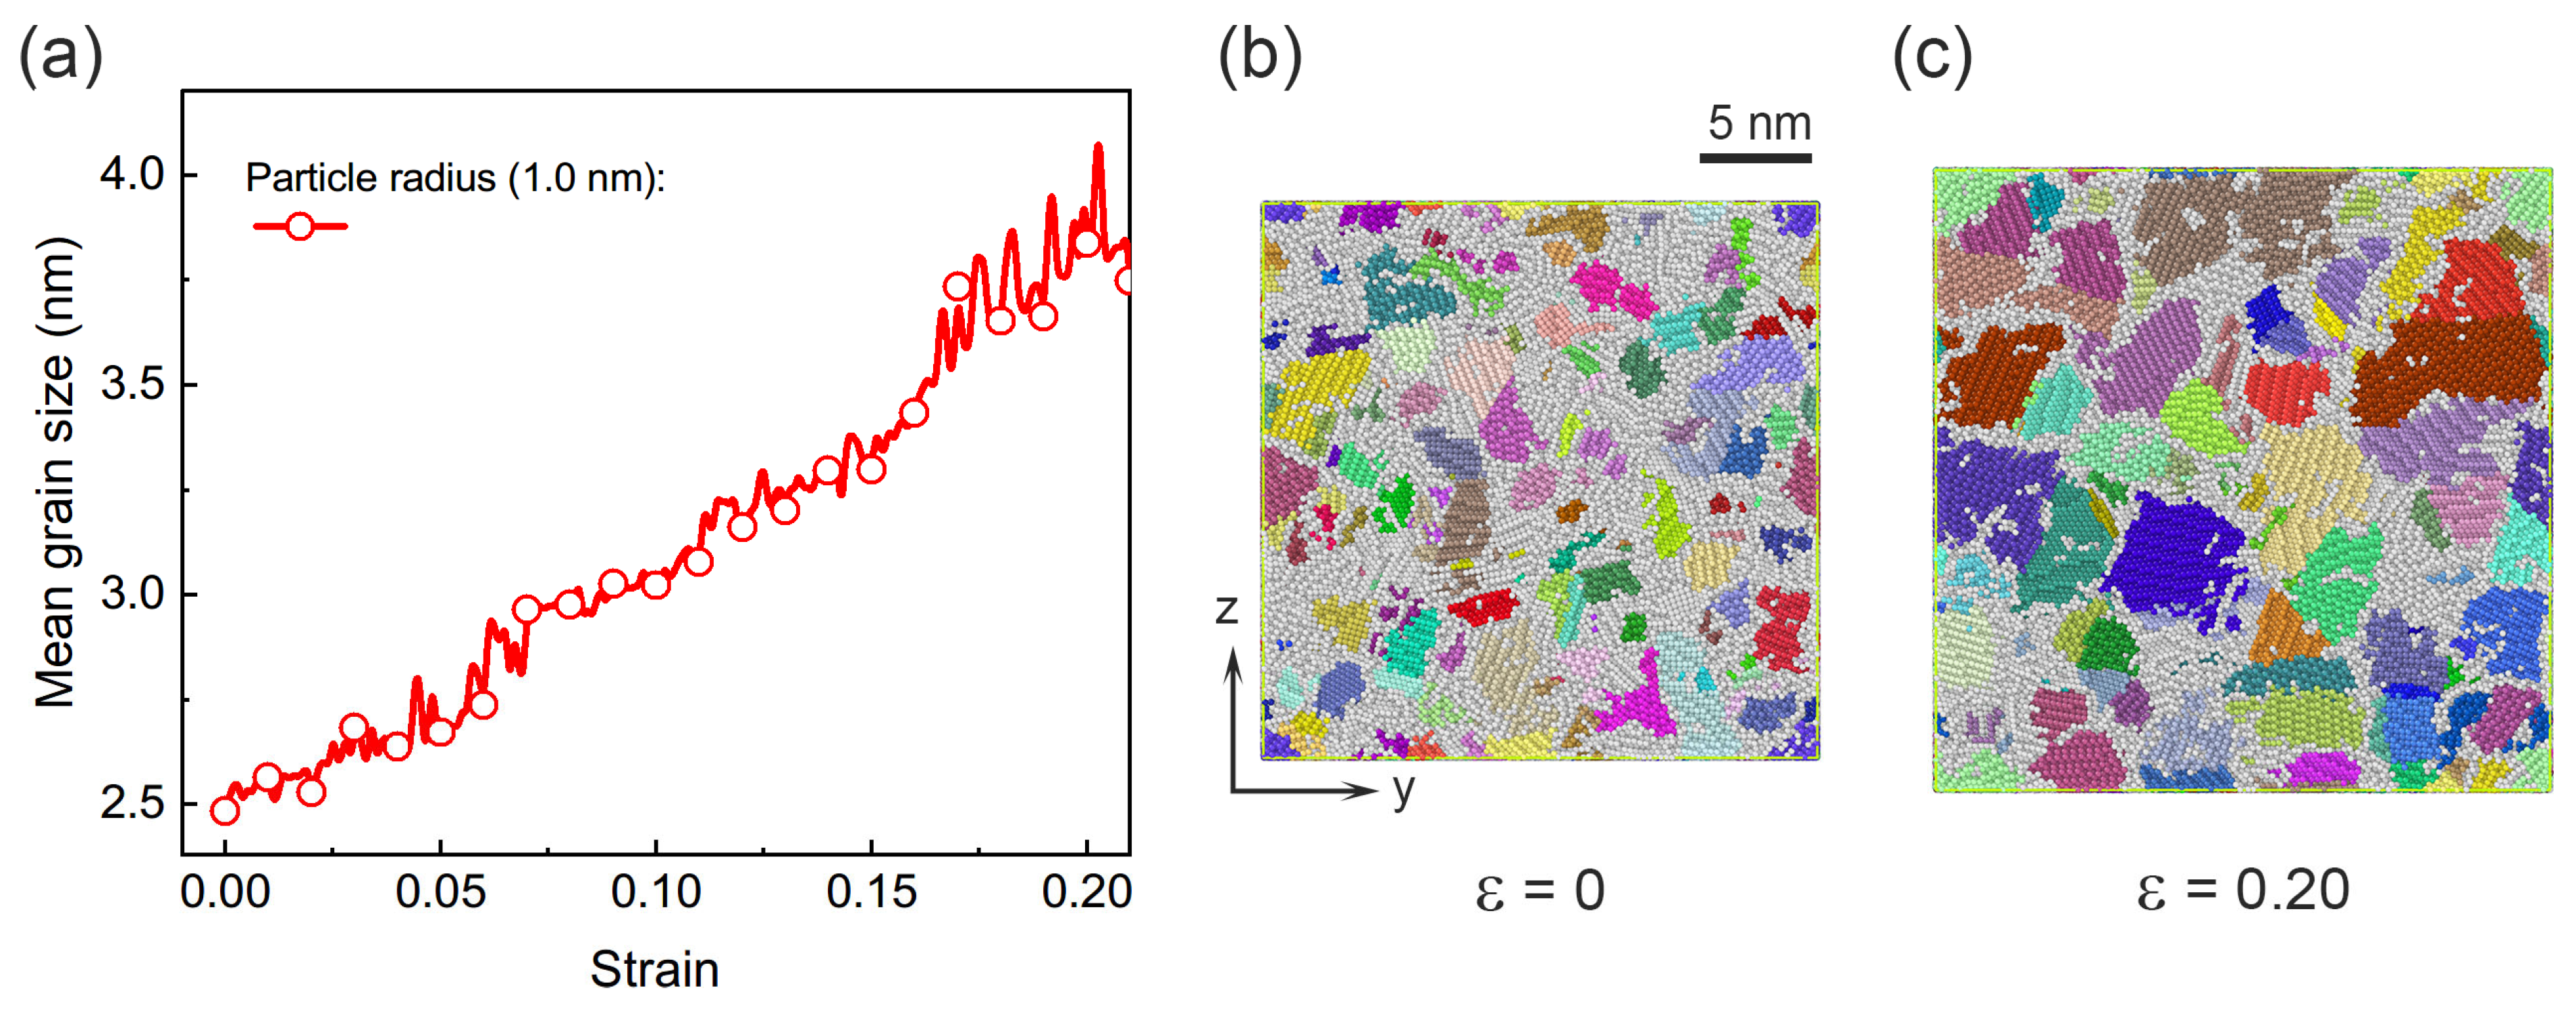
After structural relaxation, a uniaxial compression test was performed along the x-axis. Figure 4 presents the atomic deformation morphologies at three representative strain levels: 0.05, 0.10 and 0.15. Since the nanoparticle assembly has completely transformed into a nanocrystalline structure, its deformation behaviors exhibit several characteristic features. For example, plastic deformation is primarily sustained by dislocation nucleation from grain boundaries and grain boundary migration, as shown in Figure 4a–c. Owing to the ultrafine initial grain size, grain growth occurs progressively with increasing compressive strain. For instance, the marked grain in Figure 4a expands from 5.56 nm at a strain of 0.05 to 6.56 nm at a strain of 0.15. The evolution of the mean grain size as a function of strain is shown in Figure A1, with the adopted algorithm provided in the Appendix A. During the loading stage, the mean grain size steadily increases from ~2.5 nm to ~4.0 nm. To further quantify the plastic deformation, Figure 4d–f show the distribution of the non-affine squared displacement field. It is evident that the plastic activity is concentrated mainly at grain boundary. Such grain boundary-mediated plastic deformation represents a characteristic softening mechanism in nanocrystal materials with ultrafine grains [44,45].

3.3. Deformation Mechanisms in Assemblies with Larger Particle Size

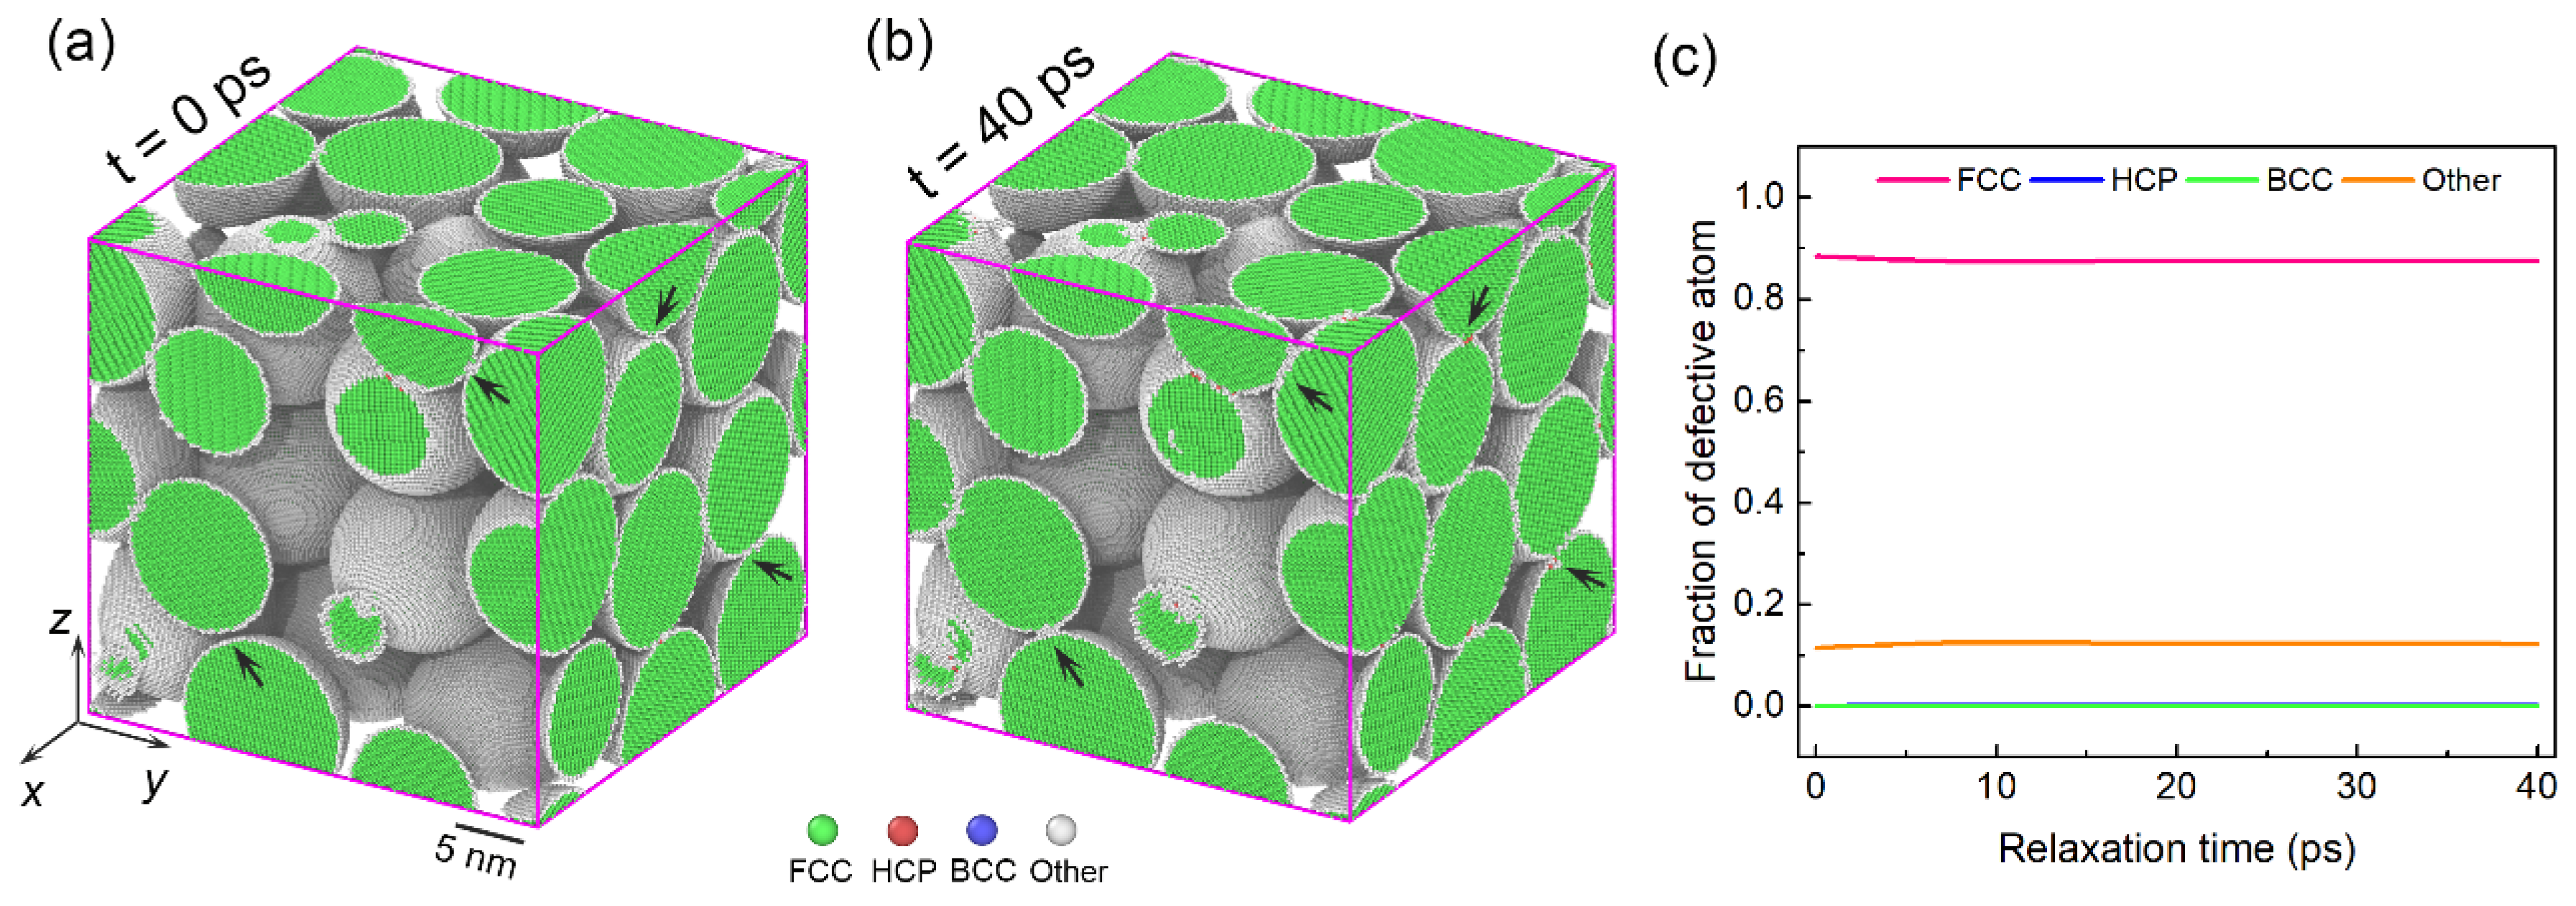
In contrast, the mechanical responsess of nanoparticle assembly with a larger particle radius of 6.0 nm are distrinct from the previous case. The structure of this assembly exhibits greater stability. Figure 5a shows the initial structure of nanoparticle assembly. As shown in Figure 5b, during a structural relaxaiton, the overall configruation remains nearly identical to the initial state. Only minor adjustments occur at local interparticle contacts, accompanied by the nucleation of a few dislocation embryos, as indicated in Figure 5b. No apparent shrinkage of the simulation box is observed. Figure 5c presents the varition in the fraction of defective atoms. It is seen that the disordered atoms (labeled as ‘other’) constitute the primary defect type. Their fraction only slightly increases within the first 10 ps and then stabilizes, indicating that no significant structural changes occur during relaxation. These observations suggest that assemblies composed of larger nanoparticles are structurally more stable than those formed by smaller ones.
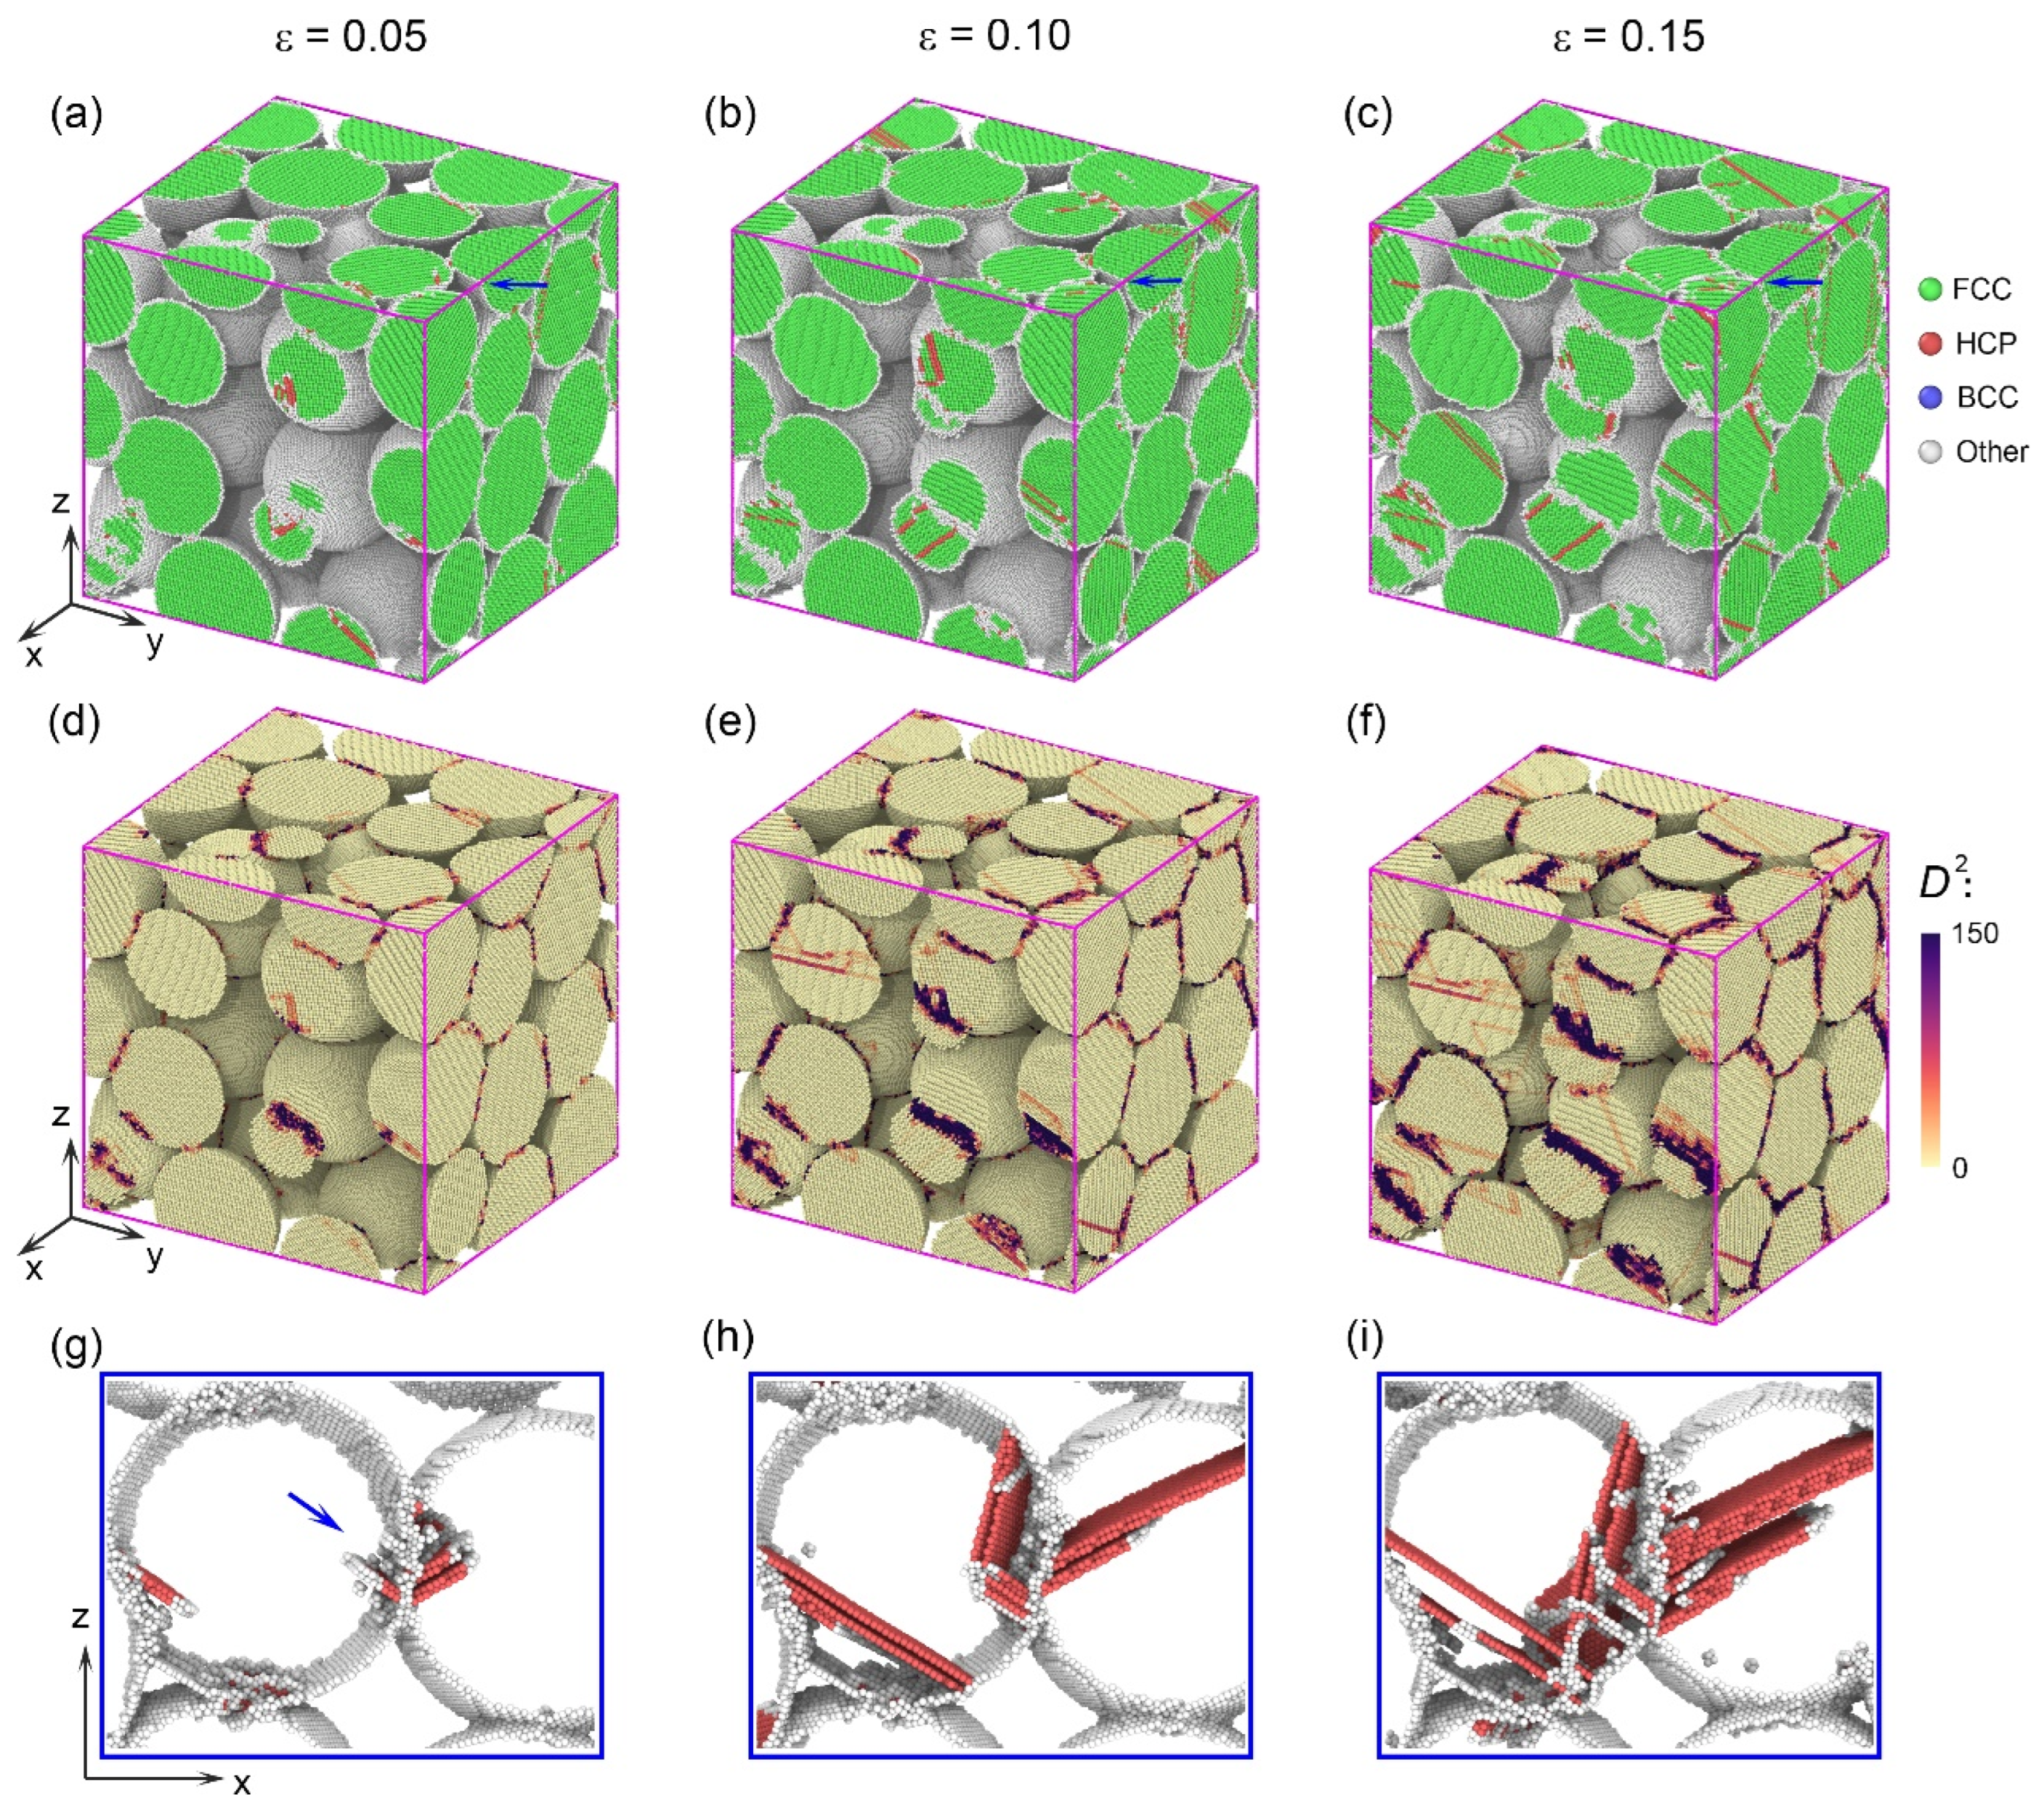
Following structural relaxation, unixal compression along x-axis was performed. In this case, the contact interfaces between nanoparticle serve as the primary sites for dislocation nucleation. As shown in Figure 6a, when the compressive strain reaches 0.05, multiple initial dislocaitons nucleate at the contact patches. With increaing strain, these initial dislocations glide across the interiors of the nanoparcles, and reach the surface or contact interfaces at the opposite side. Such dislocaiton activities within individual nanoparticle is akin to that observed in single nanoparticle under compression tests [15,16]. In addition, as the compressive strain accumulates, some interparticle voids shrink, and initially separated nanoparticles come into contact at later stages, as marked in Figure 6a–c. This behavior results from the desification of nanoparticle assemblies. To further quantify the plastic deformation, the spatial distribution of the non-affine squared displacement field is also plotted in Figure 6d–f. The results indicate that plasticity is primarily accommodated by deformation around contact interfaces. Typical dislocation activities are illustrated in Figure 6g–i. The initial dislocations preferentially nucleate at the contact interface. As the interparticle contact evolves, additional dislocations nucleate and glide around these regions. The accumulation of dislocation near the interfaces modifies the local contact morphology, thereby promoting the increasing of contact area between nanoparticles and enhancing the overall load-bearing capacity. This progressive evolution of interparticle contact contributes to the overall densification of the assembly.

3.4. Scaling Laws of Particle Size-Dependent Mechanical Responses

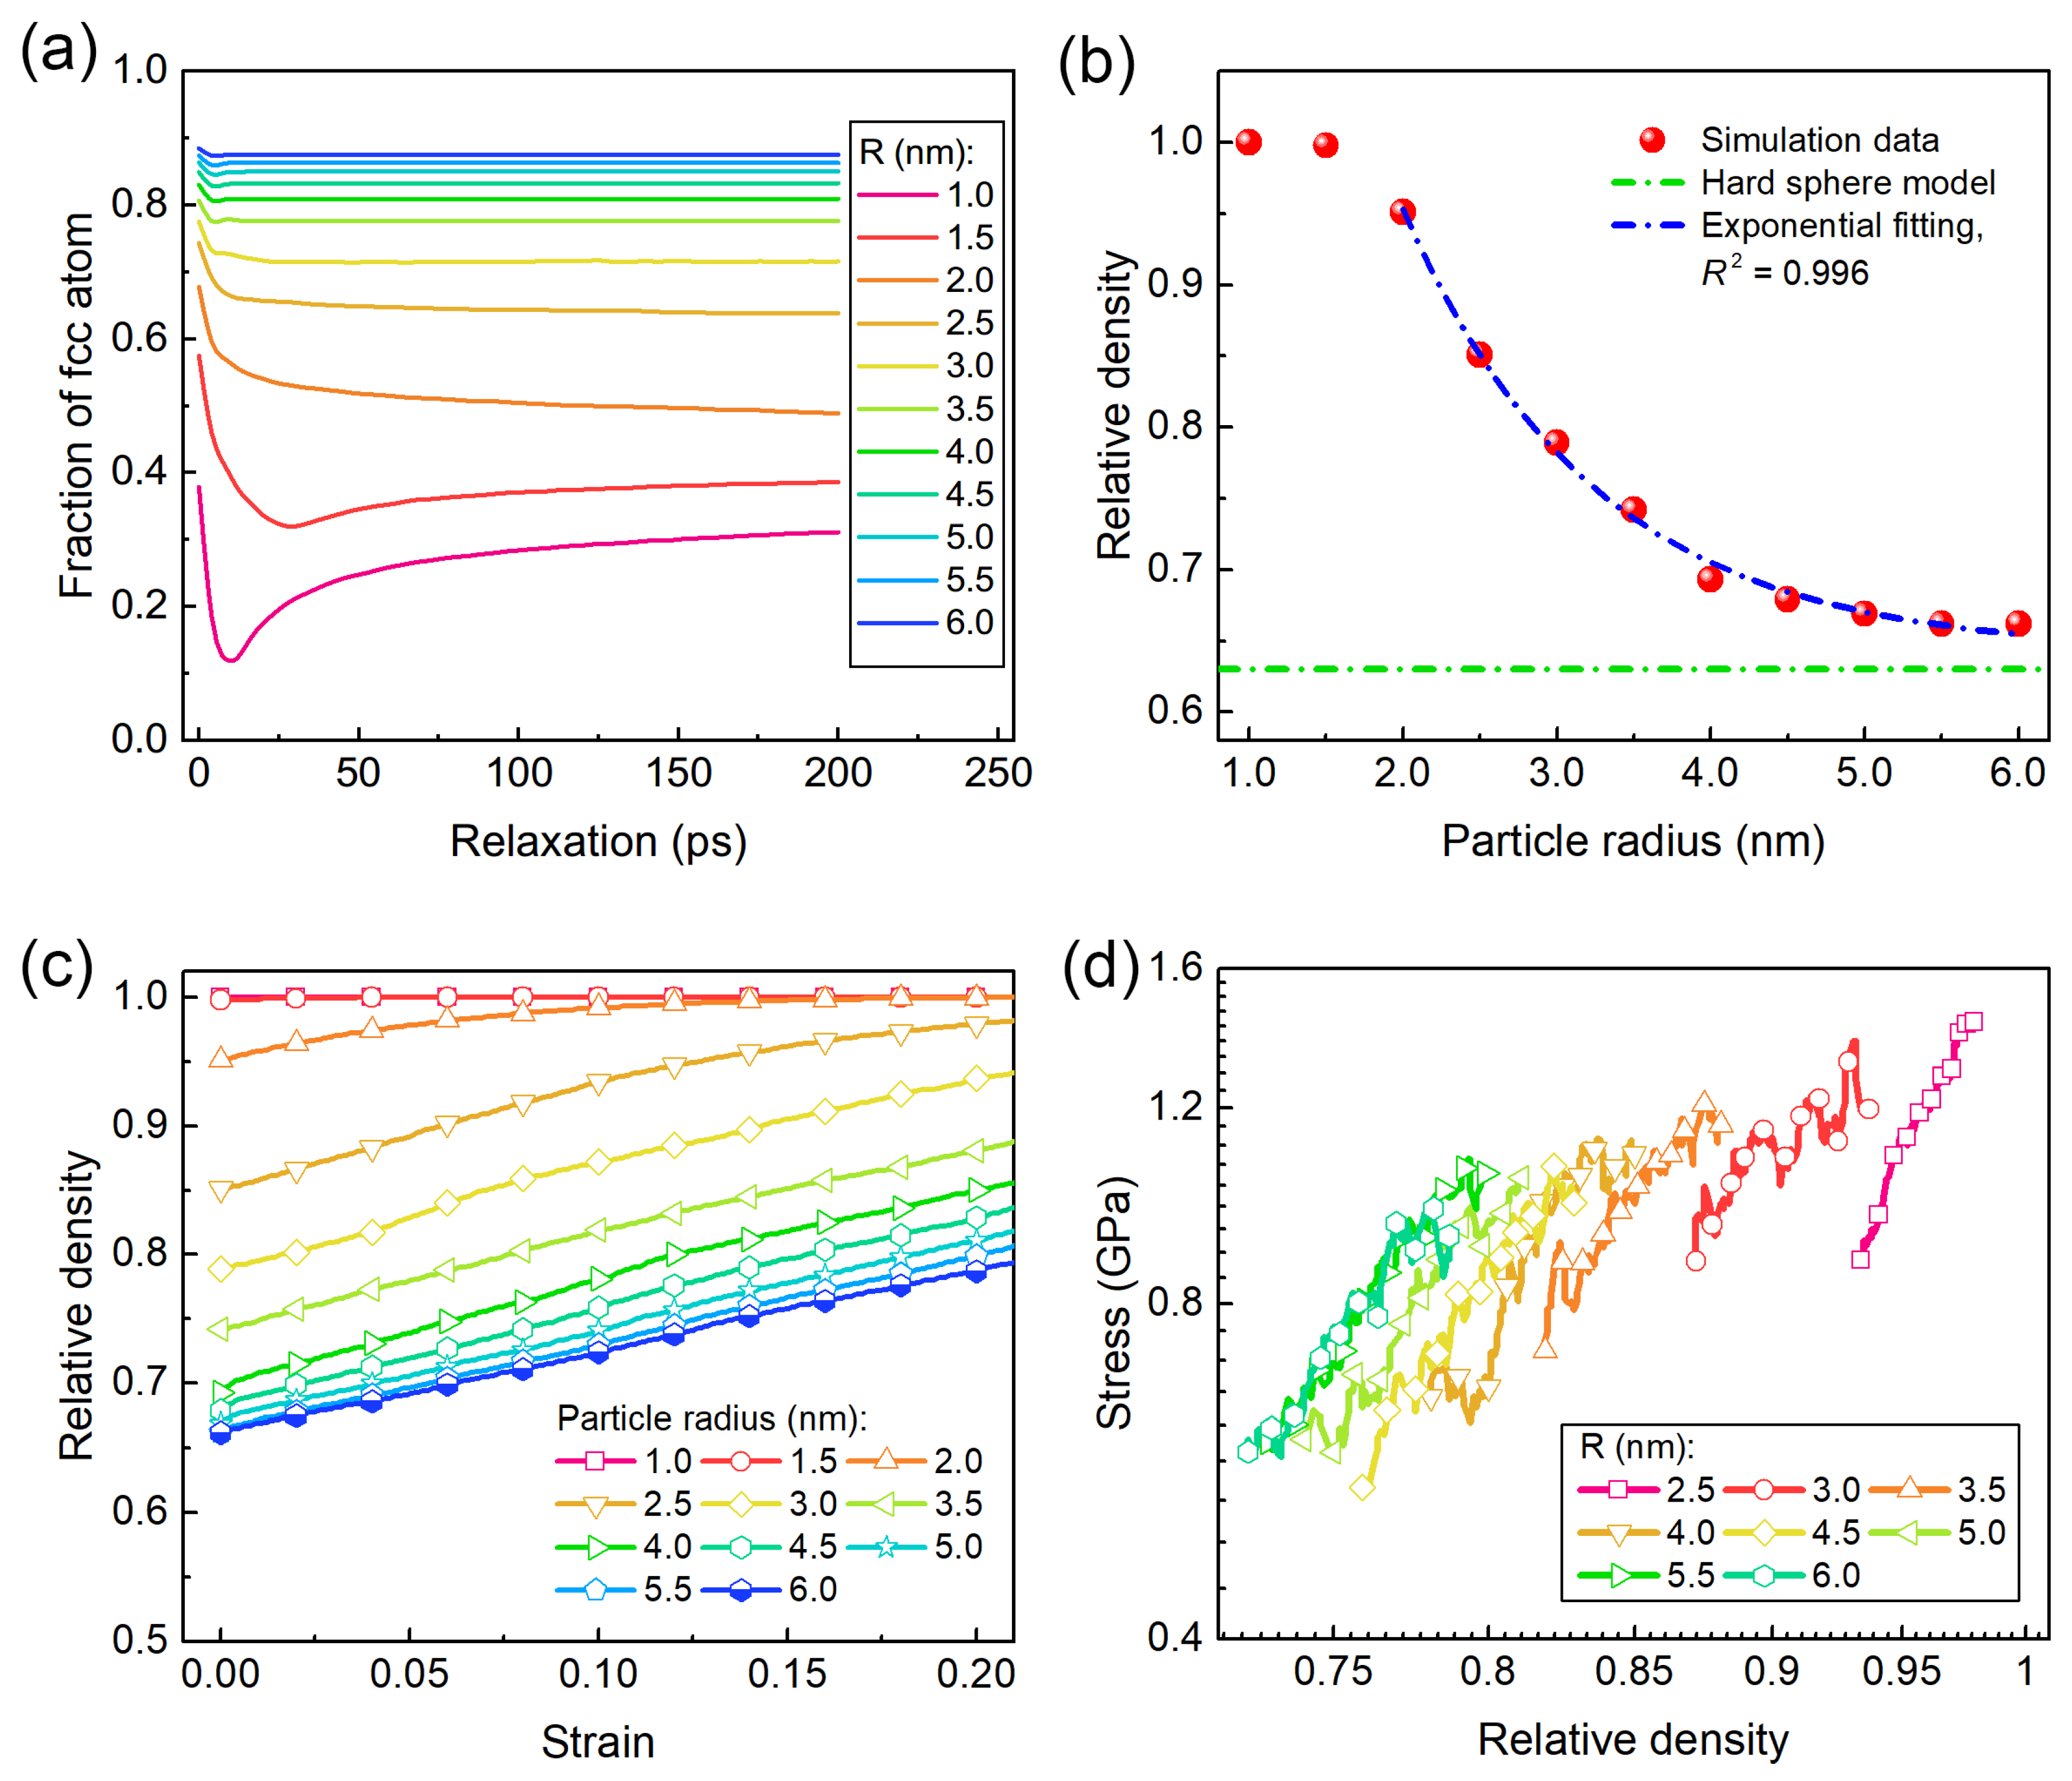
The results presented in the above sections demonstrate that the structure stability of the “as-created” assemblies strongly depends on particle size. During structural relaxation, assemblies composed of smaller nanoparticles exhibit pronounced densification, whereas those consisting of larger nanoparticles overall retain the initial structure. To quantify the size-dependent structural evolution, Figure 7a shows the variation in the fraction of fcc atoms for assemblies with different particle sizes during the structural relaxation. It is observed that when the nanoparticle size is smaller than 2.5 nm, the fraction of fcc atoms exhibits noticeable fluctuations before reaching a steady level, indicating active structural rearrangement and densification within the assembly. In contrast, for assemblies composed of larger nanoparticles, the fraction of fcc atoms remains nearly constant throughout relaxation, reflecting a higher degree of structural stability.
To quantify the degree of densification after structural relaxation, the relative density of nanoparticle assembly is calculated, which is defined as the ratio of the average density of one particle assembly to that of the bulk counterpart. The results are shown in Figure 7b. For reference, the relative density of the hard-sphere model of the assembly is calculated to be ~0.63 and remains constant. In contrast, for copper nanoparticle assemblies, the relative density decreases progressively with increasing particle radius, which can be well described by an exponentially decaying function. Especially, when nanoparticle radius is smaller than 1.5 nm, the relative density is approaching 1.0, indicating that the assembly is fully densified and transformed into solid, rather than exhibiting the porous-like characteristics observed in the other cases.
Moreover, the relative density continuously evolves during uniaxial compression. As shown in Figure 7c, the relative density of each assembly varies with the compressive strain. When nanoparticle size is smaller than 2.5 nm, the relative density remains close to 1.0 throughout deformation. For assemblies with larger nanoparticles, the relative density increases almost linearly with compressive strain, exhibiting similar slopes across different particle sizes. Equivalently, the increase in relative density corresponds to a shrinkage of the void fraction within the assembly. In Figure 2b, the average flow stress between strains of 0.10 and 0.20 is used to characterize the assembly strength. Within this strain range, the assemblies composed of nanoparticles smaller than 2.5 nm attain a relative density of approximately 1.0, indicating full densification. In contrast, assemblies with larger particles remain less dense, with relative density increasing linearly under uniaxial compression.
A relative density near 1.0 indicates that the assembly has transformed into a nanopolycrystalline structure. Smaller nanoparticles correspond to finer grain sizes. Since deformation is primarily governed by grain boundary migration and grain growth, the strength can be characterized by the inverse Hall–Petch relation [44,45]. When the nanoparticle size exceeds 2.5 nm, the assemblies behave akin to nanoporous materials, and undergo gradual densification under compression. For such nanoporous-like assemblies, the strength can be described by the Gibson–Ashby scaling law [46], as expressed by
σ σ s = C ρ ρ s m
where σ and ρ denote the strength and density of the nanoporous material, σs and ρs represent the strength and density of the corresponding solid counterpart, and C and m are two fitting parameters.
Considering the similarity between the partially densified assemblies and nanoporous material, we assume that the strength of the nanoparticle assemblies fulfills the same scaling model. From the log-log plot of stress versus relative density in Figure 7d, all the curves exhibit nearly identical slopes of approximately 1.0. Therefore, the exponent m in Equation (1) can be set to 1.0 for simplicity. Based on the trends of the initial relative density versus particle size in Figure 7b and relative density versus strain in Figure 7d, the strength of nanoparticle assemblies with particle radii larger than 2.5 nm can be approximated by the following equation
σ a = k σ s exp ( α R ) + b
where σa and σs are the strengths of the assemblies and the corresponding solid material, respectively; R is the initial nanoparticle radius; and k, α and b are three fitting parameters. The strength σs of bulk nanopolycrystalline copper with an average grain size of ~5.0 nm is estimated to be approximately 1.2 GP [45]. As shown In Figure 8, when the nanoparticle radius is smaller than 2.5 nm (regime I), the variation in strength versus particle radius follows the inverse Hall–Petch relation. In contrast, when the particle radius exceeds 2.5 nm (regime II), the strength of the nanoparticle assemblies could be well described by Equation (2). The fitted parameters k, b and α are ~3.851, 0.767 GPa, and 0.951, respectively. The proposed scaling model in Equation (3) for assemblies is derived from the Gibson–Ashby model in Equation (2), with the fitted exponent m ≈ 1.0. For comparison, the ultimate strength of nanoporous gold has been reported to follow the same linear dependence on density [47], supporting the physical reasonableness of the fitted value of m.
For the copper nanoparticle assemblies considered in present study, the threshold of particle size separating the two regimes at 300 K is estimated as ~2.5 nm. The densification-induced structural transition prior to loading plays an important role in determining this threshold. Surface energy is the primary driving force for the densification of nanoparticle assembly. Owing to the larger surface-to-volume ratio and the curvature-dependent surface energy density [48], assemblies composed of smaller nanoparticle generally possess higher total free energy. To lower this energy, nanoparticle tend to merge or coalesce in order to reducing the surface area through processes such as surface atom diffusion [49]. When the particle size falls below a critical threshold, the free energy of the assembly is sufficiently high to induce full densification, which in turn alters the overall variations in deformation mechanism. Therefore, surface energy density of nanoparticles and the energy barrier for surface atom diffusion are two primary parameters governing the transition and the critical particle size.
Since surface energy depends on elemental composition [50], the critical particle size is expected to vary among different materials. Increasing temperature leads a lower energy barrier for atomic diffusion [51]. Therefore, the critical particle size would increase with a higher temperature. In contrast, the critical threshold is independent on the coordination number of assembly, as it only promotes interparticle contacts but has no influences either on the surface energy density or the barrier of surface atom diffusion.
In summary, the mechanical response of the nanoparticle assemblies exhibits two distinct regimes governed by particle size. For small nanoparticles (radius < 2.5 nm), the assemblies are fully densified and deform as nanopolycrystalline solids, with their strength following the inverse Hall–Petch trend. For larger nanoparticles (radius > 2.5 nm), the assemblies behave like nanoporous materials, with strength scaling with particle size according to the Gibson–Ashby model. These findings reveal a clear transition from grain boundary-controlled softening to porosity-controlled strengthening as particle size is varied, providing a unified understanding of the size-dependent mechanical behavior in nanoparticle assemblies.
It should be noted that, in the present study, only the monodispersed nanoparticle systems were considered to investigate the effects of particle size on the strength of assembly. However, nanoparticle assemblies in practical applications usually exhibit a specific size distribution [6,7], the mechanical properties of nanoparticle assemblies depend on not only absolute dimension of nanoparticles, but the size distribution of nanoparticles within the assembly. Investigations associated with such aspects will be considered in our future works.

4. Conclusions

Using a combined discrete element method (DEM) and molecular dynamics (MD) approach, the present study investigates the particle size-dependent mechanical behavior of copper nanoparticle assemblies. Two distinct structural and mechanical regimes, governed by particle size, are identified. Assemblies composed of small nanoparticles with radii below ~2.5 nm undergo full densification during structural relaxation, transforming into nanopolycrystalline solids with ultrafine grains. Their atomic-scale deformation is dominated by grain boundary-mediated processes, including grain boundary migration and grain growth. In contrast, assemblies composed of larger nanoparticles with radii above ~2.5 nm retain their porous architectures and deform through progressive densification, with plasticity localized at interparticle contacts. These two regimes exhibit fundamentally different strength scaling behaviors. The strength of small-particle assemblies is captured by an inverse Hall–Petch trend, while that of large-particle assemblies conforms to a Gibson–Ashby-type scaling law. Overall, the results reveal two distinct deformation landscapes in disordered nanoparticle assemblies, ranging from grain boundary-controlled softening to porosity-controlled strengthening, which are separated by a critical particle size. This study provides a framework for predicting and tailoring the mechanical performance of nanoparticle-based materials.

Author Contributions

J.B.: Writing—review and editing, Writing—original draft, Visualization, Validation, Supervision, Software, Resources, Project administration, Methodology, Investigation, Funding acquisition, Formal analysis, Data curation, Conceptualization. L.Y.: Writing—review and editing, Writing—original draft, Visualization, Validation, Resources, Methodology, Investigation. All authors have read and agreed to the published version of the manuscript.

Funding

This research was funded by the Natural Science Foundation Research Program of Shaanxi Province, China, grant number 2024JC-YBMS-056.

Data Availability Statement

All data required to reproduce the present findings are present in the paper. Additional datasets that support the findings of this study are available from the corresponding authors upon reasonable request.

Acknowledgments

The support from the Natural Science Foundation Research Program of Shaanxi Province, China, grant number 2024JC-YBMS-056 is acknowledged.

Conflicts of Interest

The authors declare that they have no known competing financial interests or personal relationships that could have appeared to influence the work reported in this paper.

Appendix A

To calculate the mean grain size of the densified assembly with a particle radius of 1.0 nm, an algorithm implemented in the software OVITO was adopted [43]. Initially, individual grains were identified based on the local crystallographic orientation of atoms, which was determined using the polyhedral template matching (PTM) method with a cutoff of 0.1 for the root-mean-square deviation (RMSD) [52]. Then, once the grains were recognized, each grain’s volume was calculated from the number of constituent atoms and their atomic volumes. The equivalent spherical diameter of each grain was then determined using D = (6V/π)1/3, where V was the grain volume. The mean grain size was obtained by averaging these diameters over all grains in the system. For the densified assembly with a particle radius of 1.0 nm, the results are shown in Figure A1. It is noted that the mean grain size steadily increases with the accumulation of the compressive strain, indicating a dominant grain coarsen during the deformation.
Figure A1. (a) In the densified assembly with a particle radius of 1.0 nm, the mean grain size varies with the applied compressive strain. (b,c) show the grain morphologies at the initial and final stages under uniaxial compression (viewed form loading direction), where atoms within each grain are displayed in different colors and all grain atoms are in gray color.
Crystals 15 01007 g0a1

References

  1. Santos, P.J.; Gabrys, P.A.; Zornberg, L.Z.; Lee, M.S.; Macfarlane, R.J. Macroscopic materials assembled from nanoparticle superlattices. Nature 2021, 591, 586–591. [Google Scholar] [CrossRef]
  2. Zabet-Khosousi, A.; Dhirani, A. Charge transport in nanoparticle assemblies. Chem. Rev. 2008, 108, 4072–4124. [Google Scholar] [CrossRef] [PubMed]
  3. Wang, Y.; Kanjanaboos, P.; McBride, S.P.; Barry, E.; Lin, X.M.; Jaeger, H.M. Mechanical properties of self-assembled nanoparticle membranes: Stretching and bending. Faraday Discuss. 2015, 181, 325–338. [Google Scholar] [CrossRef] [PubMed]
  4. Zhao, W.; Yan, Y.; Chen, X.; Wang, T. Combining printing and nanoparticle assembly: Methodology and application of nanoparticle patterning. Innovation 2022, 3, 100253. [Google Scholar] [CrossRef]
  5. He, H.; Yang, T.; Liu, T.; Gao, Y.; Zhang, Z.; Yang, Z.; Liang, F. Soft-hard Janus nanoparticles triggered hierarchical conductors with large stretchability, high sensitivity, and superior mechanical properties. Adv. Mater. 2024, 36, 2312278. [Google Scholar]
  6. Du, L.; Liu, K.; Hu, D.; Backe, O.; Hu, X.; Ji, X.; Fan, J.; Poelma, R.H.; Colliander, M.H.; Zhang, G. Microstructural and mechanical anisotropy in pressure-assisted sintered copper nanoparticles. Acta Mater. 2025, 287, 120772. [Google Scholar] [CrossRef]
  7. Yan, X.; Du, L.; Gu, C.; Tian, T.; Gao, C.; Zhang, G.; Fan, J. Microscale mechanical properties in sintered copper nanoparticles. Mater. Sci. Eng. A 2025, 943, 148684. [Google Scholar] [CrossRef]
  8. Dong, T.; Wu, H.H.; Lin, M.C. Superlattice of octanethiol-protected copper nanoparticles. Langmuir 2006, 22, 6754–6756. [Google Scholar] [CrossRef]
  9. Zurcher, J.; Yu, K.; Schlottig, G.; Baum, M.; Taklo, M.M.V.; Wunderle, B.; Warszynski, P.; Brunschwilder, T. Nanoparticle assembly and sintering towards all-copper flip chip interconnects. In Proceedings of the 2015 IEEE 65th Electronic Components and Technology Conference (ECTC), San Diego, CA, USA, 26–29 May 2015; IEEE: New York, NY, USA, 2015; pp. 1330–1337. [Google Scholar]
  10. Liu, L.; Choi, B.G.; Tung, S.O.; Hu, T.; Liu, Y.; Li, T.; Zhao, T.; Kotov, N.A. Low-current field-assisted assembly of copper nanoparticles for current collectors. Faraday Discuss. 2015, 181, 383–401. [Google Scholar]
  11. Lequieu, J.; Cordoba, A.; Hinckley, D.; de Pablo, J.J. Mechanical response of DNA-nanoparticle crystals to controlled deformation. ACS Cent. Sci. 2016, 2, 614–620. [Google Scholar]
  12. Srivastava, I.; Peters, B.L.; Lane, J.M.D.; Fan, H.; Grest, G.S.; Salerno, M.K. Mechanics of gold nanoparticle superlattices at high hydrostatic pressures. J. Phys. Chem. C 2019, 123, 16457–16466. [Google Scholar] [CrossRef]
  13. An, L.; Zhang, D.; Zhang, L.; Feng, G. Effect of nanoparticle size on the mechanical properties of nanoparticle assemblies. Nanoscale 2019, 11, 9563–9573. [Google Scholar] [CrossRef] [PubMed]
  14. Erbi, M.; Amara, H.; Gatti, R. Tuning elastic properties of metallic nanoparticles by shape controlling: From atomistic to continuous models. Small 2023, 19, 2302116. [Google Scholar] [CrossRef] [PubMed]
  15. Pizzagalli, L.; Godet, J.; Durinck, J.; Brochard, S.; Furstoss, J.; Valencia, F. Twinning and amorphization as plasticity mechanisms in ultra small tungsten nanoparticles. Comp. Mater. Sci. 2025, 258, 114077. [Google Scholar] [CrossRef]
  16. Yang, L.; Bian, J.J.; Wang, G.F. Impact of atomic-scale surface morphology on the size-dependency yield stress of gold nanoparticles. J. Phys. D: Appl. Phys. 2017, 50, 245302. [Google Scholar]
  17. Yan, J.; Yin, S.; Asta, M.; Ritchie, R.O.; Ding, J.; Yu, Q. Anomalous size effect on yield strength enabled by compositional heterogeneity in high-entropy alloy nanoparticles. Nat. Commun. 2022, 13, 2789. [Google Scholar] [CrossRef]
  18. Han, W.Z.; Huang, L.; Ogata, S.; Kimizuka, H.; Yang, Z.C.; Weinberger, C.; Li, Q.J.; Liu, B.Y.; Zhang, X.X.; Li, J.; et al. From ‘smaller is stronger’ to ‘size-independent strength plateau’: Towards measuring the ideal strength of iron. Adv. Mater. 2015, 27, 3385–3390. [Google Scholar]
  19. Greer, J.R.; Oliver, W.C.; Nix, W.D. Size dependence of mechanical properties of gold at the micron scale in the absence of strain gradients. Acta Mater. 2005, 53, 1821–1830. [Google Scholar] [CrossRef]
  20. Greer, J.R.; Nix, W.D. Size dependence of mechanical properties of gold at the submicron scale. Appl. Phys. A Mater. Sci. Process. 2005, 80, 1625–1629. [Google Scholar]
  21. Zhang, Z.; Hossain, Z.M. Geometric confinement governs toughness and strength in defective diamond nanowires. Phys. Rev. B 2020, 101, 014111. [Google Scholar] [CrossRef]
  22. Mao, R.; Pretti, E.; Mittal, J. Temperature-controlled reconfigurable nanoparticle binary superlattices. ACS Nano 2021, 15, 8466–8473. [Google Scholar] [CrossRef] [PubMed]
  23. Missoni, L.L.; Tagliazucchi, M. The phase behavior of nanoparticle superlattices in the presence of a solvent. ACS Nano 2020, 14, 5649–5658. [Google Scholar] [CrossRef] [PubMed]
  24. Shaik, A.H.; Chakraborty, J. Synthesis of monodisperse copper nanoparticles using a modified digestive ripening technique and formation of superlattices. RSC Adv. 2015, 5, 85974–85977. [Google Scholar] [CrossRef]
  25. Ouyang, T.; Akbari-Sharbaf, A.; Park, J.; Bauld, R.; Cottam, M.G.; Fanchini, G. Self-assembled metallic nanoparticle superlattices on large-area graphene thin films: Growth and evanescent waveguiding properties. RSC Adv. 2015, 5, 98814–98821. [Google Scholar] [CrossRef]
  26. Lu, L.; Shen, Y.; Chen, X.; Qian, L.; Lu, K. Ultrahigh strength and high electrical conductivity in copper. Science 2004, 304, 422–426. [Google Scholar] [CrossRef]
  27. Lu, L.; Chen, X.; Huang, X.; Lu, K. Revealing the maximum strength in nanotwinned copper. Science 2009, 323, 607. [Google Scholar] [CrossRef]
  28. Lu, C.; Pan, Y.; Fang, H.; Wu, B.; Wu, Y.; Chen, J.; He, Q.; Liu, Z. Weak size-dependent strength and extreme plastic deformation of single crystal Cu microparticles. J. Phys. Chem. C 2024, 128, 11419–11426. [Google Scholar] [CrossRef]
  29. Bian, J.J.; Wang, G.F. Atomistic deformation mechanisms in copper nanoparticles. J. Comput. Theor. Nanosci. 2013, 10, 2299–2303. [Google Scholar] [CrossRef]
  30. Nguyen, T.D.; Plimpton, S.J. Aspherical particle models for molecular dynamics simulation. Comp. Phys. Commun. 2019, 243, 12–24. [Google Scholar]
  31. Mindlin, R.D.; Deresiewicz, H. Elastic spheres in contact under varying oblique force. ASME J. Appl. Mech. 1953, 20, 327–344. [Google Scholar] [CrossRef]
  32. Tsuji, Y.; Tanaka, T.; Ishida, T. Lagrangian numerical simulation of plug flow of cohesionless particles in a horizontal pipe. Powder Technol. 1992, 71, 239–250. [Google Scholar] [CrossRef]
  33. Nosé, S.A. A unified formulation of the constant temperature molecular dynamics methods. J. Chem. Phys. 1984, 81, 511–519. [Google Scholar] [CrossRef]
  34. Hoover, W.G. Canonical dynamics: Equilibrium phase-space distributions. Phys. Rev. A 1985, 31, 1695–1697. [Google Scholar] [CrossRef] [PubMed]
  35. Plimpton, S. Fast parallel algorithms for short-range molecular dynamics. J. Comp. Phys. 1995, 117, 1–19. [Google Scholar] [CrossRef]
  36. Mishin, Y.; Mehl, M.J.; Papaconstantopoulos, D.A.; Voter, A.F.; Kress, J.D. Structural stability and lattice defects in copper: Ab initio, tight-binding, and embedded-atom calculations. Phys. Rev. B 2001, 63, 224106. [Google Scholar] [CrossRef]
  37. Zhang, X.; Han, J.; Plombon, J.J.; Sutton, A.P.; Srolovitz, D.J.; Boland, J.J. Nanocrystalline copper films are never flat. Science 2017, 357, 398–400. [Google Scholar] [CrossRef] [PubMed]
  38. Sharma, A.; Hickman, J.; Gazit, N.; Rabkin, E.; Mishin, Y. Nickel nanoparticles set a new record of strength. Nat. Commun. 2018, 9, 4102. [Google Scholar] [CrossRef]
  39. Morante, S.; Rossi, G.C.; Testa, M. The stress tensor of a molecular system: An exercise in statistical mechanics. J. Chem. Phys. 2006, 125, 034101. [Google Scholar] [CrossRef]
  40. Stukowski, A. Structure identification method for atomistic simulations of crystalline materials. Model. Simul. Mater. Sci. Eng. 2012, 20, 045021. [Google Scholar] [CrossRef]
  41. Tsuzuki, H.; Branicio, P.S.; Rino, J.P. Structural characterization of deformed crystals by analysis of common atomic neighborhood. Comp. Phys. Commun. 2007, 177, 518–523. [Google Scholar] [CrossRef]
  42. Stukowski, A. Visualization and analysis of atomistic simulation data with Ovito-the Open Visualization Tool. Model. Simul. Mater. Sci. Eng. 2010, 18, 015012. [Google Scholar] [CrossRef]
  43. Falk, M.L.; Langer, J.S. Dynamics of viscoplastic deformation in amorphous solids. Phys. Rev. E 1998, 57, 7192. [Google Scholar] [CrossRef]
  44. Schiotz, J.; Jacobsen, K.W. A maximum in the strength of nanocrystalline copper. Science 2002, 301, 1357–1359. [Google Scholar]
  45. Schiotz, J.; Di Tolla, F.D.; Jacobsen, K.W. Softening of nanocrystalline metals at very small grain sizes. Nature 1998, 391, 561–563. [Google Scholar] [CrossRef]
  46. Gibson, L.; Ashby, M. Cellular Solids: Structure and Properties, 2nd ed.; Cambridge University Press: Cambridge, UK, 1997. [Google Scholar]
  47. Sun, X.; Xu, G.; Li, X.; Feng, X.; Gao, H. Mechanical properties and scaling laws of nanoporous gold. J. Appl. Phys. 2013, 113, 023505. [Google Scholar] [CrossRef]
  48. Bian, J.; Wang, G.; Feng, X. Atomistic calculation of surface energy of spherical copper surfaces. Acta Mech. Solida. Sin. 2012, 25, 557–561. [Google Scholar] [CrossRef]
  49. Wang, J.; Chen, S.; Cui, K.; Li, D.; Chen, D. Approach and coalescence of gold nanoparticles driven by surface thermodynamic fluctuations and atomic interaction forces. ACS Nano 2016, 10, 2893–2902. [Google Scholar] [CrossRef]
  50. Singh-Miller, N.E.; Marzari, N. Surface energies, work functions, and surface relaxations of low-index metallic surfaces from first principles. Phys. Rev. B 2009, 89, 235407. [Google Scholar] [CrossRef]
  51. Schweizer, P.; Sharma, A.; Petho, L.; Huszar, E.; Vogl, L.M.; Michler, J.; Maeder, X. Atomic scale volume and grain boundary diffusion elucidated by in situ STEM. Nat. Commun. 2023, 14, 7601. [Google Scholar] [CrossRef]
  52. Larsen, P.M.; Schmidt, S.; Schiotz, J. Robust structural identification via polyhedral template matching. Model. Simul. Mater. Sci. Eng. 2016, 24, 055007. [Google Scholar] [CrossRef]
Figure 1. Atomic models of disordered copper nanoparticle assemblies with particle radii ranging from 1.5 to 6.0 nm.
Crystals 15 01007 g001
Figure 2. (a) Stress–strain curves of assemblies with different particle radii, and (b) variation in the average flow stress versus particle radius. Error bars show the standard deviation (SD) calculated from three independent simulations of randomly disordered assemblies. The background colors in (b) highlight two regimes with different trends in the flow stress.
Crystals 15 01007 g002
Figure 3. Atomic configurations of the nanoparticle assembly with particle radius of 1.0 nm before (a) and after (b) structural relaxation. (c) Corresponding evolution of the fraction of defective atoms during the relaxation process.
Crystals 15 01007 g003
Figure 4. Assembly of nanoparticles with a radius of 1.0 nm under uniaxial compression along x-axis. Panels (ac) show the distribution of the defective atoms at strains of 0.05, 0.10, and 0.15, respectively; while panels (df) illustrate the corresponding plastic deformation zones. The plastic zones are visualized using the non-affine squared displacement, D2.
Crystals 15 01007 g004
Figure 5. Atomic configurations of nanoparticle assembly with particle radius of 6.0 nm before (a) and after (b) structural relaxation. Panel (c) presents the evolution of the fraction of defective atoms during the relaxation process (c). The black arrows in (a,b) indicate the local deformations after a structural relaxation.
Crystals 15 01007 g005
Figure 6. Assembly of nanoparticles with a radius of 6.0 nm under uniaxial compression along the x-axis. Panels (ac) show the distribution of the defective atoms at strains of 0.05, 0.10, and 0.15, respectively; and panels (df) present the corresponding plastic deformation zones visualized using the non-affine squared displacement, D2. Panels (gi) illustrate the nucleation (marked by the blue arrow) and evolution of dislocations around interparticle contact interfaces.
Crystals 15 01007 g006
Figure 7. (a) Evolution of fcc atom fraction in assemblies with different particle sizes. (b) Variation in relative density of the nanoparticle assemblies versus particle size after structural relaxation. (c) Variation in the relative density as a function of strain during uniaxial compression tests. (d) Relation between the stress and the relative density for assemblies with different particle sizes.
Crystals 15 01007 g007
Figure 8. Average flow stress versus nanoparticle radius for copper assemblies at 300 K. Simulation data (red diamonds) are fitted by Equation (3) (blue dashed curve, R2 = 0.995). A transition between Regime I and Regime II occurs at ~2.5 nm.
Crystals 15 01007 g008
Disclaimer/Publisher’s Note: The statements, opinions and data contained in all publications are solely those of the individual author(s) and contributor(s) and not of MDPI and/or the editor(s). MDPI and/or the editor(s) disclaim responsibility for any injury to people or property resulting from any ideas, methods, instructions or products referred to in the content.