Article

Variation in Carbon Content During the Melting of γ-TiAl in a Graphite Crucible

1
Department of Advanced Materials Science and Engineering, Sungkyunkwan University, 2066 Seobu-ro, Jangan-gu, Suwon-si 16419, Gyeonggi-do, Republic of Korea
2
Materials Engineering Team, Hanwha Aerospace, 6, Pangyo-ro, 319beon-gil, Bundang-gu, Seongnam-si 13488, Gyeonggi-do, Republic of Korea
*
Author to whom correspondence should be addressed.
Crystals 2025, 15(12), 1006; https://doi.org/10.3390/cryst15121006 (registering DOI)
Submission received: 21 October 2025 / Revised: 10 November 2025 / Accepted: 18 November 2025 / Published: 22 November 2025

Abstract

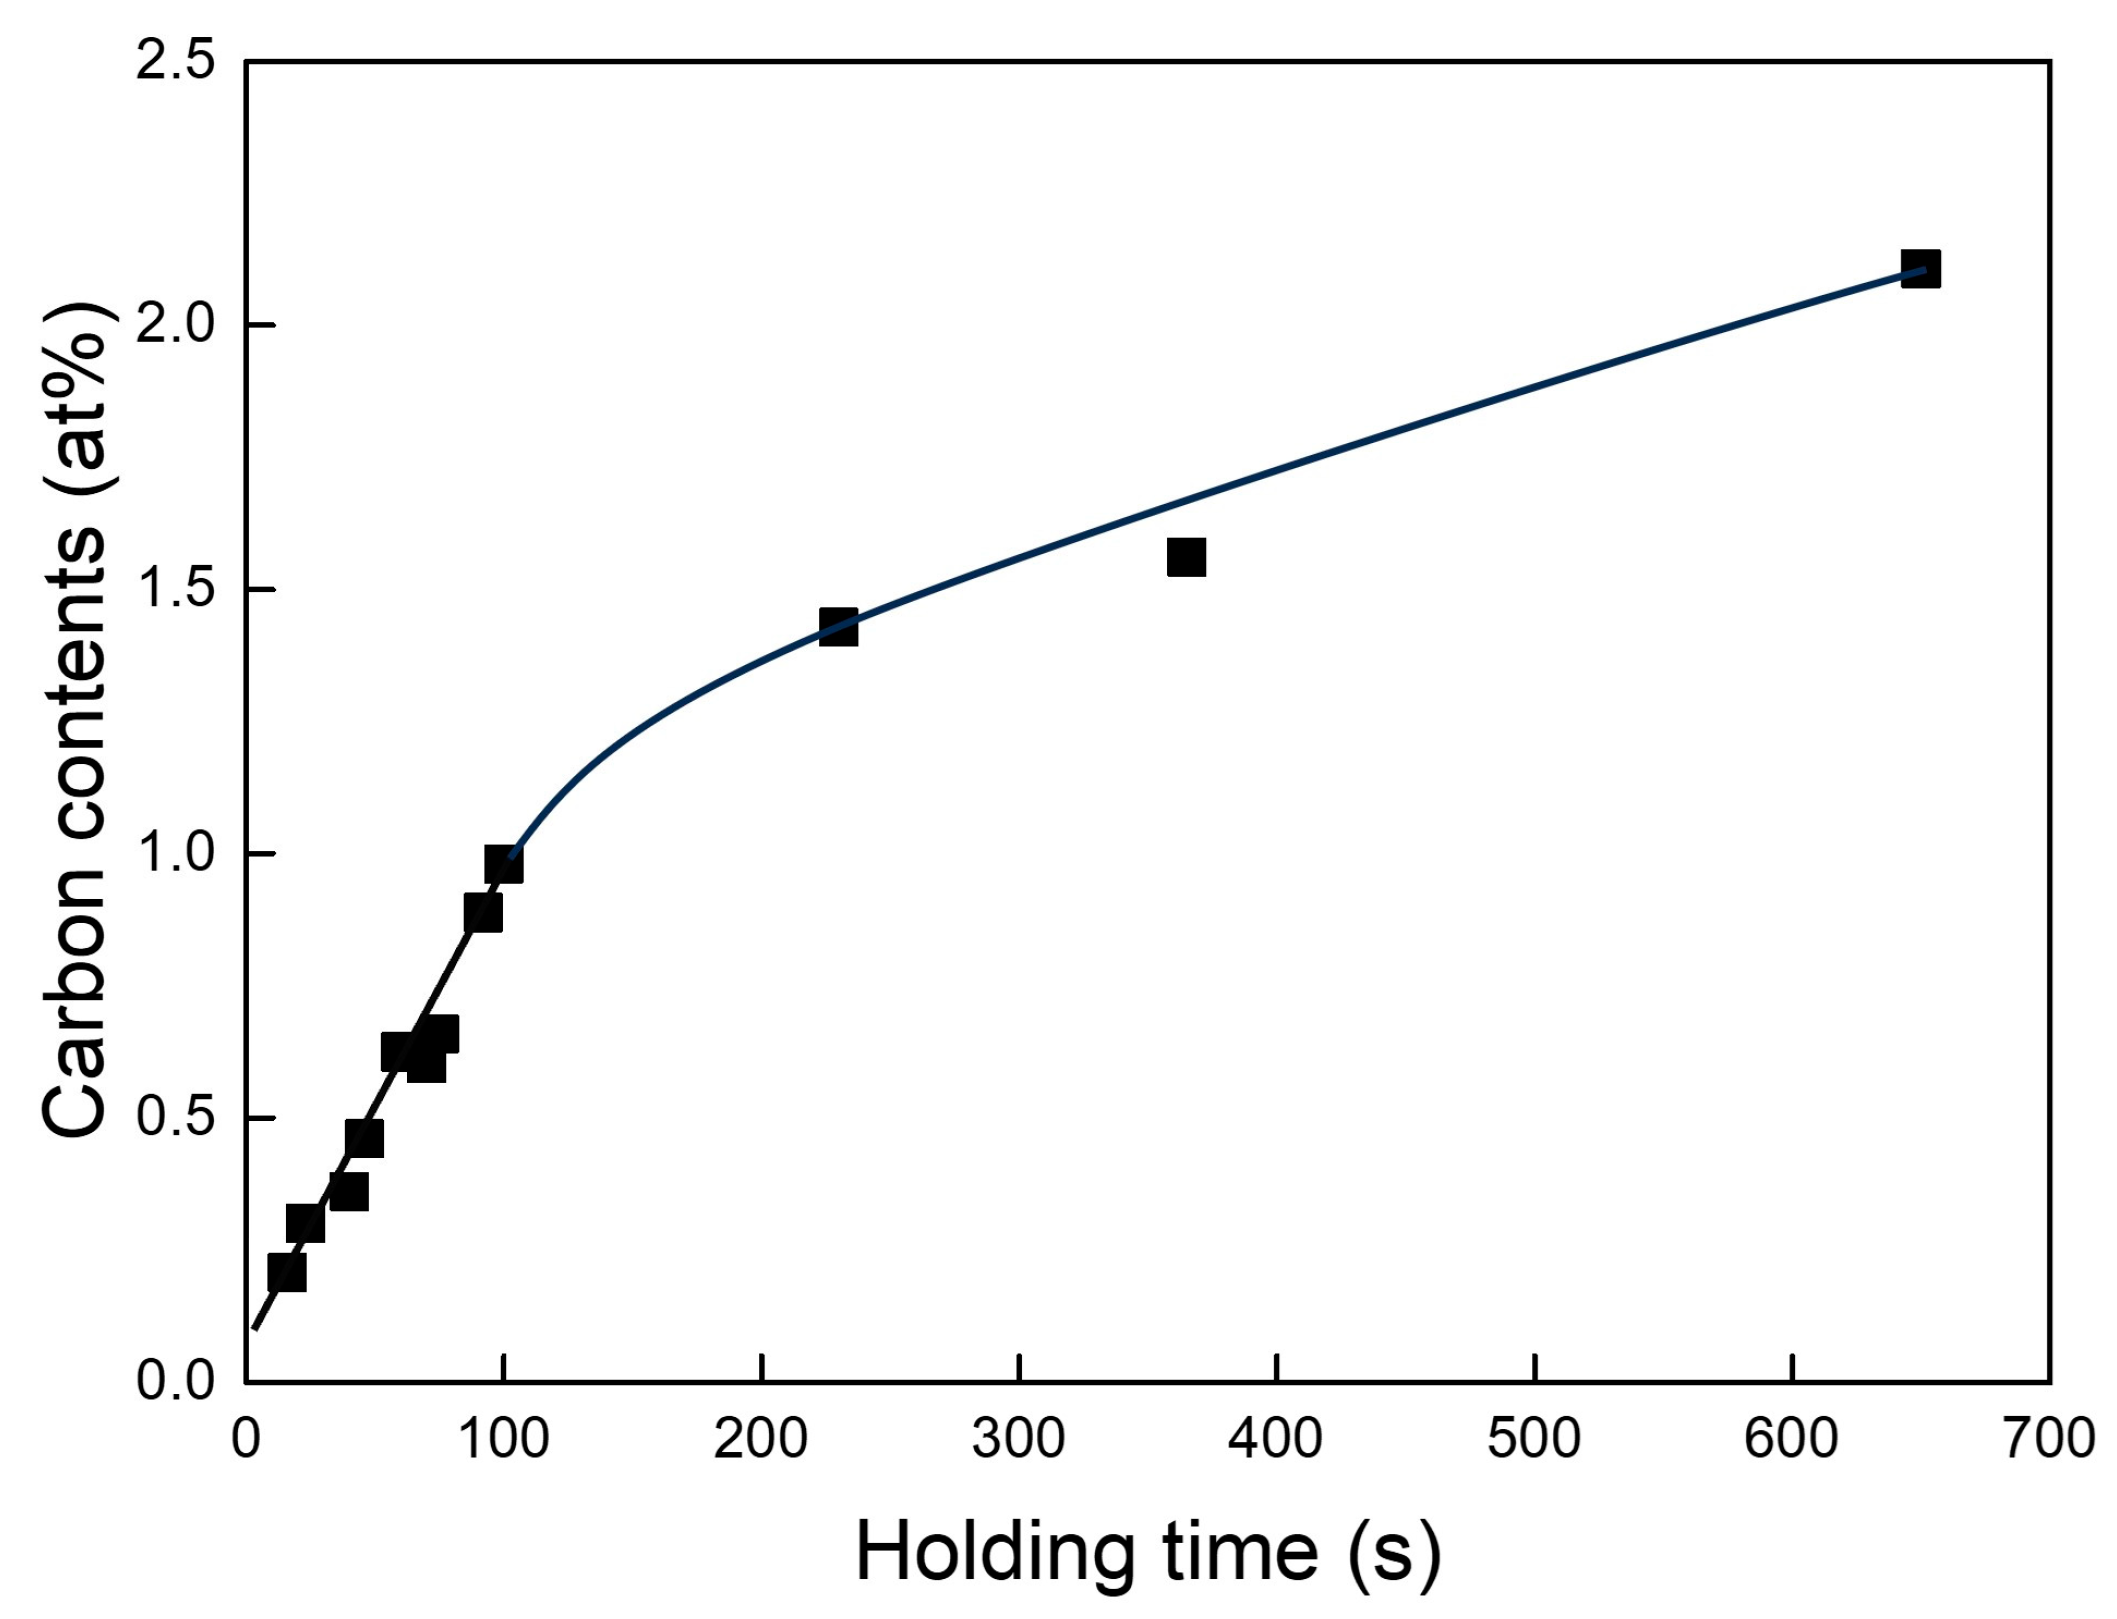
Liquid γ-TiAl alloy was prepared by vacuum induction melting within graphite crucibles, then cast using a centrifugal technique. In this process, the degree of superheat (ΔT)—defined as the temperature above the melting point—was carefully controlled, with experiments conducted at ΔT of 200 K (i.e., 200 Kelvin above the melting temperature). It was observed that carbon content in the alloy increased nonlinearly as the melt was held longer in the graphite crucible; for example, carbon concentration rose from an initial value of approximately 0.21 at% to 0.98 at% after 100 s of holding and to 2.11 at% at 650 s of holding. When the melt was held for over 100 s at ΔT = 200 K, titanium carbide (TiC) and titanium aluminum carbide (Ti2AlC) particles formed along the crucible wall. This resulted in changes to the phase fractions and a corresponding increase in aluminum concentration in the melt. Two types of Ti2AlC phases were observed: one consisted of coarse Ti2AlC particles, which were crystallized through peritectic reaction from the TiC carbide and liquid phase. The other consisted of fine Ti2AlC particles, which were decomposed from the α2 (Ti3Al) phase within the interlamellar regions. After 20 s of holding at ΔT = 200 K, carbon rapidly dissolved into a solid solution. Prolonged holding led to significant grain refinement: the microstructure evolved from columnar to equiaxed grains, primarily due to TiC crystallization. This transition is significant because finer, equiaxed grains can enhance mechanical properties such as strength and toughness. The findings provide valuable insight into the interaction between graphite crucibles and γ-TiAl melts, demonstrating how controlled superheat and holding time influence carbon uptake, carbide formation, and microstructural evolution—factors critical for optimizing the performance and manufacturability of γ-TiAl components.

1. Introduction

γ-TiAl alloys have been recognized as promising alternatives to conventional nickel-based superalloys. These alloys offer high-temperature strength and lower density, making them advantageous for engineering applications where weight reduction is critical. In the aerospace sector, γ-TiAl alloys are increasingly considered for components such as turbine blades and turbocharger wheels, where their use can contribute to reduced engine weight and enhanced efficiency. This, in turn, may support improved fuel economy, lower emissions, and operational cost savings, aligning with the industry’s growing emphasis on sustainability and environmental responsibility [1]. However, the adoption of γ-TiAl components remains limited, primarily due to their high production costs. Furthermore, manufacturing these alloys poses significant challenges, stemming from their brittleness at ambient temperatures, limited workability, poor fluidity, and particularly high chemical reactivity in the molten state [2,3,4]. In recent years, the increased adoption of additive manufacturing (AM) has been mostly driven by fast-paced research and development in metal AM, featuring powder metals from Ti alloys to Ni-based superalloys for high-temperature applications. Despite abundant R&D, there are still many challenges in AM of Ti alloys, especially in the inherently rough initial (as-built) surface finishing barriers and the loss of Al elements to be overcome prior to even wider adoption [5].
Investment casting offers high-dimensional accuracy and excellent surface finish at a relatively low cost, particularly for manufacturing components with complex geometries, such as turbochargers [6]. Due to the high chemical reactivity of Ti, its melting and casting must be conducted with great care. To minimize melt contamination, the induction skull melting (ISM) process using a cold crucible has been employed [7]. However, the cold crucibles often lead to casting defects, such as misruns and cold shuts, primarily due to the low ΔT involved.
Vacuum induction melting (VIM) allows for higher ΔT, but it tends to introduce elevated impurity levels into the melts as a result of reactions between the crucible material and the γ-TiAl melts [8]. Consequently, extensive research has been conducted to select suitable crucibles for melting of Ti alloys and to investigate the effect of casting conditions on impurity levels, aiming to produce high-purity castings.
γ-TiAl castings produced using calcium oxide or yttrium oxide crucibles have demonstrated acceptable impurity levels [9,10,11,12,13]. However, the calcium oxide crucibles suffer from low shock resistance and are prone to hydration [9], while the yttrium oxide crucibles are costly and vulnerable to thermal shock [14]. To address these limitations, research has focused on developing low-cost crucibles through the application of yttria coatings. Yttria-coated crucibles have shown promising results in terms of cost-effectiveness and casting purity [15]. Nevertheless, these crucibles require careful handling to prevent cracking, which may result from poor thermal shock resistance or inadequate adhesion of the coating to the crucible substrate. Despite the advantages of graphite crucibles, including ease of handling, low cost, and excellent thermal and erosion resistance, they have not been widely adopted in the melting of Ti alloys. One major limitation is the lack of comprehensive data on the relationship between the variation in melting conditions and the amount of carbon contamination when graphite crucibles are used.
There are two distinct viewpoints on the impact of carbon contamination in molten γ-TiAl alloys. On the one hand, carbon can enhance γ-TiAl alloys through solid solution strengthening and precipitation hardening effects [16]. Recent studies have also explored in situ TiAl matrix composites reinforced with carbides formed during vacuum induction melting (VIM), demonstrating that carbides can improve fracture toughness and slow creep deformation at high temperatures, provided the carbon content remains below 0.5 at% [17,18,19,20,21]. On the other hand, some researchers argue that graphite crucibles are unsuitable for γ-TiAl melting due to the risk of severe carbon contamination, which can reach up to 7 at% [22,23]. Therefore, when melting TiAl in graphite crucibles, it is crucial to clearly analyze how varying carbon content affects the alloy’s microstructure.
This study seeks to assess the interactions between graphite crucibles and γ-TiAl alloy melts under conditions that guarantee thorough mold filling, particularly for turbocharger wheels having intricate geometries and thin-walled structures. Fluidity tests are conducted at various ΔT to determine the optimal pouring temperature. Additionally, the correlation between changes in carbon content and the microstructural evolution of γ-TiAl alloys at different durations of holding (Δt) of melts is investigated. The feasibility of graphite crucibles for melting of γ-TiAl alloys is also examined.

2. Experimental Procedure

2.1. Production of the Investment Mold

The wax pattern and sprue were assembled to have a direct gating system because it could manufacture the intact shape of turbochargers. The turbocharger wax pattern had a diameter of 63.5 mm and a blade tip thickness of 1 mm. The primary slurry comprising the colloidal silica binder (30% SiO2, 15 nm) and alumina refractories was mixed until the efflux time measured via Zahn cup #4 (ASTM D-4212) was 40 s. The primary coating was performed three times. Backup coating was performed seven times using a mix of chamotte, fused silica refractories, and colloidal silica under constant temperature and humidity conditions. The molds were dewaxed in an autoclave at a pressure and temperature of 0.5 MPa and 423 K, respectively. The firing process was conducted at 1223 K for 2 h in the air atmosphere.

2.2. Induction Melting and Centrifugal Casting

The VAR (vacuum arc remelted) ingot of Ti-48Al-2Cr-2Nb (at%) (Ti4822, purity of 99%, Gfe Gesellschaft für Elektrometallurgie mbH, Nürnberg, Germany) was selected for the evaluation of reactivity with the graphite crucible. Ti4822 alloy (250 g) was melted and cast in vacuum induction melting and vacuum centrifugal casting furnaces. Graphite (99% purity, Dongbang Carbon Co., Ltd., Hwaseong-si, Republic of Korea) was used as a crucible material. The chamber was evacuated at a pressure of 0.001 mbar and refilled with argon gas to 700 mbar to prevent the evaporation of aluminum. The casting was performed at ΔT of 130 K, 170 K, 200 K, and 230 K. The holding-time (Δt) experiment was conducted only at ΔT = 200 K, where Δt was varied from 20 to 650 s to evaluate the interaction between the TiAl melts and the graphite crucible. The temperature of the γ-TiAl melts was measured using a two-color pyrometer (RAYMR1SBSF, Raytek Corp., Santa Cruz, CA, USA).
As the melts heated to the target temperature, the chamber rotated to 300 rpm within 2 s. The rotation was maintained for approximately 1 min, although mold filling was completed within 2 s; the remaining time was used to sustain the applied pressure on the melt. The final pouring temperature was determined from the condition that satisfied mold filling. A detailed schematic of the casting machine is presented in [24].

2.3. Characterization of Castings and Graphite Crucible

Carbon contents of castings were analyzed using a carbon/sulfur analyzer (CS-200, LECO Corp., St. Joseph, MI, USA). The morphologies of castings and interface microstructures between the crucible and melts were observed using an optical microscope (DM 2700M, Leica Microsystems GmbH, Wetzlar, Germany) and field emission scanning electron microscopy (FE-SEM, JSM-7600F, JEOL Ltd., Tokyo, Japan). In addition, a stereomicroscope (EMZ-TR, Meiji Techno Co., Ltd., Saitama, Japan) was used to evaluate the grain size. The phase identification and chemical composition of the castings were analyzed via X-ray diffraction (XRD, M18XHF-SRA, Mac Science Co., Ltd., Yokohama, Japan), energy dispersive X-ray spectrometry (EDS, JSM-7600F, JEOL Ltd., Tokyo, Japan), and spark emission spectrometry (OES, QSN 750-2, OBLF GmbH, Witten, Germany).

3. Results and Discussion

3.1. Optimum Degree of Superheating (ΔT) for Mold Filling of Turbocharger Castings

The fluidities of γ-TiAl at ΔT of 130 K, 170 K, 200 K, and 230 K were evaluated to determine the suitable pouring temperature for the turbocharger casting. Figure 1 shows the exterior of the turbocharger castings on the front, back and blade tip. Misrun at the disk and blade tips and cold shut were observed on the blade when the ΔT was 130 K. At 170 K, misrun and cold shut were sustained in the disk and blade tips, though misrun on the blade tip was reduced. At ΔT above 200 K, the unfilled cavities and cold shut were not observed. Therefore, ΔT above 200 K was required to fill the entire turbocharger cavity.
The final pouring temperature was set to achieve a ΔT of 200 K to ensure proper mold filling, since higher superheating can accelerate melt contamination [25].

3.2. Variation in Carbon Content and Chemical Composition with Respect to Holding Time (Δt)

The reactivity of TiAl melts with the graphite crucible was evaluated with respect to holding the melts at ΔT of 200 K. Figure 2 shows the variation in carbon contamination in the castings. The carbon content increased linearly up to a holding time of 100 s, after which the rate declined with prolonged holding, eventually reducing to one-fifth of the initial rate. Because the rate of carbon increase became much smaller beyond 100 s, the holding experiments in the longer-time region were performed at wider time intervals to confirm the gradual saturation behavior of carbon absorption.
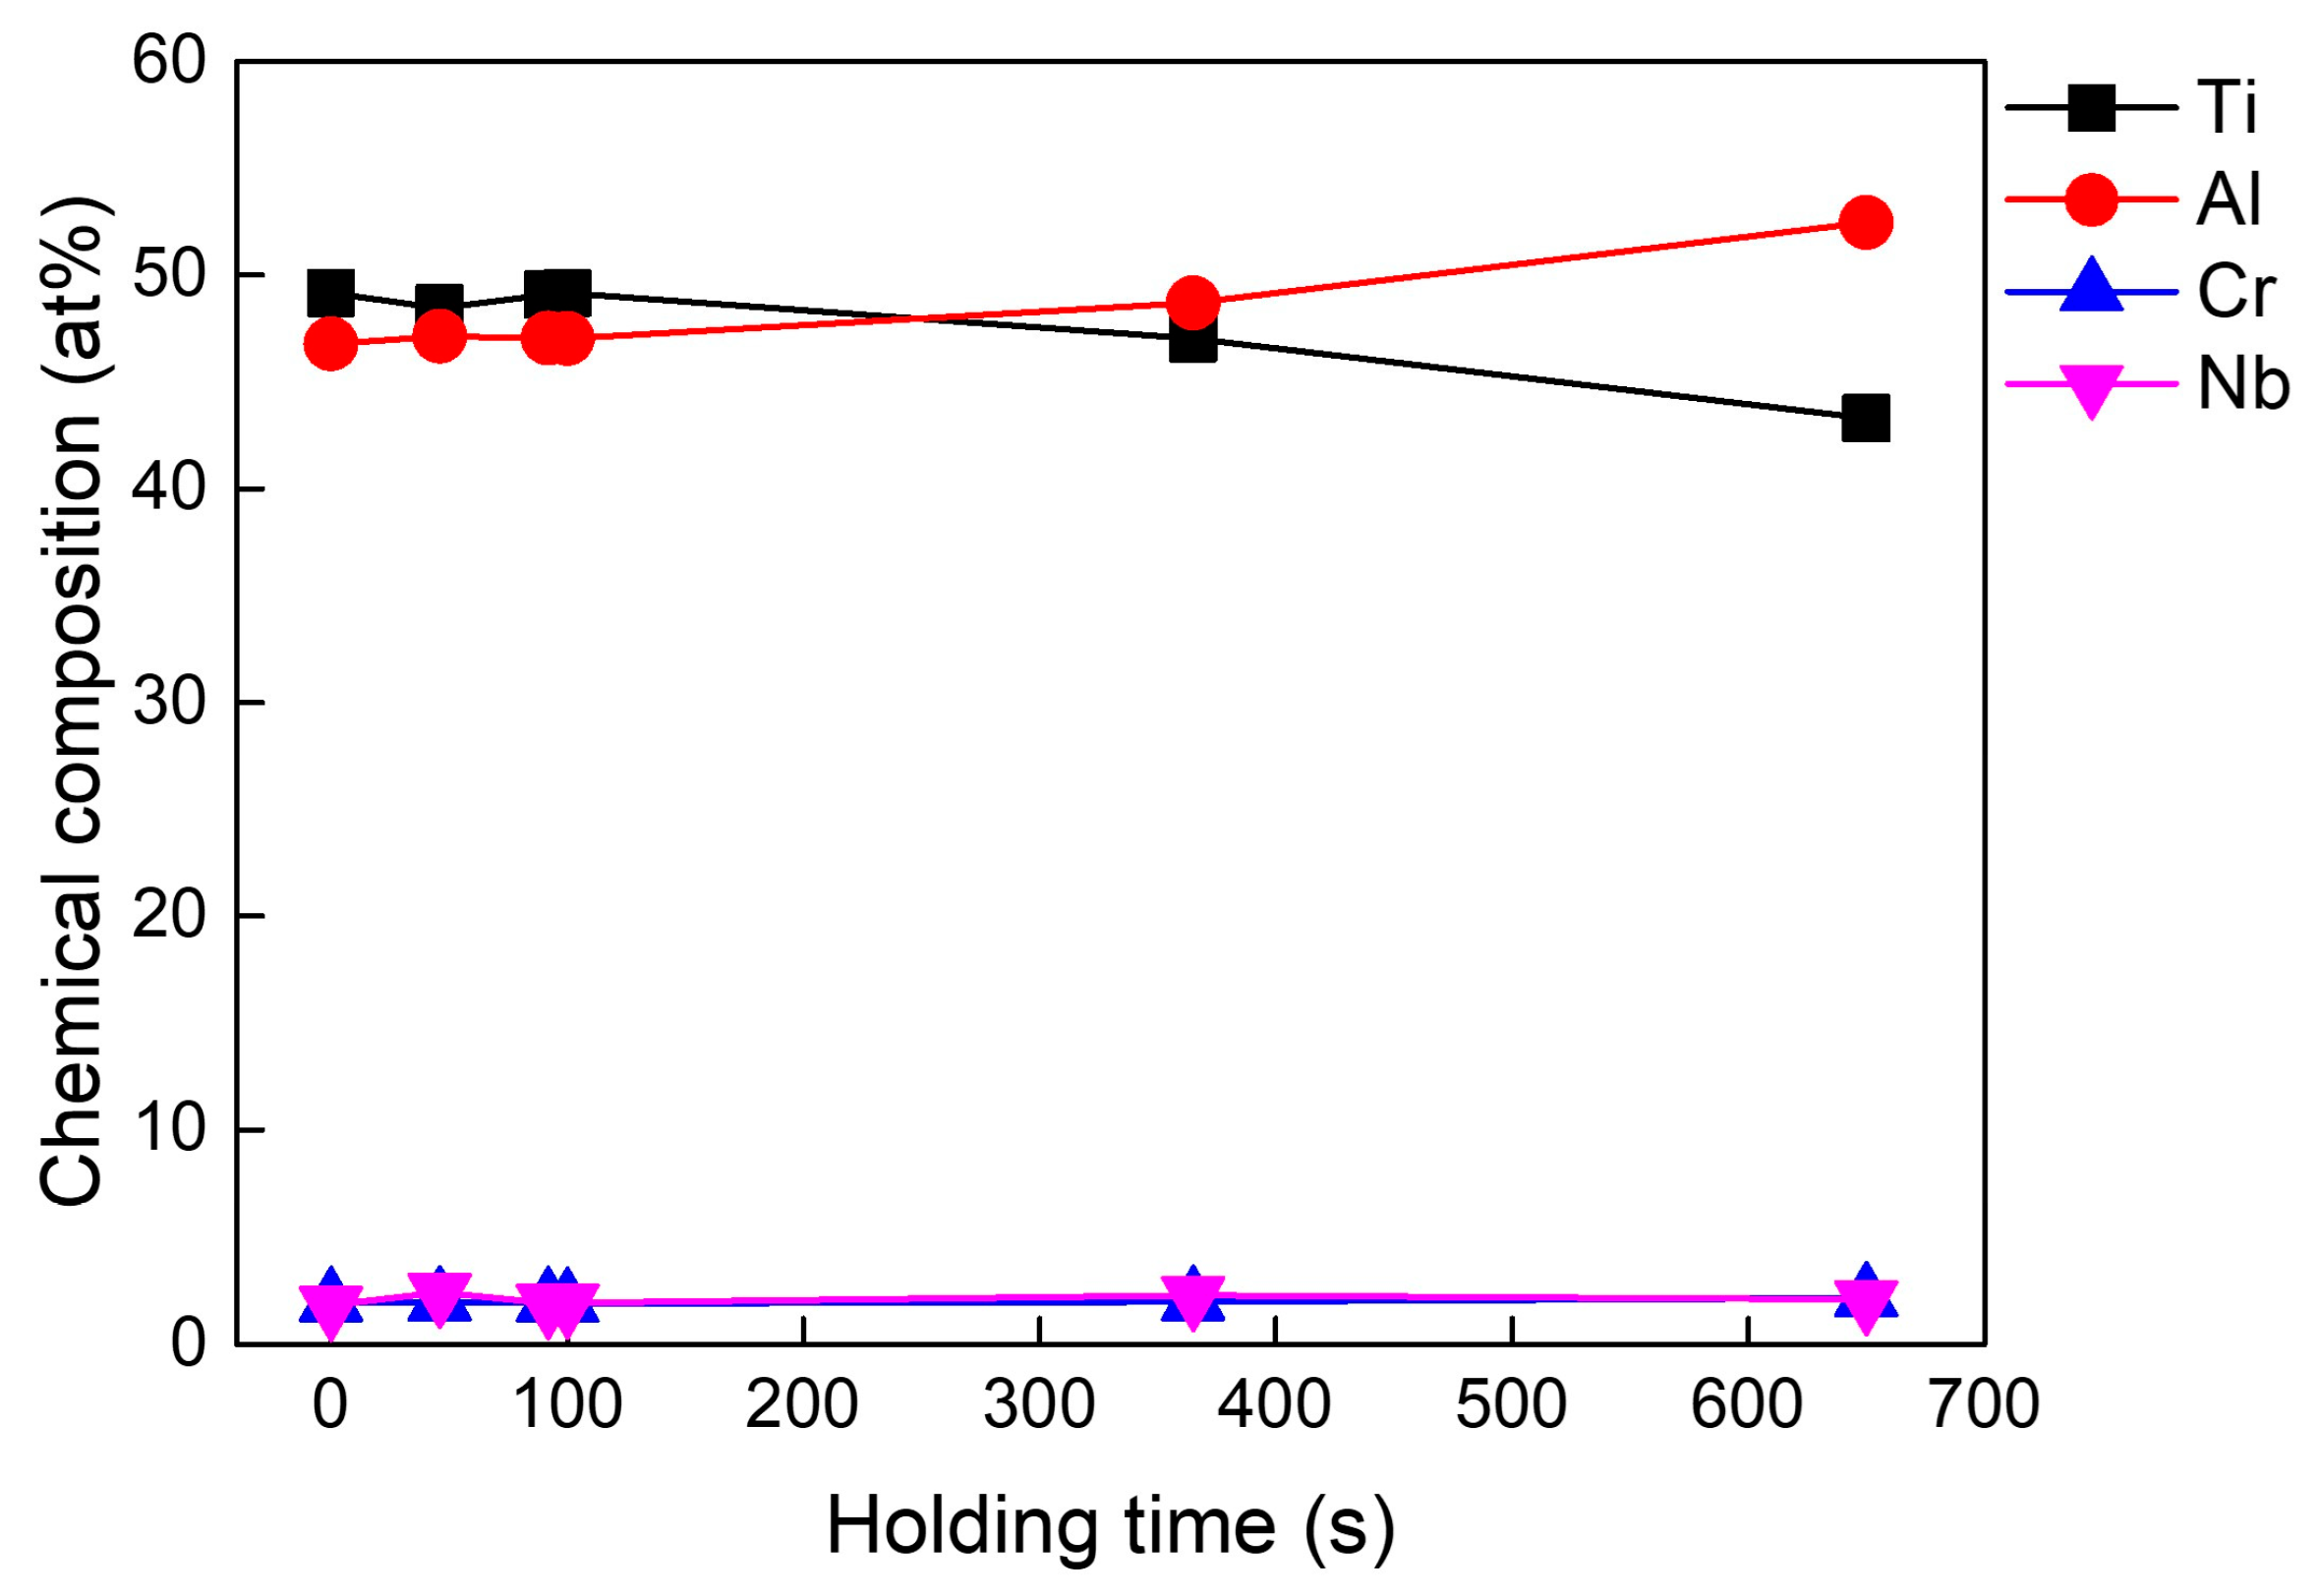
Figure 3 shows OES results indicating the change in the chemical composition of the castings with respect to holding time. The contents of Ti, Al, Cr, and Nb remained relatively constant up to a holding time of 100 s. After that, however, Al concentration gradually increased and finally reached 52.5 at% for a holding time of 650 s, while the Cr and Nb remained constant. For each holding-time condition, three cross-sectional samples were analyzed, and the average values are shown. The measurement error of the OES analysis was within 1.5%, which is smaller than the size of the symbols in Figure 3.

3.3. Compositional Change in Castings and Variation in Carbon Contamination Rate

When the liquid γ-TiAl was held for 100 s at ΔT of 200 K, the carbon concentration measured 0.98 at%. To elucidate the subsequent increase in Al concentration and the reduction in carbon contamination rate beyond Δt of 100 s, the interface between the graphite crucible and the residual melt was examined.
Figure 4 shows the cross-section of the crucible and the interface morphology, along with XRD analysis of the residual melts. Blue square boxes in the Figure 4a–c indicate the observed areas. As Δt increased, the amounts of residual melts gradually rose, leading to significant crucible erosion. At Δt of 650 s, extensive erosion was evident, accompanied by a large accumulation of residual melts and an increased carbon content of 2.11 at%.
The XRD analysis of the residual TiAl performed at Δt of 650 s is shown in Figure 4g. The phases of the residual melt, being cast into the mold, did not correspond to TiAl matrices (α2 and γ), but large amounts of Ti2AlC and small amounts of TiC phases were observed.
Figure 5 and Table 1 present the results of FE-SEM and EDS analyses for the interface between the residual TiAl and graphite crucible, respectively. Under all conditions, the melts penetrated the pores of the graphite crucible. In Figure 5, at the boundary between the graphite crucible and residual melts, a thin layer of A, C, and E was observed. This layer was identified as a binary composition of titanium and carbon. The round-edged phases (regions of B, D, and F) grew behind the binary phase and spread toward the melts. The phase proportion of titanium, aluminum, and carbon was confirmed to be 2:1:1. The binary phase finally got thicker to 10 μm, and the ternary compound was observed as a lump without a matrix beyond a holding time of 650 s in the residual melts. The thin layers marked by arrows A and C in Figure 5 correspond to the TiC phase, whereas the rounded feature located behind the interface is identified as the Ti2AlC phase, as confirmed by XRD and EDS analyses. TiC is the primary solidification phase in TiAl alloys, and Ti2AlC can be formed from TiC at 1962 K [26,27]. Ti2AlC originated from the TiC at a molten state, following the formation sequence L + TiC → L + Ti2AlC [26]. Furthermore, the remaining TiC at the crucible wall could not transform into Ti2AlC because of the rapid cooling of the crucible after casting.
As shown in Figure 4 and Figure 5 and Table 1, the TiC and Ti2AlC phases, which are richer in titanium, adhered to the crucible walls and remained in the crucible after casting. Consequently, aluminum content of the melts increased, leading to higher aluminum concentration in the castings.
Because graphite crucibles are used with indirect heating, one of the main drawbacks of a graphite crucible in induction melting is the small degree of force applied by the EM field to melt, which does not allow the metal to be stirred during melting [28]. As the holding time exceeded 100 s, more carbides were incorporated into the melt, which led to increased viscosity [29]. This higher viscosity made electromagnetic stirring less effective; consequently, the stirring force might no longer be sufficient to detach the carbides from the crucible wall. The carbides could adhere to the crucible wall during the melting process. As a result, carbides began to accumulate more readily at the crucible wall, overcoming the stirring action and building up along the wall as the melting process continued.
During melting, a layer of solid TiC and Ti2AlC progressively formed along the crucible wall, acting as a partial diffusion barrier. Although this layer did not completely prevent carbon ingress, it slowed the rate of carbon transfer from the crucible into the melt.

3.4. Microstructural Evolution of TiAl Castings as a Function of Holding Time, Δt

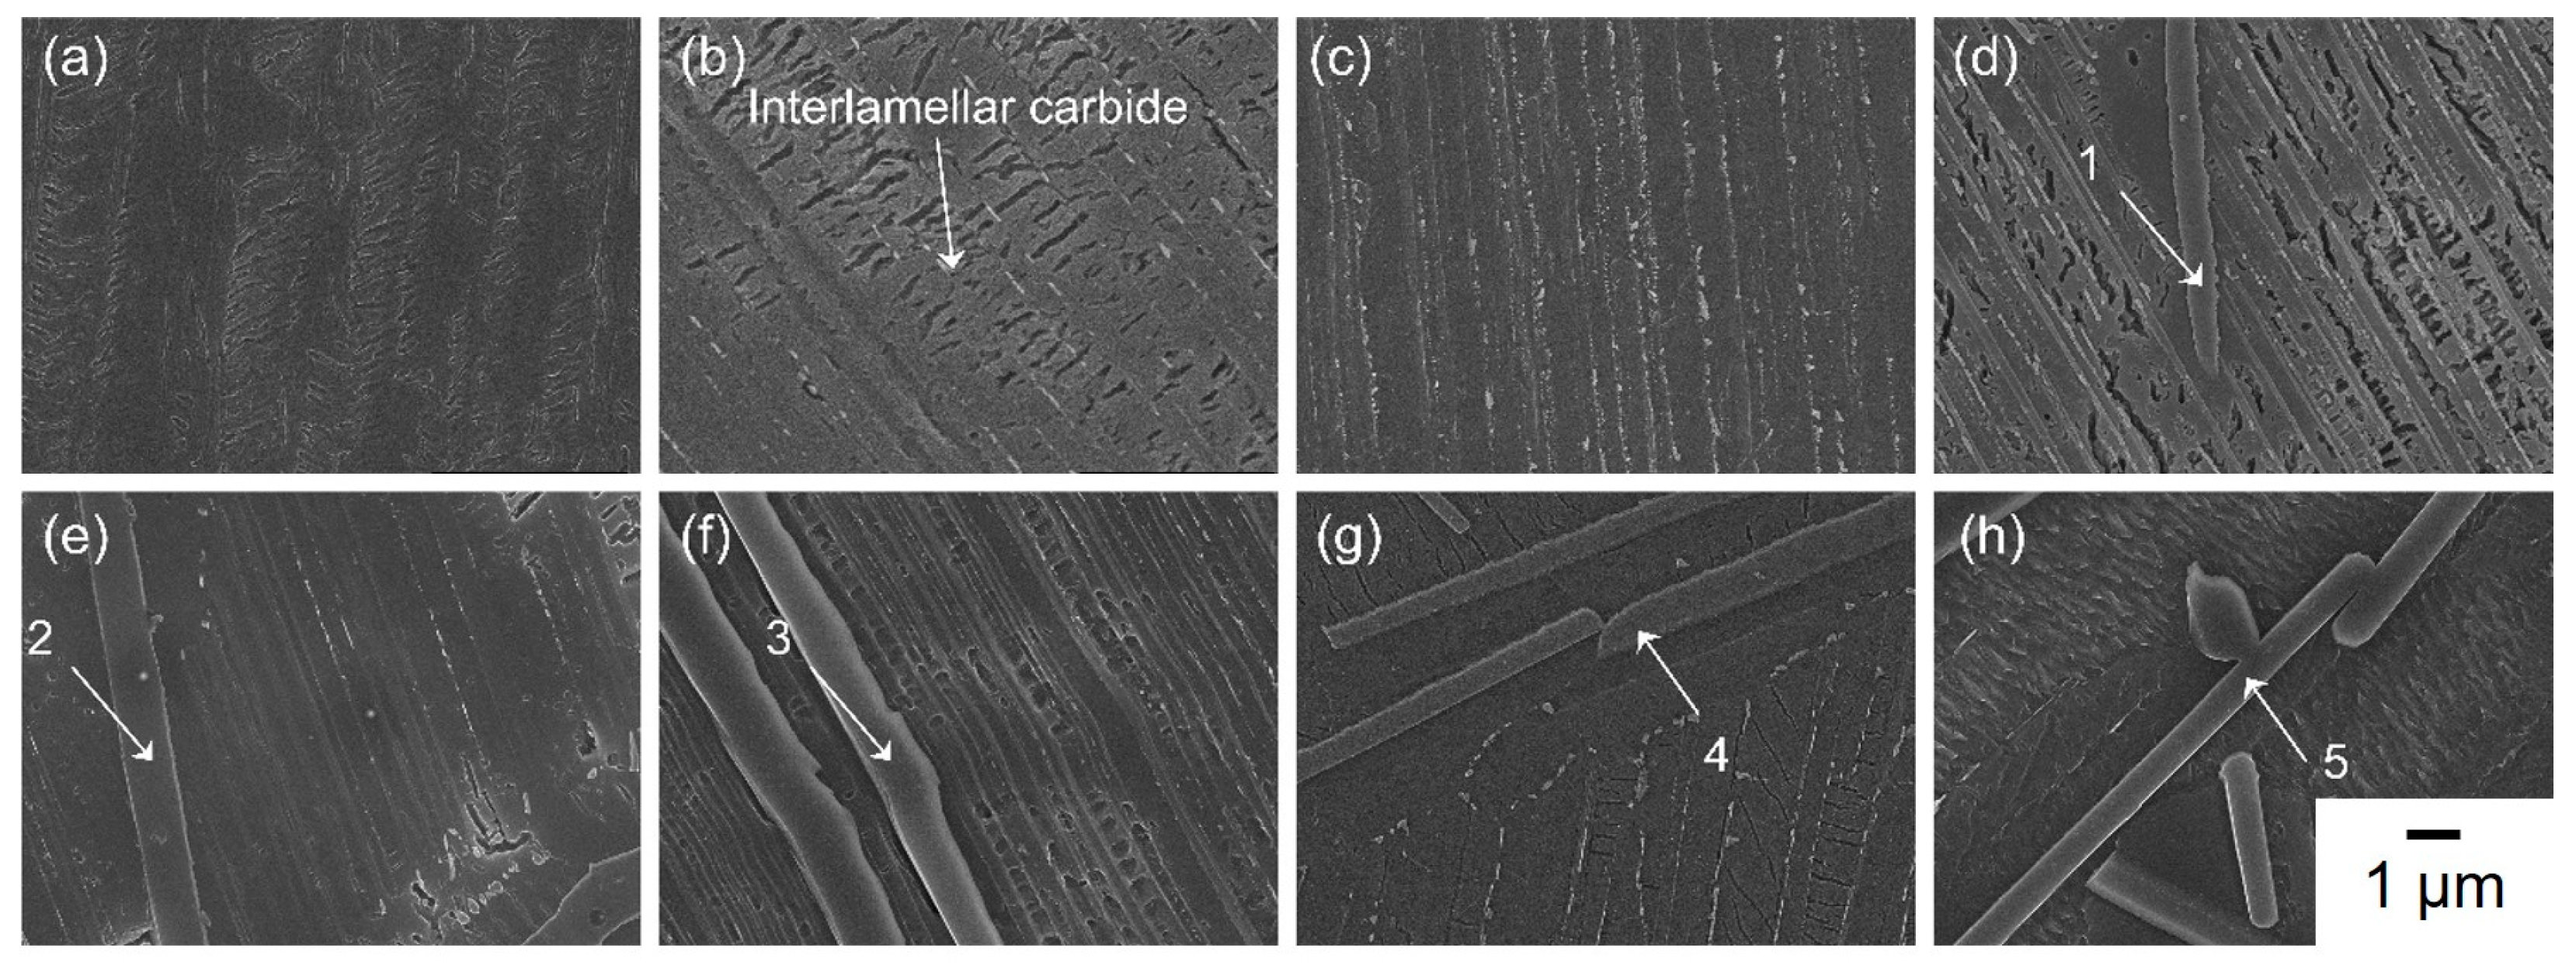
FE-SEM and EDS analyses of the TiAl castings confirmed the influence of carbon content on microstructural change. The corresponding results are presented in Figure 6 and Table 2. Fine carbides formed sparsely within the interlamellar region when the carbon content exceeded 0.36 at% during a holding time (Δt) of 40 s. Klimová et al. observed the decomposition of fine secondary carbide from the α2 phase at the interface of α2/γ lamellar in the as-cast state [30]. The formation of secondary carbide occurred owing to the difference in the carbon solubility of γ (0.025 at% C) and α2 (0.96 at% C) phases in the solid state [30,31]. According to the EDS analysis, the coarse carbide comprised titanium, aluminum, and carbon. As shown in Figure 6d–h, coarse intergranular carbides appeared together with fine interlamellar carbides when the carbon content exceeded 0.66 at% (holding time of 75 s). The fine interlamellar carbides exhibited sizes below approximately 1 μm, whereas the coarse intergranular carbides were about 1 μm in thickness and exceeded 10 μm in length. These quantitative differences indicate that carbon enrichment promotes carbide coarsening and a morphological transition from interlamellar to intergranular types.
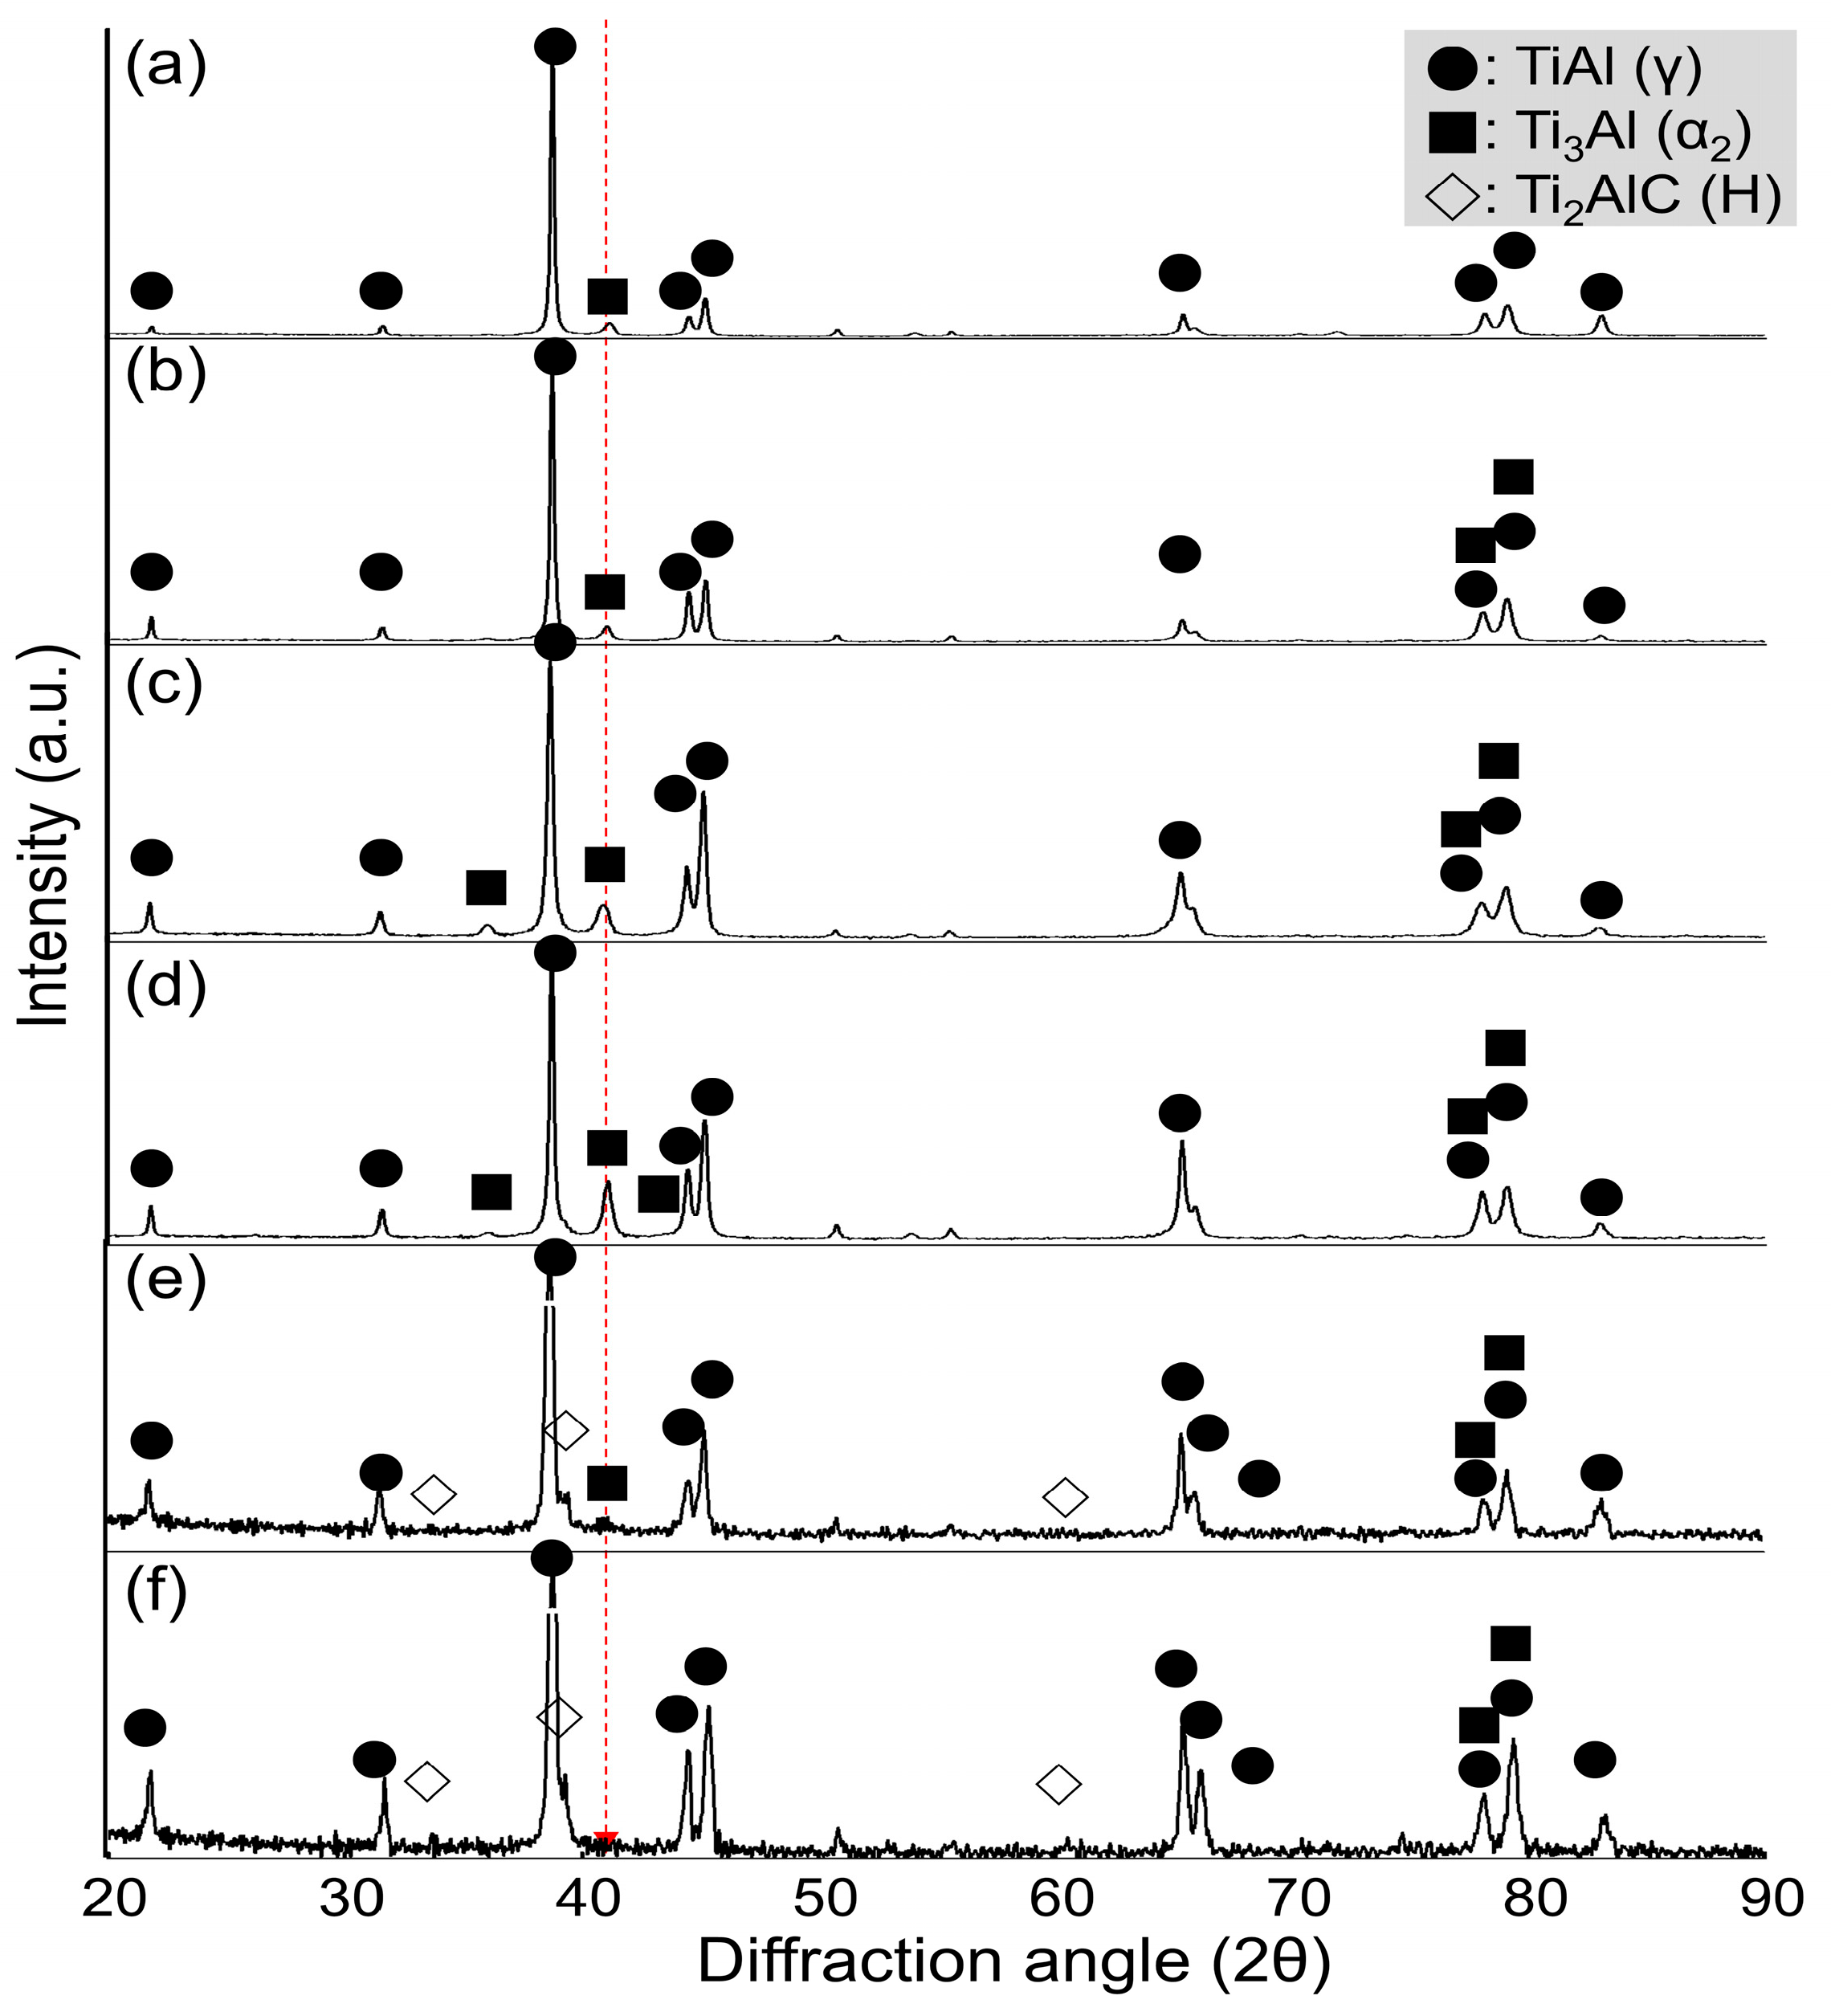
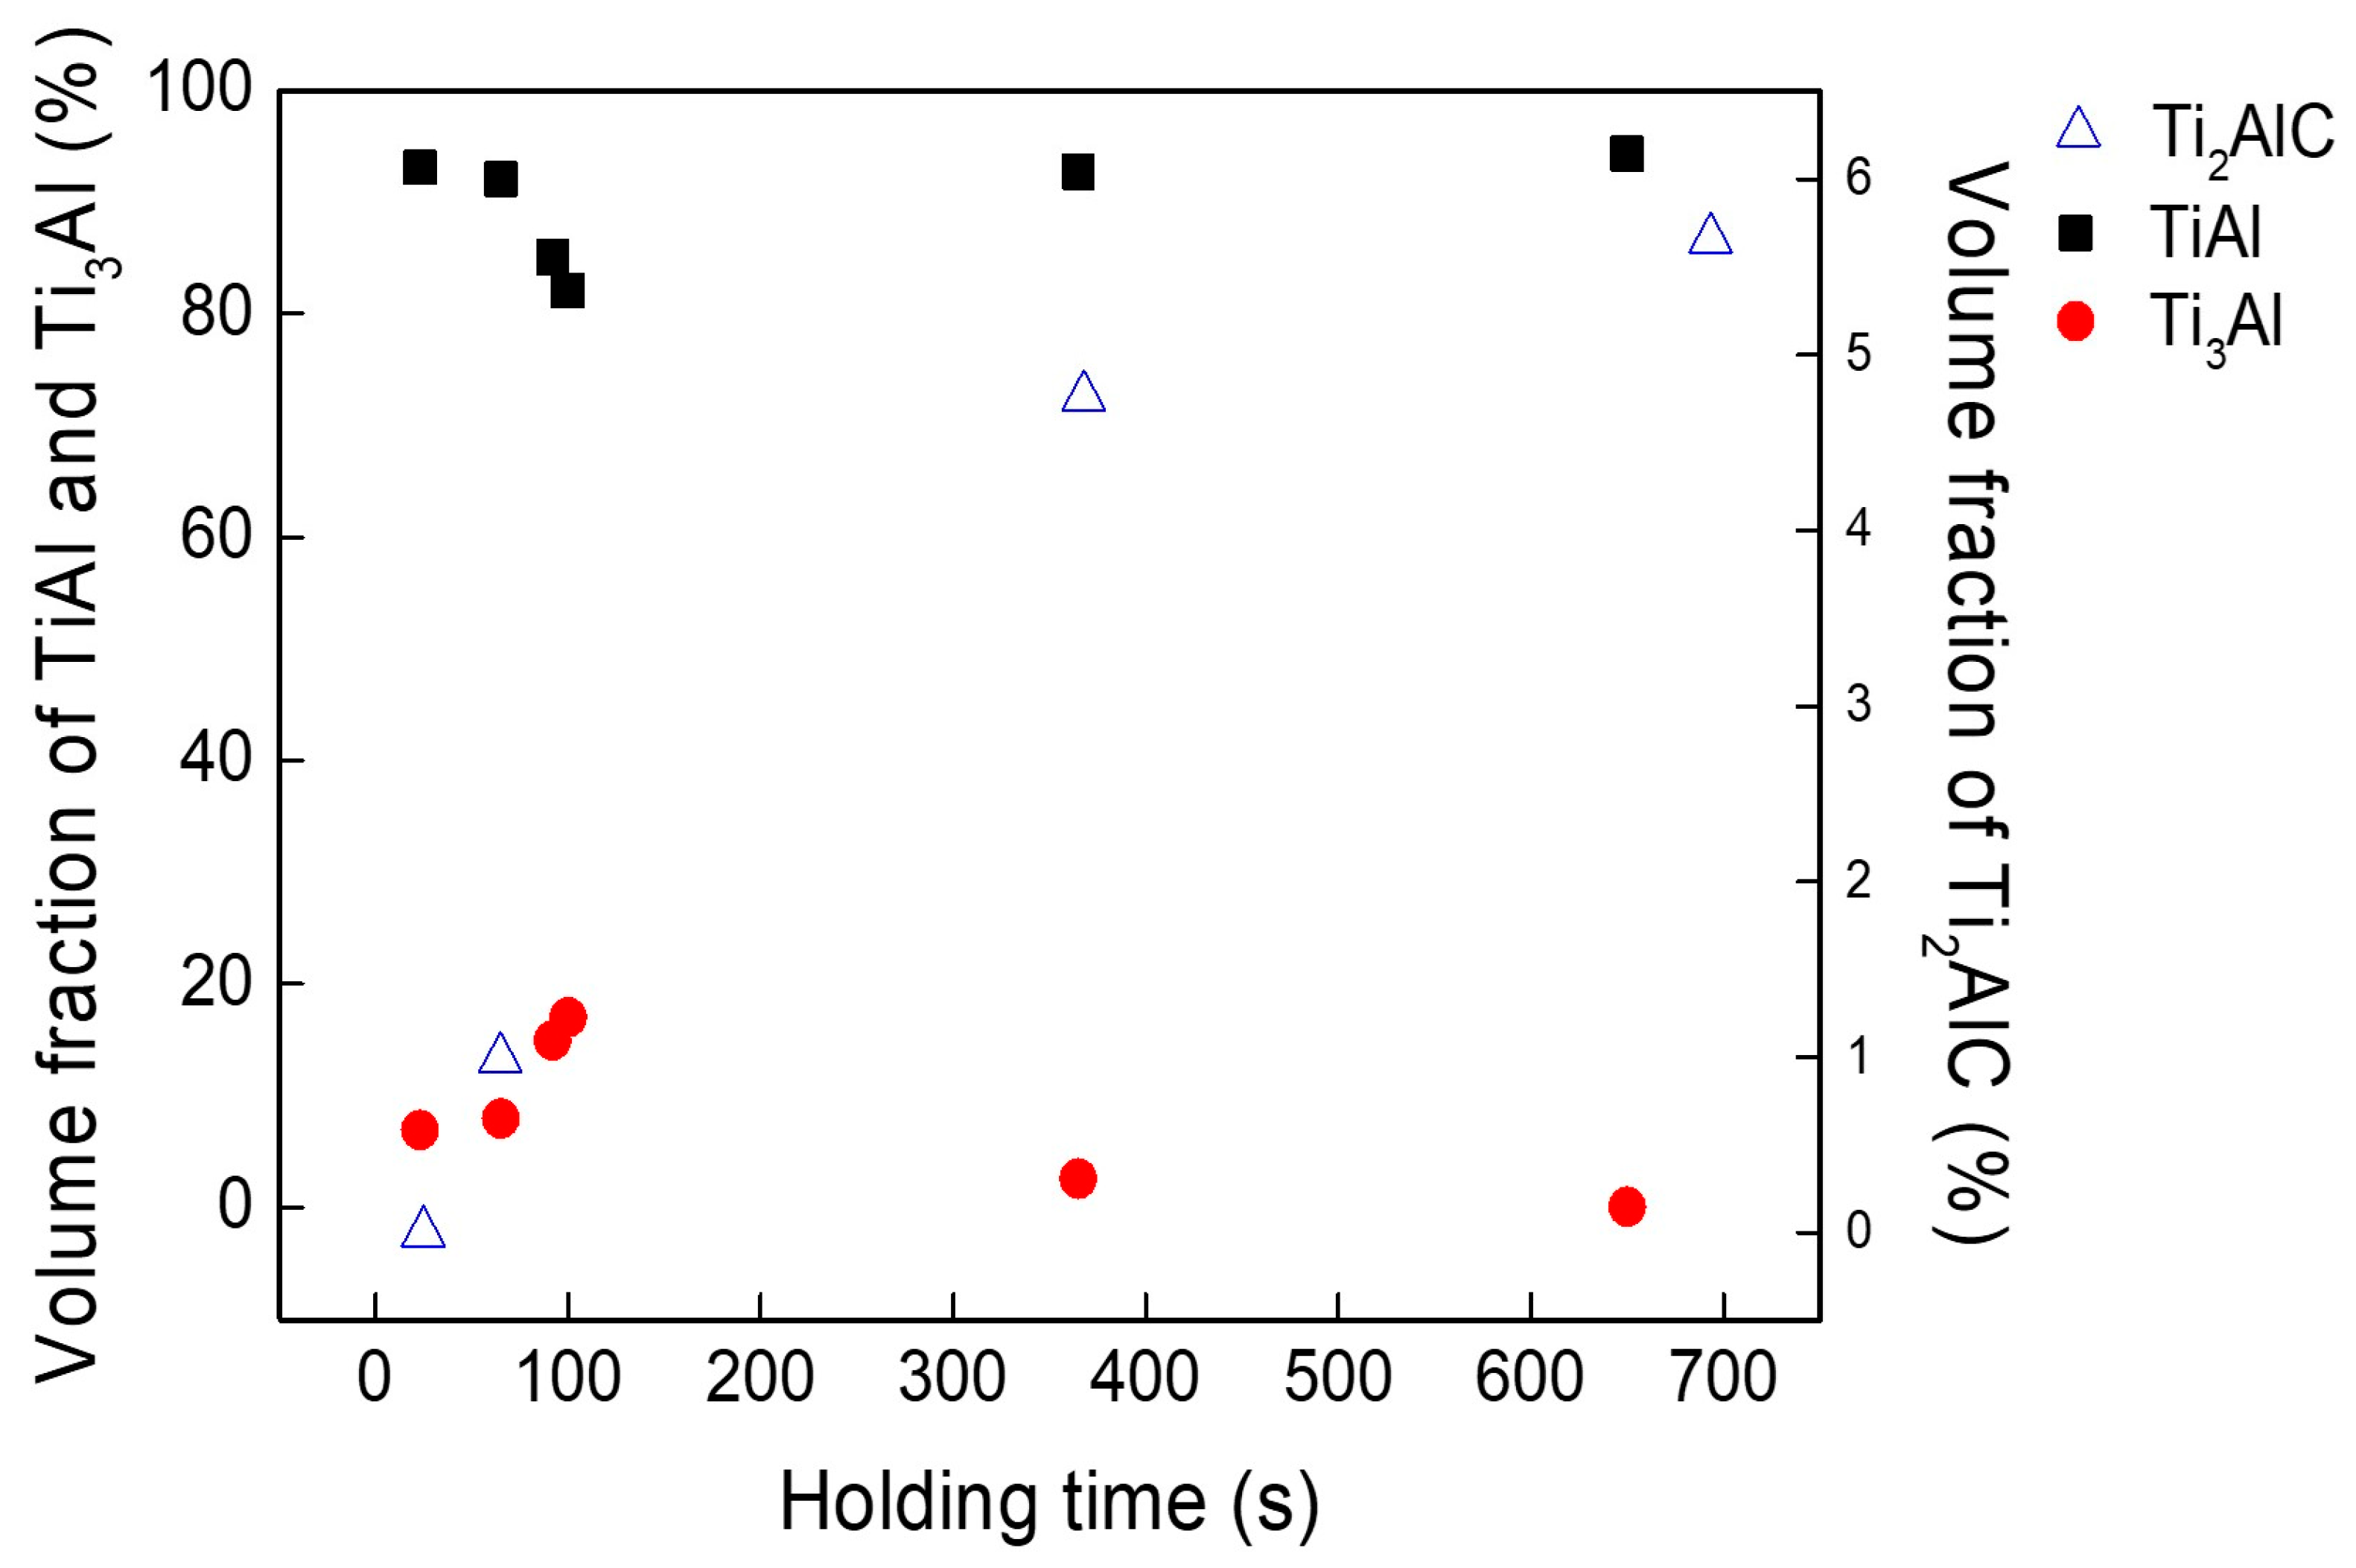
Figure 7 shows the X-ray spectra for TiAl castings as a function of carbon content. Due to analytical limitations, Ti2AlC was detected only when the carbon concentration exceeded 1.56 at% at a holding time of 365 s. Between 0.30 and 0.98 at% C, the Ti3Al peak intensity increased slightly, indicating that low carbon levels do not destabilize Ti3Al. However, when the carbon content exceeded 1.56 at%, the Ti3Al peak decreased as Ti2AlC formation progressed. Previous studies have established that the feasible carbide phases in TiAl alloys include TiC, Ti2AlC, and Ti3Al, with Ti2AlC being the most thermodynamically stable phase [23]. TiC serves as the primary solidification phase, whereas Ti2AlC and Ti3Al can be formed from TiC at transformation temperatures of 1962 K and 1903 K, respectively. However, metastable Ti3Al decomposes during solidification and does not persist in the final microstructure. The transformation of TiC into Ti2AlC is promoted by sufficiently low cooling rates during solidification, which provide adequate time for TiC to react with the melt and form Ti2AlC before the matrix fully solidifies. XRD analysis revealed characteristic diffraction peaks corresponding to Ti2AlC, while EDS spectroscopy confirmed the presence of titanium, aluminum, and carbon in stoichiometric ratios consistent with Ti2AlC. These results support the conclusion that both fine secondary and coarse primary carbides in the castings are Ti2AlC phases, with coarse primary Ti2AlC forming via the transformation of crystallized TiC in the molten state prior to complete solidification.
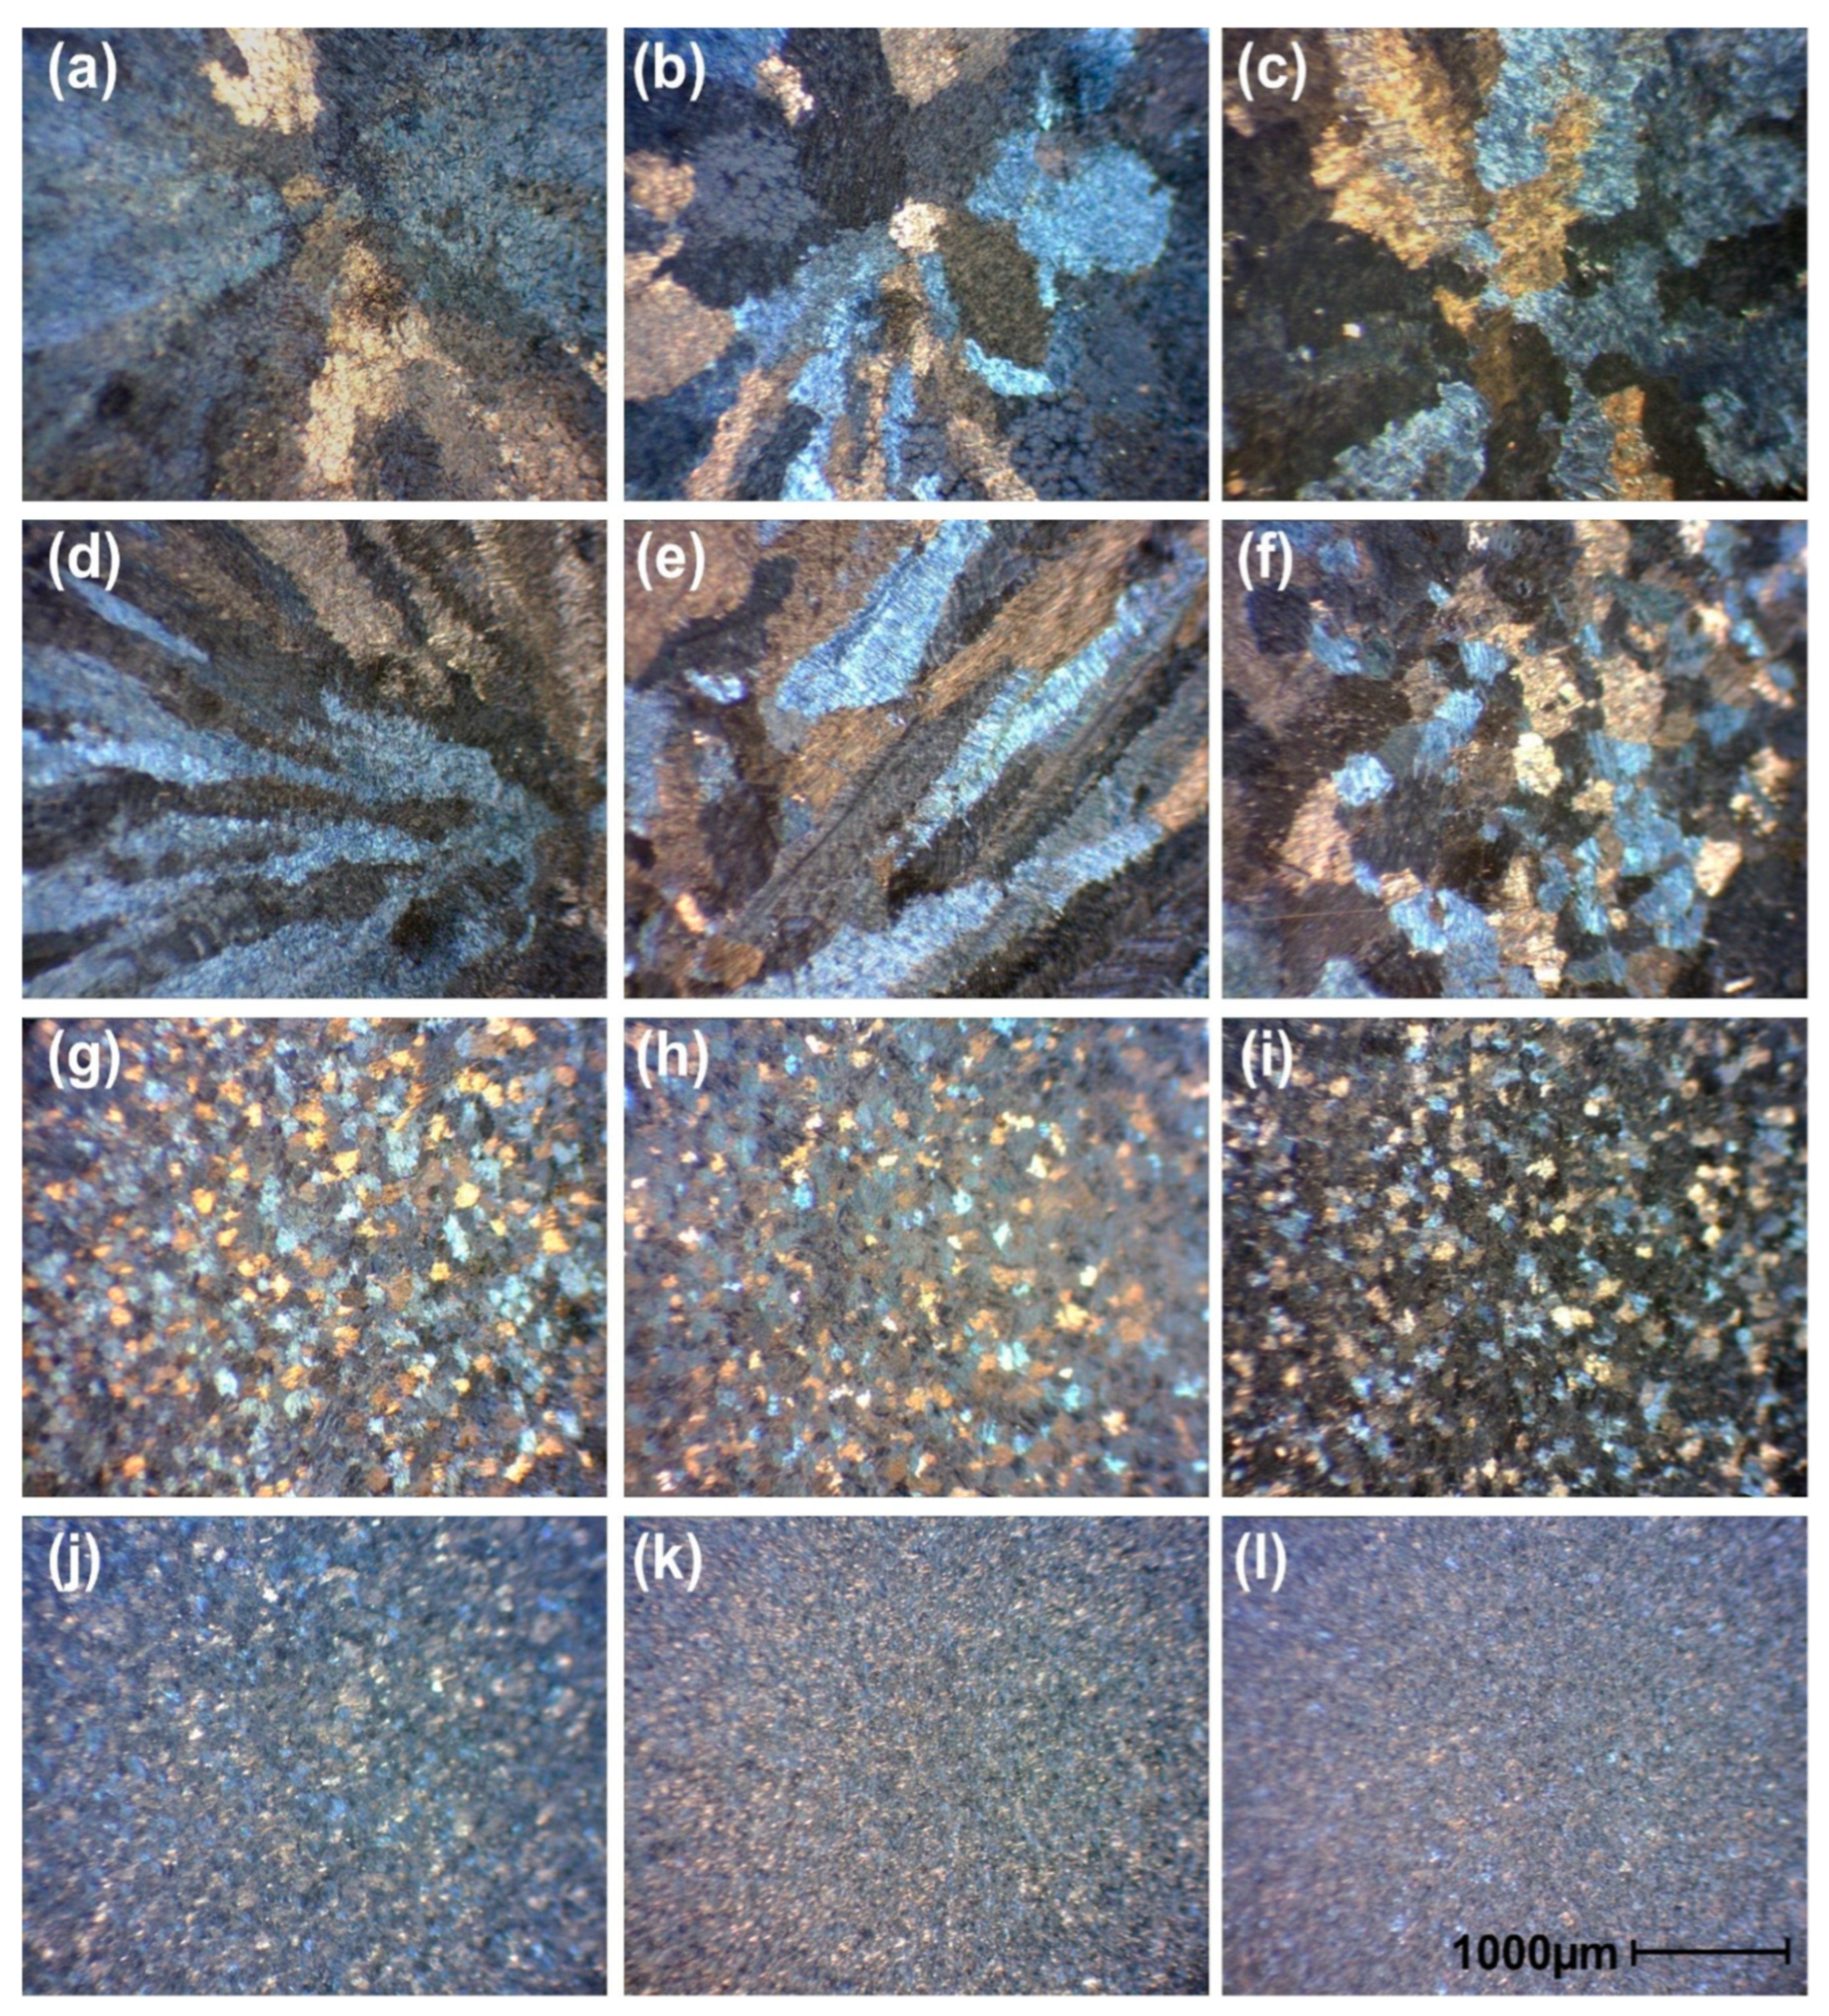
Figure 8 presents the grain sizes and morphological variations corresponding to different holding times. McCullough et al. [32] reported that Ti-46~49Al (at%) alloys were solidified by the peritectic reaction. The solidification and solid-state transformation can be expressed as follows [33]:
L → (β) +L → (β + α) + L → (β + α) + γ → (α) + γ → (α2) + γ → (α2 + γ) + γ
Columnar microstructures were observed when the carbon content was below 0.63 at% (holding time of 65 s) due to the peritectic solidification reaction that led to Al-rich segregations. However, at a carbon content of 0.66 at% (holding time of 75 s), the microstructure of the castings transitioned to an equiaxed structure. The grain size was quantitatively measured from the optical micrographs in Figure 8: the columnar grains Figure 8a–e exceeded approximately 2000 μm in length, while the equiaxed grains Figure 8f–l gradually refined with increasing carbon content, showing average grain sizes of 1115, 479, 343, 363, 207, 151, and 118 μm, respectively. These quantitative results clearly demonstrate that higher carbon content promotes grain refinement in TiAl castings. Therefore, the holding time (Δt) should be limited to within 65 s at a superheating (ΔT) of 200 K, during which the intrinsic columnar microstructure of the Ti4822 alloy is maintained.
During the transition from a columnar to an equiaxed structure, a sufficient number of nuclei is required in undercooled TiAl melts. Primary TiC and coarse Ti2AlC particles, which are crystallized through peritectic reaction from the liquid phase and TiC carbide present in the molten state, supply an adequate number of nuclei that promote equiaxed microstructure formation and serve as heterogeneous nucleation sites for β phase development. Consequently, primary TiC or coarse Ti2AlC plays a critical role in grain refinement and the formation of equiaxed structures by providing effective heterogeneous nucleation sites.
The FE-SEM image was analyzed using an image analysis software (Image Pro-plus 6.0, Media Cybernetics, Rockville, MD, USA) to examine the change in the phase volume fraction. Figure 9 shows the changes in the phase volume fraction with holding time. The volume fraction of Ti2AlC increased steadily. However, the α2 (Ti3Al) phase increased to 20% at 0.98 at% carbon (holding time of 100 s) and then decreased. As carbon is a strong α-phase stabilizer, the eutectic temperature increases, and therefore, the α region is extended. Consequently, the volume fraction of the α2 phase increases with the carbon content. After holding for 100 s, although the carbide content increased continuously, the volume fraction of the α2 phase declined sharply. The phase area was shifted to a single γ area because the large amount of carbide in residual melts affected the increase in the aluminum content of the castings.

4. Conclusions

This study aimed to evaluate carbon contamination during the melting of γ-TiAl alloy in a graphite crucible by varying superheating and holding times and to analyze how changes in melt holding time affect the alloy’s microstructure and composition.
  • At superheating of 130 K and 170 K, casting defects were observed at the disk and blade tip. However, the misrun and cold shut were resolved at temperatures above ΔT of 200 K. Considering contamination by impurities, it was found that superheating of 200 K is appropriate for casting a sound γ-TiAl turbocharger component.
  • As the TiC and Ti2AlC phases, which are richer in titanium, adhered to the crucible walls during casting, less titanium remained in the melt. Consequently, the proportion of aluminum in the melts increased, leading to higher aluminum concentration in the castings.
  • The outer layers of solid TiC and Ti2AlC, which enclosed the molten volume during the melting process, limited the increase in carbon contamination by creating a stable barrier that prevented carbon diffusion from the crucible into the melt. This reduced the rate of carbon contamination.
  • As holding time increased, fine secondary carbides formed first due to differences in carbon solubility between the γ and α2 phases—specifically, the γ phase could dissolve more carbon than the α2 phase. As a result, carbon began to precipitate as fine secondary carbides, followed by the crystallization of primary carbides as the process continued. Both the fine secondary and coarse primary carbides were identified as Ti2AlC phases, ensuring precise phase identification. This sequence led to a transformation of the columnar structure into an equiaxed one through TiC crystallization. Additionally, increased carbon contamination promoted more heterogeneous carbide nuclei in the molten state, resulting in refined grain size.
  • The volume fraction of the α2 phase increased as carbon acted as an α-phase stabilizer, reaching a maximum at a holding time of 100 s. As the holding time increased beyond 100 s, the volume fraction of the α2 phase decreased sharply. Simultaneously, the γ phase region expanded due to the removal of Ti2AlC and TiC from the melt, as these carbides adhered to the crucible wall.
  • The carbon content was within 0.5 at% in the castings for a melt holding time of up to 50 s at a degree of superheating of 200 K. When the holding time was less than 20 s, carbon was present only as a solid solution in the castings.

Author Contributions

Conceptualization, S.L. and Y.K.; methodology, B.K.; validation, T.H.; formal analysis, T.H.; investigation, S.L.; resources, Y.K.; data curation, B.K.; writing—original draft preparation, B.K.; writing—review and editing, S.L. and Y.K.; visualization, T.H.; supervision, Y.K. All authors have read and agreed to the published version of the manuscript.

Funding

This research received no external funding.

Data Availability Statement

The original contributions presented in the study are included in the article. Further inquiries can be directed to the corresponding author.

Conflicts of Interest

The authors declare no conflicts of interest.

References

  1. Perrut, M.; Caron, P.; Thomas, M.; Couret, A. High temperature materials for aerospace applications: Ni-based superalloys and γ-TiAl alloys. C. R. Phys. 2018, 19, 657–671. [Google Scholar] [CrossRef]
  2. Yuan, C.; Cheng, X.; Holt, G.S.; Shevchenko, D.; Withey, P.A. Investment casting of Ti–46Al–8Nb–1B alloy using molds with CaO-stabilized zirconia face coat at various mold pre-heat temperatures. Ceram. Int. 2015, 41, 4129–4139. [Google Scholar] [CrossRef]
  3. Čegan, T.; Szurman, I.; Kursa, M.; Holešinský, J.; Vontorová, J. Preparation of TiAl-based alloys by induction melting in graphite crucibles. Kov. Mater. 2015, 53, 69–78. [Google Scholar] [CrossRef]
  4. Cheng, X.; Yuan, C.; Blackburn, S.; Withey, P.A. The influence of binder systems in Y2O3–ZrO2 face coat material on investment casting slurries and shell properties. J. Eur. Ceram. Soc. 2014, 34, 3061–3068. [Google Scholar] [CrossRef]
  5. Malakizadi, A.; Mallipeddi, D.; Dadbakhsh, S.; M’Saoubi, R.; Krajnik, P. Post-processing of additively manufactured metallic alloys—A review. Int. J. Mach. Tools Manuf. 2022, 179, 103908. [Google Scholar] [CrossRef]
  6. Larsen, D.E. Status of investment cast gamma titanium aluminides in the USA. Mater. Sci. Eng. A 1996, 213, 128–133. [Google Scholar] [CrossRef]
  7. Kuang, J.P.; Harding, R.A.; Campbell, J. Examination of defects in gamma titanium aluminide investment castings. Int. J. Cast Met. Res. 2000, 13, 125–134. [Google Scholar] [CrossRef]
  8. Dlouhý, A.; Zemčík, L.; Válek, R. Near-gamma TiAl investment casting and its optimization. In Gamma Titanium Aluminides 2003; Kim, Y.W., Clemens, H., Rosenberger, A.H., Eds.; TMS: Warrendale, PA, USA, 2003; pp. 291–296. [Google Scholar]
  9. Fashu, S.; Lototskyy, M.; Davids, M.W.; Pickering, L.; Linkov, V.; Tai, S.; Tarasov, B.P. A review on crucibles for induction melting of titanium alloys. Mater. Des. 2020, 186, 108295. [Google Scholar] [CrossRef]
  10. Tetsui, T.; Kobayashi, T.; Mori, T.; Kishimoto, T.; Harada, H. Evaluation of yttria applicability as a crucible for induction melting of TiAl alloy. Mater. Trans. 2010, 51, 1656–1662. [Google Scholar] [CrossRef]
  11. Gomes, F.; Puga, H.; Barbosa, J.; Ribeiro, C.S. Effect of melting pressure and superheating on chemical composition and contamination of yttria-coated crucible induction melted titanium alloys. J. Mater. Sci. 2011, 46, 4922–4936. [Google Scholar] [CrossRef]
  12. Jovanović, M.T.; Bobić, I.; Mišković, Z.; Zec, S. Precision Cast Ti-based alloys—Microstructure and mechanical properties. J. Met. 2009, 15, 53–69. [Google Scholar]
  13. Dlouhý, A.; Dočekalová, K.; Zemčík, L. Vacuum induction melting and investment casting technologies tailored to near-gamma TiAl alloys. Mater. Sci. Forum 2007, 539, 1463–1468. [Google Scholar] [CrossRef]
  14. Fan, J.; Liu, J.; Wu, S.; Tian, S.; Gao, H.; Wang, S.; Wang, X. Microstructure formation and interface characteristics of directionally solidified TiAl–Si alloys in alumina crucibles with Y2O3 skull-aided technology. Sci. Rep. 2017, 7, 45198. [Google Scholar] [CrossRef] [PubMed]
  15. Zhang, H.; Tang, X.; Zhou, C.; Zhang, H.; Zhang, S. Comparison of directional solidification of γ-TiAl alloys in conventional Al2O3 and novel Y2O3-coated Al2O3 crucibles. J. Eur. Ceram. Soc. 2013, 33, 925–934. [Google Scholar] [CrossRef]
  16. Liu, J.; Zhang, F.; Nan, H.; Feng, X.; Ding, X. Effect of carbon addition on as-cast microstructures of high Nb containing TiAl alloys. Metals 2019, 9, 1201. [Google Scholar] [CrossRef]
  17. Lapin, J.; Štamborská, M.; Kamyshnykova, K.; Pelachová, T.; Klimová, A.; Bajana, O. Room temperature mechanical behaviour of cast In-Situ TiAl matrix composite reinforced with carbide particles. Intermetallics 2019, 105, 113–123. [Google Scholar] [CrossRef]
  18. Lapin, J.; Štamborská, M.; Pelachová, T.; Bajana, O. Fracture behaviour of cast In-Situ TiAl matrix composite reinforced with carbide particles. Mater. Sci. Eng. A 2018, 721, 1–7. [Google Scholar] [CrossRef]
  19. Rösler, J.; Evans, A.G. The effect of reinforcement size on the creep strength of intermetallic matrix composites. In High Temperature Aluminides and Intermetallics; Elsevier: Amsterdam, The Netherlands, 1992; pp. 438–443. [Google Scholar] [CrossRef]
  20. Li, M.; Xiao, S.; Xiao, L.; Xu, L.; Tian, J.; Chen, Y. Effects of carbon and boron addition on microstructure and mechanical properties of TiAl alloys. J. Alloys Compd. 2017, 728, 206–221. [Google Scholar] [CrossRef]
  21. Szkliniarz, W.; Szkliniarz, A. Microstructure and properties of TiAl-based alloys melted in graphite crucible. Metals 2021, 11, 669. [Google Scholar] [CrossRef]
  22. Barbosa, J.J.; Ribeiro, C.S. Influence of crucible material on the level of contamination in TiAl using induction melting. Int. J. Cast Met. Res. 2000, 12, 293–301. [Google Scholar] [CrossRef]
  23. Barbosa, J.; Ribeiro, C.A.S.; Monteiro, C. The production of TiAl by foundry processes. In Key Engineering Materials; Trans Tech Publications Ltd.: Zurich, Switzerland, 2002; Volume 230–232, pp. 106–109. [Google Scholar] [CrossRef]
  24. Lee, S.; Shin, M.S.; Kim, Y.J. Development of non-reactive mold for investment casting of Ti-48Al-2Cr-2Nb alloys. Metall. Mater. Trans. B 2020, 51, 861–869. [Google Scholar] [CrossRef]
  25. Zhang, Z.; Frenzel, J.; Neuking, K.; Eggeler, G. On the reaction between NiTi melts and crucible graphite during vacuum induction melting of NiTi shape memory alloys. Acta Mater. 2005, 53, 3971–3985. [Google Scholar] [CrossRef]
  26. Witusiewicz, V.T.; Hallstedt, B.; Bondar, A.A.; Hecht, U.; Sleptsov, S.V.; Velikanova, T.Y. Thermodynamic description of the Al–C–Ti system. J. Alloys Compd. 2015, 623, 480–496. [Google Scholar] [CrossRef]
  27. Schwaighofer, E.; Rashkova, B.; Clemens, H.; Stark, A.; Mayer, S. Effect of carbon addition on solidification behavior, phase evolution and creep properties of an intermetallic β-stabilized γ-TiAl-based alloy. Intermetallics 2014, 46, 173–184. [Google Scholar] [CrossRef]
  28. Bolotin, K.; Brazhnik, D. Bottom Induction Stirrer for Induction Crucible Furnace with Graphite Crucible. In Proceedings of the International Russian Automation Conference (RusAutoCon 2019), Sochi, Russia, 8–14 September 2019; Radionov, A.A., Karandaev, A.S., Eds.; Lecture Notes in Electrical Engineering; Springer: Cham, Switzerland, 2020; Volume 641, pp. 1158–1166. [Google Scholar] [CrossRef]
  29. Wu, L.; Ek, M.; Song, M.; Du, S. The Effect of Solid Particles on Liquid Viscosity. Steel Res. Int. 2011, 82, 388–397. [Google Scholar] [CrossRef]
  30. Klimová, A.; Lapin, J. Effect of Al content on microstructure of Ti-Al-Nb-C-Mo composites reinforced with carbide particles. Kov. Mater. 2019, 57, 377–387. [Google Scholar] [CrossRef]
  31. Menand, A.; Huguet, A.; Nérac-Partaix, A. Interstitial solubility in γ and α2 phases of TiAl-based alloys. Acta Mater. 1996, 44, 4729–4737. [Google Scholar] [CrossRef]
  32. McCullough, C.; Valencia, J.J.; Levi, C.G.; Mehrabian, R. Phase equilibria and solidification in Ti–Al alloys. Acta Metall. 1989, 37, 1321–1336. [Google Scholar] [CrossRef]
  33. Perdrix, F.; Trichet, M.F.; Bonnentien, J.L.; Cornet, M.; Bigot, J. Relationships between interstitial content, microstructure and mechanical properties in fully lamellar Ti–48Al alloys, with special reference to carbon. Intermetallics 2001, 9, 807–815. [Google Scholar] [CrossRef]
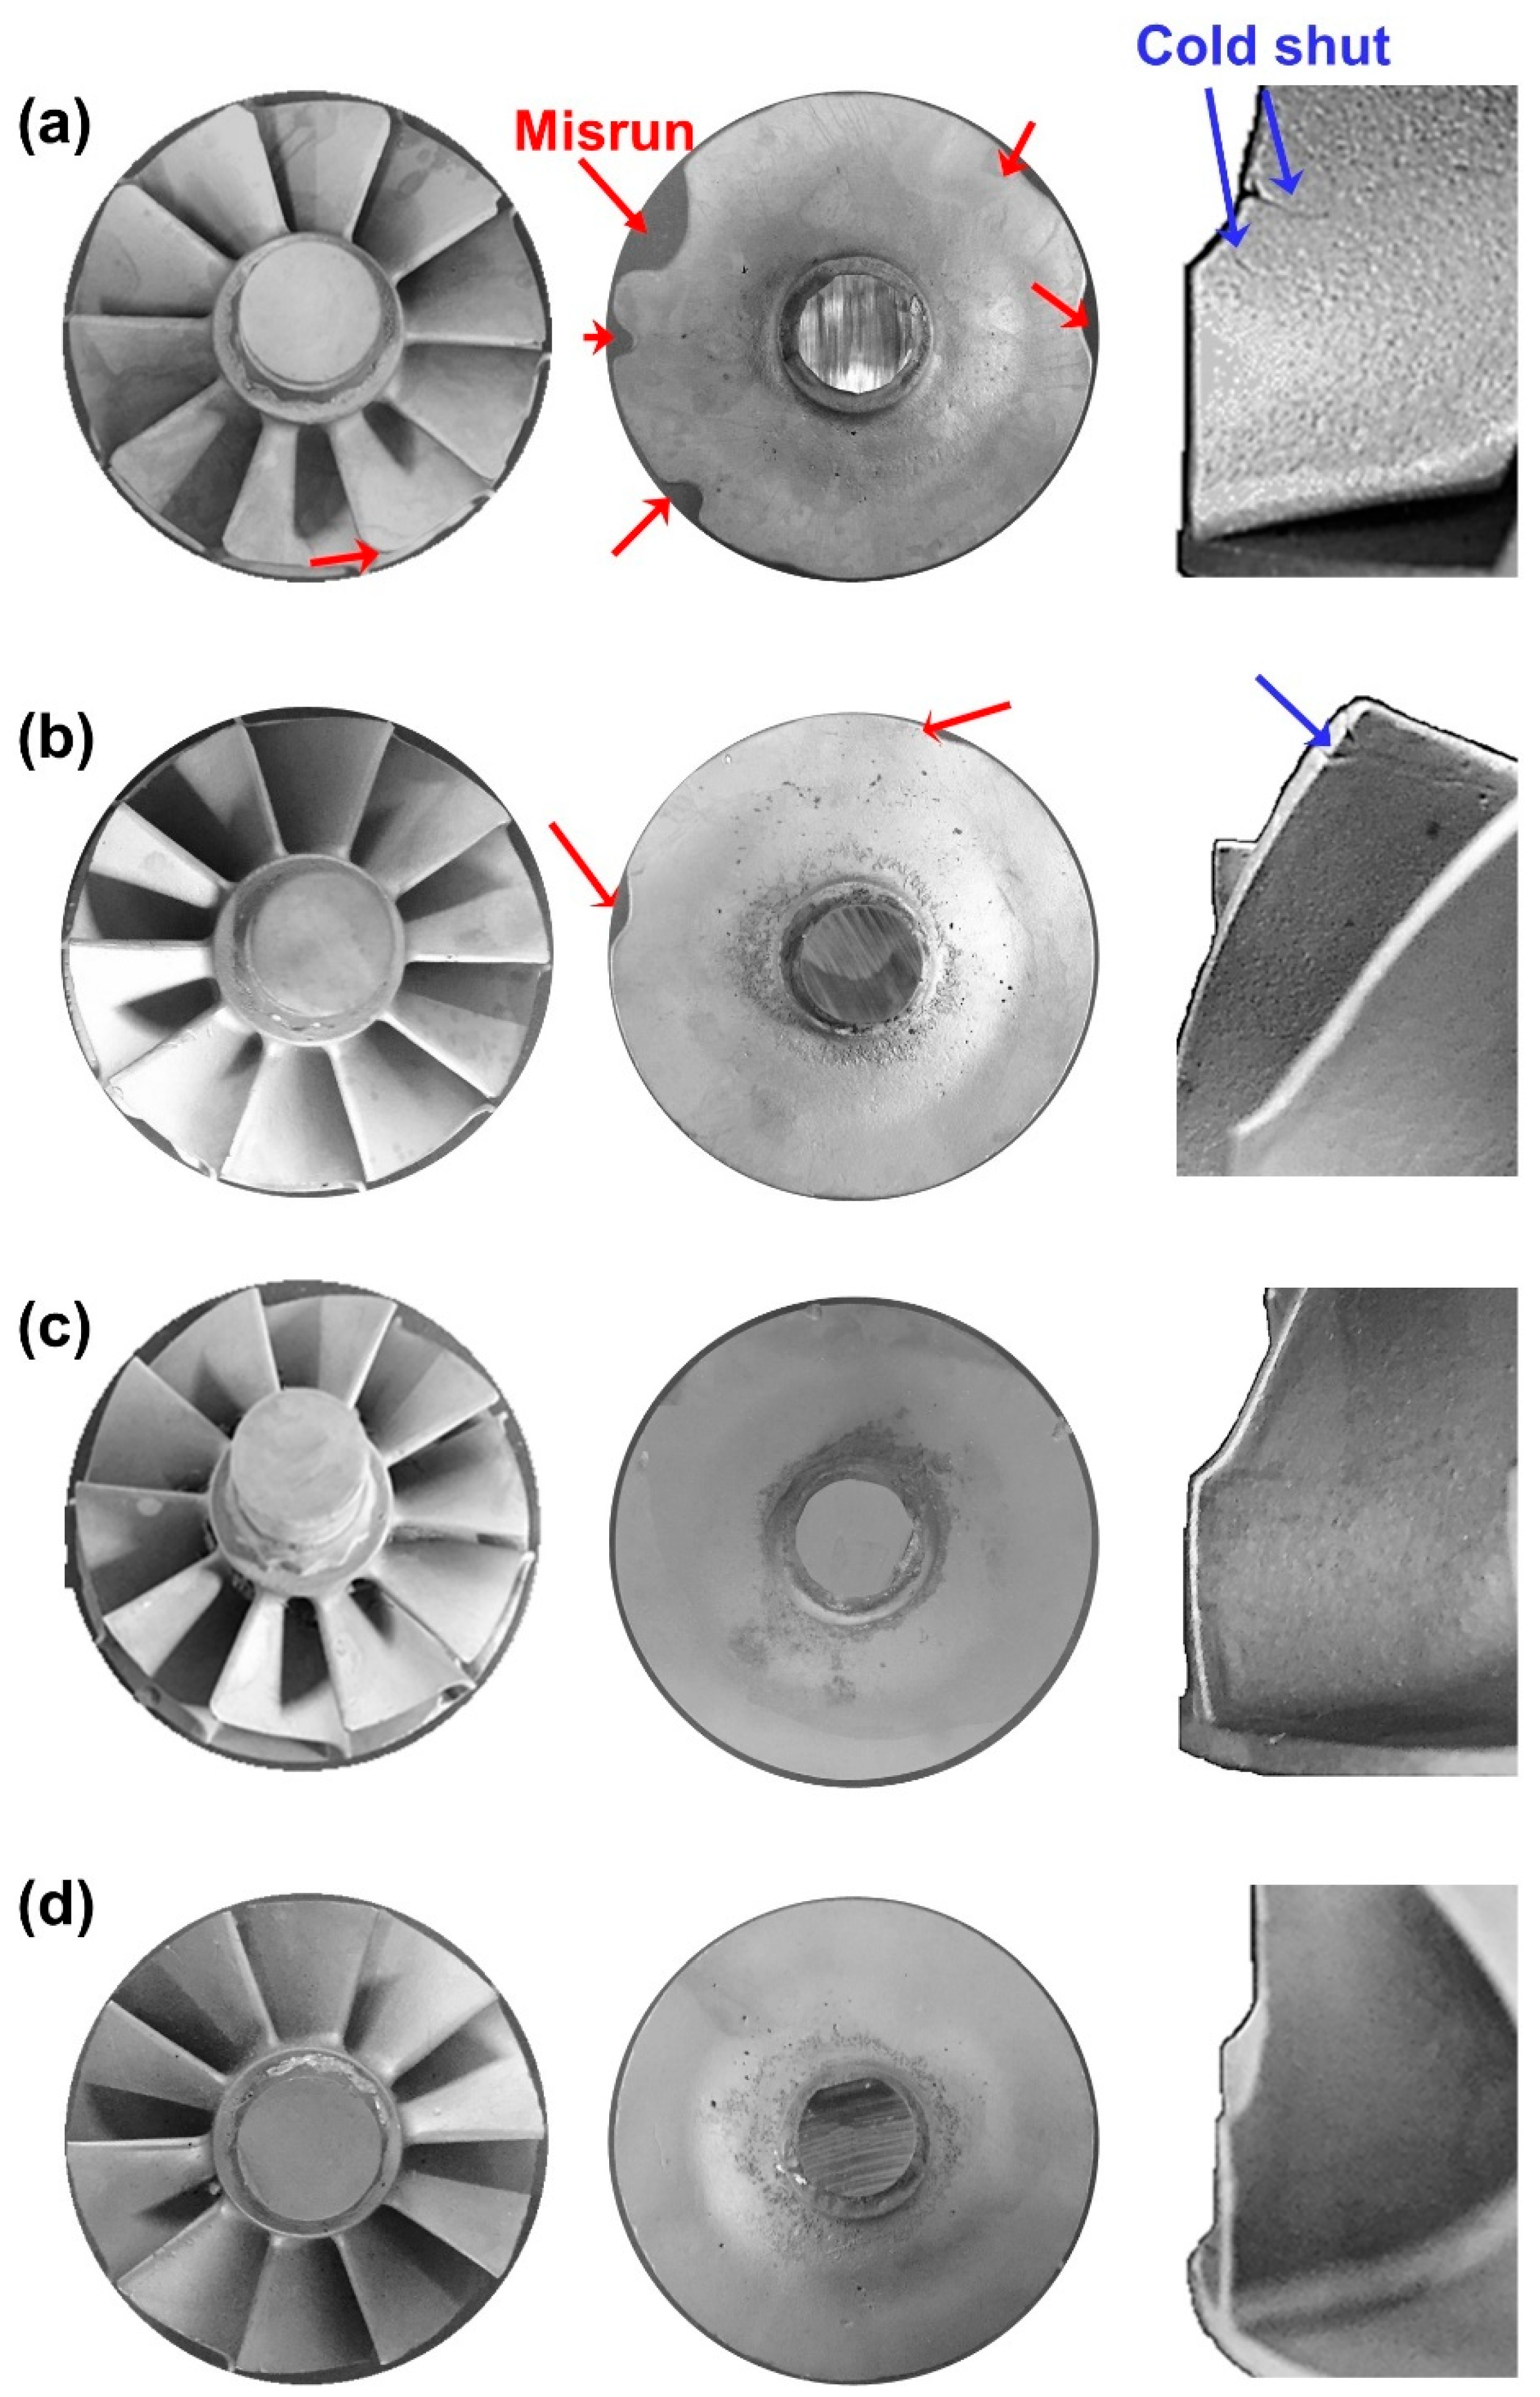
Figure 1. Surface features of γ-TiAl turbocharger castings obtained by investment casting poured at superheating of (a) 130 K, (b) 170 K, (c) 200 K, and (d) 230 K. Red arrows indicate misrun defects, and blue arrows indicate cold-shut defects.
Crystals 15 01006 g001
Figure 2. Results of the chemical analysis showing the increase in carbon content in TiAl castings melted at 1983 K (ΔT = 200 K) over varying reaction times.
Crystals 15 01006 g002
Figure 3. Results of the change in the chemical composition in TiAl castings as a function of holding time (the error of the chemical analysis is smaller than the size of the symbols).
Crystals 15 01006 g003
Figure 4. Cross-section of graphite crucible (ac) and interface morphology between crucible and residual melts (df) after casting (a,d) 0.98 at% C, (b,e) 1.56 at% C, and (c,f) 2.11 at% C; (g) XRD pattern for the residual melts at 2.11 at% C. Blue square boxes in (ac) indicate the areas magnified in (df). Red dashed lines in (df) represent the original crucible surface before the reaction.
Crystals 15 01006 g004
Figure 5. Cross-section of the metal/crucible interface: low-magnification image (a) at 0.46 at% C, (b) at 1.56 at% C, (c) at 2.11 at% C, and high-magnification image (d) at 0.46 at% C, (e) at 1.56 at% C, (f) at 2.11 at% C. Letters A–F indicate the EDS analysis positions corresponding to the data in Table 1.
Crystals 15 01006 g005
Figure 6. Microstructure of carbide particles with different carbon contents: (a) 0.30 at% C, (b) 0.36 at% C, (c) 0.63 at% C, (d) 0.66 at% C, (e) 0.77 at% C, (f) 0.98 at% C, (g) 1.56 at% C, and (h) 2.11 at% C. Numbers 1–5 indicate the EDS analysis locations corresponding to Table 2, and arrows point to the specific regions analyzed.
Crystals 15 01006 g006
Figure 7. Results of X-ray spectra analyses for castings with different carbon contents: (a) 0.30 at% C, (b) 0.63 at% C, (c) 0.89 at% C, (d) 0.98 at% C, (e) 1.56 at% C, and (f) 2.11 at% C. The red dashed line indicates the variation of the Ti3Al peak intensity, which increases and then decreases with increasing carbon content.
Crystals 15 01006 g007
Figure 8. Microstructural evolution of γ-TiAl castings with different carbon contents: (a) 0.21 at% C, (b) 0.30 at% C, (c) 0.36 at% C, (d) 0.46 at% C, (e) 0.63 at% C, (f) 0.66 at% C, (g) 0.80 at% C, (h) 0.89 at% C, (i) 0.98 at% C, (j) 1.43 at% C, (k) 1.56 at% C, and (l) 2.11 at% C.
Crystals 15 01006 g008
Figure 9. Results of image analysis showing variation in volume fraction of Ti2AlC, TiAl and Ti3Al phases with holding time at ΔT = 200 K.
Crystals 15 01006 g009
Table 1. EDS analysis results of the phases indicated by arrows A through F in Figure 5 (at%).
RegionABCDEF
C K50.718.743.424.251.917.7
Al K0.432.70.425.82.314.9
Ti K42.442.655.450.045.856.6
Cr K1.61.7
Nb L4.94.30.8 10.8
Totals100100100100100100
Table 2. EDS analysis results of the carbides indicated by arrows 1 through 5 in Figure 6 (at%).
Region12345
C K22.630.729.926.231.7
Al K27.825.924.224.027.1
Ti K49.141.444.049.839.2
Cr K0.50.11.9 0.3
Nb L 0.1 1.7
Totals100100100100100
Disclaimer/Publisher’s Note: The statements, opinions and data contained in all publications are solely those of the individual author(s) and contributor(s) and not of MDPI and/or the editor(s). MDPI and/or the editor(s) disclaim responsibility for any injury to people or property resulting from any ideas, methods, instructions or products referred to in the content.