Abstract
Non-oriented (NO) Fe–Si electrical steels are key materials for magnetic cores of electrical machines, requiring a balance between magnetic and mechanical properties. This study systematically examined the effect of silicon content (1.06 wt%, 2.15 wt%, and 3.09 wt%) on the microstructure, mechanical, and tribological behavior of three produced NO steel grades. Mechanical properties were assessed using tensile tests, microhardness, and nanoindentation, while tribological performance was evaluated under dry reciprocating sliding (ball-on-flat) against a 100Cr6 steel ball at loads of 5 N, 10 N, and 25 N. Increasing silicon content led to larger grain size, higher hardness (227 HV–361 HV) and strength, but lower ductility. Tribological behavior depended on both composition and load. The most stable friction regime occurred at 10 N. The medium-Si steel (N3, 2.15 wt%) exhibited the best performance with a low coefficient of friction (COF ≈ 0.52–0.55); N5 (3.09 wt%) showed a similar COF, while N1 (1.06 wt%) had a slightly higher value. At 25 N, an inverse relationship between hardness and friction appeared: softer N1 had the lowest COF (≈0.68–0.70), whereas harder N3 and N5 reached ≈ 0.74–0.78. Scanning electron microscopy (SEM) observations revealed abrasive wear for N3/N5 and plastic flow (galling) for N1. Overall, an optimal silicon content provides the best compromise between hardness and tribological stability depending on load conditions.
1. Introduction
FeSi steels, also known as electrical steels (electrotechnical steels), belonging to the group of soft magnetic materials, are the dominant material used in the construction of generators, electrical energy transformers, as well as in the production of electrical and power electronic components for guiding and amplifying magnetic flux to enable the most efficient energy conversion possible [1]. Due to their high efficiency, non-oriented (NO) electrical steels are becoming increasingly popular in various applications for electric motors and drives [2].
NO electrical steels have been used in the magnetic cores of electrical machines for several decades. For electric motor applications, efficiency and torque are among the most important properties, with total core losses being directly related to motor efficiency. Lower core losses lead to increased motor efficiency [3,4,5]. To achieve high-performance motor functionality, NO electrical steels require optimized, balanced magnetic and mechanical properties.
The addition of silicon is effective in reducing losses in NO electrical steel sheets, as it improves magnetic properties and increases electrical resistivity, thus reducing losses. On the other hand, high Si content can deteriorate the processability of electrical steel [6,7,8]. Particularly for automotive applications, electrical machines must be designed to achieve high efficiency, high power density, low iron losses, and long life, especially when used in rotor cores [9].
The magnetic quality and practical usability of silicon steel for the electrical engineering industry depend on the silicon content, sheet thickness, and manufacturing technology, with the two most commonly used technologies for manufacturing segments of electrical machines (specifically the stator and rotor core) being shear cutting in a cut-ting tool and laser cutting [10].
Silicon (ranging from 0 wt% to 6.5 wt%) is the key element in electrical steels, serving as the main alloying constituent in production procedures and exhibiting various beneficial magnetic and mechanical properties [11]. From a manufacturing perspective, however, problems and challenges arise for producers of these steel grades when the silicon content is increased above 3.2 wt%. This increase leads to a decrease in formability and an increase in brittleness, ultimately resulting in the formation of cracks in electrical steel sheets during the processing stage, where magnetic properties are simultaneously affected by mechanical stress of various origins [12,13]. The final product of conventionally used “Fully Finished” Non-Oriented (NO) electrical steel possesses a microstructure, magneto crystalline texture, and specific magnetic properties, all of which are modified by final annealing after cold rolling. Nevertheless, subsequent material processing steps, such as shearing, stacking, welding, or final assembly, significantly affect the desired magnetic properties [14].
While the effect of silicon on the magnetic and basic mechanical properties of Non- Oriented (NO) steels is well-documented, a systematic study is lacking that details the link between Si content, advanced nanomechanical properties, and the resulting tribological behavior under precisely defined contact conditions. Therefore, this work aims to fill this gap. We proceeded from the hypothesis that at low and medium loads, wear resistance will correlate with nanomechanical parameters such as H/E and H3/E2. The objective of this study is thus to quantify the effect of Si content on the coefficient of friction and wear rate under dry reciprocal sliding conditions, and to clarify the ongoing wear mechanisms using detailed microstructural and EDX analysis.
2. Materials and Methods
Three quality grades of NO electrical steel with the chemical composition presented in Table 1 were used as experimental materials. These materials were taken from an industrial line after cold rolling with a 72% thickness reduction and were in the state after final heat treatment, known as Fully Finished. The samples after cold rolling were obtained by rolling hot strips with a thickness of 1.8 mm to a final thickness of 0.5 mm. The applied deformation of these sheets reached a value of 72%.

Table 1.
Chemical composition wt% of experimental samples.
Samples measuring 15 mm × 15 mm and 4 mm × 15 mm were cut from the experimental materials, which contained varying percentages of silicon, for the measurement of tribological and mechanical properties and microstructure observation.
Preparation of Experimental Samples
Experimental samples for basic microstructure observation and subsequent nanoindentation, with dimensions of 4 mm × 15 mm, were prepared using a spark erosion cutter (EIR-EMO 2N, Emotek sro, Nove Mesto nad Vahom, Slovakia) to prevent mechanical or thermal influence on the microstructure. Due to the small size of the collected samples and for easier handling, the samples were embedded in a thermo-setting compound, Polyfast.
Subsequently, the samples were wet ground on a Phoenix 4000 metallographic grinder using SiC abrasive papers with grits 600, 800, 1200, and 2400, with the aim of minimizing surface mechanical stress and eliminating scratches. After grinding, the samples were polished on a polishing cloth using DP-Paste P diamond paste with a particle size of ¼ µm while simultaneously flushing with kerosene to obtain a suitable surface. After polishing, the samples were rinsed with alcohol and etched using a 3 vol% Nital etchant for several seconds, so that the grain boundaries of the observed microstructural matrix were made visible.
Samples for tribological tests, with dimensions of 15 mm × 15 mm, were prepared on a TEGRAMIN 30 device (Struers, Ballerup, Denmark) by successive grinding on SiC abrasive media with grits from 320 to 1200, followed by polishing with diamond suspensions with particle sizes of 9 µm and 3 µm. Final polishing with a 1 µm diamond suspension resulted in an average surface roughness Ra ≈ 0.063 µm, determined by a Sensofar PLu Neox profilometer (PLu neox SENSOFAR, Terrassa ((Barcelona), Spain).
Basic microstructure observations of the tested NO electrical steel samples with three different chemical compositions in the final processed state (Fully Finished), designated N1, N3, and N5, were performed on an Olympus GX 71 light microscope (OLYMPUS Europa Holding GmbH, Hamburg, Germany), using 100× magnification.
Standardized tests were used to determine the mechanical properties of the experimental samples, such as yield strength, tensile strength, and hardness. The yield strength and tensile strength were determined by a static tensile test, the procedure of which is specified by standards STN EN ISO 6892-1 [15] (shape, dimensions, preparation of test pieces) and STN 42 0310 [16]. Hardness tests were performed according to Vickers STN EN ISO 6507-1 [17] using a Vickers hard meter Tukon 1102 (WILSON-WOLPERT, Shanghai, China) with a load of HV 0.1 (100 g) and 50× magnification.
Nanomechanical parameters, hardness H and Young’s modulus E, were measured by nanoindentation on an Agilent G200 device with a sharp Berkovich diamond tip. Hardness was evaluated at a maximum force of 240 mN. A minimum of 15 valid indentations, uniformly distributed on the polished surface, were performed for each sample. The hardness and modulus were evaluated using the standard Oliver–Pharr method [18].
Reciprocal tribo-tests were carried out on a Bruker UMT-3 tribometer (Berlin, Germany) in a ball-on-flat configuration against a 100Cr6 steel ball with a 6 mm diameter. The counter-body was decreased in an ultrasonic bath of acetone before the test. The tests were performed dry at a temperature of 22 ± 1 °C and relative humidity of 40 ± 5%. The stroke length was 5 mm at a frequency of 10 Hz, corresponding to a mean velocity of 0.1 m s−1. The applied normal load was 5 N, 10 N and 25 N, and the total sliding distance was 500 m. The coefficient of friction was continuously recorded throughout the test. The selected load levels made it possible to capture the transition from a mild to a more severe wear regime and systematically monitor the development of tribomechanisms.
The wear volume V was determined from 3D profilometry of the wear tracks using a Sensofar PLu Neox instrument (PLu neox SENSOFAR, Terrassa (Barcelona), Spain). The trace morphology and the character of the tribolayer were analyzed by the FIB-SEM method in SE and BSE modes on a ZEISS Auriga Compact instrument (Carl Zeiss IQS Deutschland GmbH, Oberkochen, Germany) and complemented by elemental analysis (EDX).
The specific wear rate Ws was calculated from the volume loss V, the sliding distance L, and the applied normal load Fs according to Equation (1):
Ws = V/(Fs · L) [mm3/(N·m)]
For the quantification of the steady-state behavior, the steady-state coefficient of friction (COF) was defined as the average value from the last 100 m of the sliding distance. The specific wear rate (Ws) was calculated according to Equation (1), where the volume loss of material (V) was determined from the 3D profile of the wear track using a confocal microscope.
3. Results and Discussion
3.1. Microstructure and Mechanical Properties
The microstructural matrices obtained across the sheet thickness from the experimental samples are shown in Figure 1. Hot annealing is known to be one of the most effective texture modification processes [19,20]. As can be observed, the morphology of the microstructural parameters of the individual types of NO electrical steel samples differ depending on their respective grade and chemical composition. The materials examined are characterized by an average homogeneity of grain size distribution throughout the sheet thickness. It is evident from the results that the grain size correlates with the silicon content an increase in silicon content leads to an increase in the average grain size of the observed microstructures. The calculation of the average grain size of the examined materials was performed by means of image analysis of the microstructures shown in Figure 1 using the ImageJ software (version 1.54p).
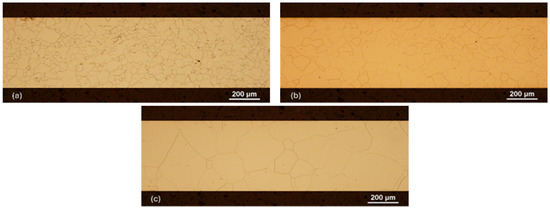
Figure 1.
Microstructures of the samples: (a) N1, (b) N3, (c) N5.
Figure 1a (sample N1 with 1.06 wt% Si) reveals a characteristic fine-grained microstructural matrix with an average grain size of approximately 25 µm.
A further increase in the average grain size is evident upon visual comparison with the microstructures of the higher silicon content samples, N3 and N5 (see Figure 1b,c). These micrographs clearly demonstrate advanced grain growth, leading to an increasingly inhomogeneous grain size distribution.
Quantitative analysis of these microstructures confirmed that the average grain size for steels N3 and N5 reaches 43 µm (Figure 1b) and 142 µm (Figure 1c), respectively.
The dependence of the grain size change of the examined materials on the silicon content in the individual samples is shown in Figure 2.
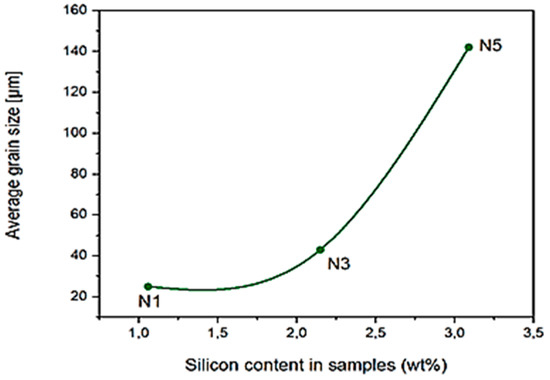
Figure 2.
Dependence of average grain size on chemical composition.
The mechanical properties were another set of properties examined for the experimental materials, and their results are presented in Table 2. From the individual measurements, we can see that along with the increasing wt% content of silicon, not only did the average grain size increase, but the yield strength ultimate tensile strength and hardness also increased.

Table 2.
Mechanical properties of experimental samples.
A systematic reduction in ductility was observed with increasing silicon content in the materials examined, suggesting a tendency towards increasing brittleness. Nevertheless, the strengthening effect of this element is significantly pronounced. This phenomenon was also confirmed by nanoindentation measurements at the micrometric level. As is evident from the data presented in Table 3, the nanomechanical hardness (H) grows monotonically with increasing silicon content, with sample N5 achieving almost 35% higher hardness than sample N1. This increase, which is consistent with the results of the microhardness HV measurements, represents a fundamental factor influencing the material’s resistance to plastic deformation under conditions of tribological contact. On the other hand, the value of Young’s modulus (E) remains practically unchanged for all analyzed materials, indicating the stability of the elastic properties of the alloys regardless of the silicon content.

Table 3.
Nanomechanical properties and derived tribological parameters of the examined materials.
For a deeper assessment of the material’s wear resistance, which, according to Archard’s law, primarily depends on hardness (H) it is also important to consider the influence of elasticity, which plays a key role in the stress distribution within the contact. In tribology, it has been shown that parameters such as H/E a H3/E2 often provide a better correlation with wear resistance than hardness alone, as they better describe the material’s resistance to the initiation of plastic deformation [21,22]. As shown in Table 3, the values of these resistance parameters monotonically increase with silicon content. Based on the combination of increasing hardness and these indicators, it could therefore be presumed that wear resistance will increase in the order N1 < N3 < N5.
However, as the tribological tests have shown, this theoretical prediction is valid only under specific conditions, and the relationship between hardness and wear is substantially more complex, with the dominant wear mechanism playing a crucial role.
3.2. Tribological Properties
3.2.1. Analysis of the Coefficient of Friction
The progression of the coefficient of friction (µ) as a function of the sliding distance for all experimental samples is shown in Figure 3a–c. Analysis of these dependencies reveals a complex influence of silicon content and applied load. At 5 N, the behavior changes with the composition. Sample N1 exhibits a nearly monotonic increase of µ from approximately 0.57 to about 0.60 without reaching a steady state, in contrast, the friction coefficient for samples N3 and N5 first decreases after a short initial run-in period, before transitioning to a quasi-steady state characterized by periodic oscillations due to the reciprocating motion.
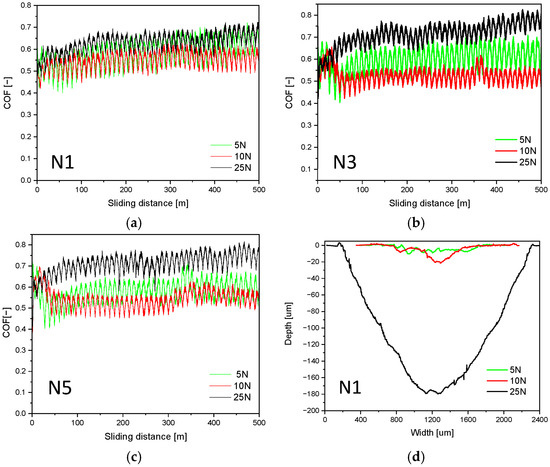
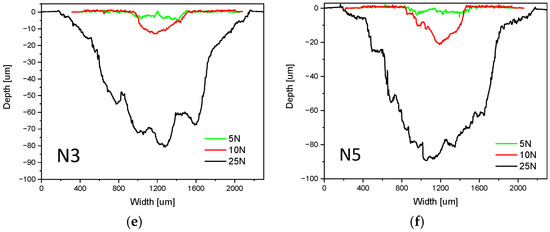
Figure 3.
Coefficient of Friction (COF) (a) N1, (b) N3, (c) N5 for individual samples and wear rate (Wₛ) profiles of samples and (d) N1, (e) N3, (f) N5.
At a load of 10 N, the differences between the materials are distinct. Sample N3 achieves the lowest and most uniform coefficient of friction, approximately 0.52 to 0.55 in the steady-state section. Sample N5 has similarly low values, approximately 0.56 to 0.57, which appear after the transient section. The coefficient of friction for sample N1 remains higher, approximately 0.57 to 0.59. These values align with the surface observations, where carbon-enriched areas appear in the N3 track and delamination of the protective layer is evident in the N1 track.
At a load of 25 N, an inverse relationship between hardness and the coefficient of friction is manifested. A slight increase in the average value is visible throughout the entire distance. Sample N1 achieved the lowest values, reaching approximately 0.68 to 0.70 in the steady-state section. In contrast, samples N3 and N5 maintained higher values of approximately 0.74 to 0.77 and 0.75 to 0.78, respectively. The higher coefficient of friction in the harder steels is accompanied by significant growing on the surface, whereas plastic flow predominates in N1. This difference supports the conclusion about the change in the dominant wear mechanism.
3.2.2. Analysis of Wear Rate
The Specific Wear Rate Ws (Figure 4) confirmed that the relationship between hardness and wear resistance is strongly load-dependent. To better visualize the extent of the damage, representative 2D wear track profiles are shown in Figure 3d–f.
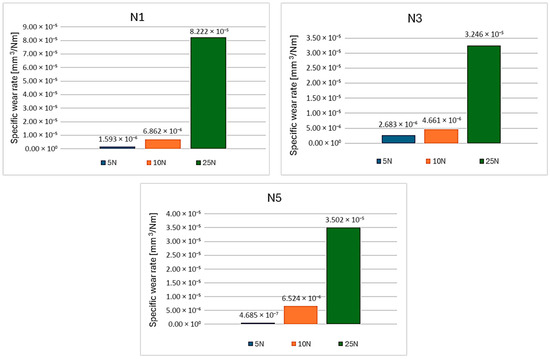
Figure 4.
Specific Wear Rate Ws, for samples N1, N3 and N5.
At a low load of 5 N, the wear resistance behaved in full agreement with predictions based on the mechanical properties. The hardest sample, N5, clearly achieved the lowest wear rate (4.68 × 10⁻⁷ mm3/Nm), which is visually confirmed by the shallowest track in Figure 3d. Conversely, the tracks of samples N1 and N3 are deeper and more irregular, corresponding to a tribolayer delamination mechanism.
At 10 N, sample N3 achieved the lowest wear rate, correlating with its optimal frictional properties. The profile in Figure 3e perfectly illustrates this behavior. The track of sample N3 is not only the shallowest but also smooth and symmetrical. The tracks of N1 and N5 are substantially deeper, which is consistent with their higher wear rate.
The most striking differences are visible at 25 N. The profile in Figure 3d provides direct visual evidence of the distinct failure mechanisms. The track of the softest sample, N1, reaches a depth of almost 180 µm, documenting its enormous wear by the plastic flow mechanism. In contrast, the tracks of the harder samples, N3 and N5, are more than twice as shallow, although their bottom is rough and irregular, suggesting an abrasive wear character. These observations quantitatively and qualitatively confirm that despite the high COF, the wear rate of samples N3 and N5 was significantly lower compared to the wear of sample N1 (≈8.22 × 10⁻⁵ mm3/Nm).
3.2.3. Analysis of Wear Mechanisms
A detailed SEM/EDX analysis of the worn surfaces (Figure 5) was crucial for understanding the distinct tribological mechanisms. For the harder samples with higher Si content, N3 and N5, it was confirmed at 25 N (Figure 5, N3-25 N and N5-25 N) that the dominant mechanism was abrasive and ploughing wear, evidenced by numerous coarse grooves (or scratches). This aggressive process is responsible for the high CoF, however, the high hardness of the materials prevented a massive loss of volume, leading to a high friction but controlled wear regime.
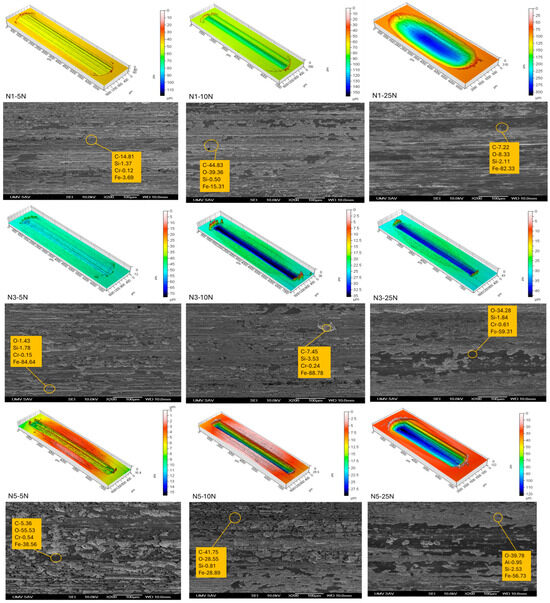
Figure 5.
SEM analysis of worn surfaces at 200× magnification, complemented by individual photographs from the confocal microscope.
Conversely, analysis of the softest sample with the lowest Si content, N1, revealed a diametrically different failure mechanism. At 25 N, severe adhesive wear combined with massive plastic deformation occurred (Figure 5, N1-25 N). The surface morphology was not characterized by clean grooves but by smeared material (material flow), which is a typical sign of galling mechanism failure and explains its high wear rate.
Key insights were provided by the analysis of sample N3 at a load of 10 N, a condition under which the material achieved optimal properties (Figure 5, N3-10 N). It is surface was heterogeneous, with the presence of local carbon-rich areas, suggesting the possible in-situ formation of a self-lubricating graphitic phase. It was this unique ability to create a dynamic equilibrium between resistance to deformation and the formation of lubricating layers that led to the simultaneous achievement of the lowest coefficient of friction and the lowest wear rate.
4. Conclusions
In this work, the influence of silicon content on the mechanical and tribological properties of three types of Non-Grain-Oriented (NGO) electrical steels was investigated.
Increasing silicon content leads to an increase in grain size, macro- and nano-hardness, and the strength of the material, while ductility decreases.
The tribological behavior is strongly dependent on the applied load. At low loads (5 N), wear resistance directly correlated with the material’s hardness, with the hardest steel N5 exhibiting the lowest wear rate, which is consistent with classic wear models.
At medium loads (10 N), the steel with intermediate Si content (N3, 2.15 wt%) exhibited optimal properties, the lowest coefficient of friction and the lowest wear rate, likely due to the in-situ formation of a self-lubricating carbon layer.
At high loads (25 N), the dominant wear mechanisms changed. While the soft steel with lower silicon content (N1) failed due to excessive adhesive wear and plastic deformation, the harder steels containing more silicon (N3, N5) transitioned into a regime of intensive abrasive wear. Despite the extremely high coefficient of friction their wear rate was significantly lower than that of N1.
The study demonstrated that although the addition of silicon generally increases wear resistance (especially at low loads), there exists an optimal level (N3) that provides the best compromise between hardness and the stability of the tribological system across a wider range of operating conditions.
Author Contributions
Conceptualization: M.M.; methodology: M.M., I.P., J.A. and R.D.; software: M.M.; validation: M.M., I.P., J.A. and R.D.; investigation, I.P.; data curation, M.M., I.P. and J.A.; writing—original draft preparation, M.M.; writing—review and editing: M.M. and I.P.; visualization, M.M.; supervision: I.P.; project administration: I.P. All authors have read and agreed to the published version of the manuscript.
Funding
This work was carried out within the research project Funded by the EU NextGenerationEU through the Recovery and Resilience Plan for Slovakia under the project No. 09I03-03-V04-00314.
Data Availability Statement
Data are contained within the article. The raw data of individual measurements and analyses will be made available by the authors on request.
Conflicts of Interest
The authors have no competing interests to declare that are relevant to the content of this article.
References
- He, Y.; Kestens, L.A. The processing, microstructure, texture, and magnetic properties of electrical steels: A review. Int. Mater. Rev. 2025, 70, 353–393. [Google Scholar] [CrossRef]
- Schneider, J.; Franke, A.; Fortunati, S. Evolution of Microstructure and Texture for Electrical Steels-Non-Grain Oriented (NGO) vs. Grain Oriented Electrical Steels (GO)-Part 1: NGO. In Proceedings of the 9th International Conference Magnetism and Metallurgy WMM20, Rome, Italy, 3–5 February 2020. [Google Scholar]
- Du, Y.; O’Malley, R.; Buchely, M.F. Review of Magnetic Properties and Texture Evolution in Non-Oriented Electrical Steels. Appl. Sci. 2023, 13, 6097. [Google Scholar] [CrossRef]
- Landgraf, F.J.G. Nonoriented electrical steels. JOM 2012, 64, 764–771. [Google Scholar] [CrossRef]
- Mehdi, M.; He, Y.; Hilinski, E.J.; Edrisy, A. Effect of skin pass rolling reduction rate on the texture evolution of a non-oriented electrical steel after inclined cold rolling. J. Magn. Magn. Mater. 2017, 429, 148–160. [Google Scholar] [CrossRef]
- Zhang, B.; Liang, Y.; Wen, S.; Wang, S.; Shi, X.; Ye, F.; Lin, J. High-strength low-iron-loss silicon steels fabricated by cold rolling. J. Magn. Magn. Mater. 2019, 474, 51–55. [Google Scholar] [CrossRef]
- Oda, Y.; Kohno, M.; Honda, A. Recent development of non-oriented electrical steel sheet for automobile electrical devices. J. Magn. Magn. Mater. 2008, 320, 2430–2435. [Google Scholar] [CrossRef]
- Lemke, J.N.; Simonelli, M.; Garibaldi, M.; Ashcroft, I.; Hague, R.; Vedani, M.; Wildman, R.; Tuck, C. Calorimetric study and microstructure analysis of the order-disorder phase transformation in silicon steel built by SLM. J. Alloys Compd. 2017, 722, 293–301. [Google Scholar] [CrossRef]
- Aiso, K.; Akatsu, K. Performance Comparison of High-Speed Motors for Electric Vehicle. World Electr. Veh. J. 2022, 13, 57. [Google Scholar] [CrossRef]
- Slota, J.; Spišák, E.; Kaščák, L.; Majerníková, J. Experimental and finite element analysis of the shear cutting process of electrical steel sheets under various process conditions. IOP Conf. Ser. Mater. Sci. Eng. 2019, 651, 012084. [Google Scholar] [CrossRef]
- Karami, R.; Butler, D.; Tamimi, S. Manufacturing of non-grain-oriented electrical steels: Review. Int. J. Adv. Manuf. Technol. 2024, 133, 1083–1109. [Google Scholar] [CrossRef]
- Petrovič, D.S. Non-oriented electrical steel sheets. Mater. Technol. 2010, 44, 317–325. [Google Scholar]
- Ros-Yañez, T.; Houbaert, Y.; Fischer, O.; Schneider, J. Production of high silicon steel for electrical applications by thermomechanical processing. J. Mater. Process. Technol. 2003, 141, 132–137. [Google Scholar] [CrossRef]
- Gautam, J.; Petrov, R.H.; Leunis, E.; Kestens, L. Strain Induced Inward Grain Growth during Recrystallisation in Steel Sheets with BCC Crystal Structure. Mater. Sci. Forum. 2012, 715–716, 303–308. [Google Scholar] [CrossRef]
- STN EN ISO 6892-1 (ISO 6892-1:2019); Metallic Materials—Tensile Testing—Part 1: Method of Test at Room Temperature. CEN-CENELEC Management Centre: Bruxelles, Belgium, 2019.
- STN 42 0310 (ISO 6892-1:2016); Metallic Materials—Tensile Testing—Part 1: Method of Test at Room Temperature. CEN-CENELEC Management Centre: Bruxelles, Belgium, 2016.
- STN EN ISO 6507-1; Metallic Materials—Vickers Hardness Test—Part 1: Test Method. CEN-CENELEC Management Centre: Bruxelles, Belgium, 2023.
- Oliver, W.C.; Pharr, G.M. An improved technique for determining hardness and elastic modulus using load and displacement sensing indentation experiments. J. Mater. Res. 1992, 7, 1564–1583. [Google Scholar] [CrossRef]
- Stephenson, E.; Marder, A. The effects of grain size on the core loss and permeability of motor lamination steel. IEEE Trans. Magn. 1986, 22, 101–106. [Google Scholar] [CrossRef]
- Ghosh, P.; Chromik, R.R.; Knight, A.M.; Wakade, S.G. Effect of metallurgical factors on the bulk magnetic properties of non-oriented electrical steels. J. Magn. Magn. Mater. 2014, 356, 42–51. [Google Scholar] [CrossRef]
- Hutchings, I.; Shipway, P. Tribology Friction and Wear of Engineering Materials, 2nd ed.; Butterworth-Heinemann: Oxford, UK, 2017; pp. 106–240. [Google Scholar]
- Hanief, M.; Charoo, M.S. Archard’s wear law revisited to measure accurate wear coefficient considering actual sliding velocity. Mater. Today Proc. 2021, 47, 5598–5600. [Google Scholar] [CrossRef]
Disclaimer/Publisher’s Note: The statements, opinions and data contained in all publications are solely those of the individual author(s) and contributor(s) and not of MDPI and/or the editor(s). MDPI and/or the editor(s) disclaim responsibility for any injury to people or property resulting from any ideas, methods, instructions or products referred to in the content. |
© 2025 by the authors. Licensee MDPI, Basel, Switzerland. This article is an open access article distributed under the terms and conditions of the Creative Commons Attribution (CC BY) license (https://creativecommons.org/licenses/by/4.0/).