Article

Low Coefficient of Thermal Expansion (CTE) Ceramic–Thermoplastic Composite for Fused Deposition Modelling of RF and Microwave Devices

1
Department of Electrical Engineering, University of South Florida, 4202 E. Fowler Avenue, Tampa, FL 33620, USA
2
Department of Chemistry, University of South Florida, 4202 E. Fowler Avenue, Tampa, FL 33620, USA
3
Synopsys, Inc., San Diego, CA 92130, USA
4
ABB, Bloomfield, CT 06002, USA
*
Authors to whom correspondence should be addressed.
Crystals 2025, 15(11), 963; https://doi.org/10.3390/cryst15110963
Submission received: 10 October 2025 / Revised: 31 October 2025 / Accepted: 4 November 2025 / Published: 7 November 2025
(This article belongs to the Section Inorganic Crystalline Materials)

Abstract

Additive manufacturing (AM) has significant potential for rapid prototyping of intricate 3-dimensional geometries, yet its adoption in RF and microwave applications remains limited. Key barriers include inadequate material characterization, high dielectric losses, poor thermal stability, and challenges with multi-material integration. This work addresses these issues by developing a high-k, low-loss composite filament with a reduced coefficient of thermal expansion (CTE), specifically formulated for fused deposition modelling (FDM). By varying filler volume fractions (30%, 40%, and 50% v/v) and surfactant content, their impact on thermal stability and CTE was investigated and measured by thermomechanical analysis (TMA). XRD, Pycnometry, and EDS analysis were performed to verify the effect of the calcination process on ceramic microfillers. The B.E.T. method (Brunauer–Emmet–Teller) was utilized to calculate the specific surface area of the samples with N2 uptake. SEM images of the different composites were presented to visually demonstrate the homogeneous distribution of microfillers in the thermoplastic matrix. Titania was evaluated as the ceramic filler. Titania composites demonstrated decreased CTE values (35.93 ppm/°C at 50% v/v filler coated with surfactant) compared to composites without surfactant. A dielectric waveguide (DWG) printed with the T30S composite achieved an insertion loss of 0.46 dB at 17.23 GHz, significantly outperforming a commercially available ABS450-based DWG (0.95 dB at 16.88 GHz). Measurements aligned closely with 3D electromagnetic simulations, confirming dielectric properties (εr = 5.55, tan δ = 0.0009) suitable for advanced RF and microwave devices and advanced packaging applications.

1. Introduction

Additive manufacturing (AM) is the process of fabricating a complex 3D article, which would be impossible or prohibitively expensive to fabricate using traditional subtractive manufacturing processes. As such, AM has emerged as a widely utilized method for fabricating custom-designed prototypes, mostly used by researchers and scientists [1,2,3,4,5,6,7,8,9,10,11,12,13,14,15,16]. Fused deposition modelling (FDM) is one of the widely used AM techniques [10,17]. FDM might not have the spatial resolution offered by other techniques, but it compensates for this by having a larger range of compatible materials and no need for post-processing steps [18,19,20]. However, the mechanical, electrical, and thermal properties of some FDM feedstock materials are not well-suited for some functional applications [5,21,22].
Ceramic–polymer composites have been investigated by numerous researchers due to their tailorable thermal, mechanical, and electrical properties [23,24]. For instance, epoxy–ceramic composite has been used in high-power capacitor applications due to high permittivity and breakdown voltage [25,26]. Furthermore, there are commercially available filaments available from vendors such as Zetamix by Nanoe [27]. These composites also have a low coefficient of thermal expansion, which makes them suitable for high-power RF applications [28,29,30,31,32,33]. Some composites are more chemically inert and can operate in a harsher environment compared to a pure polymer matrix [5,25,34,35]. These modified thermal properties are a complex function of filler particle size, shape, homogeneity of mixture, and surface functionality [23,24,36,37]. The crucial advantage of using this type of polymer–ceramic composite is that its properties can be tailored according to the nature of applications by varying the filler volume or type [2,22,30]. There are several numerical or empirical models to predict the coefficient of thermal expansion (CTE) of the composite based on volume fraction, size, shape of the filler, and the interphase between filler and polymer [24,29,38]. These types of composites are widely used in the electronics packaging industry due to their unique thermal conductivity and electrical insulator behaviour [1,18,24,28,33]. For integrated circuits, these composites are used as an interlayer dielectric. Thermal management plays an even more pivotal role in integrated circuits due to miniaturization and high-power density. The mismatch in CTE values of materials used in a device can become a source of failure [28]. Many integrated circuits (ICs) have silicon as a substrate, which has a CTE value of 2.6–3.3 ppm/°C, which is two orders of magnitude lower than the typical CTE values of polymers. Decreasing the effective CTE of a polymer requires the addition of inorganic fillers with significantly low or negative CTE inside the polymer matrix. The problem with this approach is that the added inorganic fillers also have an effect on other polymer composite properties, such as permittivity and mechanical rigidity, although some researchers found a way to tailor only one specific composite property by incorporating two kinds of inorganic fillers and varying individual volume fraction while keeping total filler volume fraction constant [34]. Homogeneous distribution of inorganic particles is crucial to achieve optimal composite properties. The nature of interfacial bonding between inorganic particles and organic matrix has a significant effect on composite properties [25]. Vo et al. use that fact in their model to predict the CTE of composite material, which is more accurate compared to the rule of mixture or Maxwell–Garnett equation [23].
In this work, the coefficient of thermal expansion (CTE) of several previously in-house developed polymer–ceramic composites have been measured [22,39]. For this, titania TiO2 filler was used to make a high-k and low-loss dielectric composite. The effect of surfactant-assisted ball-milling is evaluated by comparing the CTEs of samples with surface treatment of ceramic particles and samples without surface treatment of ceramic particles. XRD, Pycnometry, and EDS analysis were performed on microfiller particles before and after the calcination process at 1100 °C to verify the effect of the calcination process on ceramic microfillers. SEM images of the different composites were presented to visually demonstrate the homogeneous distribution of microfillers in the thermoplastic matrix. To highlight the effect of high-energy ball-milling on particle size distribution, microparticle size analysis was performed. The purpose of this study is to demonstrate the lowest CTE that can be reliably achieved by fused deposition modelling of ceramic–thermoplastic composites.

2. Materials and Methods

For this work, cyclo-olefin polymer (COP) ( ε r   of 2.15, tan δ d of 0.0016) is chosen as a polymer matrix due to its high chemical inertness and good mechanical and thermal properties [1,2,5,40,41,42]. The COP was acquired from Zeon Corporation, Tokyo, Japan. TiO2 ( ε r   of 96, tan δ d of 0.0004) particles were used as dielectric inorganic fillers due to their low dielectric losses and widely studied properties [1,25,30,33,34,43]. TiO2 powders were acquired from Trans-Tech Skyworks, Adamstown, MD, USA. A commercially available FDM-ready feedstock filament, Premix ABS450 ( ε r   of 4.5, tan δ d of 0.003), was acquired from Premix Group Corporation, Rajamäki, Finland. γ-aminopropyltriethoxsilane (APTES) was acquired from Sigma-Aldrich, St. Louis, MI, USA to be employed as the chosen surfactant for this study.
As shown in Figure 1, COP was first dissolved in the solvent while maintaining optimal viscosity using magnetic stirring. TiO2 powder was calcined in the ambient air environment at 1100 °C for 3 h to remove impurities and decrease dielectric loss. After calcination, TiO2 powder was ball-milled using zirconia (ZrO2) balls in a liquid medium, with and without the presence of the chosen surfactant γ -aminopropyltriethoxsilane (APTES) at 600 rpm for 18 h to obtain a tight particle size distribution [44,45,46]. TiO2 powder was then dried and sieved to remove agglomerated particles over a certain size. Dissolved COP was mixed with TiO2 particles at different volume concentrations using a Thinky centrifugal mixer (Thinky corporation, Laguna Hills, CA, USA) to achieve homogeneous dispersion of particles at 2000 RPM for 20 min. The mixture was dried in a fume hood for 48 h, followed by further drying in an oven at 80 °C for 48 h to remove any solvent residuals. Thereafter, the fully dried composite was manually chopped and extruded to make feedstock filaments or CTE test pellet specimens. Figure 1 also shows a picture of spooled, in-house prepared FDM-ready feedstock filament.
The densities of the samples were measured in the automatic high-precision pycnometer BELPYCNO from Microtrac MRB, Montgomeryville, PA, USA, equipped with a volume reducer to enhance the accuracy of the results. Samples were inserted in the 1 mL cell, and the measurements were carried out using high-purity He (99.999%) for purging. A cycle of 5 measurements per sample was conducted to determine the standard deviation.
All the powder X-ray diffraction patterns were collected on a Bruker D8 Advance diffractometer (by Bruker, Billerica, MA, USA) with a Lynxeye (Stockholm, Sweden) detector using CuKα radiation. The X-ray source operated at 40 kV/40 mA, and a Ni filter was used to suppress Kβ radiation. Then, 2.5-degree primary and secondary Soller slits were used to suppress axial divergence. Diffraction patterns were recorded from 20 to 100 2θ in variable slits mode and with a knife edge installed. A typical scan rate was 20 s/step with a step size of 0.02 deg.
For the gas sorption studies, the fine-powder samples were placed in a 9 mm pre-weighted quartz cell and then activated at 150 °C for 12 h, under vacuum. After the activation process, the cells were cooled to room temperature and then placed at the analysis station. N2 (99.999%) gas sorption measurements were recorded at 77 K up to 1 bar, using a state-of-the-art, high-precision BELSORP-MAX X from Microtrac MRB Montgomeryville, PA, USA, equipped with four (4) analysis stations and a detachable thermostatic bath for accurate measurements. The desired cryogenic temperature was achieved using a bath of liquid nitrogen (LN2, 77 K, N2) in a cryogenic dewar as a coolant.
The TMA Q400 thermomechanical analyzer by TA Instruments, Dallas, TX, USA is employed to measure dilatational change in pellet-shaped test sample heights with increasing temperature. The Filabot Ex2 extruder (Filabot, Barre, VT, USA) was used to extrude CTE test samples in pellet form and feedstock filaments of an FDM-ready diameter. The Thinky Mixer (Thinky corporation, Laguna Hills, CA, USA) was used to homogeneously mix inorganic particles and an organic matrix. The SEM analysis was performed using a Hitachi SU-70 Scanning Electron Microscope (SEM) (Hitachi, Ltd., Tokyo, Japan). The microparticle size analysis was performed by using a Zetasizer Nano-S dynamic light scattering system (Malvern Instruments, Malvern, Worcestershire, UK). 4The elemental analysis was performed by energy dispersive spectroscopy (EDS) using an S-800 field emission scanning electron microscope (FE-SEM) (Hitachi Ltd., Tokyo, Japan), which is equipped with an EDS system (EDAX Inc., Mahwah, NJ, USA). The nScrypt table-top 3D printer (nScrypt, Orlando, FL, USA) is employed for 3D printing dielectric waveguides (DWGs). Keysight ENA E5063A network analyzer (Keysight Technologies, Santa Rosa, CA, USA) (100 kHz–18 GHz), along with two WR-62 metal rectangular waveguides from Maury Microwave, Ontario, CA, USA, were used for s-parameter measurements. Short-short-load-thru (SSLT) waveguide calibration was performed on waveguide ports, and then WR-62 extenders were added to keep calibration planes unaffected by the tapered sections of DWGs.
There are several empirical and analytical models, that are used to predict CTE of a composite material based on CTE values of the constituents, their volume fraction, interphase characteristics between filler and matrix, and sometimes their bulk/shear modulus [47,48,49]. These models are useful as they allow a first-level approximation for the range of CTE values that could be achieved by creating a composite out of two different constituent materials. The simplest governing equation among these models is the ‘rule of mixture’:
α c =   α f φ f + 1 φ f α m
where α c   is CTE of the composite, α f   and α m   are CTEs of the filler and polymer matrix, respectively. φ f   is the volume fraction of filler particles. This formulation is one of the widely used models as a first-order approximation if there is no interaction [38].
The Vo-Shi model accounts for the effect of the bonding and interphase between inorganic particles and organic matrix on the CTE of the composite [24]. It has been successfully utilized to predict the composite’s CTE that matches experimental data.
α c = 1 1 + K 0 φ f φ m ( α f φ f + φ m α m + K 0 φ f φ m ( α f + α m ) + K 0 φ f φ m K 1 )
where α c   is the CTE of the composite, α f   and α m   are the CTEs of filler and matrix, respectively. φ f   and φ m   are the volume fraction of filler and the matrix, respectively. K 0   is a constant whose value in Equation (2) accounts for the matrix filler interaction strength. Its value depends on the size of the filler and the nature of the surfactant or surface modification of inorganic particles. Specifically, a large positive value of K 0 means strong interphase strength, whereas a zero value means interaction between filler and matrix is negligible. K 1   represents K 0 ’s dependence on temperature, which is given by the following:
K 1 = ( ln K 0 ) T
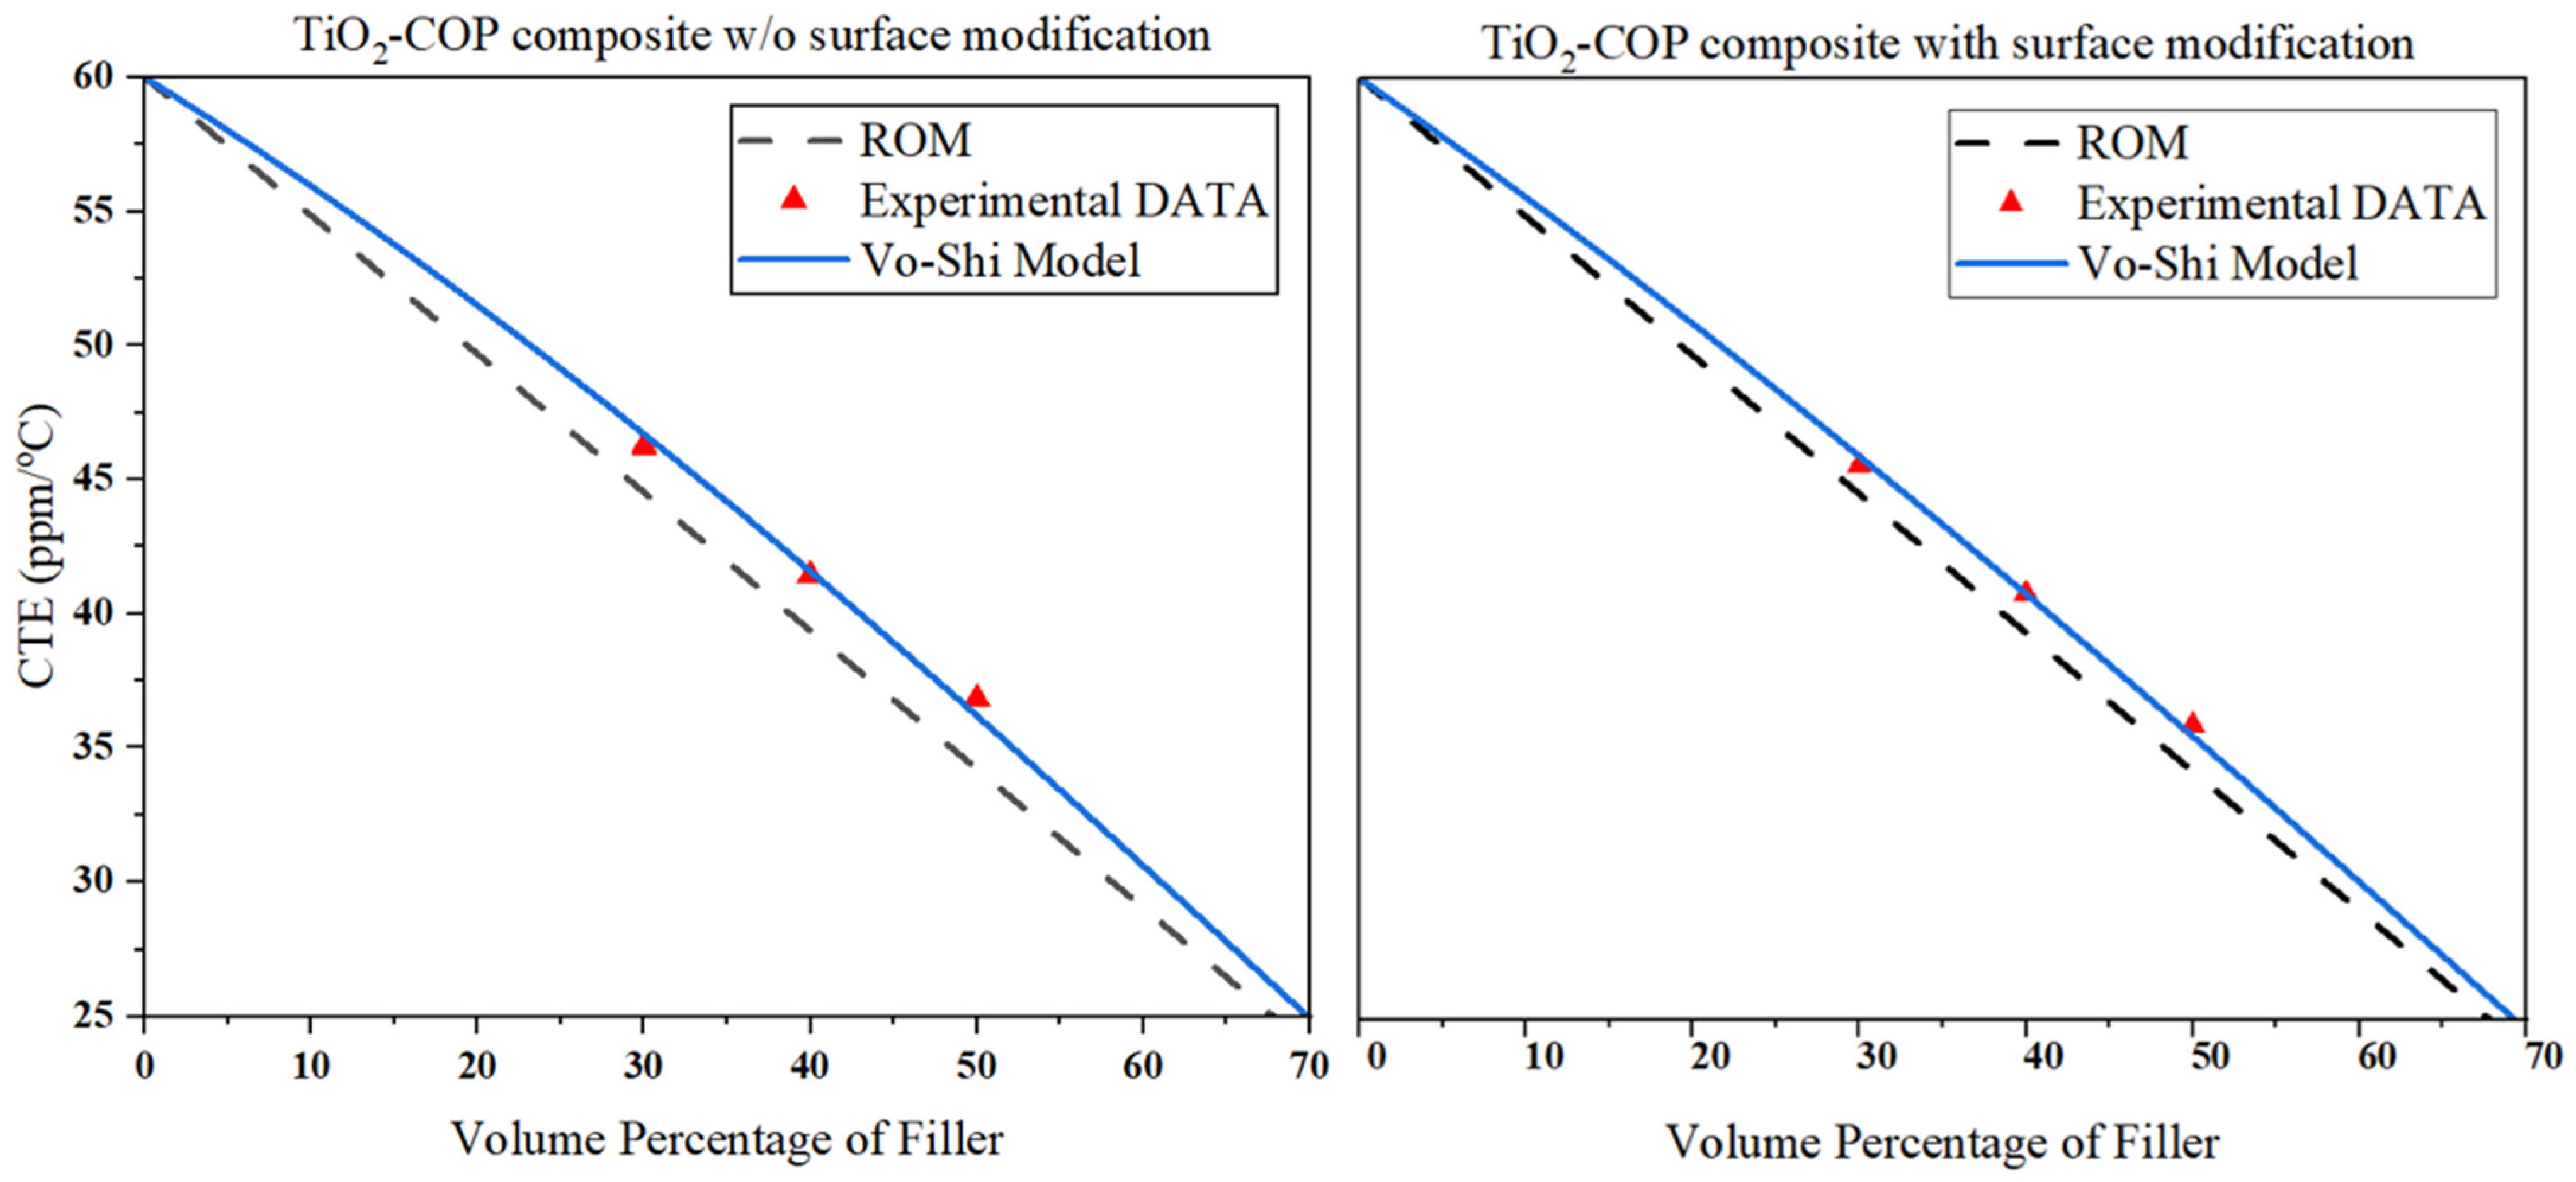
Figure 2 presents the experimental data compared with the rules of mixture (ROM) and the Vo-Shi model. It is observed that for the composite with TiO2 as the filler particles, the ROM model underpredicts the effective CTE of the composite. This might be due to the fact that the ROM model does not account for the effect of the interphase between inorganic filler particles and organic matrix. Thus, the Vo-Shi model was used to better account for the effect of surface modification on the effective CTE of the composite. As seen in Figure 2, the Vo-Shi model with corresponding values for K 0   and K 1   better aligns with the measured CTE results. The measured CTE of unfilled COP (59.86 ppm/°C) and reported CTE values of the fillers are used for calculating the CTE of the composite. These values, along with the values of K 0   and K 1   are given in Table 1.

3. Results and Discussion

Titania (TiO2) ceramic particles were chosen as fillers in this work. To observe the effect of the calcination process as well as high-energy ball-milling, the average density of titania powder was measured using He Pycnometry. The density values were calculated through gas displacement and pressure difference (Table 2). Employment of helium (He) eliminates the possibility of errors caused by air trapped in solid cavities, especially due to helium’s small atomic size. As intended, the calcination process densifies the titania powder. High-energy ball-milling after calcination further increases density. The difference in measured density values of ball-milled titania powder with and without surfactant indicates that effective surface modification was achieved by including the surfactant during the high-energy ball-milling process.
Filler volume fraction varied from 30 to 50% v/v in volume fraction, as shown in Table 3. To investigate the effect of surface modification on the effective CTE of the composite, two batches of composites with titania as filler were fabricated with and without the usage of surfactant during the high-energy ball-milling process.
Nonlinear CTE responses were observed between 25 °C and 40 °C, which can be largely ascribed to the heterogeneous environment in the TMA test furnace. Hence, the average CTE values were calculated from the CTE response between 40 °C and 120 °C for each of the COP-based composite pellet test samples. Measured CTE values for different composites are presented in Table 3. As predicted by the analytical prediction models, the average CTE value of the composite decreases as the amount of ceramic filler volume fraction is increased. The effect of surfactant on average CTE was minimal, as observed by comparing the titania-based composite with and without surface modification. However, surface modification does improve the dielectric loss tangent [22,39], and it does not negatively affect mechanical properties. Hence, surface modification is a preferred choice for composites used for 3D printing of RF and microwave devices. In our future publication, we will compare measured CTE values of our in-house developed composite with its commercial counterpart, filament Zetamix by Nanoe.
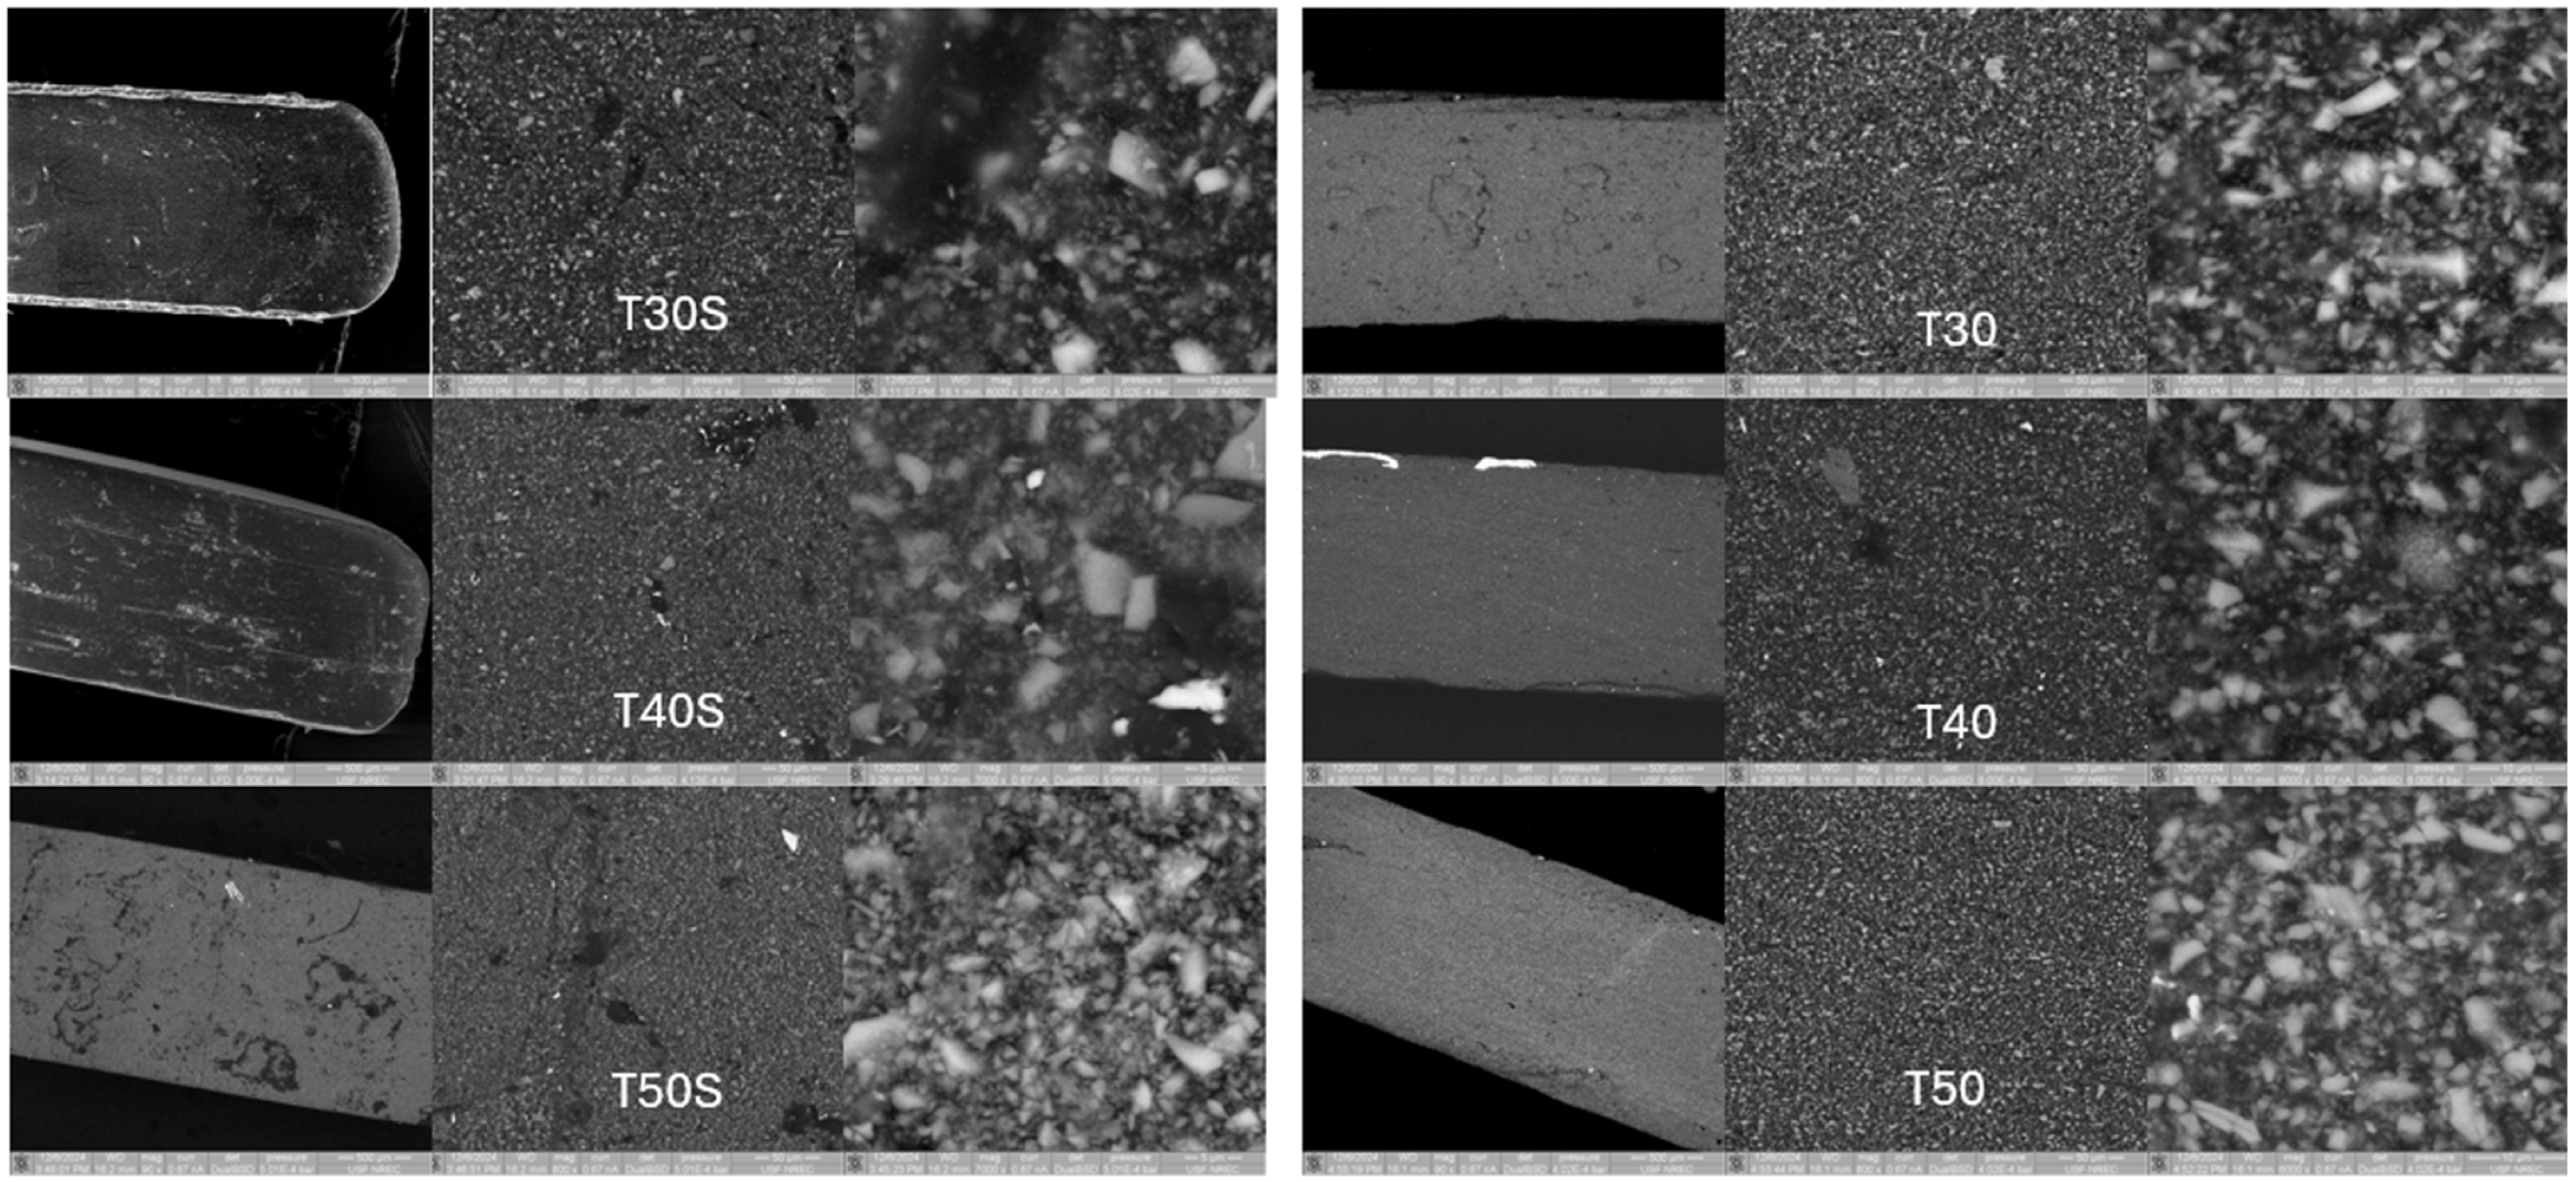
To qualitatively confirm the homogeneous distribution of filler particles in the matrix, scanning electron microscope (SEM) images were taken of different composites, as shown in Figure 3. Furthermore, these SEM images show an approximate value for the average radius of filler particles as well as information about their geometry (e.g., if the filler particles are spherical or not, etc.). As can be seen in Figure 3, the filler particles are homogeneously distributed in all composite samples.
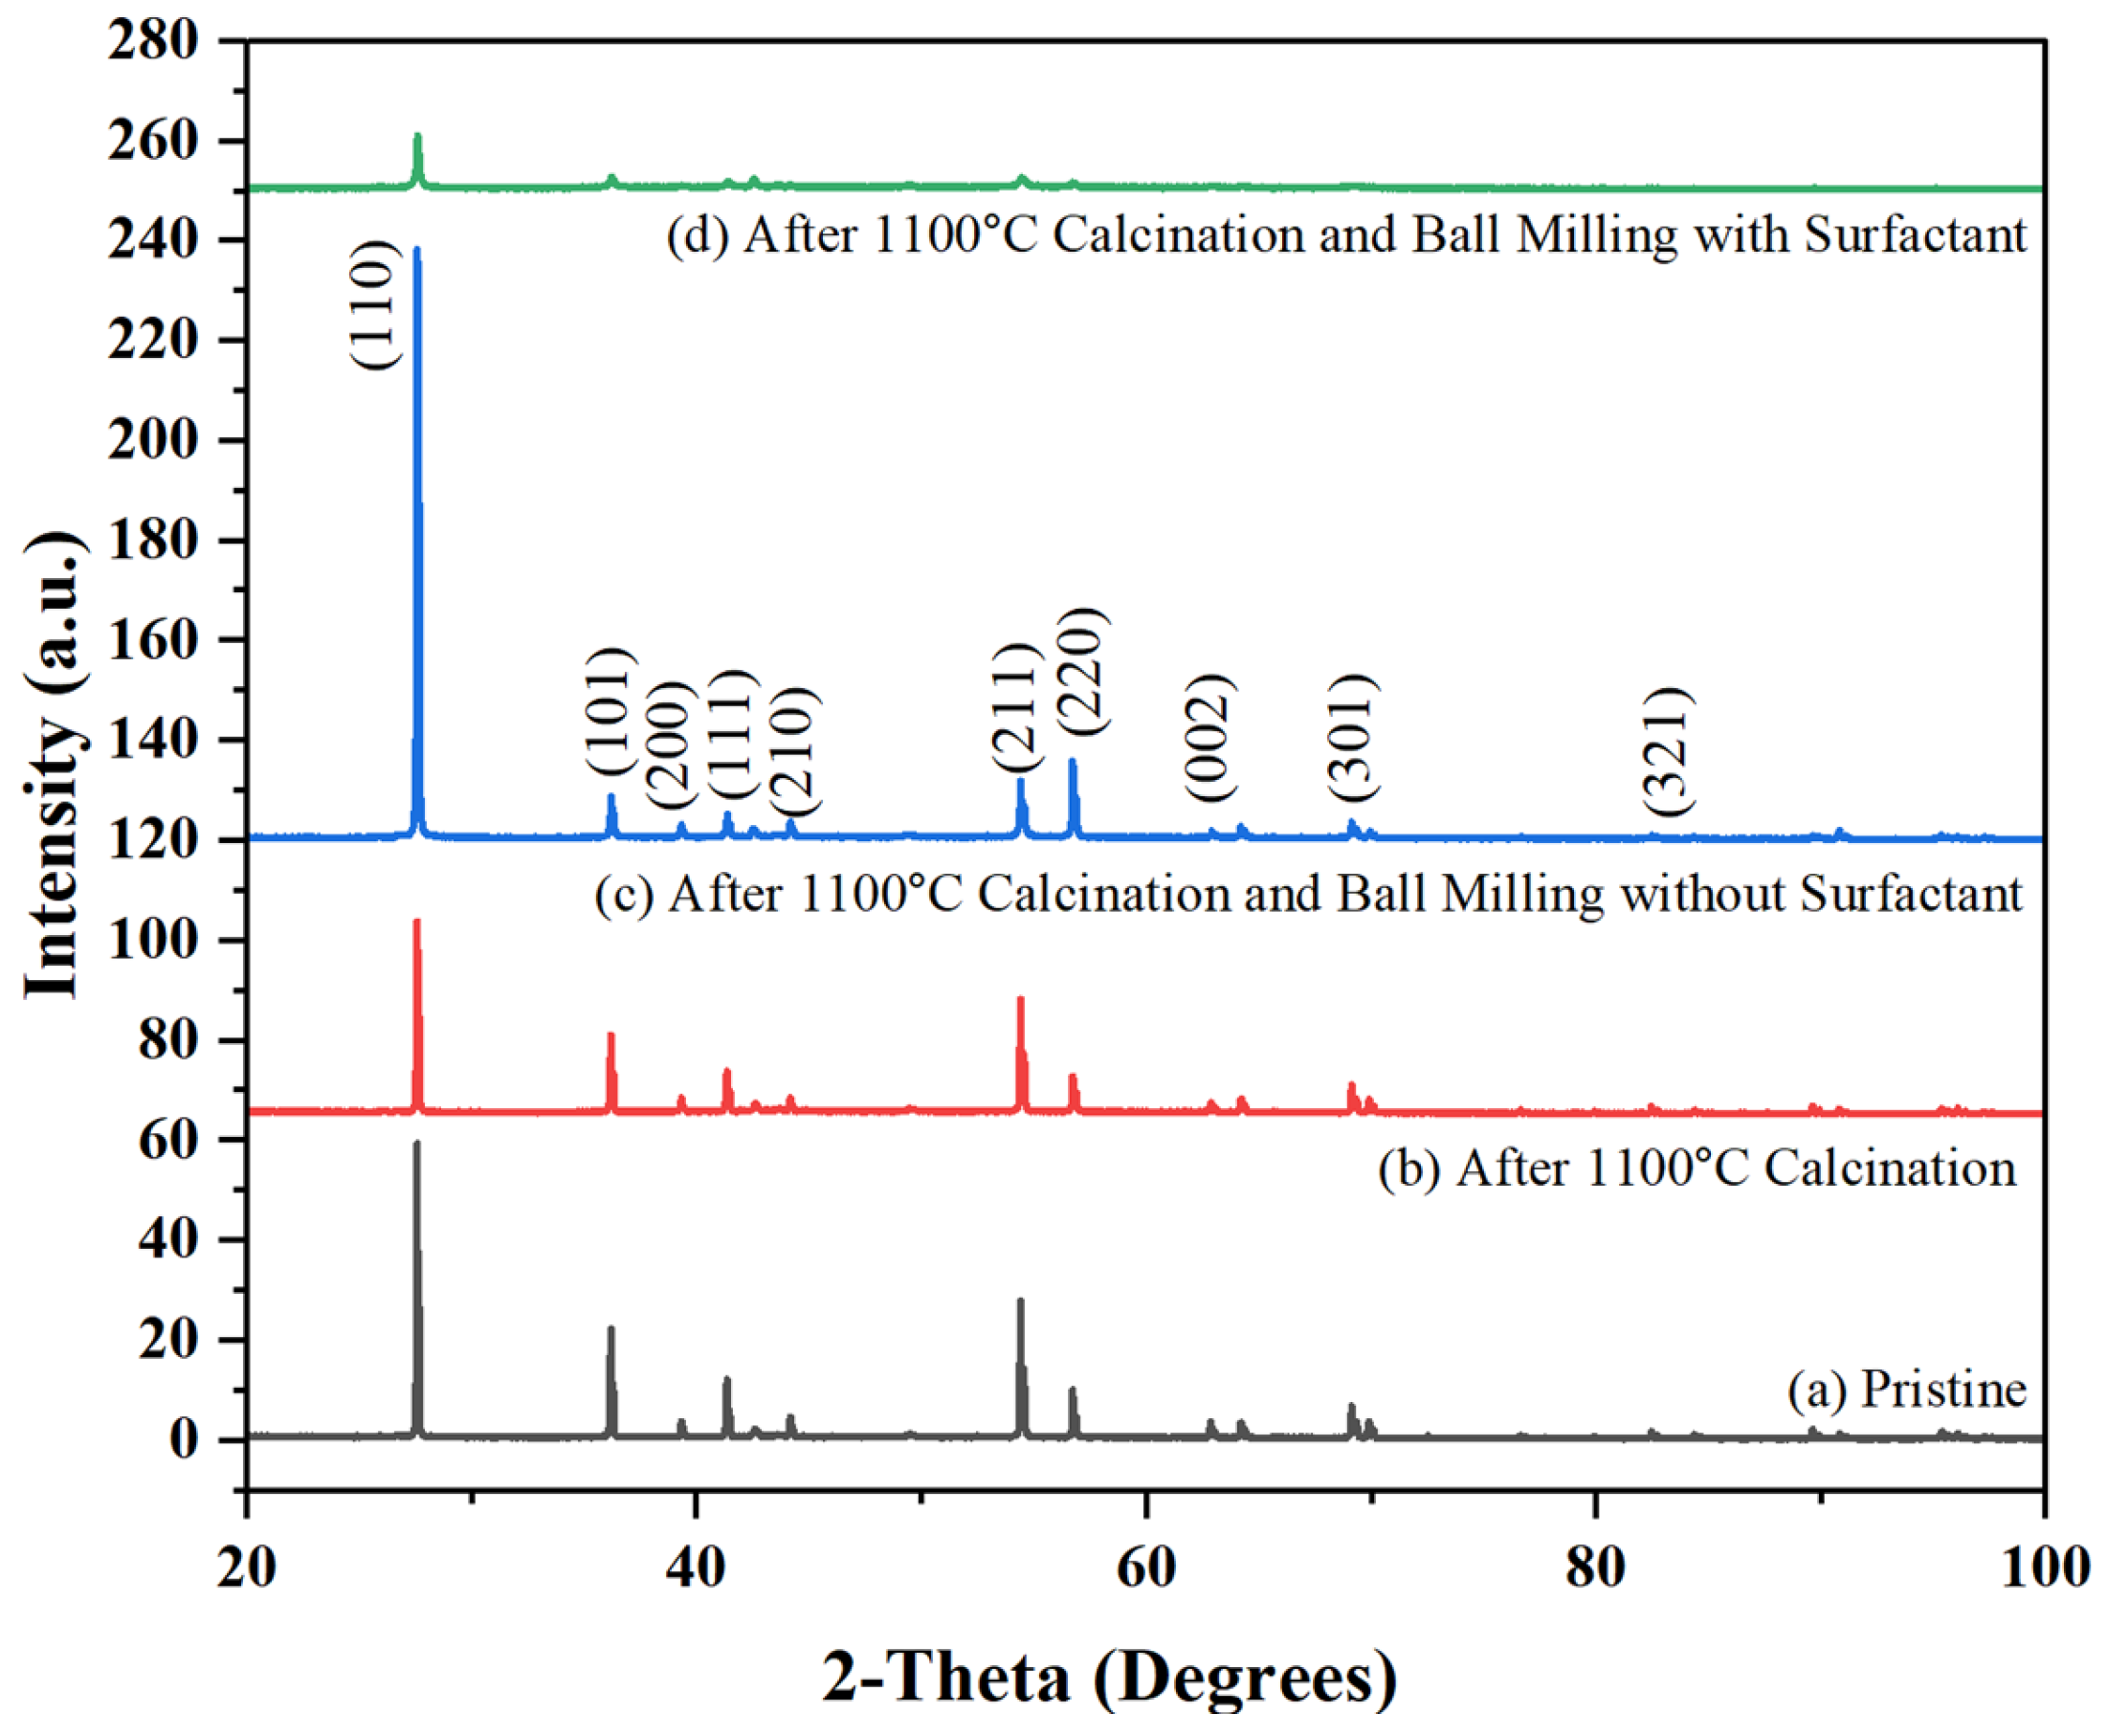
The phase purity and structural integrity of the samples throughout most steps were confirmed by PXRD analysis. Table 4 summarizes the average particle size and lattice parameters for TiO2 fillers. Neither the calcination nor the ball-milling affected the samples’ crystal structure. The surfactant’s treatment had a minimum impact on the crystallinity of the material (Figure 4).
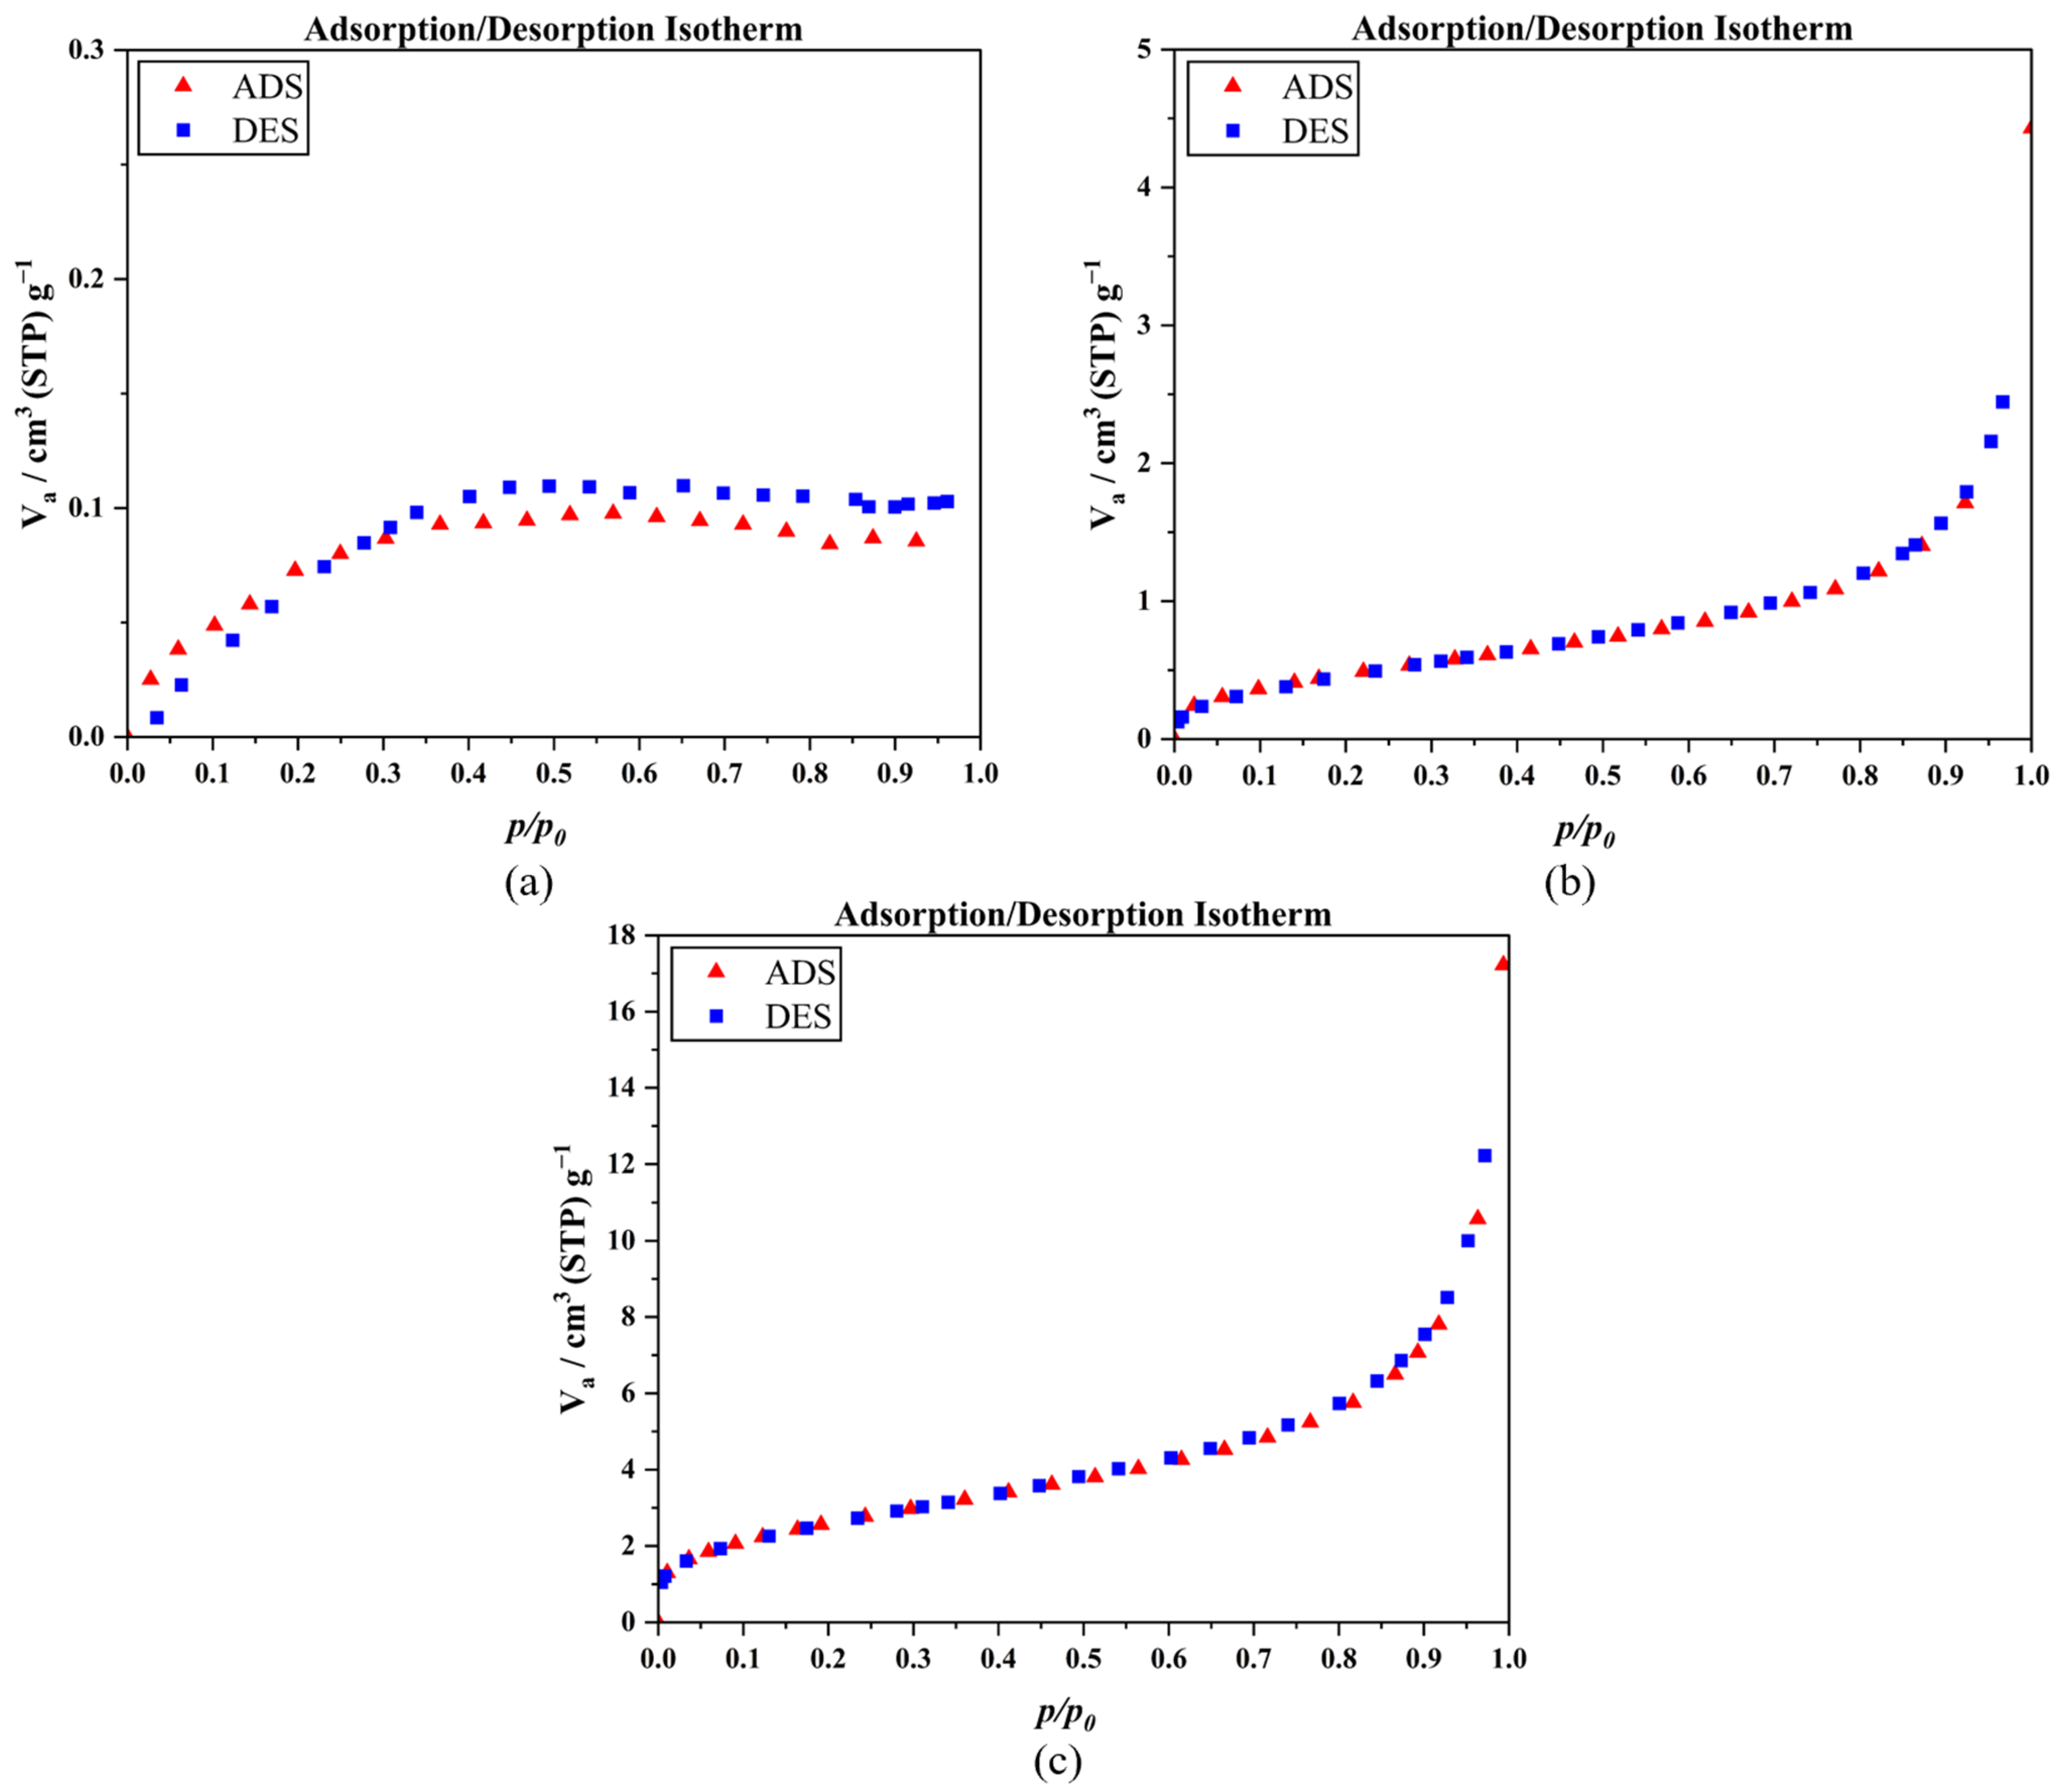
The impact of the surfactant on the material structure is furthermore verified through gas sorption measurements. The increased N2 uptake in the case of the surfactant-treated sample, as compared to the rest (Figure 5), suggests changes in the porous nature of the material. To quantify this, we applied the BET method (Brunauer–Emmet–Teller) to calculate the specific surface area of the samples with N2 sorption studies at 77K. Apparently, a significant difference was observed between the surfactant-treated and untreated samples, with specific surface areas of 8.64 m2/g and 1.74 m2/g, respectively. The latter corroborates the impact of the surfactant treatment on the filler particles’ porosity, further supported by the decrease in the density of the surfactant-treated sample compared to that of non-treated sample (see above).
The EDS analysis clearly shows that calcination reduces the presence of OH groups existing on the surfaces of the TiO2 particles. Table 5 presents semi-quantitative elemental composition analysis for the TiO2 fillers, while the corresponding EDS spectrum is shown in Figure 6. Titania ceramic powders were calcined under an ambient air environment at 1100 °C for 3 h to densify the particles. Ti and O are the elements that have shown more noticeable changes in the wt.% concentrations by the chemical reaction during the high-temperature calcination process.
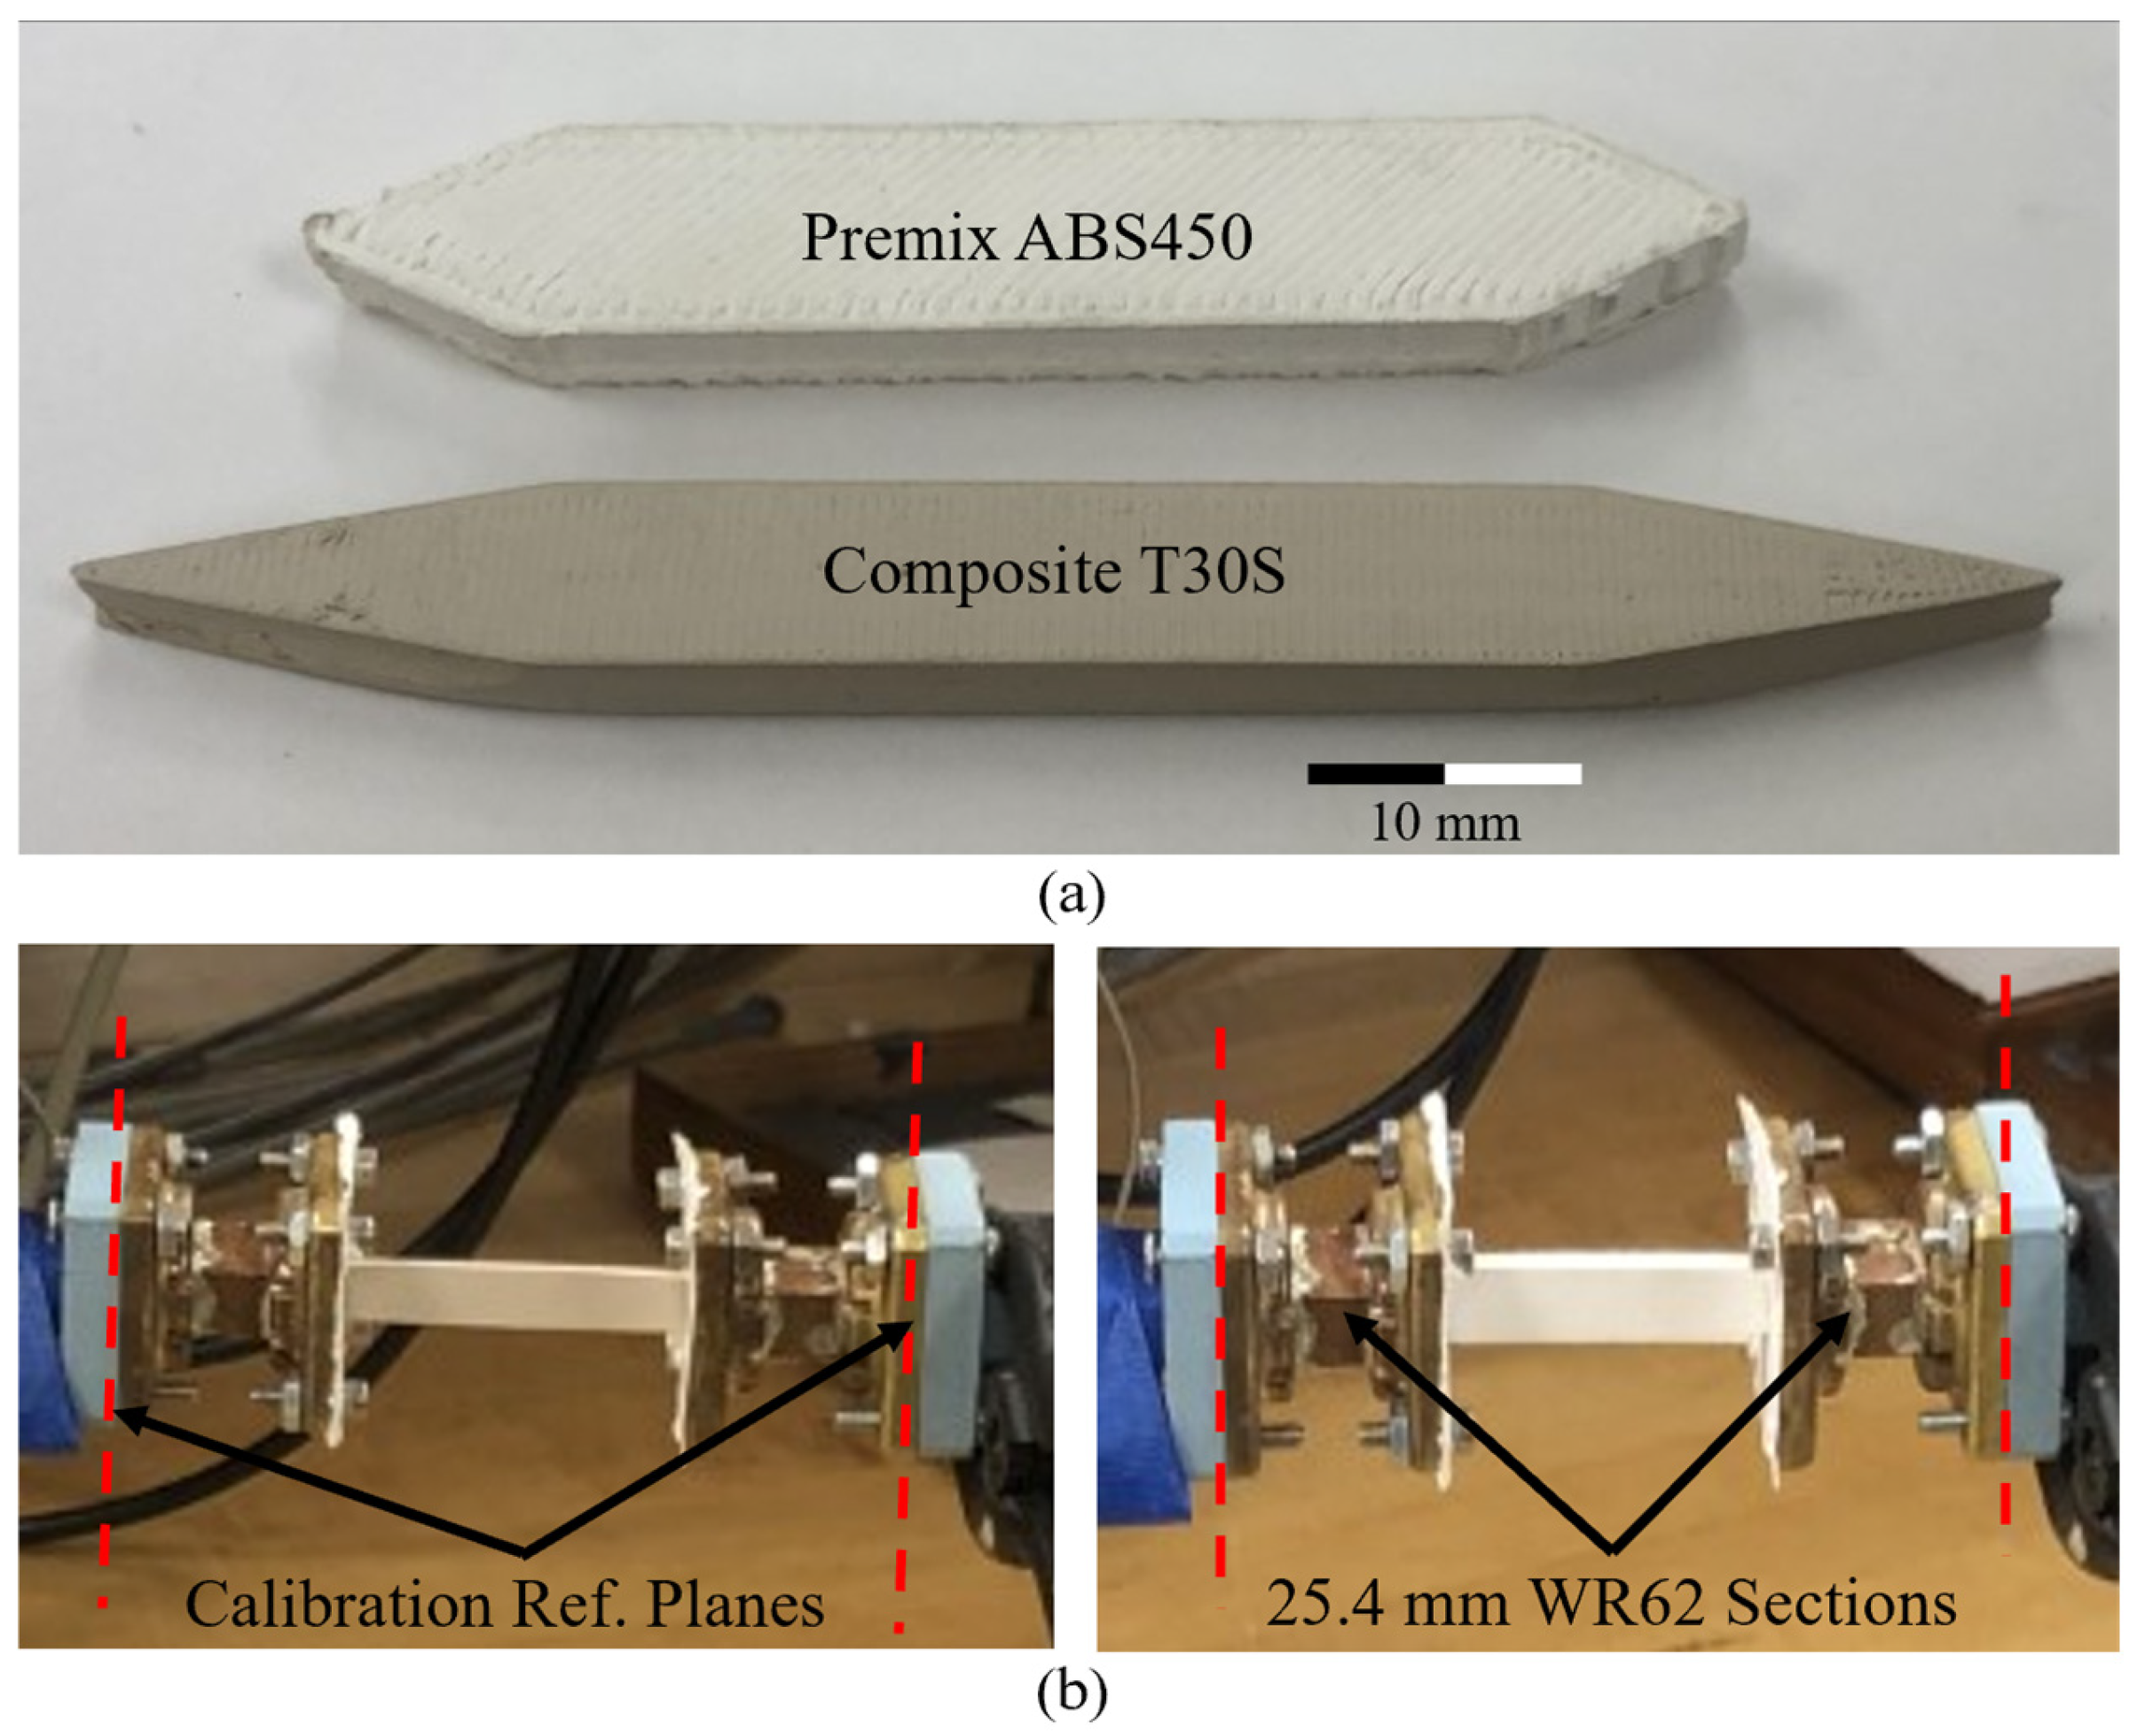
In this work, the frequency responses of two Ku-band dielectric waveguides (DWGs), 3D-printed from an in-house developed composite T30S ( ε r   of 5.47, tan δ d of 0.002) and commercially available Premix ABS450 ( ε r   of 4.5, tan δ d of 0.003) materials, have been characterized and compared. The two 3D-printed DWGs are shown in Figure 7a. Short-short-load-thru (SSLT) waveguide calibration was performed on waveguide ports, and then WR-62 extenders were added to keep calibration planes unaffected by the tapered sections of DWGs, which can be seen by the close-up view in Figure 7b.
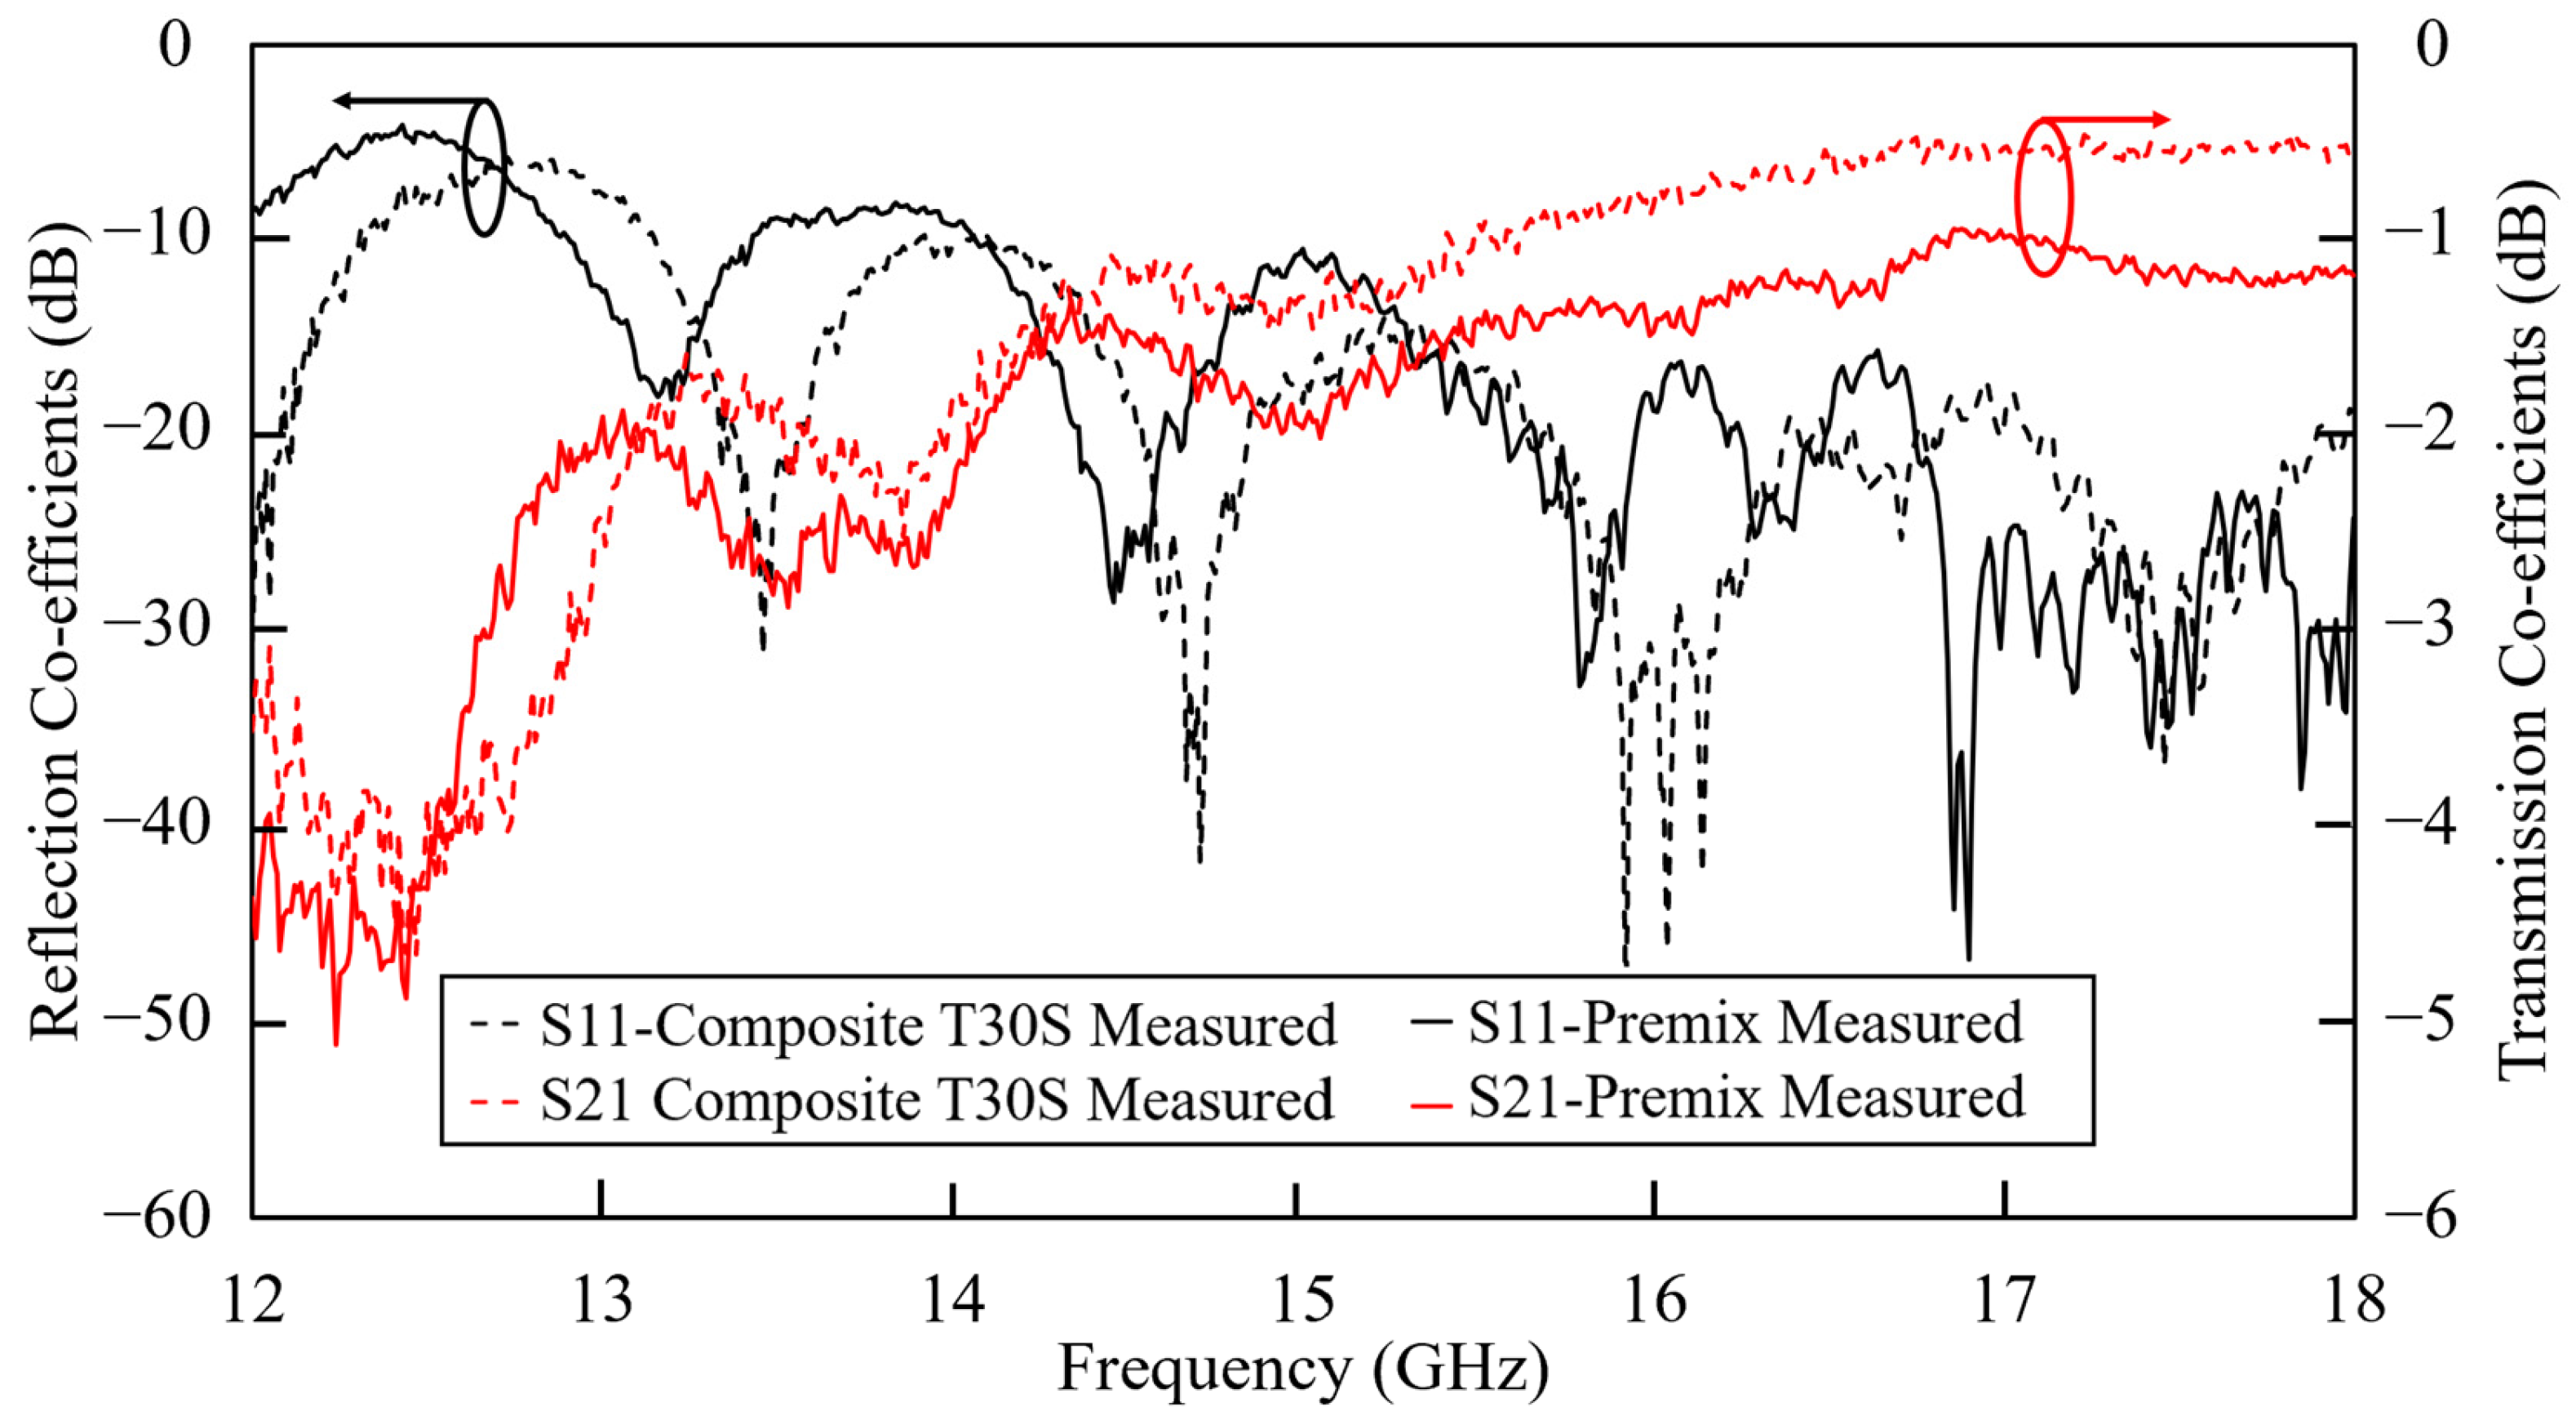
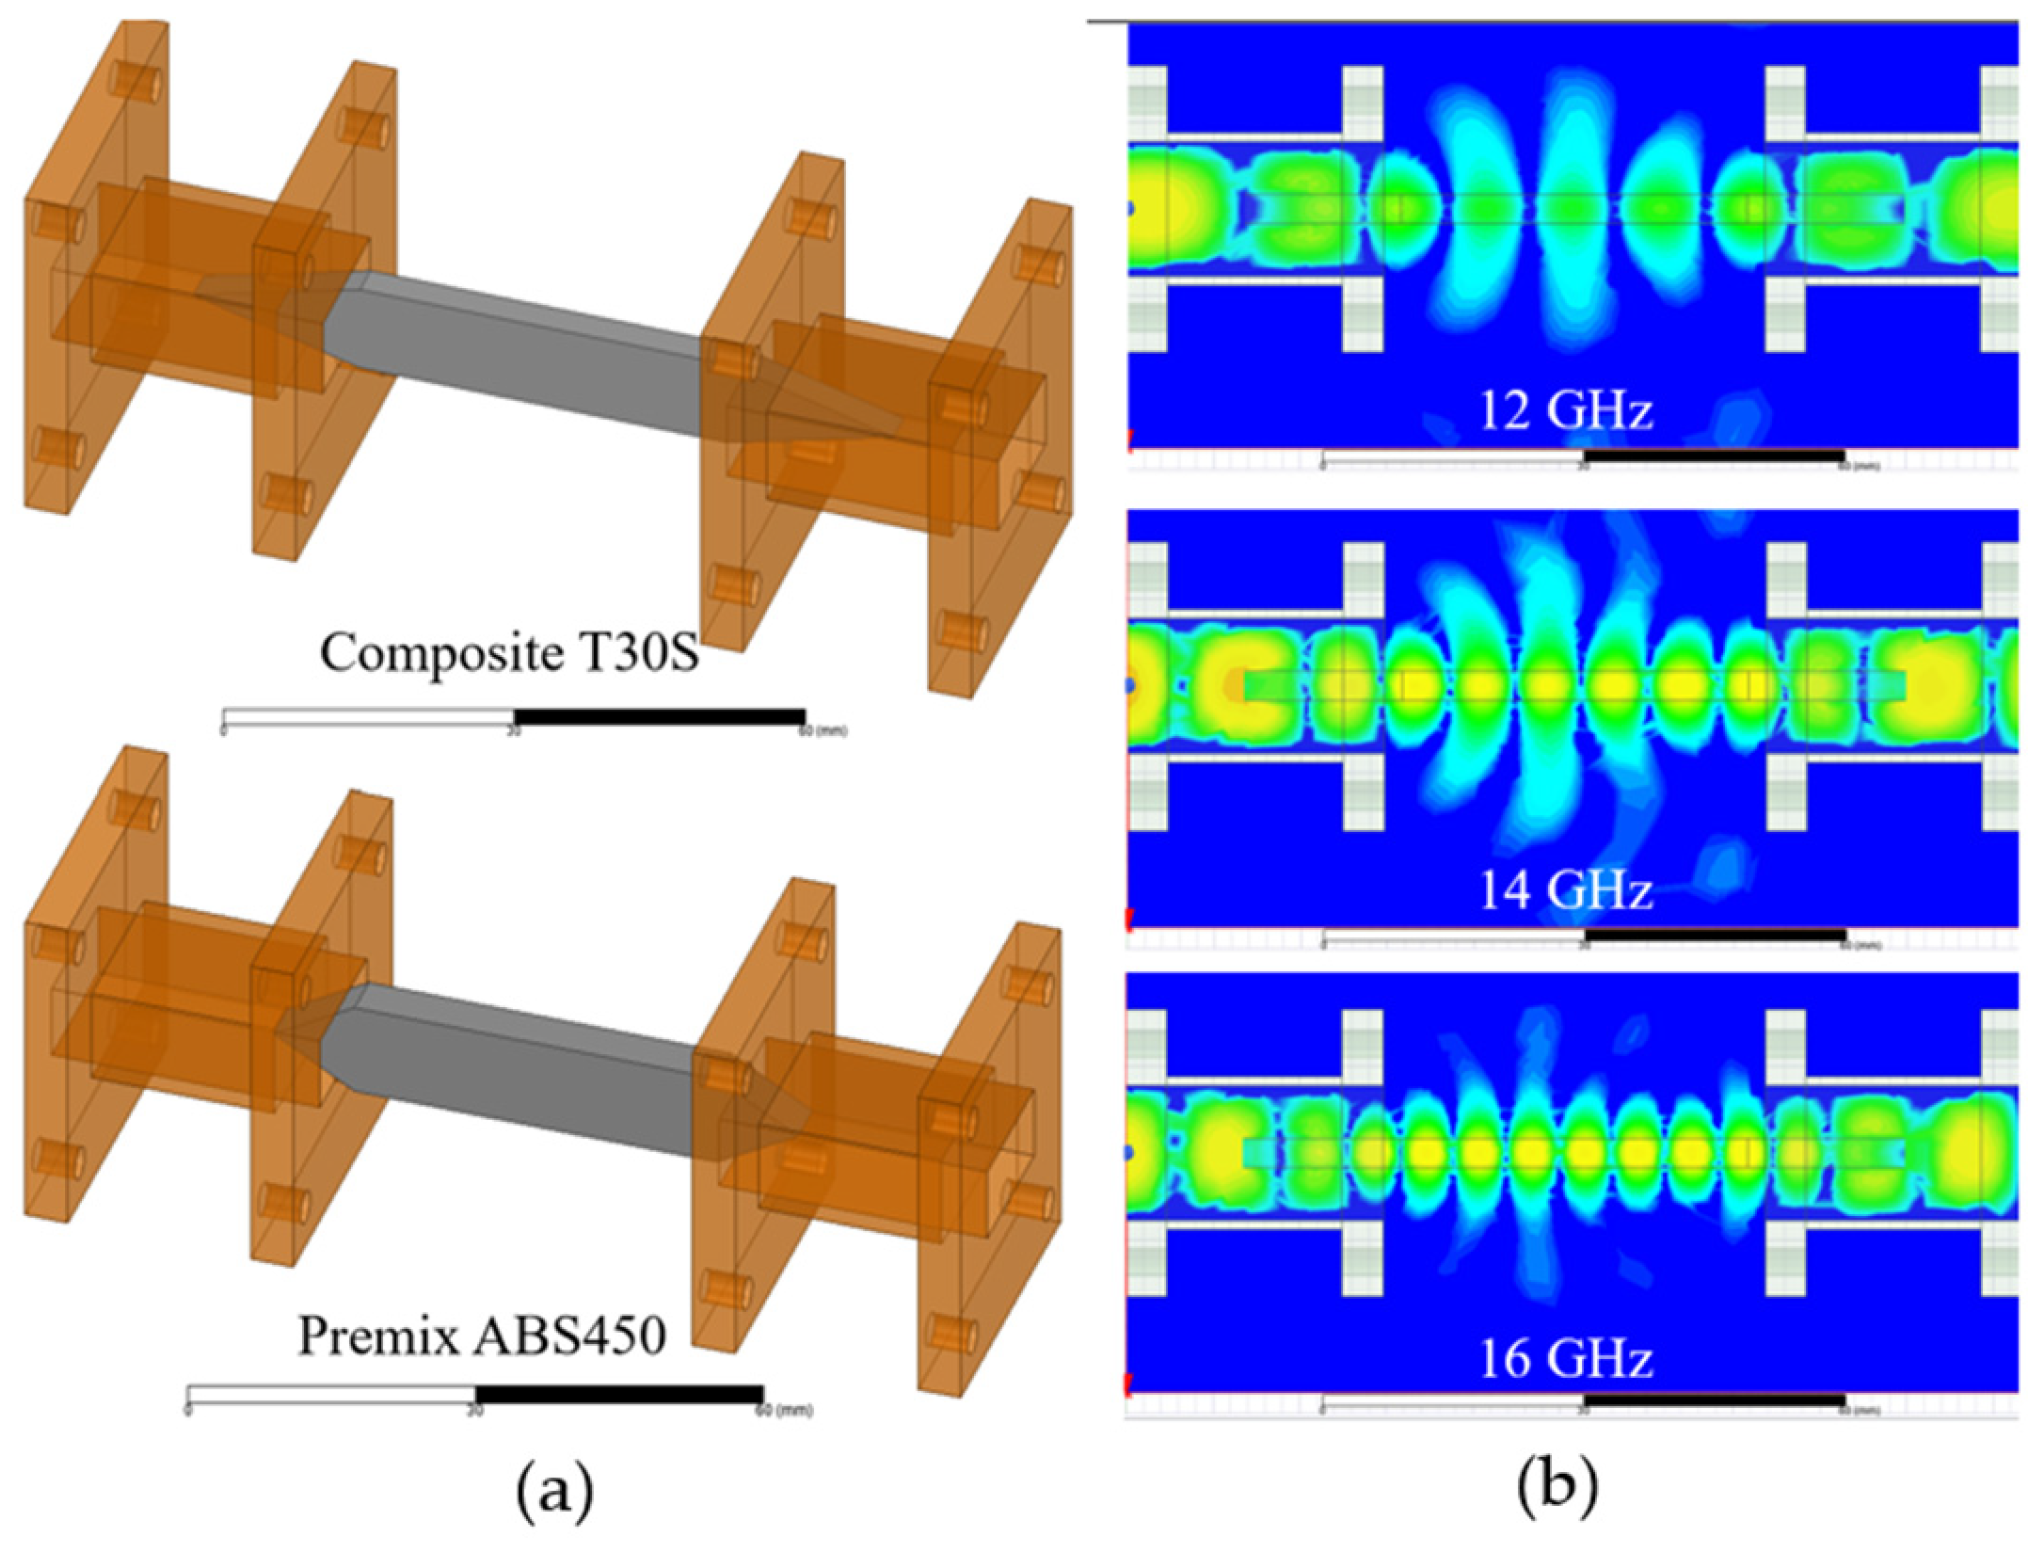
Measured scattering-parameter (s-parameters) frequency characteristics are plotted in Figure 8. A minimum insertion loss of 0.46 dB at 17.23 GHz has been achieved for the FDM 3D-printed DWG made of composite T30S, whereas an insertion loss of 0.95 dB at 16.88 GHz has been obtained by a reference DWG FDM 3D-printed by using a commercially available Premix ABS450 filament. The discrepancies in DWG insertion losses increase with frequency. As the frequency increases, a larger part of the propagated electromagnetic wave energy is concentrated inside DWG, as can be seen in Figure 9b. Thus, the dielectric loss of FDM-printed composite material has an even larger impact on the loss of the dielectric waveguides (DWGs) at higher frequencies.
Figure 9a illustrates geometries of the WR-62 waveguide-fed DWG that are used for Ansys HFSS 23.R1 3D EM simulation. The effect of WR-62 metal waveguide extenders was considered while extracting the effective dielectric permittivity and loss properties of FDM 3D-printed DWGs. Figure 9b depicts the top view e-field distribution at different in-band frequencies for the DWG made of in-house prepared T30S composite filament based on the new composite preparation techniques, which has a 30% v/v volume fraction of TiO2 particle fillers calcinated and coated with surfactant.
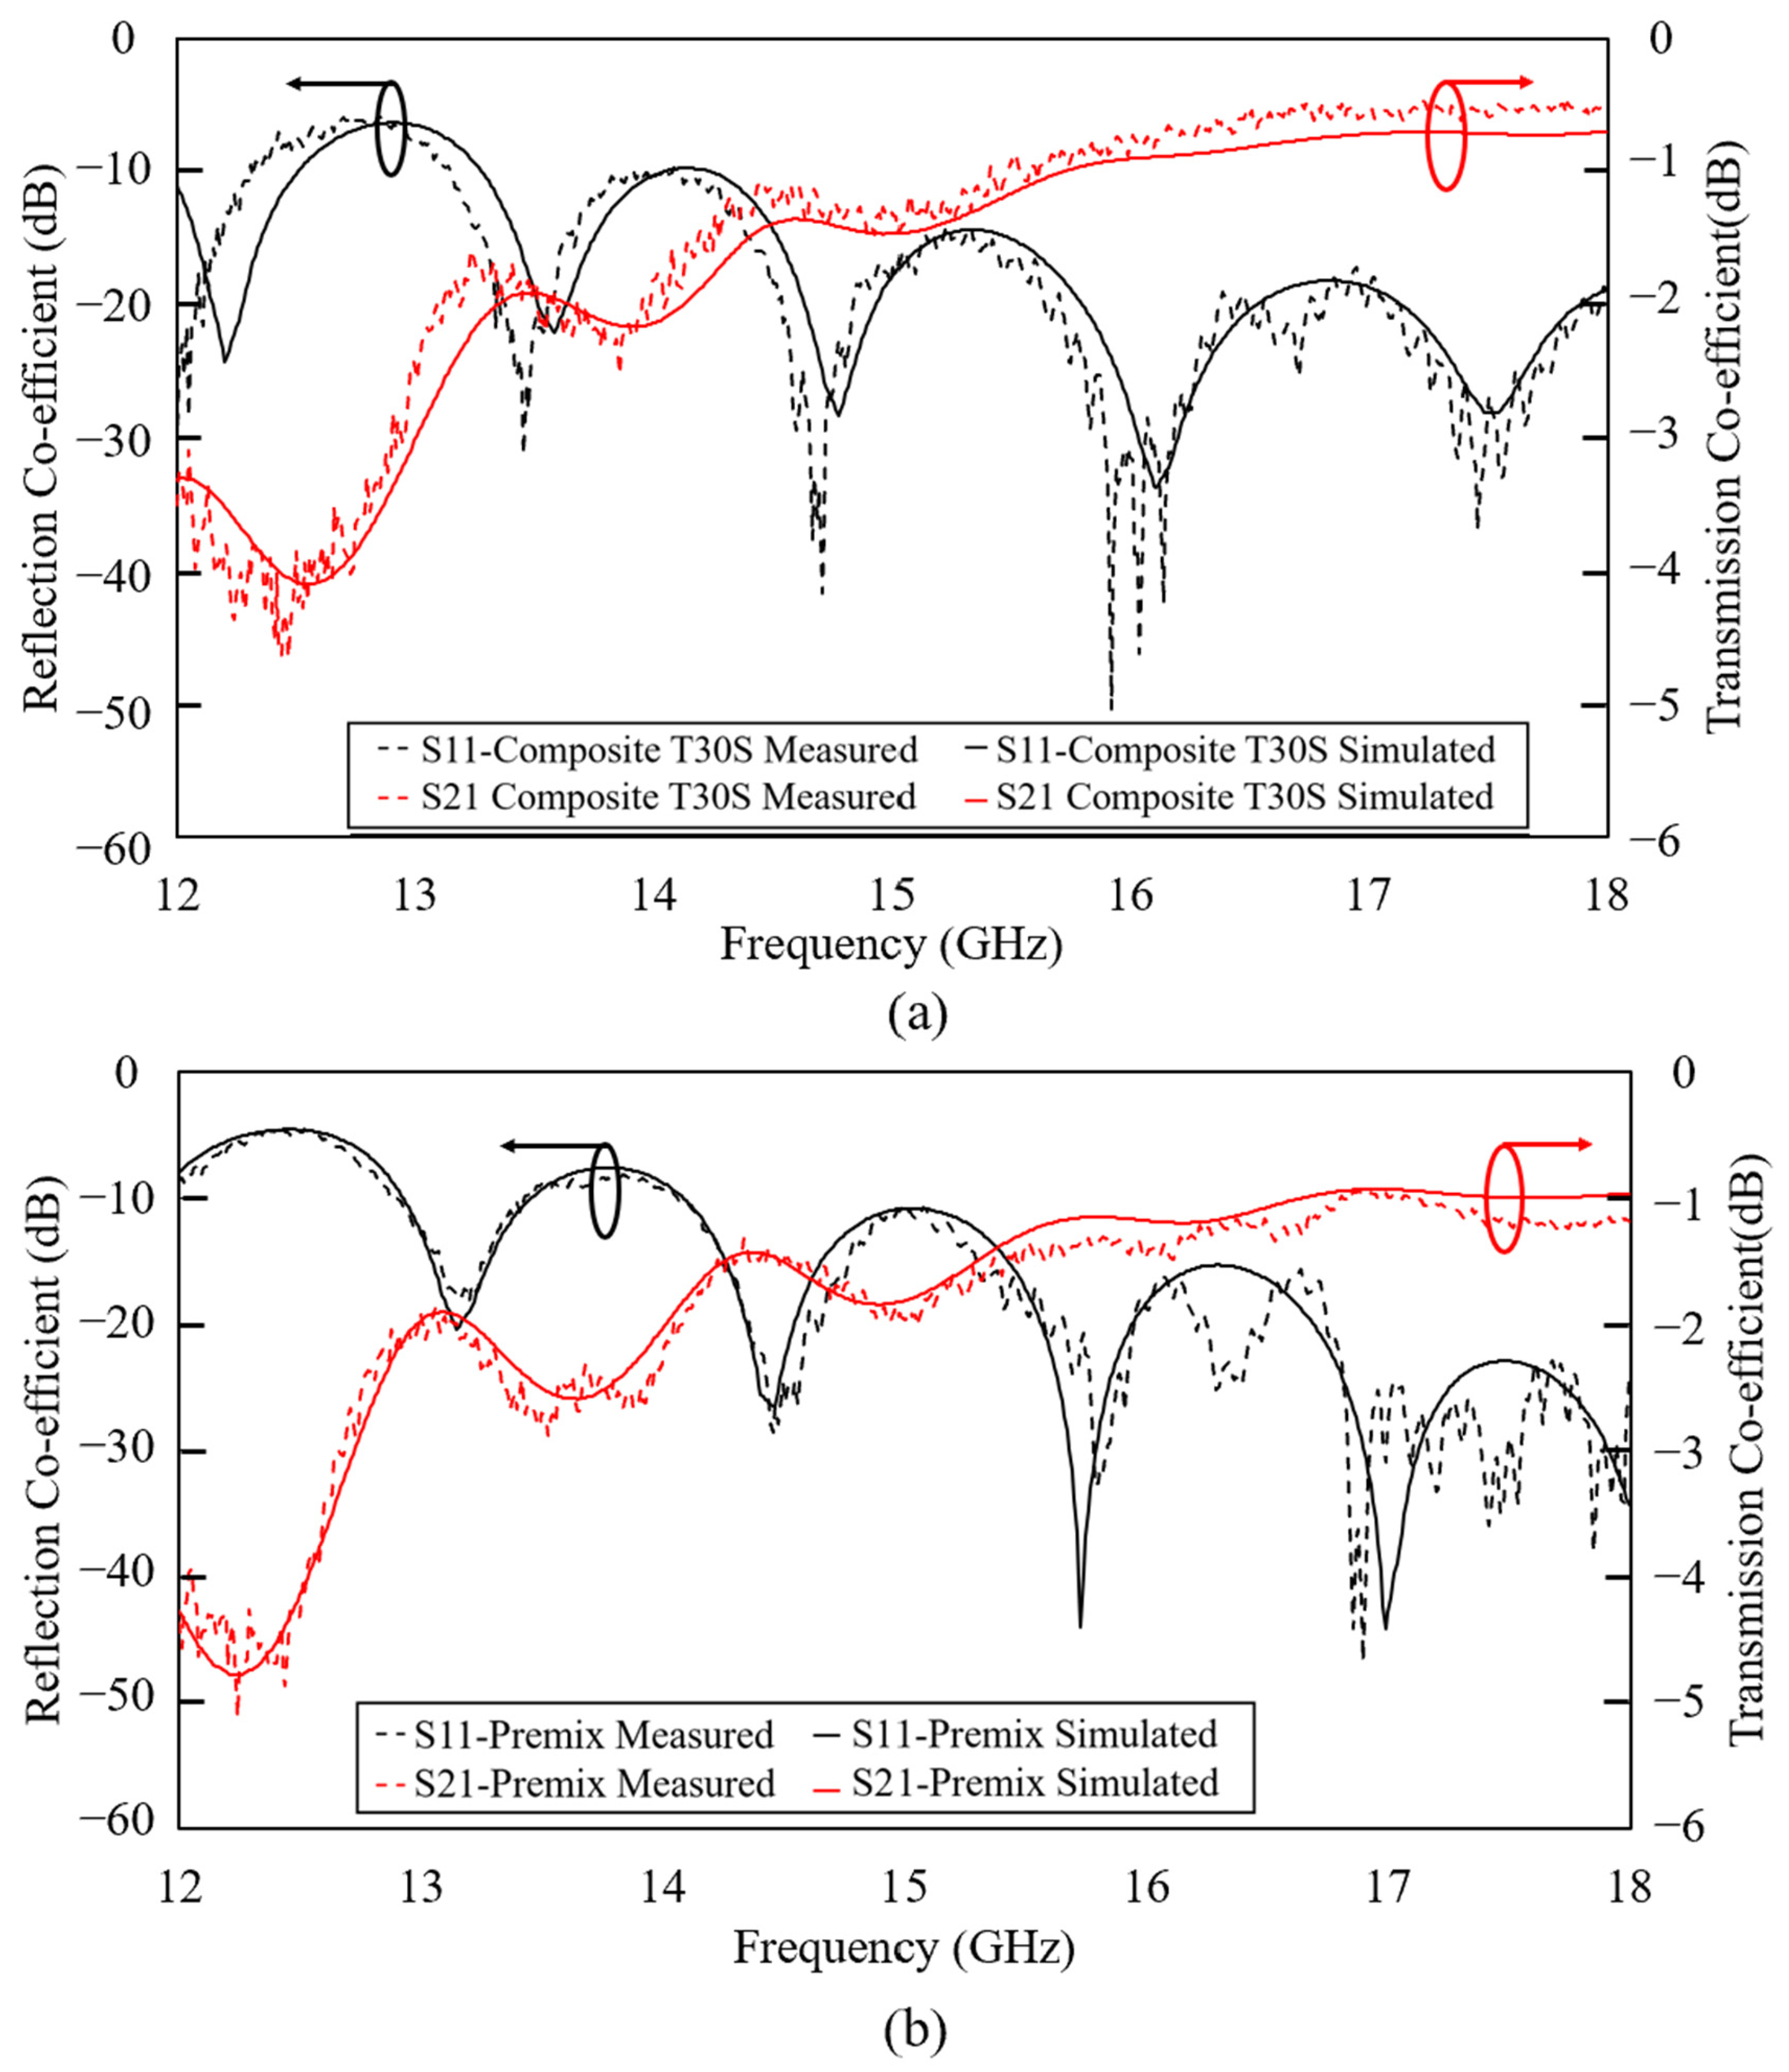
Measured s-parameters are compared to simulated results based on different material properties. The effective dielectric permittivity and loss properties can be determined by rigorously comparing the measured and 3D EM-simulated frequency responses. The magnitude and phase of the s-parameters are matched to extract dielectric loss tangent and permittivity properties, respectively. Figure 10 shows a comparison of measured and simulated characteristics for both DWGs. The extracted permittivity and dielectric loss tangent for DWG made of premix ABS450 are 4.6 and 0.0042, respectively, which agree closely with data sheet values. Similarly, 5.55 and 0.0009 are extracted as permittivity and loss tangent for a DWG printed by the in-house prepared T30S composite, respectively.

4. Conclusions

In this work, the coefficient of thermal expansion (CTE) of the high-k and low-loss, in-house developed composites has been measured. The lowest CTE can be achieved by using fused deposition modelling 3D printing of ceramic–thermoplastic composite. The comparison of simulation and measurement has been performed to extract effective dielectric and loss properties. Surfactant-assisted high-energy ball-milling is performed to downsize particles and modify their surface for better adhesion and improved interfacial properties with the organic matrix. Both filler volume fraction and surfactant content are varied to observe their effects on CTE and thermal stability of the composite. CTE has been measured using a TMA Q400 thermomechanical analyzer in this work. For the titania filler, the volume fraction of filler was considered to be 30% v/v, 40% v/v, and 50% v/v with 5% volume fraction of added surfactant during the high-energy ball-milling process; the average CTE from 40 to 120 °C was 45.61 ppm/°C, 40.83 ppm/°C, and 35.93 ppm/°C, respectively. Furthermore, without the added surfactant, the average CTE from 40–120 °C with the same filler volume fraction varied from 30 to 50% v/v and was slightly increased, which is 46.24 ppm/°C, 41.43 ppm/°C, and 36.83 ppm/°C. The homogeneous distribution of filler particles has been qualitatively confirmed by SEM. To prove the feasibility of employing developed composites to 3D print functional RF and microwave devices, one of the in-house developed composites (T30S) was used to FDM 3D print dielectric waveguides (DWGs) operating in Ku-band (12–18 GHz). Specimens fabricated via 3D printing using the in-house developed composite T30S (εr = 5.47) and premix ABS450 (εr = 4.5) materials have been systematically characterized and compared. A minimum insertion loss of 0.46 dB at 17.23 GHz has been achieved for the FDM-printed DWG made of composite T30S, whereas an insertion loss of 0.95 dB at 16.88 GHz is obtained by a reference DWG that is FDM printed by using a commercially available Premix ABS450 filament. Furthermore, the effective dielectric and loss properties of both DWGs can be determined by rigorously comparing the measured and 3D EM-simulated frequency responses. The extracted permittivity and dielectric loss tangent for DWG made of premix ABS450 are 4.6 and 0.0042, respectively, which match with datasheet values. Similarly, 5.55 and 0.0009 are extracted as permittivity and loss tangent for a DWG printed using the T30S composite, respectively.

5. Patents

Jing Wang, Vishvajitsinh Kosamiya. 2024. U.S. Patent 12,173,127 B2, December 2024.

Author Contributions

Conceptualization, J.W. and V.K.; methodology, J.W. and V.K.; software, V.K., I.N.G. and J.O.; validation, J.D.C., J.O., L.L. and V.K.; formal analysis, V.K., J.D.C., I.N.G., J.O., and L.L.; investigation, V.K. and L.L.; resources, J.W. and I.S.; data curation, V.K.; writing—original draft preparation, V.K. and L.L.; writing—review and editing, V.K. and L.L.; visualization, V.K., I.N.G., J.D.C. and L.L.; supervision, J.W. and I.S.; project administration, J.W. and I.S.; funding acquisition, J.W. All authors have read and agreed to the published version of the manuscript.

Funding

This research was partially sponsored by three research grants from the National Science Foundation (ECCS 1711790 and ECCS 2329207) and the U.S. Army Medical Research Acquisition Activity (USAMRAA) (HT9425-23-1-0502). IS acknowledges support from USF start-up funds, as well as the 2024 USF IDRA award for the gas sorption studies.

Data Availability Statement

The original contributions presented in this study are included in the article. Further inquiries can be directed to the corresponding authors.

Acknowledgments

All the device microfabrication processes and metrology tests were performed at the Nanotechnology Research and Education Center (NREC) at the University of South Florida, and, in particular, Robert Tufts, Yusuf Emirov, and Richard Everly have been helpful in providing training and technical support. The authors would also like to thank Rohde & Schwarz USA, Inc., for their generous donation of equipment.

Conflicts of Interest

Author Juan D. Castro was employed by the company Synopsys, Inc. and author Julia Oppenheimer was employed by ABB. The remaining authors declare that the research was conducted in the absence of any commercial or financial relationships that could be construed as a potential conflict of interest.

References

  1. Castro, J.; Rojas, E.; Weller, T.; Wang, J. High-Permittivity and Low-Loss Electromagnetic Composites Based on Co-fired Ba0.55Sr0.45TiO3 or MgCaTiO2 Microfillers for Additive Manufacturing and Their Application to 3-D Printed K-Band Antennas. J. Microelectron. Electron. Packag. 2016, 13, 102–112. [Google Scholar] [CrossRef]
  2. Castro, J.; Rojas-Nastrucci, E.A.; Ross, A.; Weller, T.M.; Wang, J. Fabrication, Modeling, and Application of Ceramic-Thermoplastic Composites for Fused Deposition Modeling of Microwave Components. IEEE Trans. Microw. Theory Technol. 2017, 65, 2073–2084. [Google Scholar] [CrossRef]
  3. Castro, J.D.D. Engineered Nanocomposite Materials for Microwave/Millimeter-Wave Applications of Fused Deposition Modeling. Ph.D. Thesis, University of South Florida, Tampa, FL, USA, 2017. [Google Scholar]
  4. Church, K.H.; Crane, N.B.; Deffenbaugh, P.I.; Ketterl, T.P.; Neff, C.G.; Nesbitt, P.B.; Nussbaum, J.T.; Perkowski, C.; Tsang, H.; Castro, J.; et al. Multimaterial and Multilayer Direct Digital Manufacturing of 3-D Structural Microwave Electronics. Proc. IEEE 2017, 105, 688–701. [Google Scholar] [CrossRef]
  5. Czarny, R.; Hoang, T.Q.V.T.Q.; Loiseaux, B.; Bellomonte, G.; Lebourgeois, R.; Leuliet, A.; Qassym, L.; Galindo, C.; Heintz, J.M.; Penin, N.; et al. High Permittivity, Low Loss, and Printable Thermoplastic Composite Material for RF and Microwave Applications. In Proceedings of the 2018 IEEE Conference on Antenna Measurements & Applications (CAMA), Vasteras, Sweden, 3–6 September 2018; pp. 1–4. [Google Scholar] [CrossRef]
  6. Mitchell, A.; Lafont, U.; Hołyńska, M.; Semprimoschnig, C. Additive manufacturing—A review of 4D printing and future applications. Addit. Manuf. 2018, 24, 606–626. [Google Scholar] [CrossRef]
  7. Moritz, T.; Maleksaeedi, S. 4—Additive manufacturing of ceramic components. In Additive Manufacturing; Zhang, J., Jung, Y.-G., Eds.; Butterworth-Heinemann: Amsterdam, The Netherlands, 2018; pp. 105–161. [Google Scholar]
  8. Song, S.Y.; Park, M.S.; Lee, J.W.; Yun, J.S. A Study on the Rheological and Mechanical Properties of Photo-Curable Ceramic/Polymer Composites with Different Silane Coupling Agents for SLA 3D Printing Technology. Nanomaterials 2018, 8, 93. [Google Scholar] [CrossRef]
  9. Zenou, M.; Grainger, L. 3—Additive manufacturing of metallic materials. In Additive Manufacturing; Zhang, J., Jung, Y.-G., Eds.; Butterworth-Heinemann: Amsterdam, The Netherlands, 2018; pp. 53–103. [Google Scholar]
  10. Zhang, Y.; Jarosinski, W.; Jung, Y.-G.; Zhang, J. 2—Additive manufacturing processes and equipment. In Additive Manufacturing; Zhang, J., Jung, Y.-G., Eds.; Butterworth-Heinemann: Amsterdam, The Netherlands, 2018; pp. 39–51. [Google Scholar]
  11. Zhao, S.; Zhao, Z.; Yang, Z.; Ke, L.; Kitipornchai, S.; Yang, J. Functionally graded graphene reinforced composite structures: A review. Eng. Struct. 2020, 210, 110339. [Google Scholar] [CrossRef]
  12. Lugo, D.C.; Wang, J.; Weller, T.M. Analytical and Experimental Study of Multilayer Dielectric Rod Waveguides. IEEE Trans. Microw. Theory Technol. 2021, 69, 2088–2097. [Google Scholar] [CrossRef]
  13. Polenz, S.; Kunz, W.; Braun, B.; Franke, A.; Lopez, E.; Bruckner, F.; Leyens, C. Development of a System for Additive Manufacturing of Ceramic Matrix Composite Structures Using Laser Technology. Materials 2021, 14, 3248. [Google Scholar] [CrossRef]
  14. Liu, R.; Braun, J.; Mitchell, G.; Wang, J.; Mumcu, G. Packaging of a Beamforming IC by Laser Enhanced Direct Print Additive Manufacturing (LE-DPAM). In Proceedings of the 2022 3rd URSI Atlantic and Asia Pacific Radio Science Meeting (AT-AP-RASC), Gran Canaria, Spain, 30 May–4 June 2022; pp. 1–3. [Google Scholar] [CrossRef]
  15. Liu, R.; Mumcu, G.; Wang, J. Towards Additive Manufacturing Based Packaging of Mm-Wave Antenna Arrays and Beamformer ICs. In Proceedings of the 2024 IEEE Wireless and Microwave Technology Conference (WAMICON), Clearwater, FL, USA, 15–16 April 2024; pp. 1–3. [Google Scholar] [CrossRef]
  16. Firat, O.F.; Wang, J.; Weller, T. Characterization of Additively Manufactured Suspended Finite Ground CPW Interconnects Enhanced by Femtosecond Laser Micromachining. IEEE Trans. Compon. Packag. Manuf. Technol. 2024, 14, 965–972. [Google Scholar] [CrossRef]
  17. Chen, H.; Guo, L.; Zhu, W.; Li, C. Recent Advances in Multi-Material 3D Printing of Functional Ceramic Devices. Polymers 2022, 14, 4635. [Google Scholar] [CrossRef]
  18. Akbari, S.; Kostov, K.; Brinkfeldt, K.; Adolfsson, E.; Lim, J.K.; Andersson, D.; Bakowski, M.; Wang, Q.; Salter, M. Ceramic Additive Manufacturing Potential for Power Electronics Packaging. IEEE Trans. Compon. Packag. Manuf. Technol. 2022, 12, 1857–1866. [Google Scholar] [CrossRef]
  19. Ryu, K.; Kim, J.; Choi, J.; Kim, U. The 3D Printing Behavior of Photocurable Ceramic/Polymer Composite Slurries Prepared with Different Particle Sizes. Nanomaterials 2022, 12, 2631. [Google Scholar] [CrossRef]
  20. Przybyła, S.; Kwiatkowski, M.; Kwiatkowski, M.; Hebda, M. Optimization of Ceramic Paste Composition for 3D Printing via Robocasting. Materials 2024, 17, 4560. [Google Scholar] [CrossRef] [PubMed]
  21. Kattel, B.; Ayan, U.; Mohoppu, M.; Villacorta, B.; Hutchcraft, W.E. Enhancing Permittivity of 3D Printing Filaments via Nanocompounding for Electromagnetic Applications. In Proceedings of the SoutheastCon 2024, Atlanta, GA, USA, 15–24 March 2024; pp. 1016–1021. [Google Scholar] [CrossRef]
  22. Kosamiya, V.; Wang, J. Composite Feedstock Filaments for Fused Deposition Modeling (FDM) of Microwave Interconnects. IEEE Trans. Compon. Packag. Manuf. Technol. 2023, 13, 249–256. [Google Scholar] [CrossRef]
  23. Vo, H.T.; Shi, F.G. Towards model-based engineering of optoelectronic packaging materials: Dielectric constant modeling. Microelectron. J. 2002, 33, 409–415. [Google Scholar] [CrossRef]
  24. Vo, H.T.; Todd, M.; Shi, F.G.; Shapiro, A.A.; Edwards, M. Towards model-based engineering of underfill materials: CTE modeling. Microelectron. J. 2001, 32, 331–338. [Google Scholar] [CrossRef]
  25. Ahmed, H.M.; Abdel-Gawad, N.M.; Afifi, W.A.; Mansour, D.-E.A.; Lehtonen, M.; Darwish, M.M. A novel polyester varnish nanocomposites for electrical machines with improved thermal and dielectric properties using functionalized TiO2 nanoparticles. Materials 2023, 16, 6478. [Google Scholar] [CrossRef]
  26. Ashokbabu, A.; Thomas, P. Dielectric and Thermal Properties of PTFE/CaCu3Ti4O12(CCTO) Nanocomposites. In Proceedings of the 2019 International Conference on High Voltage Engineering and Technology (ICHVET), Hyderabad, India, 7–8 February 2019; pp. 1–4. [Google Scholar] [CrossRef]
  27. Filaments. Available online: https://zetamix.fr/categorie-produit/filaments/ (accessed on 31 October 2025).
  28. Carias, V.; Thompson, J.; Myers, P.D.; Kumar, P.; Racz, L.M.; Toomey, R.; Wang, J. Development of Mold Compounds with Ultralow Coefficient of Thermal Expansion and High Glass Transition Temperature for Fan-Out Wafer-Level Packaging. IEEE Trans. Compon. Packag. Manuf. Technol. 2015, 5, 921–929. [Google Scholar] [CrossRef]
  29. Karunaratne, M.S.A.; Kyaw, S.; Jones, A.; Morrell, R.; Thomson, R.C. Modelling the coefficient of thermal expansion in Ni-based superalloys and bond coatings. J. Mater. Sci. 2016, 51, 4213–4226. [Google Scholar] [CrossRef]
  30. Cazan, C.; Enesca, A.; Andronic, L. Synergic Effect of TiO2 Filler on the Mechanical Properties of Polymer Nanocomposites. Polymers 2021, 13, 2017. [Google Scholar] [CrossRef]
  31. Jeon, H.; Yoon, C.; Song, Y.-G.; Han, J.; Kwon, S.; Kim, S.; Chang, I.; Lee, K. Reducing the Coefficient of Thermal Expansion of Polyimide Films in Microelectronics Processing Using ZnS Particles at Low Concentrations. ACS Appl. Nano Mater. 2018, 1, 1076–1082. [Google Scholar] [CrossRef]
  32. Ou, J.; Chen, Y.; Zhao, J.; Luo, S.; Wong, K.W.; Ng, K.M. Nano-Sized Calcium Copper Titanate for the Fabrication of High Dielectric Constant Functional Ceramic-Polymer Composites. Polymers 2022, 14, 4328. [Google Scholar] [CrossRef] [PubMed]
  33. Sahu, M.; Satapathy, A. Processing and characterization of TiO2 filled polymer composites. Mater. Today Proc. 2021, 44, 4945–4951. [Google Scholar] [CrossRef]
  34. Kurimoto, M.; Ozaki, H.; Sawada, T.; Kato, T.; Funabashi, T.; Suzuoki, Y. Filling ratio control of TiO2 and SiO2 in epoxy composites for permittivity-graded insulator with low coefficient of thermal expansion. IEEE Trans. Dielectr. Electr. Insul. 2018, 25, 1112–1120. [Google Scholar] [CrossRef]
  35. Shah, M.; Ullah, A.; Azher, K.; Ur Rehman, A.; Akturk, N.; Juan, W.; Tüfekci, C.S.; Salamci, M.U. The Influence of Nanoparticle Dispersions on Mechanical and Thermal Properties of Polymer Nanocomposites Using SLA 3D Printing. Crystals 2023, 13, 285. [Google Scholar] [CrossRef]
  36. Chao, S.; Liaw, Y.; Chou, J.-H. The Effects of Filler Shape, Type, and Size on the Properties of Encapsulation Molding Components. Electronics 2021, 10, 98. [Google Scholar] [CrossRef]
  37. Keshyagol, K.; Hiremath, S.; Vishwanatha, H.M.; Rao, P.K.; Hiremath, P.; Naik, N. Analysis of Polymer-Ceramic Composites Performance on Electrical and Mechanical Properties through Finite Element and Empirical Models. Materials 2024, 17, 3837. [Google Scholar] [CrossRef]
  38. Rodzi, M.L.M.; Ismail, M.F.; Minhat, M. Applicability of Rule of Mixtures to Estimate Effective Properties of Nanocomposite Materials. In Proceedings of International Conference of Aerospace and Mechanical Engineering 2019; Rajendran, P., Mazlan, N.M., Rahman, A.A.A., Suhadis, N.M., Razak, N.A., Abidin, M.S.Z., Eds.; Springer Singapore: Singapore, 2020; pp. 191–205. [Google Scholar]
  39. Kosamiya, V.; Wang, J. High-k and Low-Loss Dielectric Composite Feedstock Filaments, Tailored for Additive Manufacturing of Microwave Devices. In Proceedings of the 2020 IEEE/MTT-S International Microwave Symposium (IMS), Los Angeles, CA, USA, 4–6 August 2020; pp. 928–931. [Google Scholar] [CrossRef]
  40. Savijarvi, A.M.; Paajanen, M.; Saarimaki, E.; Minkkinen, H. Novel heat durable electromechanical films: Cellular film making from cyclic olefin polymers. In Proceedings of the 2005 12th International Symposium on Electrets, Salvador, Brazil, 11–14 September 2005; pp. 75–78. [Google Scholar] [CrossRef]
  41. Wang, H.; Wang, X.; Wadsworth, M.; Ahmed, M.F.; Liu, Z.; Zeng, C. Design, Fabrication, Structure Optimization and Pressure Sensing Demonstration of COC Piezoelectret Sensor and Sensor Array. Micromachines 2022, 13, 1177. [Google Scholar] [CrossRef]
  42. Beccaria, M.; Massaccesi, A.; Lumia, M.; Addamo, G.; Freni, A.; Pirinoli, P. Ka-Band Reflectarray with Cylindrical Dielectric Unit Cells: Optimized Additive Manufacturing and High-Permittivity Material Characterization. Sensors 2025, 25, 5480. [Google Scholar] [CrossRef]
  43. González-Benito, J.; Castillo, E.; Caldito, J.F. Coefficient of thermal expansion of TiO2 filled EVA based nanocomposites. A new insight about the influence of filler particle size in composites. Eur. Polym. J. 2013, 49, 1747–1752. [Google Scholar] [CrossRef]
  44. Chen, J.; Li, B.; Zhang, S.; Li, H. Effect of the Presence of a Silane Coupling Agent on Reaction Kinetics of Cationic Thermopolymerization of Epoxy Resin Adhesive. Coatings 2023, 13, 1782. [Google Scholar] [CrossRef]
  45. Heo, G.-Y.; Park, S.-J. Effect of coupling agents on thermal, flow, and adhesion properties of epoxy/silica compounds for capillary underfill applications. Powder Technol. 2012, 230, 145–150. [Google Scholar] [CrossRef]
  46. Sasikala, T.S.; Raman, S.; Mohanan, P.; Pavithran, C.; Sebastian, M.T. Effect of silane coupling agent on the dielectric and thermal properties of DGEBA-forsterite composites. J. Polym. Res. 2011, 18, 811–819. [Google Scholar] [CrossRef]
  47. Peng, L.; Zhang, R.; Fan, Y.; Yang, Y.; Fu, K.; Li, G.; Sun, R.; Zhu, P. A mechanical model for predicting the thermal expansion behavior of spherical particle reinforced epoxy composites. Polym. Compos. 2024, 45, 5256–5266. [Google Scholar] [CrossRef]
  48. Ren, Z.; Wang, Q.; Fang, R.; Huang, Z.; Shi, X. Development of a Predictive Model for the Thermal Expansion Coefficient of Elastic Disordered Microporous Metal Rubber Based on Virtual Manufacturing Technology. Chin. J. Mech. Eng. 2025, 38, 61. [Google Scholar] [CrossRef]
  49. Taibi, N.; Belabed, Z.; Boucham, B.; Benguediab, M.; Tounsi, A.; Khedher, K.M.; Salem, M.A. On the Thermomechanical Behavior of Laminated Composite Plates using different Micromechanical-based Models for Coefficients of Thermal Expansion (CTE). J. Appl. Comput. Mech. 2024, 10, 224–244. [Google Scholar] [CrossRef]
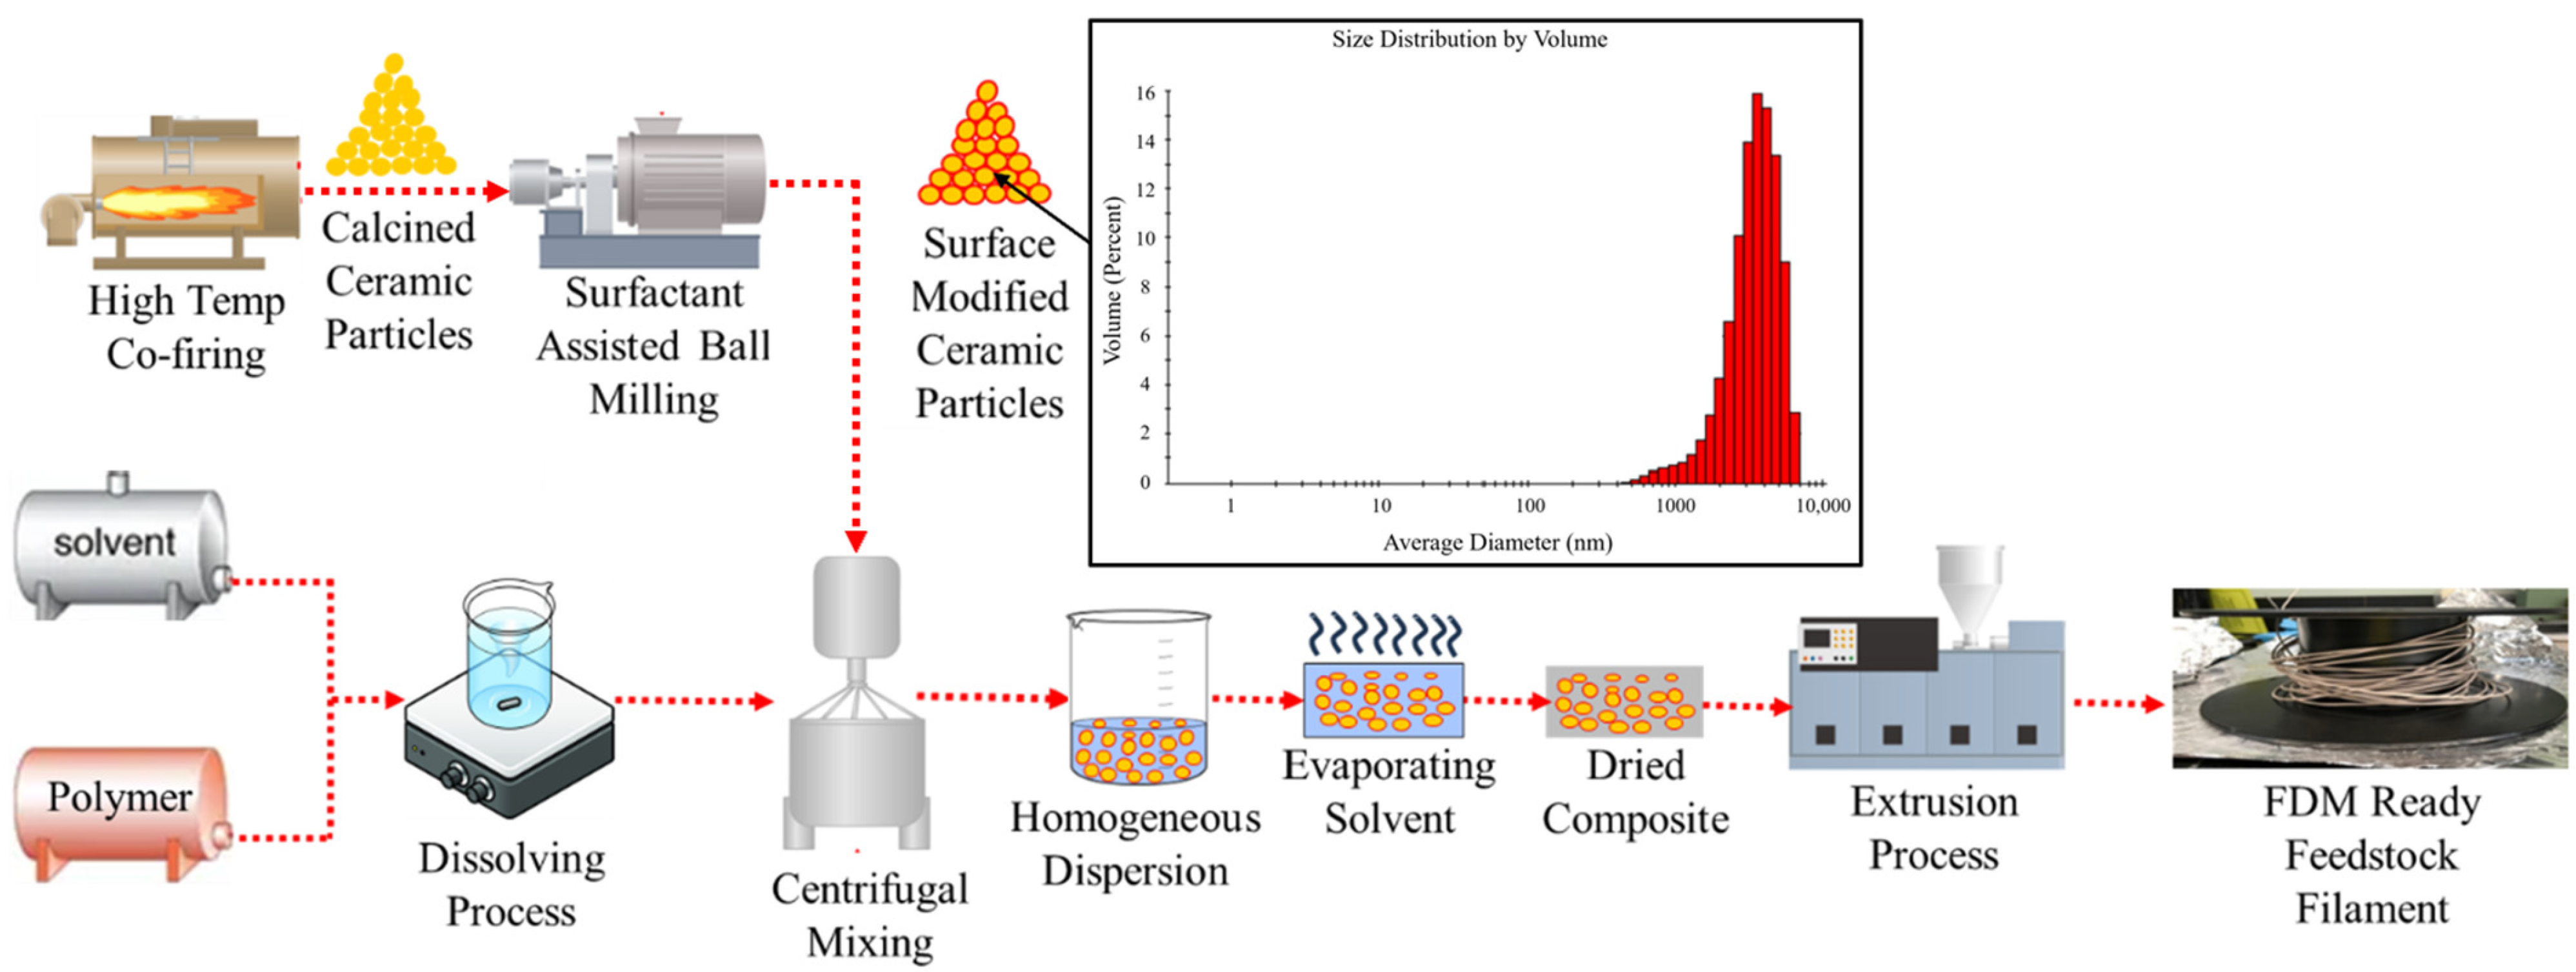
Figure 1. Conceptual illustration of the ceramic–polymer composite material preparation process. The inset image represents particle size distribution for TiO2 particles after high-temperature calcination and surfactant-assisted ball-milling processes.
Crystals 15 00963 g001
Figure 2. Tested CTEs vs. model predictions by rules of mixture (ROM) and Vo-Shi model.
Crystals 15 00963 g002
Figure 3. SEM images of six types of ceramic–polymer composites to qualitatively confirm the homogeneous distribution of filler particles with and without surfactant coating in the COP matrix. Three magnification settings were used in all SEM images: 90×, 800×, and 6000/7000×.
Crystals 15 00963 g003
Figure 4. Measured PXRD patterns of TiO2 ceramic powder after different processes: (a) pristine (raw powders as received from Trans-Tech); (b) after calcination; (c) after calcination and high-energy ball-milling without the presence of surfactant; (d) after calcination and high-energy ball-milling with the presence of surfactant.
Crystals 15 00963 g004
Figure 5. N2 gas sorption measurements at 77K, depicted by adsorption (ADS) and desorption (DES) isotherm responses for (a) calcined TiO2; (b) calcined and ball-milled TiO2 without surfactant; and (c) calcined and ball-milled TiO2 with surfactant.
Crystals 15 00963 g005
Figure 6. Energy dispersive spectroscopy (EDS) spectrum of TiO2 ceramic powders calcined at 1100 °C. Inset image shows SEM photo of TiO2 fillers after a 1100 °C calcination process, before the ball-milling process.
Crystals 15 00963 g006
Figure 7. (a) Pictures of two 3D-printed DWGs prepared by both an in-house prepared T30S composite and a commercial Premix ABS450 composite; (b) Measurement setup for s-parameter transmission frequency responses of these two DWGs up to the Ku-band frequencies. The red dashed lines represents calibration reference plane.
Crystals 15 00963 g007
Figure 8. Comparison of measured s-parameter frequency responses of FDM-printed DWGs made from in-house prepared composite T30S (dotted) and Premix ABS450 (solid) filaments.
Crystals 15 00963 g008
Figure 9. (a) Schematic-view simulation diagram of WR-62 waveguide-fed DWG used to extract effective dielectric properties of composite T30S-based DWG and Premix ABS450-based DWG; (b) top view of E-field distribution in composite T30S-based DWG at varied in-band frequencies. The colors represent E-field intensity in the waveguide structure from blue being low to red being high.
Crystals 15 00963 g009
Figure 10. Comparison of measured and simulated frequency responses of a DWG 3D printed by (a) a commercial Premix ABS 450 composite and (b) an in-house developed T30S composite filament. In these plots, the solid line and dashed line represent simulated and measured results, respectively.
Crystals 15 00963 g010
Table 1. CTE values of the chosen matrix and fillers, and other parameters used for the Vo-Shi model.
CompositeThickness of
Interphase Layer (µm)
Radius of Filler
Particles
(µm)
K1K0CTE of Filler (ppm/°C)CTE of Matrix (ppm/°C)
TiO2-COP w/o surface modification1100−0.258.459.86
TiO2-COP with surface modification110−5−0.158.459.86
Table 2. Measured density of titania powder during the manufacturing process at different stages.
Sample NameSample Weight
g
Avg Volume Value
cm3
Avg Density
g/cm3
Pristine TiO20.25520.06344.0225
Calcined TiO20.22640.05424.1791
Calcined and ball-milled TiO2 w/o surfactant0.15660.03664.2747
Calcined and ball-milled TiO2 with surfactant0.18340.04354.2175
Table 3. A list of six in-house composite samples prepared along with their measured CTE values.
Sample NameFillerVolume Fraction of Filter % v/vAvg CTE in ppm/°C from 40 to 120 °CSurfactant Volume % Based on Filler Volume
Pure COP--59.860
T30STitania3045.615%
T40STitania4040.835%
T50STitania5035.935%
T30Titania3046.240
T40Titania4041.430
T50Titania5036.830
Table 4. Average particle sizes and lattice parameters of TiO2 fillers measured by SEM and PXRD.
Calcination
Temperature
(°C)
Measured
Density
(g/cm3)
Surfactant Present During High-Energy Ball-MillingAvg
Particle
Size (µm)
a (Å)b (Å)c (Å)V (Å3)PhaseCrystal
Structure
11004.2175Yes6.674.59334.59332.958062.41RutileTetragonal
11004.2747No6.774.59334.59332.958062.41
11004.1791-504.59334.59332.958062.41
Pristine4.0225-504.59334.59332.958062.41
Table 5. Comparison of element weight fractions by EDS of TiO2 before and after the calcination.
ElementPristineCalcined @ 1100 °C
O18.4115.83
Ti81.5984.17
Total100.00100.00
Disclaimer/Publisher’s Note: The statements, opinions and data contained in all publications are solely those of the individual author(s) and contributor(s) and not of MDPI and/or the editor(s). MDPI and/or the editor(s) disclaim responsibility for any injury to people or property resulting from any ideas, methods, instructions or products referred to in the content.