Article

Crystalline Nanoparticles and Their Impact on Electromagnetic Radiation Absorption in Advanced Clay Building Materials

by
Jelena Brdarić Kosanović
1,*,
Berislav Marković
2,
Ivana Miličević
3,
Anamarija Stanković
1 and
Dalibor Tatar
1
1
Department of Chemistry, Josip Juraj Strossmayer University of Osijek, Ulica cara Hadrijana 8/A, 31000 Osijek, Croatia
2
Faculty of Dental Medicine and Health Osijek, Josip Juraj Strossmayer University of Osijek, Crkvena 21, 31000 Osijek, Croatia
3
Faculty of Civil Engineering and Architecture Osijek, Josip Juraj Strossmayer University of Osijek, Vladimira Preloga 3, 31000 Osijek, Croatia
*
Author to whom correspondence should be addressed.
Crystals 2025, 15(11), 959; https://doi.org/10.3390/cryst15110959
Submission received: 25 September 2025 / Revised: 1 November 2025 / Accepted: 5 November 2025 / Published: 6 November 2025
(This article belongs to the Section Inorganic Crystalline Materials)

Abstract

Given the increasing human exposure to electromagnetic radiation of various frequen-cies, mostly in the microwave range, awareness of potential health problems caused by this radiation has begun to grow. New building materials are being developed and tested to prevent or limit the penetration of microwave radiation, especially those frequencies that are used in mobile telephony. In contrast with the majority of the available literature on the investigation of concrete (cement) materials, in this paper, clay composite materials with the addition of nanoparticles of antimony(III)–tin(IV) oxide, zinc ferrite, iron(III) oxide, and two crystal modifications of titanium dioxide (rutile and anatase) were prepared in order to examine their effect on the absorption of electro-magnetic radiation. Nanomaterials are characterized by different physical and chemical methods. Specific surface area (B.E.T.), thermal properties (TGA/DSC), phase composition (PXRD), morphology (SEM), and chemical and mineralogical composition (EDX, and ED–XRF,) were determined. Thermal conductivity of clay composites was tested, and these materials showed a positive effect on the thermal conductivity (λ) of the composite: a reduction of 10–33%. The reflection and transmission coefficients of microwave radiation in the frequency range used in mobile telephony (1.5–4.0 GHz) were determined. From these data, the absolute value of radiation absorption in the materials was calculated. The results showed that the addition of the tested nanomaterials in a mass fraction of 3 to 5 wt.% significantly increases the absorption (reduces the penetration) of microwave radiation. Two nanomaterials, Sb2O3·SnO2 and TiO2 (rutile), have proven to be particularly effective: the reduction in transmission is 30–50%. The results of the test were correlated with the crystal structures of the examined nanomaterials. The inclusion of titanium dioxide and antimony-doped tin oxide into the clay led to a significant enhancement in microwave electromagnetic radiation absorption, which can be attributed to their interaction with the dielectric and conductive phases present in clay-based building materials.

1. Introduction

Since the 1990s, growing awareness has emerged regarding the potential health risks associated with increased exposure to electromagnetic (EM) radiation across various frequencies. The impact of EM radiation on human health depends on several factors, including its frequency, intensity, duration of exposure, and the specific type of radiation involved [1]. Some studies have suggested a correlation between EM radiation exposure and a range of health issues, including neurological disorders, leukemia, cancer, brain tumors, and other serious conditions [2,3,4].
The electromagnetic spectrum includes all types of electromagnetic waves and is typically divided into regions based on wavelength or frequency: radio waves, microwaves, infrared, visible light, ultraviolet, X–rays, and γ–rays [5]. High–energy radiation (γ–rays, X–rays, and certain ultraviolet wavelengths) has enough energy to remove electrons from atoms by a process known as ionization. In contrast, radiation with longer wavelengths lacks sufficient energy to cause ionization. Accordingly, electromagnetic radiation is broadly categorized into two types: ionizing and non-ionizing radiation.
Most research on protection against ionizing radiation focuses on concrete as the primary shielding material. Efforts to enhance its shielding effectiveness often involve modifying the material to increase its electrical conductivity. A variety of additives are incorporated into concrete to reduce the penetration of ionizing radiation, including metals, carbon-based materials, ceramics, conductive polymers, and other composite materials [6,7]. These modifications aim to improve the material’s attenuation properties while maintaining its structural integrity and practicality in construction applications. An increasing number of studies have explored the incorporation of conductive materials into clay at various wt.%, primarily to assess their effectiveness in shielding against non-ionizing radiation. Although some recent studies [8,9] have begun to investigate the microwave frequency range (1.5–6.0 GHz), the available literature remains limited. In particular, there is a lack of systematic comparisons involving different types of conductive materials and their wt.% within this frequency range. On the other hand, this frequency range is of special interest because multiple generations of mobile telephony (from 2G to 5G) operate in it: LTE 1800 (1.80–1.88 GHz), LTE 2100 (2.11–2.17 GHz), LTE 2600 (2.62–2.69 GHz), and NR3500 (3.40–3.80 GHz). Suitable additives for the development of electromagnetic (EM) shielding building materials include metals, carbon-based materials, ceramics, cement or concrete, conductive polymers, and other composite materials [7]. Among these, metals are the most commonly used due to their high electrical conductivity and strong interaction with the electric field component of EM radiation. Metals have long been employed as shielding materials, either as additives (e.g., aluminum sheets used in electronic enclosures) or as surface coatings. Magnetic ceramics, such as iron(II, III) oxide (Fe3O4 or magnetite), are also effective shielding materials due to their ability to absorb EM radiation [10,11,12,13]. Unlike magnetic metals, these ceramics offer improved corrosion resistance, making them attractive for long-term applications. The synergistic use of Fe3O4 and a conductive component has proven particularly effective. In contrast, typical ceramics alone are generally inadequate for EM shielding because of their low conductivity, poor polarizability, and limited magnetic properties [14]. As a result, research has primarily focused on ceramic–metal composites. Polymers are the least effective shielding materials, unless modified to be conductive. In general, for any shielding material, the presence of magnetic properties significantly enhances performance by enabling interaction with the magnetic field component of electromagnetic radiation [15].
Various additives were used as fillers in the clay, including two types of titanium dioxide (TiO2–rutile and TiO2–anatase), zinc ferrite (ZnFe2O4), maghemite (γ-Fe2O3), and antimony(III)–tin(IV) oxide (Sb2O3·SnO2). These additives were selected based on their demonstrated electromagnetic (EM) shielding capabilities when used in cementitious composites as partial replacements for cement. Zinc ferrite, a member of the spinel ferrite family (e.g., CoFe2O4, MnFe2O4, ZnFe2O4), exhibits excellent electromagnetic properties and high magnetic permeability. Its incorporation into mortar has been shown to increase reflectivity relative to reference samples [16]. In contrast to ferrites, metal oxides such as TiO2 (although non-ferromagnetic) exhibit dielectric loss and are therefore considered to be effective electromagnetic absorbers [17]. Maghemite, known for its strong magnetic properties, has also been shown to enhance EM shielding when used in both structural materials and coatings. This is supported by several studies reporting improved shielding performance with the addition of γ-Fe2O3 [18,19,20]. Although limited research exists on the use of Sb2O3·SnO2 in cementitious systems, its high electrical conductivity has been well documented, making it a promising candidate for electromagnetic shielding applications [21].
The aim of this research is to enhance protection against microwave radiation by increasing absorption in the clay-based composite materials that contain several nanomaterials. The selected nanomaterials were chosen based on their documented electromagnetic properties as reported in the available literature. These composite materials exhibited a pronounced improvement in their ability to absorb microwave electromagnetic radiation, indicating enhanced shielding or attenuation performance.

2. Materials and Methods

2.1. Materials

As a basic material, brick clay supplied by a major fired brick products manufacturer was used. Commercially available nanoparticles used in this study were two crystal modifications of titanium dioxide (TiO2–rutile and TiO2–anatase), iron(III) oxide (γ-Fe2O3), zinc ferrite (ZnFe2O4), and antimony(III)–tin(IV) oxide (Sb2O3·SnO2) (Table 1).
Clay was supplied by the manufacturer as standard production blocks 375 × 250 × 238 mm (mass 15.1 kg) prior to firing. Blocks were broken into smaller pieces, ground up in a rotary mixer, and sieved through the standard sieve No. 18 (1.0 mm opening). All other materials were used as received. Potable water without purification was used for sample preparation.
Samples for measurements were prepared in the form of 150 mm disks (diameter) of 20 mm thickness (three samples of the same composition, approx. mass 650 g each). Pure clay disks were prepared as a standard while composite disks were prepared with the addition of 3 and 5 wt.% of selected nanomaterials. The proportions of nanomaterials were selected based on a study [9], and preliminary tests were carried out with addition of varying amounts of nanomaterials (1–10 wt.%). It was shown that the 3 wt.% and 5 wt.% additions of nanomaterials are optimal with respect to cost and the properties obtained. All samples were prepared in a wet form (25 wt.% water) and, after thorough mixing, compacted in a steel mold. After the preparation, the samples were subjected to a drying process in a chamber (room) with controlled air humidity. Drying clay samples is a very sensitive process, especially in the case of such thin specimens. A very important factor is gradual drying, in order to prevent cracks from forming as a result of too rapid drying. Therefore, they were first dried for two days in the air with 70% relative humidity in a humidity-controlled room, followed by two more days of drying in the air at 30% relative humidity. The final step was drying in a laboratory oven at 105 °C for 24 h to completely remove the water from the samples.
Once the water had been completely removed, the firing process followed. The firing program was adopted from Wienerberger d.o.o., a company primarily engaged in brick production (Figure S1). After 13 h, the kiln was turned off, and the disks were left to cool naturally until they could be handled by hand (Figure 1).

2.2. Methods

Materials listed in Table 1 were characterized by different physical and chemical methods.
Their specific surface area was determined by absorbing ultrapure nitrogen according to the Brunauer–Emmett–Teller (B.E.T.) method on a Quantachrome© Nova 4200e device (Boynton Beach, FL, USA).
The thermal properties of the material were examined using a Mettler-Toledo System 1 instrument (Mettler-Toledo, Columbus, OH, USA) equipped for simultaneous thermogravimetric and differential scanning calorimetric (TGA/DSC) analysis. Approximately 10–15 mg of the sample was weighed and placed in aluminum(III) oxide (Al2O3) crucibles (Mettler-Toledo, Columbus, OH, USA). The measurements were performed under the oxygen atmosphere (O2 flow, 195 mL min−1) in the temperature range of 50–1000 °C, with a heating rate of 10 °C min−1. Data acquisition and processing were conducted using STARe Software version 10.0 [22].
The surface morphology and elemental composition of the material were analyzed using a Thermo Fisher Scientific Apreo C scanning electron microscope (SEM, Waltham, MA, USA) equipped with an energy-dispersive X-ray (EDX) analyzer. The measurements were carried out at a working distance of 10.3 mm, under accelerating voltages of 10 and 20 kV. The examined areas measured 5 and 10 µm2, respectively. A small quantity of the sample was mounted on carbon adhesive tape affixed to an aluminum stub prior to analysis. No metal sputtering was applied.
The crystalline phases of the materials were determined by powder X-ray diffraction (PXRD). Diffractograms were recorded on a PANalytical Aeris Research Diffractometer (Malvern PANalytical, Malvern, UK) using CuKα radiation (40 kV, 15 mA, λ = 1.54178 Å) at 295 K in Bragg–Brentano θθ geometry. Phase identification was performed by matching the obtained diffraction patterns with the literature. The diffraction data were analyzed using PANalytical HighScore Plus 3.0 software (Malvern PANalytical, Malvern, UK).
The elemental composition of clay was determined using an energy-dispersive X-ray fluorescence spectrometer (ED–XRF). The instrument model NEX CG manufactured by Rigaku (Tokyo, Japan) was used.
Thermal conductivity, λ (Wm−1K−1) of clay samples and composite materials was measured using a FOX 200 instrument (TA Instruments, New Castle, DE, USA). The thermal conductivity of a material is defined as the amount of heat that passes through a 1 m thick layer with a surface area of 1 m2 per unit of time, given a temperature difference of 1 K. It is calculated according to Equation (1).
λ = Q · d A · Δ T · t
In many technical disciplines, including construction, thermal resistance (R, m2 K/W) is commonly reported. It is defined as the ratio of a material’s thickness to its thermal conductivity (Equation (2)).
R = d λ
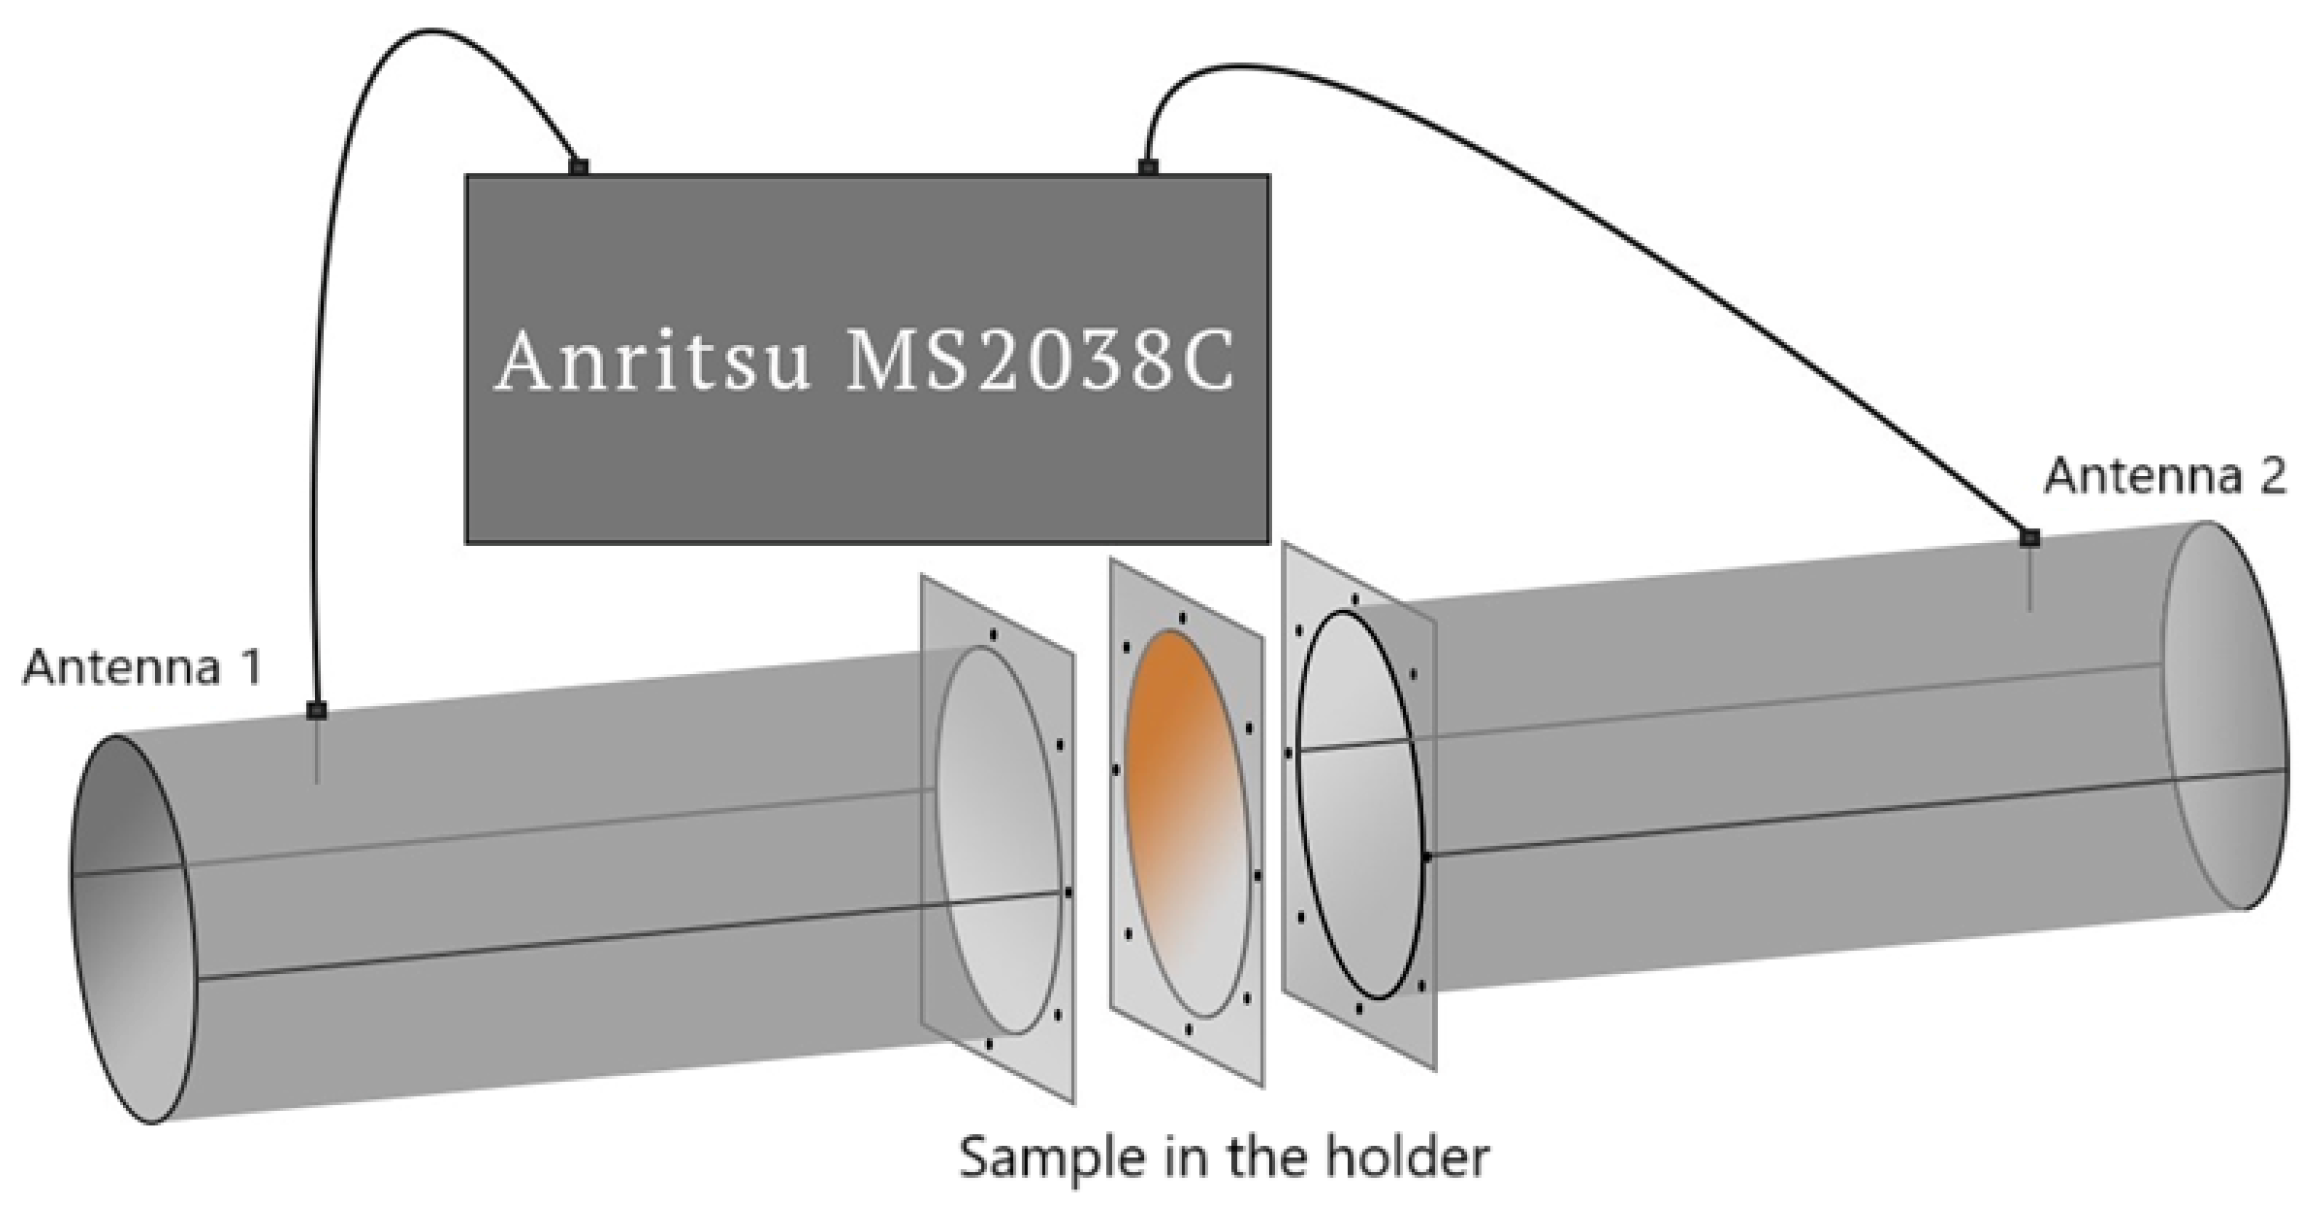
The penetration of microwave radiation through the prepared clay composite disks was measured. The measuring device (Figure 2) consists of two aluminum cylindrical waveguides with two monopole antennas built in, between which there is a steel plate where the tested sample is placed. The antennas are connected via coaxial cables to the spectrum analyzer Anritsu MS2038C—Handheld Vector Network Analyzer and Spectrum Analyzer (Morgan Hill, CA, USA).
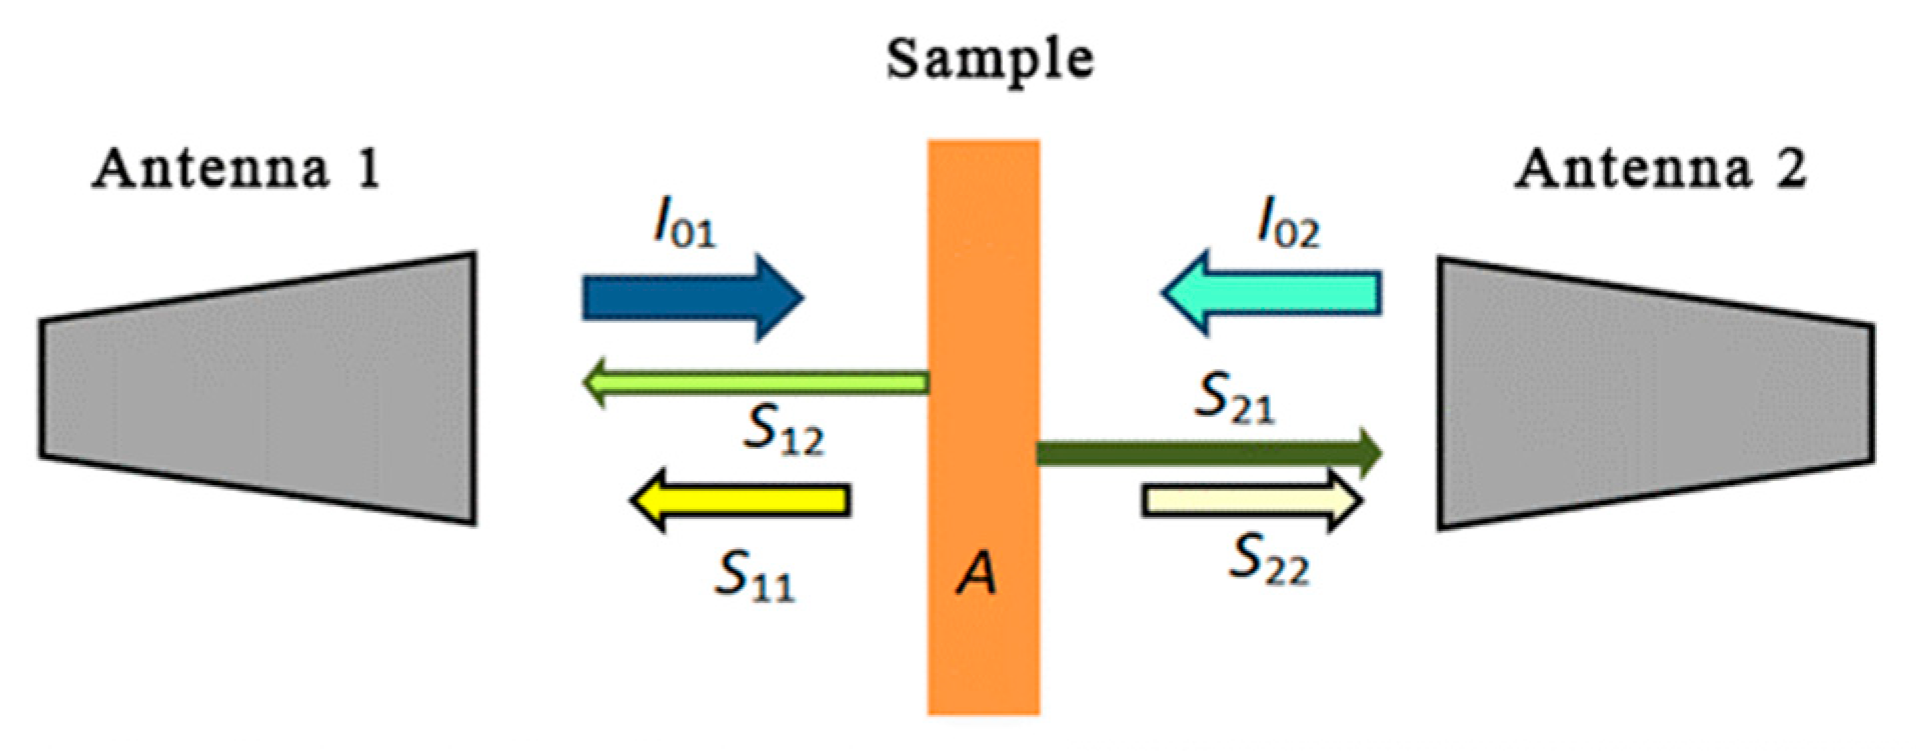
The measurements were conducted to determine the area of protection against microwave radiation penetration within the frequency range used in mobile telephony (1.5–4.0 GHz). The measured transmission (S21) coefficients were recorded across this range, and based on the obtained data, the absolute values of radiation absorption in the tested materials were calculated. However, the following frequency bands are discussed in more detail in this paper: 2G (1.75–1.85 GHz), 3G (2.10–2.30 GHz), 4G (2.60–2.70 GHz), and 5G (3.40–3.80 GHz). The device assembled in this configuration is capable of measuring all four S parameters (Figure 3). The output signals from Antennas 1 (I01) and 2 (I02) are directed toward the sample, where a portion of the electromagnetic energy is reflected (described by the reflection coefficients, S11, S22) while portion is absorbed within the sample (denoted as A), and the remaining energy is transmitted through the sample and detected by the opposite antennas, which measure the transmission coefficient (S21, S12). The absorption (A) within the sample at each specific frequency can be calculated using the reflection and transmission coefficients, according to Equation (3).
A = 10 l o g 1 S 11 2 S 21 2  
In this study, the base material utilized was industrial brick clay obtained from a leading manufacturer of fired clay products. In addition to the clay matrix, several commercially available nanoparticulate additives were incorporated: Sb2O3·SnO2, ZnFe2O4, γ-Fe2O3, and two polymorphic forms of titanium dioxide: anatase (TiO2 A050) and rutile (TiO2 R050). Although these nanomaterials are widely available on the market, a comprehensive physicochemical and structural characterization was performed before their use. This step was essential to ensure the reproducibility and consistency of their intrinsic properties, thereby providing a reliable foundation for the subsequent experimental procedures and analysis.

3. Results and Discussion

3.1. Materials Characterization

Results of specific surface area measurement by B.E.T. method as well as calculated and measured particle sizes for materials used are given in Table 2.
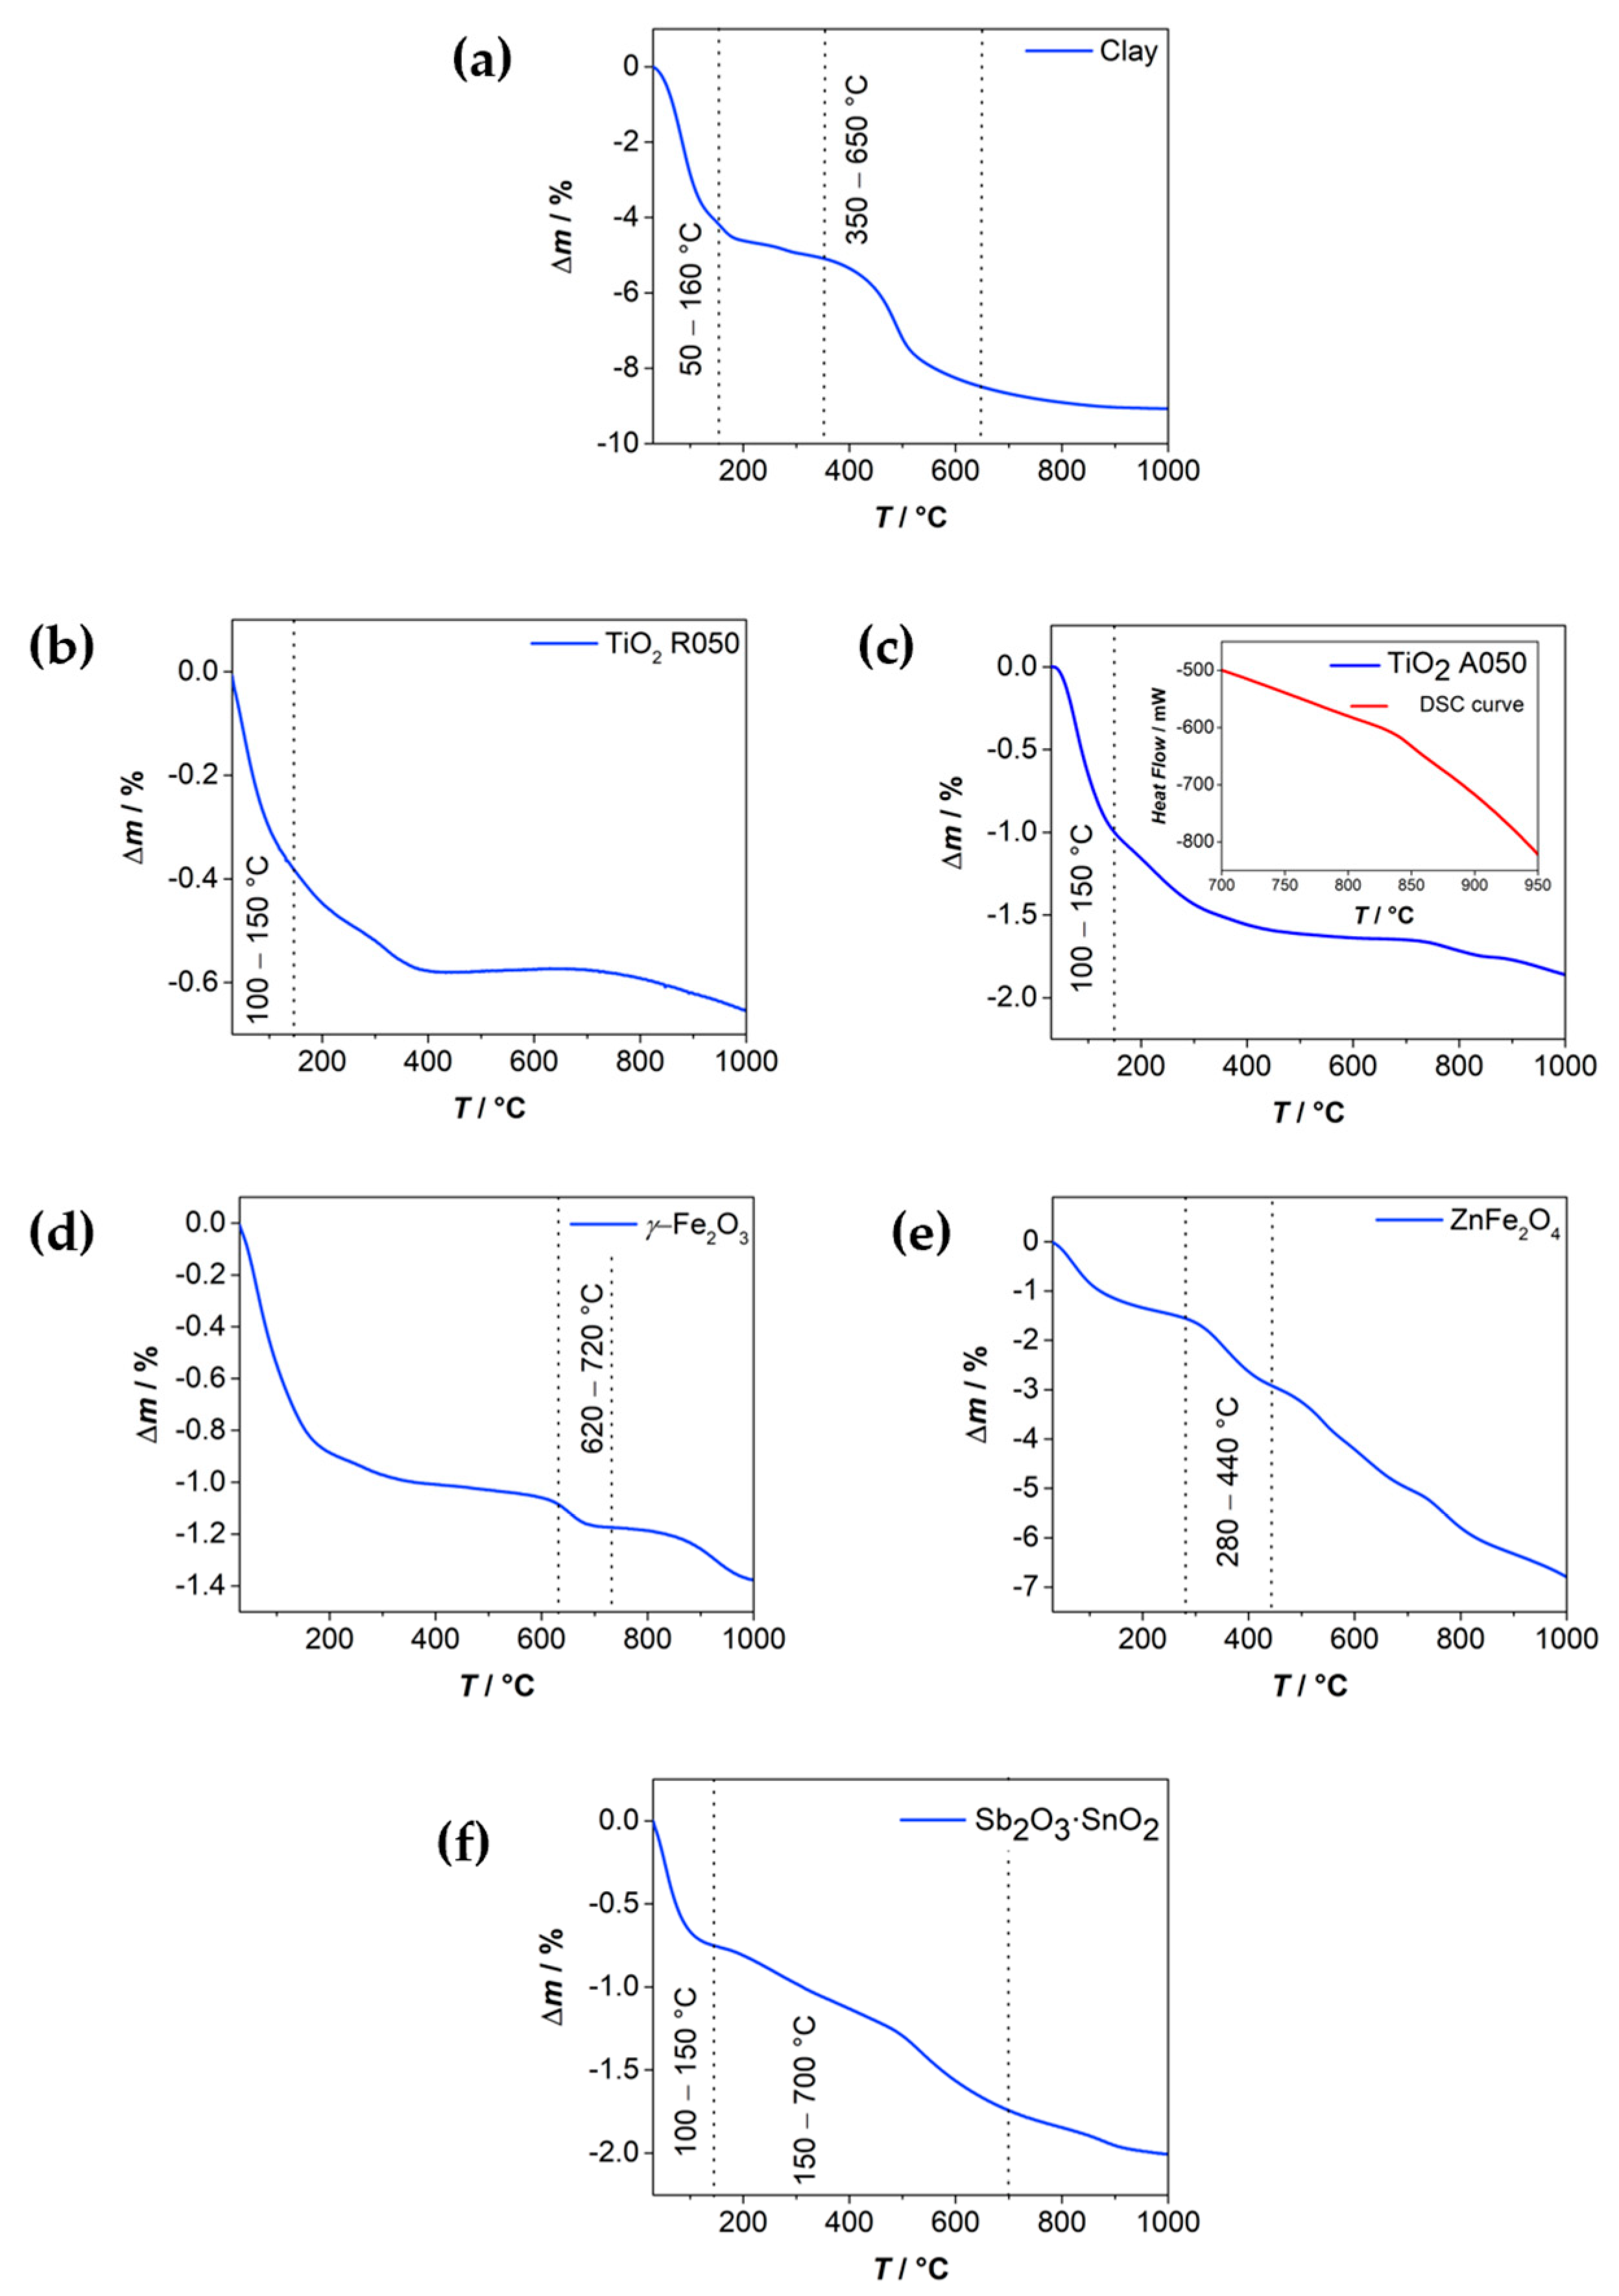
The thermogram of the clay sample (Figure 4a) exhibits, as expected, a two-step mass loss. In the first step, a mass loss of 4.2 wt.% is observed in the temperature range of 50–160 °C, while the second step shows a 3.5 wt.% mass loss occurring between 350 and 650 °C. These losses correspond to the release of physically adsorbed water in the first step, and to dehydroxylation in the second, i.e., the removal of interlayer water from the clay structure. According to the literature [24], all minerals of the kaolinite group display a characteristic mass loss in the 400–700 °C range, associated with transformation during which kaolinite is converted into metakaolinite.
Figure 4b,c presents thermogravimetric curves for two titanium dioxide samples with different crystal modifications (anatase and rutile), both having a nanometer particle size (~50 nm), measured over a temperature range of 25 to 1000 °C. As shown, no significant mass loss was observed. A minor initial loss between 100 and 150 °C (0.6–2.1 wt.%) is attributed to the presence of a small amount of adsorbed moisture. Based on these results, it can be concluded that TiO2 exhibits excellent thermal stability [25]. Additionally, the DSC curve (heat flow) is given as an insert in Figure 4c, showing the phase transformation (anatase to rutile) at around 830 °C.
As expected, the nanomaterial samples γ-Fe2O3, ZnFe2O4, and Sb2O3·SnO2 did not exhibit significant mass loss over the measured temperature range (Figure 4d–f). The observed mass losses, all below 6%, can be attributed to surface-adsorbed water (moisture) [26,27,28].
As observed with SEM, the clay sample (Figure 5a,b) contains particles of varying sizes, which is expected given that the material was supplied in block form and subsequently mechanically crushed and sieved using a standard 1 mm mesh.
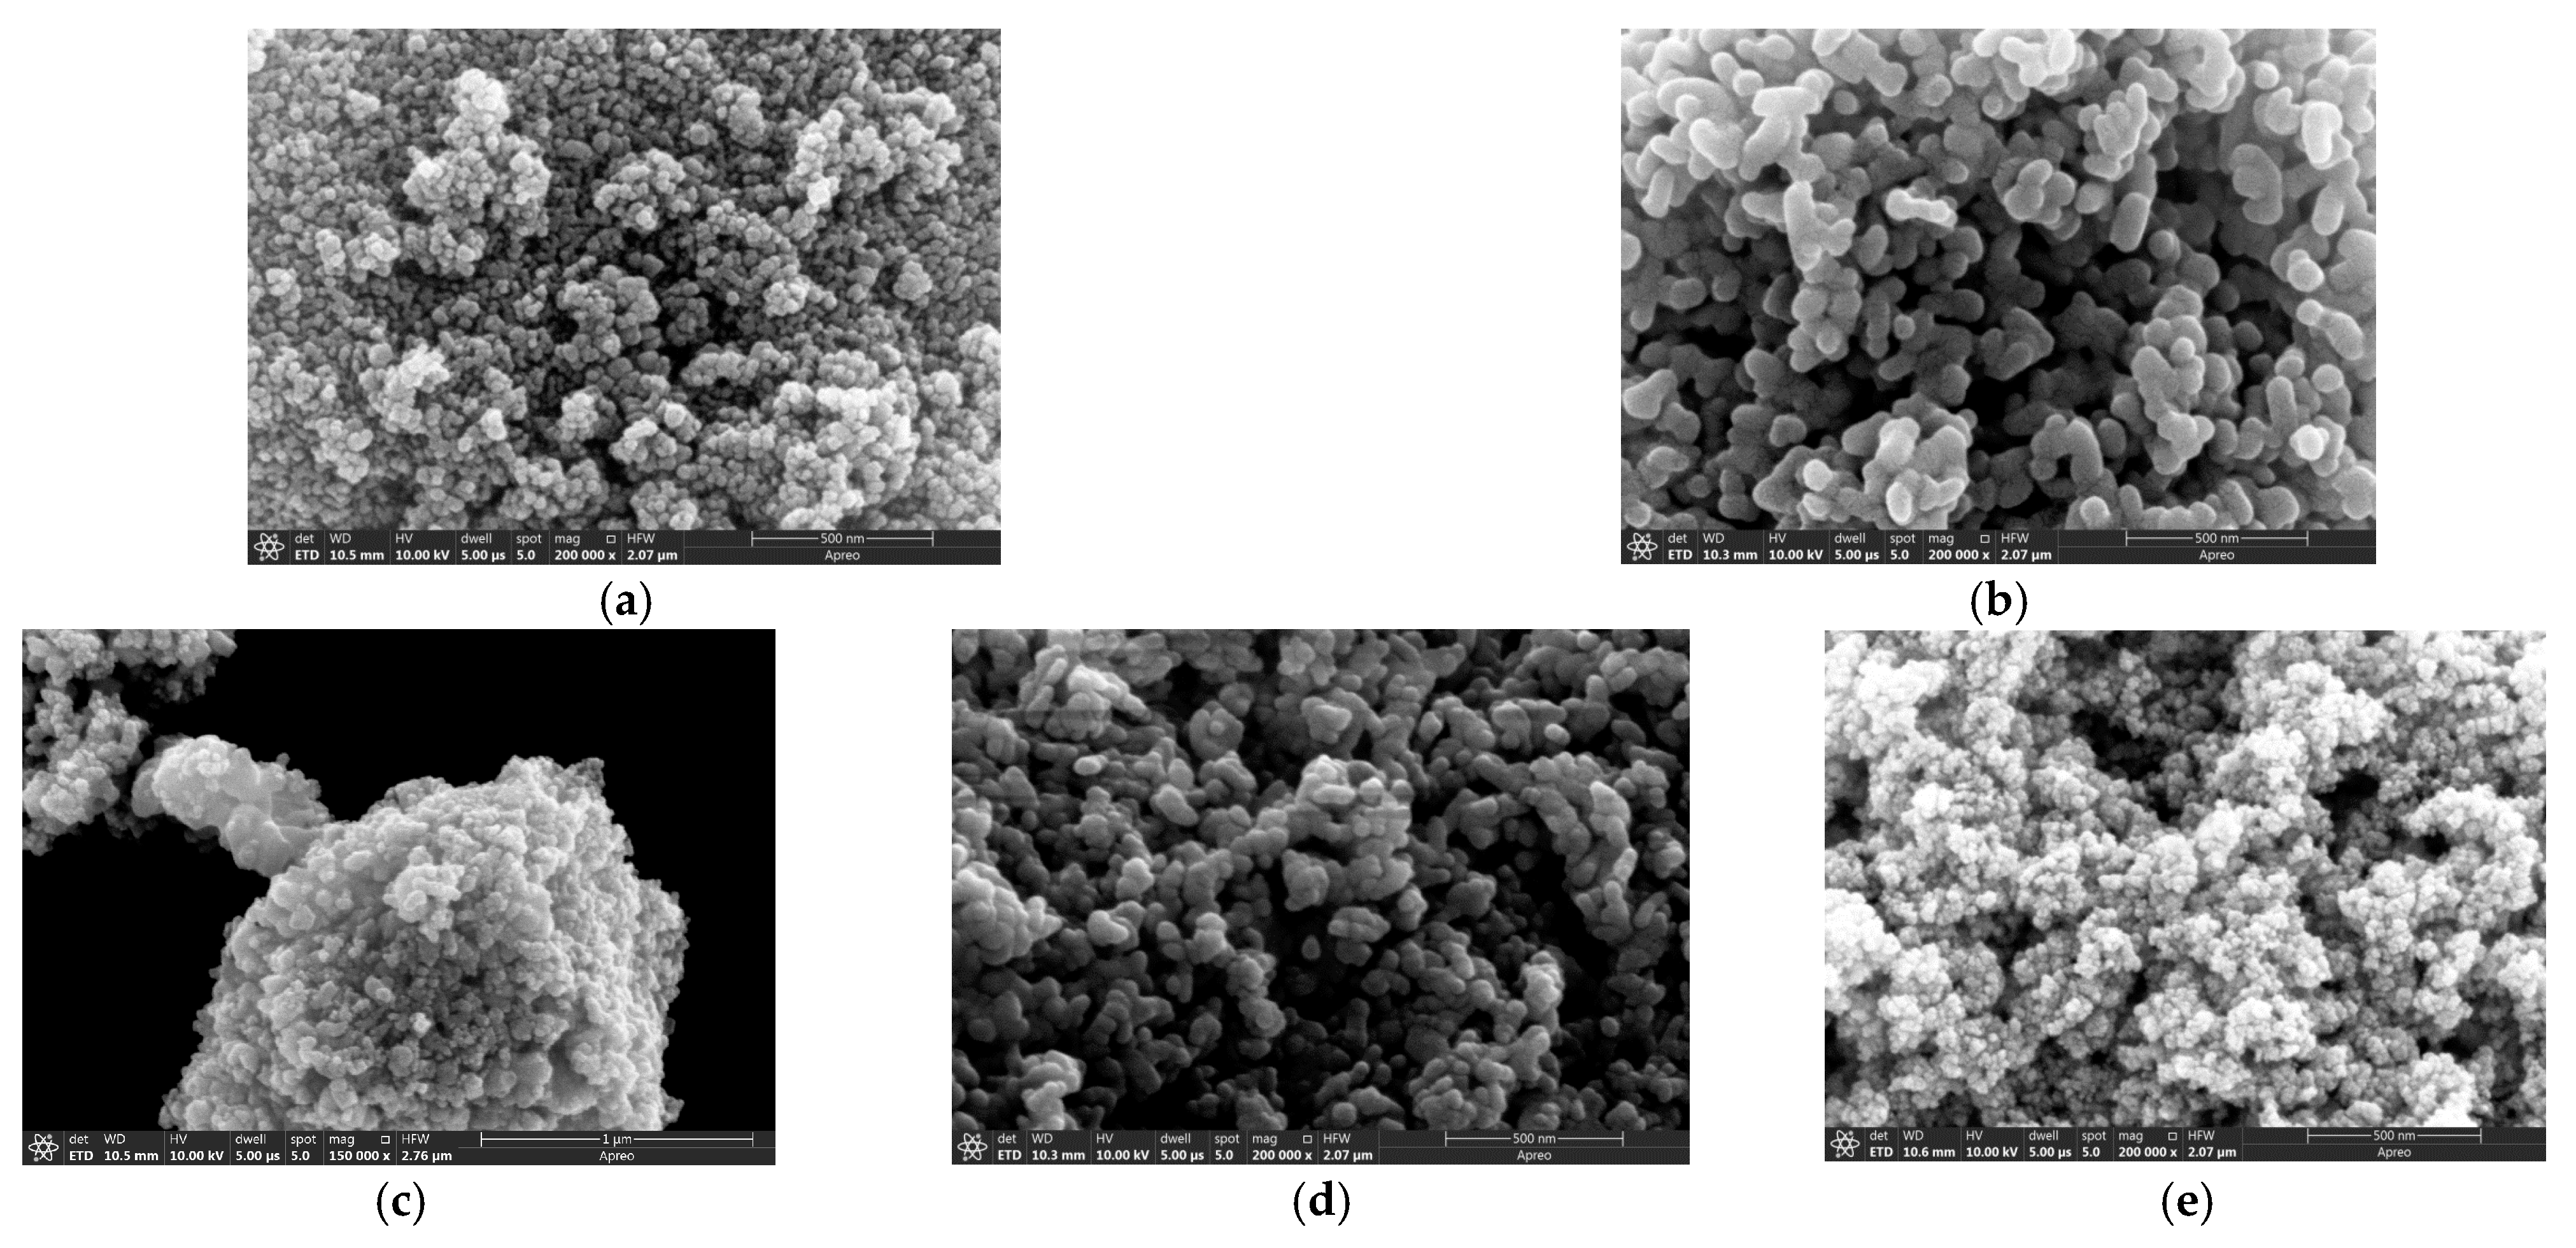
Figure 6 shows SEM micrographs of the materials used as additives to clay. The observed particle morphologies and sizes are consistent with the particle size data provided by the manufacturer.
The results of elemental analysis obtained by SEM-EDX are consistent with the empirical formulas of the analyzed materials. The corresponding data, expressed in atomic percentages, are provided in the Supplement (Table S1).
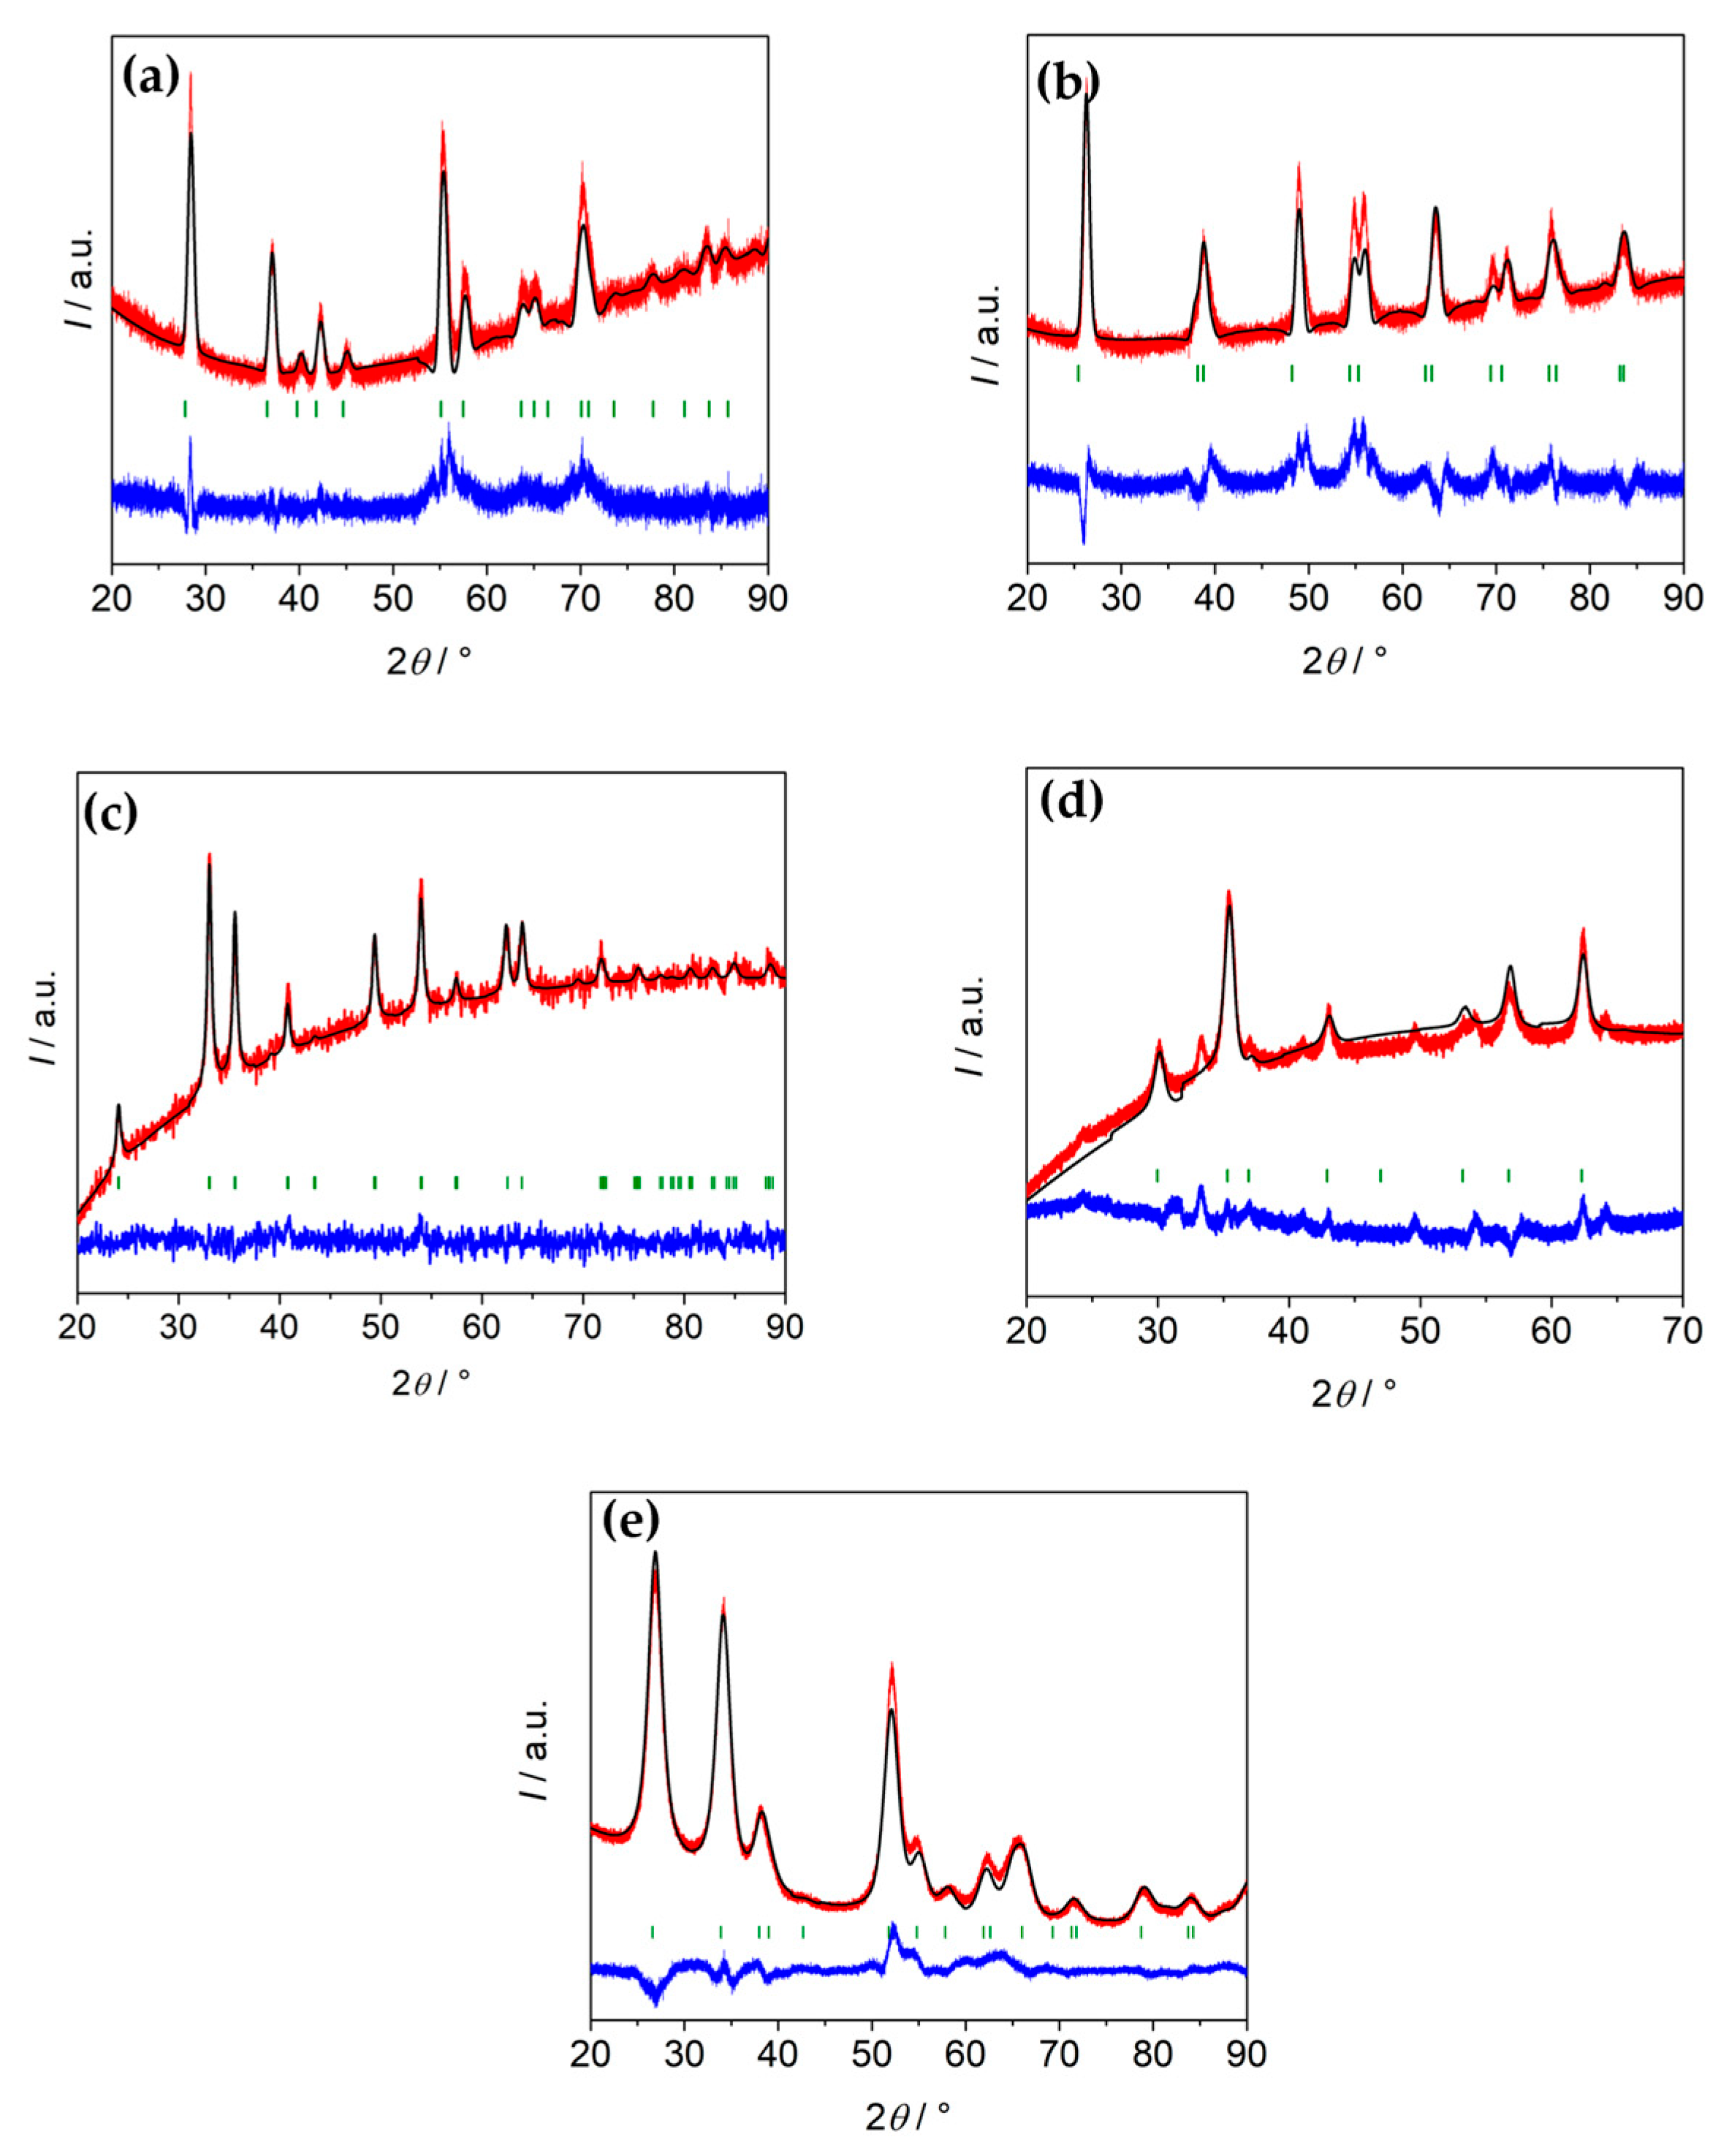
The X-ray diffractogram of clay is presented in the Supplement (Figure S2), while all the other X-ray diffractograms with Rietveld analysis are presented in Figure 7a–e.
The results presented in Figure 7 indicate that all analyzed materials are phase-pure, as confirmed by the agreement between the observed and calculated PXRD patterns in the Rietveld refinement plots [29,30,31,32,33]. The observed peaks in the X-ray diffractogram of clay (Figure S2) correspond to SiO2 (black) [34], and γ-Fe2O3 (blue) [35]. These X-ray diffraction results are consistent with the elemental analysis data presented in Table 3, which summarizes the most common elements (expressed as oxides) in clay, as determined by energy-dispersive X-ray fluorescence spectrometry ED–XRF [36].

3.2. Measurements on Composite Disks

Composite disks (clay + 3 and 5 wt.% of selected nanomaterials) prepared as described in Section 2.1. were used in thermal conductivity measurements as well as for microwave penetration investigations (Section 3.3).
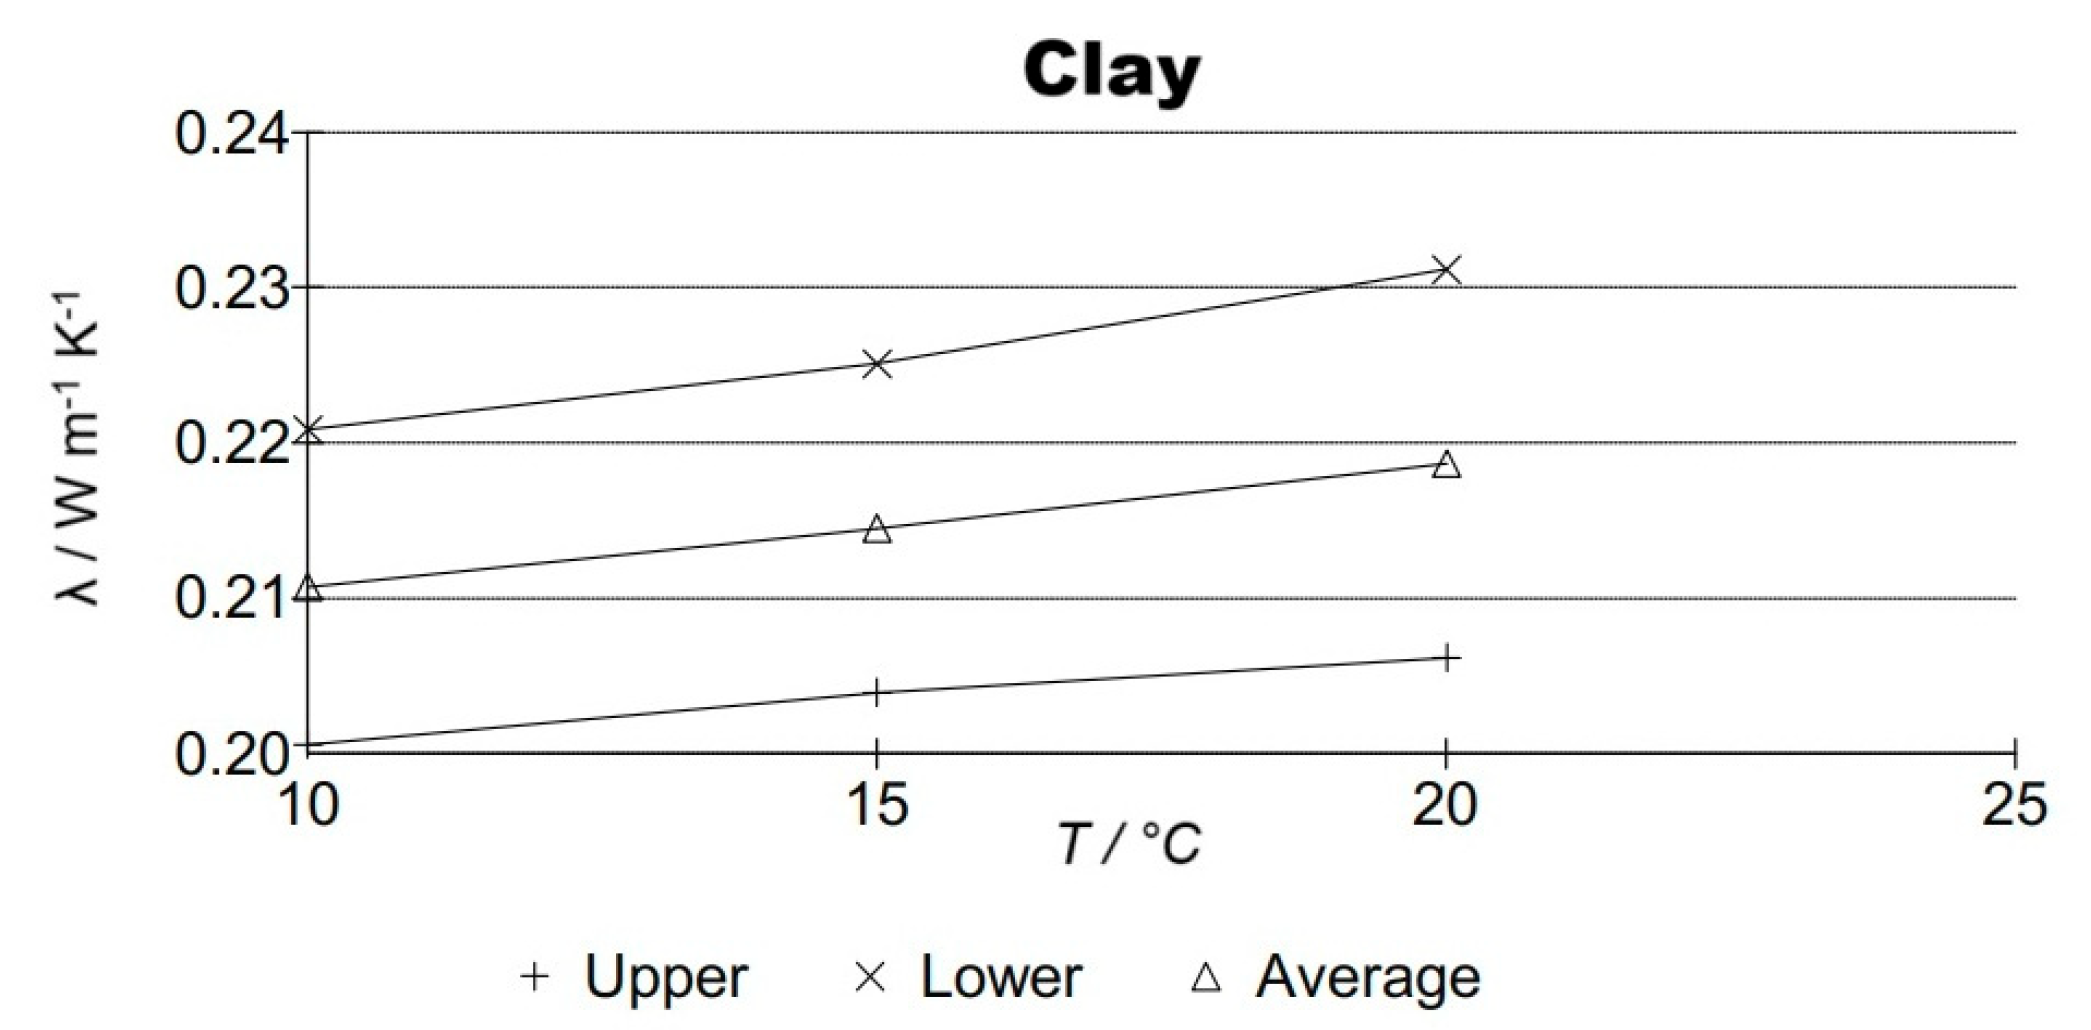
Figure 8 shows the measured thermal conductivity values (λ, Wm−1K−1) for the pure clay sample. The results listed in Table 4 demonstrate the influence of nanomaterial additions in 3 wt.% and 5 wt.% on the thermal conductivity of clay-based composite materials.
Considering the λ values reported in the literature [37,38,39,40,41,42] for standard clay solid bricks—ranging from 0.2 to 0.8 Wm−1K−1—and comparing them with the thermal conductivity measured in this study (0.2146 ± 0.010 Wm−1K−1 for the clay sample, see Table 4), it can be concluded that the measured value is relatively low. Consequently, the corresponding thermal resistance (R) is relatively high. This low thermal conductivity is particularly noteworthy.
Results of thermal conductivity measurements for pure clay and clay-based composite materials incorporating 3 wt.% and 5 wt.% of various additives TiO2 (anatase and rutile), ZnFe2O4, γ-Fe2O3, and Sb2O3·SnO2 are presented in Table 4. Representative thermal conductivity values (λ) were taken as those measured at 25 °C in accordance with the HRN ISO 8302:1998 standard [43]. These values, together with the corresponding thermal resistance (R), calculated based on the precisely measured sample thickness, are also presented in Table 4.

3.3. Electromagnetic Radiation Characterization of Clay and Clay-Based Composites

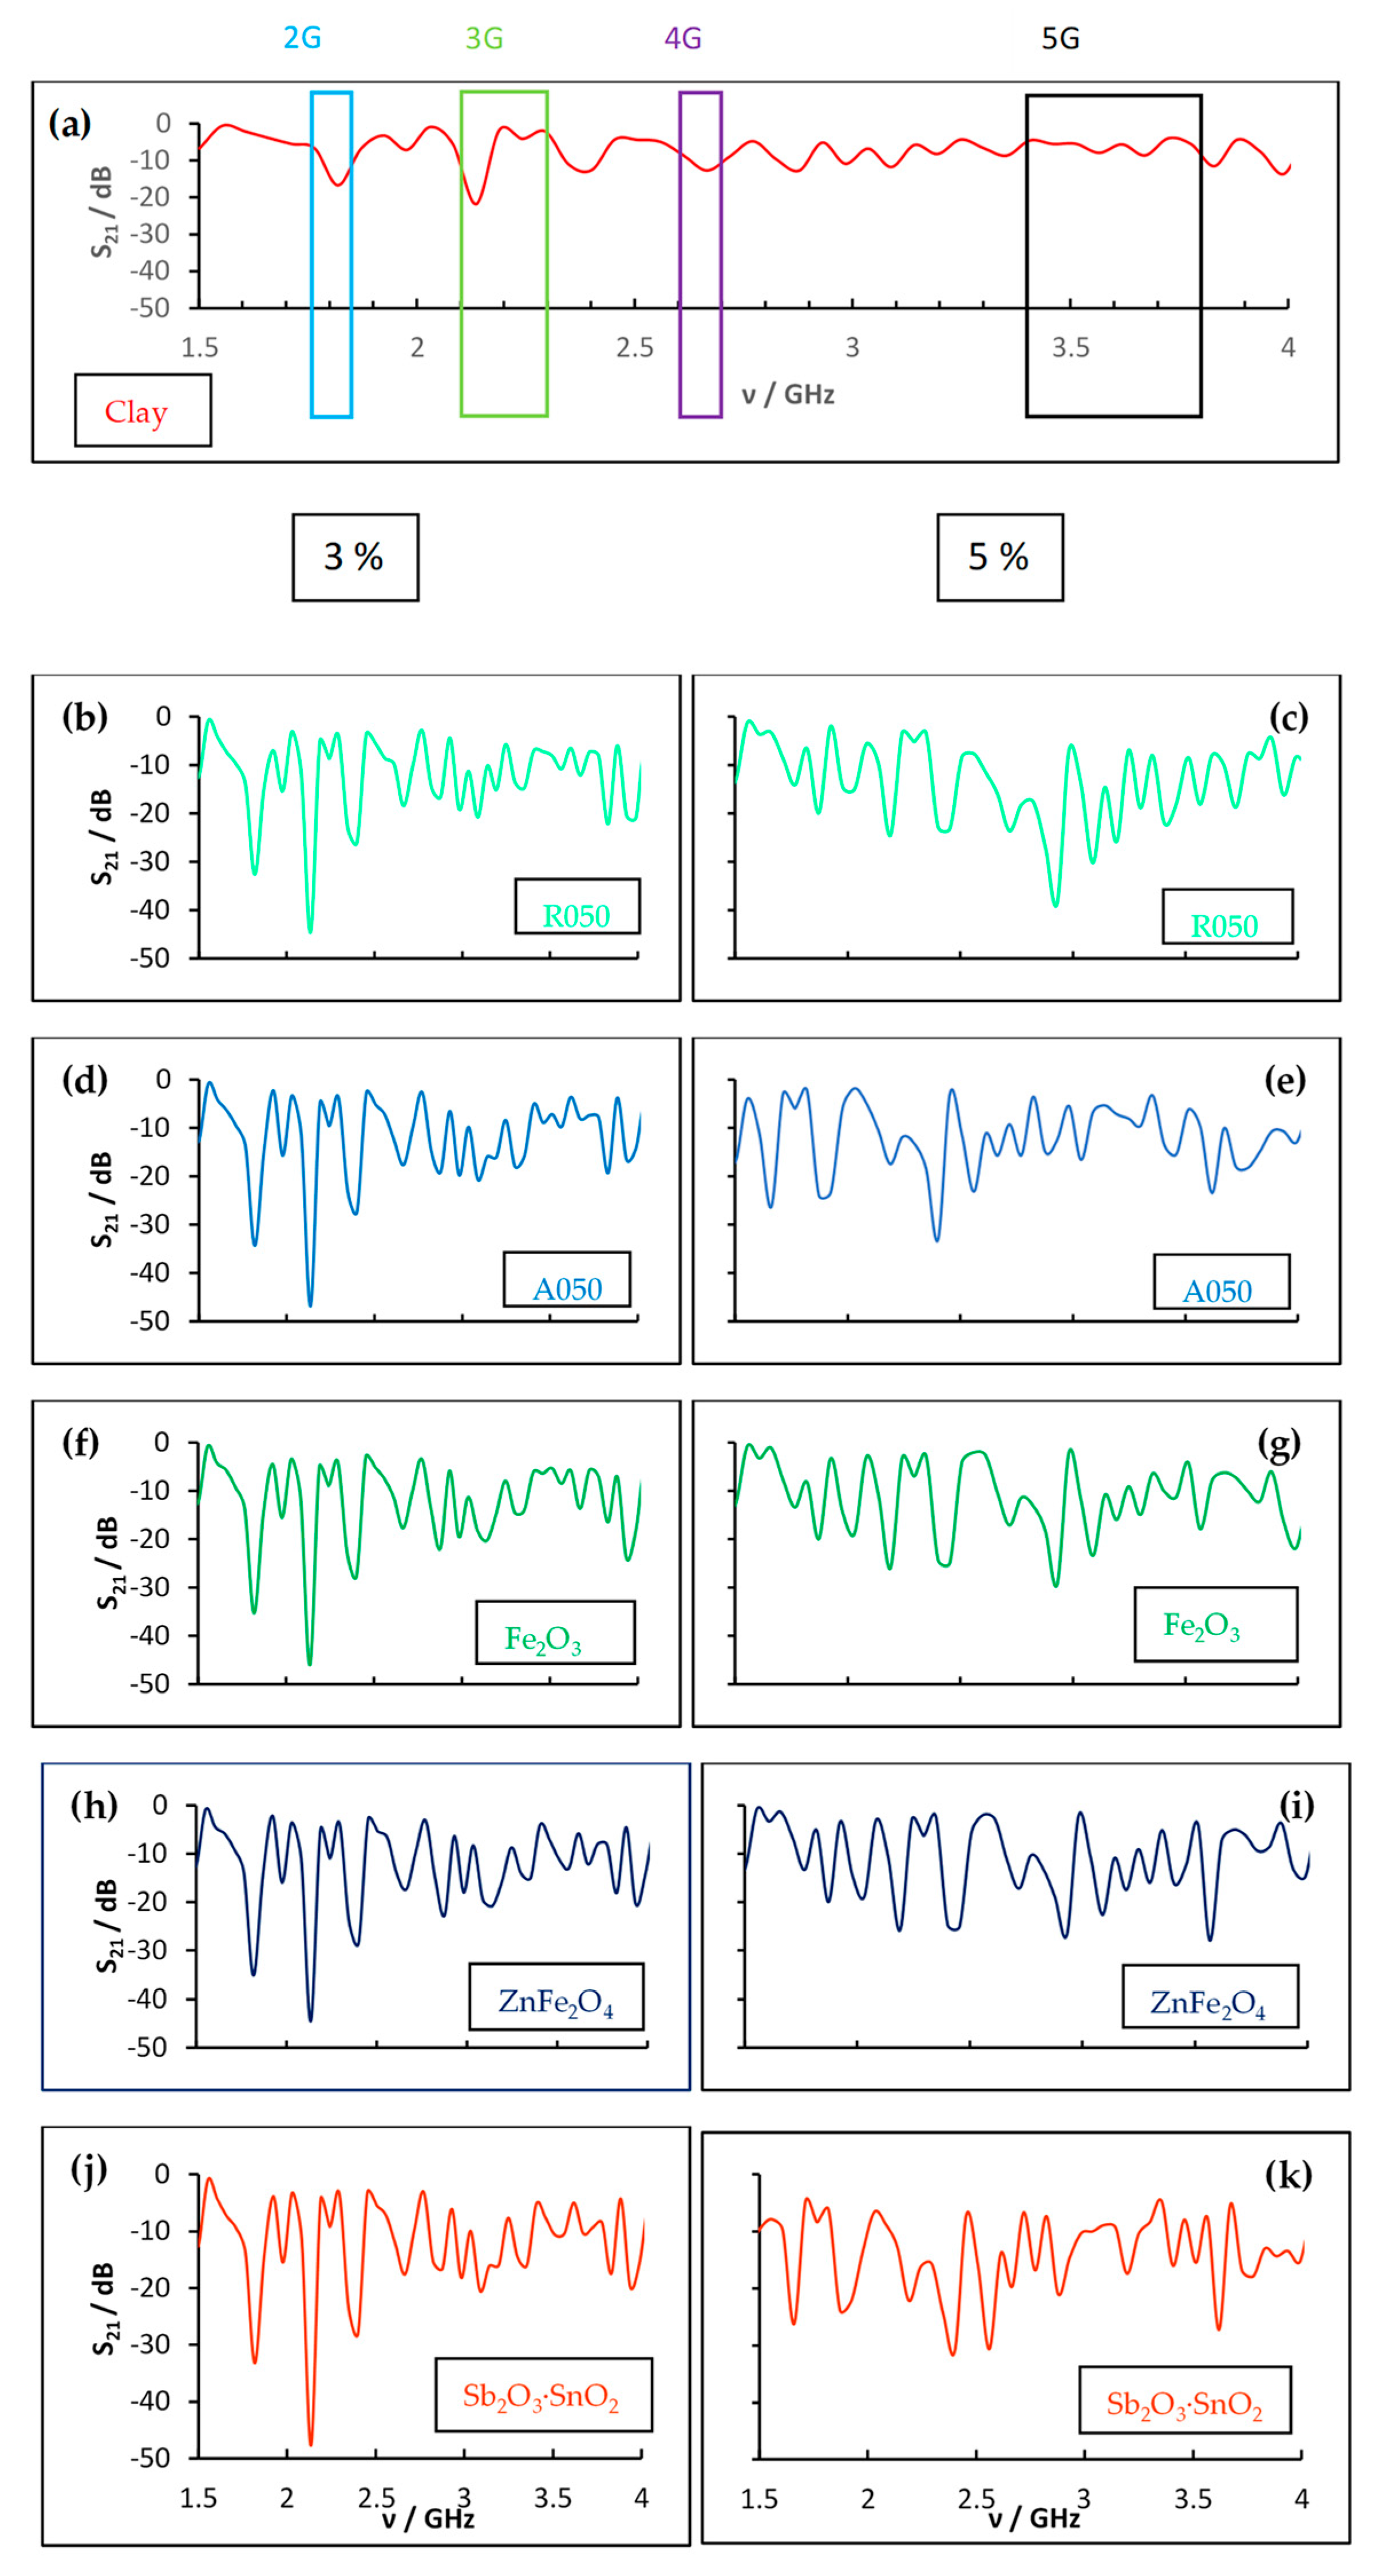
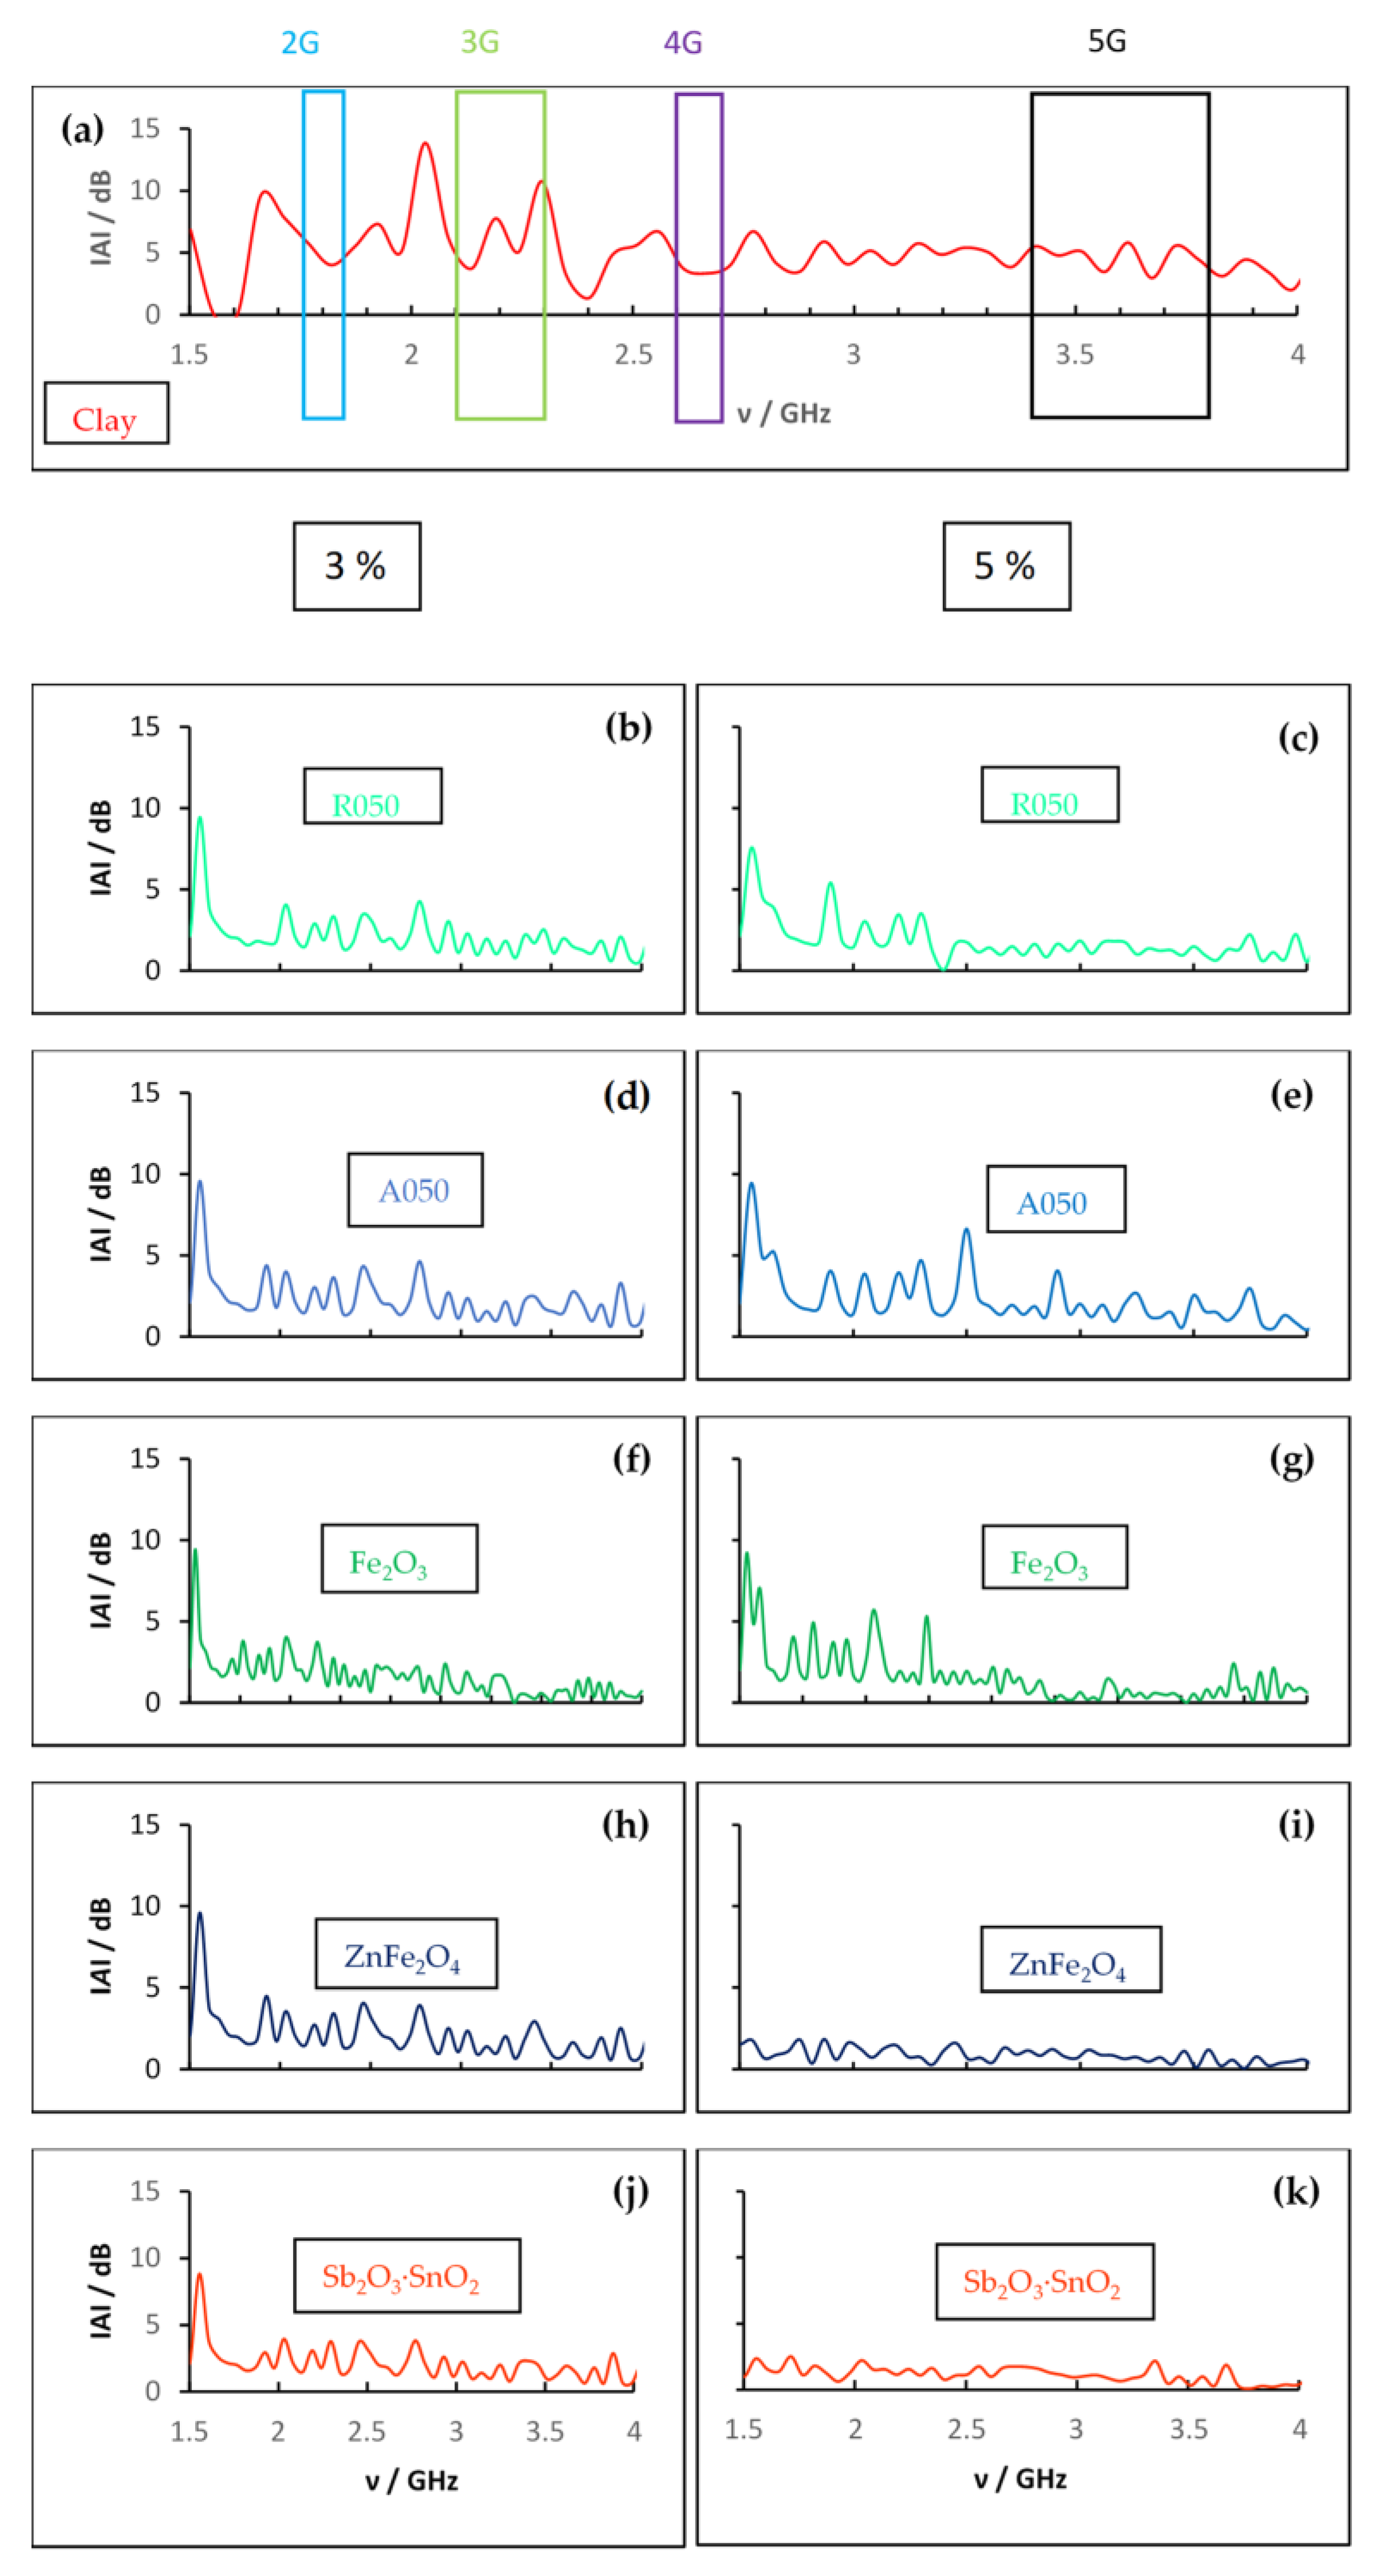
The measurements of the electromagnetic radiation (EMR) characteristics (S21 and |A|) of clay and clay-based composites with 3 and 5 wt.% of additives are presented in Figure 9 and Figure 10. Calculated areas under the curves that correspond to 2G–5G ranges are presented in Table 5 (S21) and Table 6 (|A|).
The electromagnetic spectral measurements presented in Figure 9 (transmission coefficient S21) and Figure 10 (|A|), together with Table 5 and Table 6 (integrated areas under the curves in the 2G–5G frequency ranges), reveal several notable trends.
The clay sample exhibits strong microwave absorption (Figure 10a) and low transmission (S21, Figure 9a) in the 1.5–4.0 GHz range, confirming its inherent ability to attenuate electromagnetic radiation. This behavior can be attributed to the clay’s mineralogical and chemical composition, particularly the relatively high content of γ-Fe2O3 [44], which contributes to dielectric and magnetic losses.
Within the 2G range, all samples containing nanomaterial additives exhibit larger S21 areas compared with the clay reference (1.156), indicating enhanced microwave attenuation and improved shielding effectiveness (Table 5). According to Table 6, all samples exhibit lower absorption compared to the reference clay.
Overall, these results indicate that increasing the additive concentration does not necessarily lead to better attenuation performance or higher electromagnetic shielding efficiency. Instead, the effect appears to depend on both the additive type and its dispersion within the matrix.
In the 3G range, most composite samples exhibit higher S21 values (Figure 9, Table 5) relative to the clay reference (1.548), implying lower transmission and therefore a reduction in microwave penetration. The largest S21 areas are observed for Sb2O3·SnO2 5 wt.% (3.377), TiO2 A050 3 wt.% (3.379), and ZnFe2O4 3 wt.% (3.347), while the TiO2 R050 5 wt.% sample shows the lowest value (2.188).
Interestingly, the corresponding absorption values (Figure 10, Table 6) for these composites are slightly lower than that of the clay reference (0.628), suggesting that the addition of nanomaterials tends to reduce transmitted signal intensity (S21), but not necessarily through enhanced absorption (|A|).
Within the 4G range, the S21 transmission coefficients (Figure 9, Table 5) are generally comparable to the clay reference (1.065), although certain composites show improved attenuation of microwave penetration, specifically TiO2 (3 and 5 wt.%), Fe2O3 3 wt.%, ZnFe2O4 3 wt.%, and Sb2O3·SnO2 (3 and 5 wt.%).
A comparison of the absolute absorption values (Figure 10, Table 6) reveals that the clay (0.363) still shows higher absorption than the composite materials (0.093–0.272). This observation suggests that the principal mechanism responsible for reducing electromagnetic penetration in the composites is not direct absorption, but rather reflection or impedance mismatch introduced by the nanophase inclusions.
In the 5G frequency region, transmission coefficient values (Figure 9, Table 5) increase notably across all samples compared to lower-frequency ranges (2G–4G), indicating more pronounced attenuation of microwave penetration at higher frequencies. The most effective shielding is observed for TiO2 R050 5 wt.% (5.408), TiO2 A050 5 wt.% (5.725), and Sb2O3·SnO2 3 wt.% (5.624). These results are particularly relevant because the 5G band represents the frequency range currently most used in modern mobile communications.
Similarly to lower frequencies, the clay reference sample exhibits the highest absorption (1.857), while all composites display lower absorption values (0.220–0.735). This again confirms that attenuation in these systems arises predominantly from reflection and scattering processes rather than intrinsic absorption.
Overall, the combined analysis of transmission (S21) and absorption (|A|) data across the 2G–5G frequency range demonstrates that the inclusion of nanomaterial additives modifies the interaction between electromagnetic radiation and the clay matrix. While most compositions show enhanced shielding performance, the dominant mechanism of attenuation appears to shift from absorption to reflection and scattering as the additive type and concentration vary. The results highlight the complex interplay between composition, microstructure, and frequency-dependent electromagnetic behavior in clay-based composites.

3.4. Discussion

Table 7 presents the previously published works in which the authors have used the same additives, but in different systems, and/or measurements have been performed differently.
Titanium dioxide, TiO2, naturally occurs in three polymorphic forms: rutile, anatase, and brookite (Figure S3) [45].
Brookite has a rhombohedral structure and, because of its instability, is rarely used, while both rutile and anatase belong to the tetragonal crystal system. However, their lattice structures are different and that is the reason for some of their significant differences in properties, stability, and eventually in applications.
The unit cell of anatase contains four TiO2 molecules; the crystal structure is more open (less compact), and consequently its density is lower (3.8–3.9 g cm−3) than that of rutile (4.2–4.3 g cm−3). Although stable at room temperature, anatase transforms (irreversibly and exothermally) at high temperature (approx. 750–800 °C) to the thermodynamically more stable rutile form. Each unit cell of rutile contains two TiO2 molecules and their close-packed arrangement results in a higher density and greater stability when compared to anatase. Its significantly higher dielectric constant (114 vs. 48 for anatase) and higher electrical conductivity, which increases markedly at higher temperatures, makes a rutile potentially better choice in electronic applications [46]. The addition of conductive materials, especially with particles in the nanometer range, into generally low conductive base materials like clay or concrete, has been proven to be an effective way for increasing shielding properties against the penetration of electromagnetic radiation (including microwaves).
Most studies in the literature [47] investigate the addition of titanium dioxide (alone or in combination with other additives) to concrete. One such report involves the preparation of a composite aggregate by dispersing nanosized TiO2 (80 wt.% anatase + 20 wt.% rutile) into clay, followed by calcination [48]. Measurements of the electromagnetic properties of such TiO2/clay composites show a high relative dielectric constant. The authors then prepared concrete samples by using three different aggregates: natural (gravel + sand), haydite (granulated clay), and a TiO2/clay composite. The results showed some. improvement in the absorption of electromagnetic radiation (8–18 GHz) for the samples with haydite (~7.5 dB), which is attributed to the highly porous material, the scattering of electromagnetic waves, and the resonance absorption in voids. The highest adsorption (10–14 dB) was exhibited for the samples with TiO2/clay composite aggregate. The authors concluded that titanium dioxide, as a semiconductor characterized by its high relative dielectric constant, can be used for the absorption of microwave radiation.
One other study reports the results of microwave radiation (2–18 GHz) absorption on cement samples with the addition of 2.32 vol.% of rutile and anatase [49]. All the samples with either TiO2 polymorph showed a significant increase in radiation absorption, especially at some specific frequencies (up to 242.97% at 16 GHz).
Our results show that the addition of either anatase (TiO2 A050) or rutile (TiO2 R050) into clay effectively decreases the penetration of microwave radiation in the frequency range of 1.5–4.0 GHz by increasing its absorption (Figure 10b–e). Minor differences, i.e., samples with rutile show higher absorption, can be attributed to its higher dielectric constant and higher electrical conductivity. On the other hand, similarities in behavior can be explained by the method used to prepare the composite disks: heat treatment at a temperature of 850 °C (firing) would cause phase transformation of at least a part of anatase into rutile.
Iron(III) oxide exists in two main crystalline modifications, namely the minerals hematite (α-Fe2O3) and maghemite (γ-Fe2O3) (Figure S4) [45]. Hematite is a weakly ferromagnetic mineral that crystallizes in the hexagonal crystal system and is one of the most common iron oxides found in nature. Maghemite, on the other hand, is a ferrimagnetic mineral at room temperature with a cubic crystal structure. Each unit cell contains 32 oxygen ions (O2−), 21 1 3 iron (Fe3+) ions, and 2 vacancies. The cations are randomly distributed among 8 tetrahedral and 16 octahedral sites. Both hematite and maghemite nanoparticles exhibit superparamagnetic behavior at room temperature [50,51]. Due to the characteristic magnetic properties of iron(III) oxide, researchers have suggested that its nanoparticulate form could potentially be used for protection against electromagnetic radiation.
Sayyed and colleagues [52] prepared cement mortar samples (composed of cement, water, and sand) as a reference sample, along with five additional samples containing hematite in 5, 10, 15, 20, and 25 wt.%. They measured the absorption of radioactive radiation for three different radioisotopes (137Cs, 60Co, and 241Am) and found that the addition of Fe2O3 had a positive influence on the reduction in radiation transmission. The mortar containing 25% Fe2O3 was the most effective in attenuating radiation. The study also concluded that sample thickness positively affects radiation attenuation.
Investigations into electromagnetic radiation absorption in composite materials made from clay and functional aggregates (Fe2O3, SiC, and Fe3O4) showed significant electromagnetic wave attenuation (up to −12.13 dB) in the frequency range of 8–18 GHz. These materials also demonstrated notable compressive strength [53].
The influence of Fe2O3 addition to cement mortar was further explored in detail by Ng and colleagues [54,55] by examining the transmission coefficient (S21) for samples with thicknesses of 4 cm and 6 cm and Fe2O3 mass fractions of 2, 4, 6, 8, and 10 wt.%. Their results indicated that, within the frequency range of 3.4 to 3.6 GHz (5G), the highest increase in transmission losses (S21) was observed in the sample containing 2 wt.% Fe2O3. The authors emphasized that their measurements were conducted in an open configuration (Antennas 1 and 2, along with the sample, were placed in an open space) and recommended waveguide-based measurements, which have been carried out in the present study.
Antimony(III) tin(IV) oxide (Sb2O3∙SnO2) is a transparent conductive oxide widely employed in electronic and optoelectronic applications due to its combination of high electrical conductivity and excellent optical transparency in the visible spectral range. These properties render Sb2O3∙SnO2 particularly suitable for integration into devices that require both optical and electrical functionalities, such as touchscreens, flat-panel displays, photovoltaic cells, and electrochromic devices [56,57,58,59,60,61].
This material is typically synthesized via a high-temperature solid-state reaction between antimony(III) oxide (Sb2O3) and tin(IV) oxide (SnO2), often represented by the empirical formula Sb2O3∙SnO2, most often by the acronym ATO [62].
The material is classified as a wide-bandgap semiconductor, characterized by a substantial energy gap between the valence and conduction bands, which enables efficient visible light transmission while maintaining conductive behavior. Its electrical and optical properties can be systematically tuned by adjusting the Sb–Sn ratio, enabling optimization for specific applications. In addition, Sb2O3∙SnO2 exhibits notable chemical and thermal stability, as well as resistance to environmental degradation, further supporting its use in various operational environments.
Given its favorable properties, recent studies have investigated the potential of Sb2O3∙SnO2 as a functional additive in ceramic and clay-based matrices for electromagnetic (EM) radiation shielding applications in the frequency range of 1.5–4.0 GHz. Clay samples containing 10 wt.% Sb2O3∙SnO2 were prepared and analyzed in wet, dried, and sintered forms. The most significant result was observed at 2.82 GHz, where a maximum attenuation of the S21 transmission coefficient reached −57.57 dB. These findings suggest that Sb2O3∙SnO2 can significantly enhance the EM-shielding effectiveness of clay composites and may be considered a promising additive for developing multifunctional ceramic materials capable of attenuating non-ionizing electromagnetic radiation [9].
There is a notable lack of published literature concerning the incorporation of Sb2O3∙SnO2 into cementitious or clay-based materials. However, based on manufacturer specifications indicating favorable electrical properties, Sb2O3∙SnO2 has been considered a promising candidate for applications involving electromagnetic radiation shielding.
Zinc ferrite (ZnFe2O4) is a spinel-type ferrite in which Zn2+ ions preferentially occupy the tetrahedral (A) sites, while Fe3+ ions are located in the octahedral (B) sites of the spinel lattice (Figure S5) [45].
This material possesses a unique combination of magnetic and electrical properties arising from its chemical composition and spinel crystal structure. It is a ferrimagnetic material, exhibiting a net magnetic moment even in the absence of an external magnetic field. Owing to its favorable electrical conductivity and low magnetic permeability, zinc ferrite is widely considered to be suitable for high-frequency applications, including inductors, transformers, microwave devices, and magnetic recording media [63,64].
The functional properties of zinc ferrite can be finely tuned by varying the stoichiometry and synthesis parameters, enabling control over its magnetic, electrical, and structural characteristics to meet the demands of specific applications. Moreover, zinc ferrite combines the magnetic behavior typical of ferrites with the chemical stability and corrosion resistance associated with zinc-containing materials, making it attractive for a variety of electronic and electromagnetic applications [65,66,67,68].
Despite its potential, a review of the existing literature indicates that no systematic studies have been reported on the incorporation of zinc ferrite into cementitious materials for the purpose of electromagnetic radiation (EMR) shielding, particularly within the microwave frequency range of 1–6 GHz. This represents a significant gap and an opportunity for further investigation into the use of ZnFe2O4 as a functional additive in construction materials aimed at mitigating non-ionizing radiation.
Li et al. [69] investigated the effect of incorporating zinc ferrite into concrete mixtures and reported a notable improvement in electromagnetic wave absorption, with absorption values exceeding 6 dB. However, their measurements were conducted in the high-frequency range of 78.5–98.5 GHz, which limits their relevance for typical building and shielding applications.
To better understand the shielding performance of ferrite materials in more applicable frequency ranges, Zhang and Sun [16] developed two-layer cement-based composites incorporating Mn-Zn ferrite (Mn0.5Zn0.5 Fe2O4) as microwave absorbers. The design of the composites was based on impedance matching theory and the principles of electromagnetic wave propagation. Compared to single-layer structures, the two-layer cement panels demonstrated enhanced microwave absorption, with a reduction in reflectivity of 6–8 dB, and a maximum reflection loss of 15 dB achieved with a 30 wt.% ferrite content. Furthermore, the reflectivity remained below –10 dB across the frequency range of 11.4–18 GHz, indicating strong absorption performance.
These results confirm that the addition of ferrite to cementitious composites can effectively reduce microwave reflectivity, with higher ferrite content corresponding to greater attenuation. Such ferrite-filled composites exhibit strong potential as microwave-absorbing construction materials for electromagnetic shielding applications in buildings [70]. Based on the available literature, it can be concluded that the previously discussed materials: iron(III) oxide, titanium dioxide (anatase and rutile crystal modifications), zinc ferrite, and antimony(III) tin(IV) oxide demonstrate significant potential as functional additives in construction materials designed to enhance the electromagnetic shielding effectiveness of buildings.
Table 7. Comparison of electromagnetic shielding properties and measurement parameters for materials, taken from the literature and this study.
Base MaterialAdditive/Size/ContentEMR Measurements/Frequency RangeConclusionRef.
-
Concrete (Portland cement + aggregate + water)
-
Nano TiO2 with clay in aggregate (30:70%).
-
80% anatase and 20% rutile (aggregate).
-
Electromagnetic wave reflection loss (reflectivity).
-
Frequency range: 8–18 GHz.
-
Addition of nano TiO2 improves microwave absorbing ability of the concrete.
[48]
-
Ordinary Portland cement
-
Anatase (5, 10, 15 nm).
-
Rutile (20–30, 50, 500, 1500 nm).
-
Rutile + anatase (20–30 nm).
-
2.32 vol.%.
-
Electromagnetic wave reflection loss (reflectivity).
-
Frequency range: 2–18 GHz.
-
Addition of TiO2 improves microwave absorbing ability (increases reflectivity) of the cement paste.
[49]
-
Brick clay
-
Anatase (50 nm).
-
Rutile (50 nm).
-
3 and 5 wt.%.
-
Electromagnetic spectra measurements in a closed system (waveguides): reflection and transmission parameters measured; absorption calculated.
-
Frequency range: 1.5–4.0 GHz.
-
Addition of TiO2 improves significantly shielding properties.
Present work
-
Cement mortar (cement + sand + water)
-
Hematite Fe2O3.
-
100 × 15 nm.
-
5, 10, 15, and 25 wt.%.
-
γ-rays attenuation (I/I0).
-
Energy: 0.06–1.333 MeV.
-
Frequency range: 1.45 × 10¹⁰–3.22 × 10¹¹ GHz.
-
Increasing the ratio of Fe2O3 nanoparticles can lead to a remarkable improvement in the gamma ray shielding.
[52]
-
Cement mortar (cement + sand + water)
-
Hematite (Fe2O3) 38 µm with clay in aggregate (10:90%).
-
10 wt.%.
-
Electromagnetic wave reflection loss (reflectivity).
-
Frequency range: 8–18 GHz.
-
Reflectivity less than −10 dB.
-
Excellent absorption performance.
[53]
-
Cement mortar (cement + sand + water)
-
Micro-sized Fe2O3.
-
2, 4, 6, 8, 10 wt.%.
-
Two horn antennas in shielded chamber (open system).
-
Frequency range: 3.40–3.60 GHz.
-
Measurements of transmission coefficient S21.
-
Propagation loss is increasing with the amount of Fe2O3.
[54,55]
-
Brick clay
-
Maghemite Fe2O3 (50 nm).
-
3 and 5 wt.%.
-
Electromagnetic spectra measurements in a closed system (waveguides): reflection and transmission parameters measured; absorption calculated.
-
Frequency range: 1.5–4.0 GHz.
-
Conclusion: addition of maghemite improves shielding properties.
Present work
-
Concrete (cement + aggregate + water)
-
Ferrite (ZnFe2O4).
-
12.92 and 24.10 wt.%.
-
Wave radar reflectance measurer.
-
Frequencies: 78.5, 85.0, 92.5, and 98.5 GHz.
-
Measurements of absorption rate (dB).
-
Absorption rate between 8 and 12 dB.
-
Absorption rate increases with increasing content of ferrite.
[69]
-
Cement mortar (cement + sand + water)
-
Mn-Zn ferrite.
-
10 and 30 wt.%.
-
Electromagnetic wave reflection loss (reflectivity).
-
Frequencies: 8–18 GHz.
-
Reflection loss because of EM absorption.
-
Higher ferrite content, lower reflection loss.
-
Double-layer composites have excellent absorption properties.
[16]
-
Brick clay
-
ZnFe2O4 (46 nm).
-
3 and 5 wt.%.
-
Electromagnetic spectra measurements in a closed system (waveguides): reflection and transmission parameters measured; absorption calculated.
-
Frequency range: 1.5–4.0 GHz.
-
Addition of ZnFe2O4 improves shielding properties.
Present work
-
Brick clay
-
Sb2O3∙SnO2 (ATO).
-
5% wt.%.
-
Electromagnetic spectra measurements in a closed system (waveguides): transmission parameter (S21) measured.
-
Frequencies: 1.5–6 GHz.
-
The specimens with Sb2O3∙SnO2 at most frequencies result in the lowest transmission.
[9]
-
Brick clay
-
Sb2O3∙SnO2 (ATO).
-
3 and 5 wt.%.
-
Electromagnetic spectra measurements in a closed system (waveguides): reflection and transmission parameters measured; absorption calculated.
-
Frequency range: 1.5–4.0 GHz.
-
Addition of Sb2O3∙SnO2 improves significantly shielding properties in lesser amounts.
Present work

4. Conclusions

Unlike most studies on electromagnetic radiation protection, which focus on concrete-based materials, this work investigates clay-based composites for microwave attenuation in the 1.5–4.0 GHz range, relevant to mobile telecommunications (2G to 5G). The clay matrix, rich in γ-Fe2O3, shows strong intrinsic absorption, especially at lower frequencies.
Spectral analysis reveals that nanomaterial additives modify the shielding behavior in a frequency-dependent manner. In the 2G range, all composites show improved attenuation (higher S21 areas), but lower absorption than pure clay, indicating that reflection and impedance mismatch are the dominant mechanisms. This trend continues in the 3G and 4G ranges, with reduced transmission but limited absorption. In the 5G range, TiO2 (rutile and anatase, 5 wt.%) and Sb2O3·SnO2 (3 wt.%) demonstrate the most effective shielding.
Overall, additive concentration alone does not guarantee better performance. Shielding efficiency depends on additive type, dispersion, and microstructure. These findings confirm that clay composites with all investigated additives are promising candidates for EMI shielding, offering a sustainable alternative for modern communication technologies.

Supplementary Materials

The following supporting information can be downloaded at https://www.mdpi.com/article/10.3390/cryst15110959/s1. Figure S1. Firing process of clay and clay composite disks; Table S1. Elemental analysis (atomic %) by energy-dispersive X-ray spectroscopy (SEM-EDX) of the nanomaterials (TiO2 A050, TiO2 R050, γ-Fe2O3, ZnFe2O4, Sb2O3∙SnO2); Figure S2. X-ray diffractogram of clay; Table S2. Crystallographic data obtained through Rietveld refinement for all investigated materials; Table S3. Crystallographic data obtained from Rietveld refinement for all investigated materials, compared with corresponding literature data [29,30,31,32,33]; Figure S3. Schematic representations of the unit cells of the crystal structures of (a) rutile, (b) anatase, and (c) brookite. Oxygen ions (O2) are shown in red, and titanium ions (Ti4+) in gray [45]; Figure S4. Crystal structures of (a) hematite -Fe2O3) and (b) maghemite (γ-Fe2O3). Oxygen ions (O2) are shown in red, and iron ions (Fe3+) in green [45]; Figure S5. Crystal structure of zinc ferrite (ZnFe2O4), showing oxygen anions (O2, red), zinc cations (Zn2+, yellow) in tetrahedral sites, and iron cations (Fe3+, blue) in octahedral sites [45].

Author Contributions

Conceptualization, A.S., J.B.K., B.M. and I.M.; methodology, B.M., J.B.K. and A.S.; software, A.S. and J.B.K.; validation, A.S., J.B.K., B.M. and I.M.; formal analysis, J.B.K. and A.S.; investigation, J.B.K.; resources, B.M. and I.M.; data curation, A.S., D.T. and J.B.K.; writing—original draft preparation, J.B.K.; writing—review and editing, J.B.K., A.S., B.M. and I.M.; visualization, J.B.K., D.T. and A.S.; supervision, B.M., I.M. and B.M.; project administration, B.M., I.M. and A.S.; funding acquisition, A.S., B.M. and I.M. All authors have read and agreed to the published version of the manuscript.

Funding

This research was funded by EU Operational Program Competitiveness and Cohesion 2014–2020. Investing in science and innovation KK.01.1.1.04: “Development and application of advanced building materials for the construction of healthy buildings: protection against non-ionizing radiation”, ref. no. KK.01.1.1.04.0105.

Data Availability Statement

The original contributions presented in this study are included in the article/Supplementary Material. Further inquiries can be directed to the corresponding author(s).

Acknowledgments

The authors are thankful Slavko Rupčić and Vanja Mandrić for the help with EMR measurements. Also, thanks Akos Kukovetz and Imre Szenti for SEM/EDX observations.

Conflicts of Interest

The authors declare no conflicts of interest.

Abbreviations

ATOAntimony(III)–Tin(IV) Oxide (Sb2O3∙SnO2)
TGAThermogravimetric Analysis
B.E.T.Brunauer–Emmett–Teller method
PXRDPowder X-ray Diffraction
SEMScanning Electron Microscope
EDXEnergy-Dispersive X-ray Analyzer
ED–XRFX-ray fluorescence spectrometry
EMElectromagnetic
LTELong Term Evolution
NRNew Radio
TiO2 R050Rutile
TiO2 A050Anatase
EMRElectromagnetic Radiation
EMIElectromagnetic Interference

References

  1. Lai, H.; Levitt, B.B. The roles of intensity, exposure duration, and modulation on the biological effects of radiofrequency radiation and exposure guidelines. Electromagn. Biol. Med. 2022, 41, 230–255. [Google Scholar] [CrossRef]
  2. Duhaini, I. The effects of electromagnetic fields on human health. Phys. Medica 2016, 32, 213. [Google Scholar] [CrossRef]
  3. Wdowiak, A.; Mazurek, P.A.; Wdowiak, A.; Bojar, I. Effect of electromagnetic waves on human reproduction. Ann. Agric. Environ. Med. 2017, 24, 13–18. [Google Scholar] [CrossRef]
  4. Liu, L.; Huang, B.; Lu, Y.; Zhao, Y.; Tang, X.; Shi, Y. Interactions between electromagnetic radiation and biological systems. iScience 2024, 27, 109201. [Google Scholar] [CrossRef]
  5. Fritzsche, H.; Phillips, M. Electromagnetic Radiation. Encyclopedia Britannica. 2025. Available online: https://www.britannica.com/science/electromagnetic-radiation (accessed on 18 June 2025).
  6. Barbhuiya, S.; Das, B.B.; Norman, P.; Qureshi, T. A comprehensive review of radiation shielding concrete: Properties, design, evaluation, and applications. Struct. Concr. 2024, 26, 1809–1855. [Google Scholar] [CrossRef]
  7. Chung, D.D.L. Materials for Electromagnetic Interference Shielding. Mater. Chem. Phys. 2020, 255, 123587. [Google Scholar] [CrossRef]
  8. Vrdoljak, I.; Rupčić, S.; Miličević, I.; Mandrić, V. Electromagnetic field propagation through a clay composite with antimony tin oxide (ATO) additive. In Proceedings of the 2022 International Conference on Electrical, Computer, Communications and Mechatronics Engineering (ICECCME 2022), Male, Maldives, 16–18 November 2022; Institute of Electrical and Electronics Engineers Inc.: New York, NY, USA, 2022; Volume 5, pp. 1–5. [Google Scholar] [CrossRef]
  9. Brdarić, J.; Vrdoljak, I.; Rupčić, S.; Marković, B.; Miličević, I.; Mandrić, V.; Varevac, D.; Tatar, D.; Filipović, N.; Szenti, I.; et al. The Effect of Different Nanomaterials Additions in Clay-Based Composites on Electromagnetic Transmission. Materials 2022, 15, 5115. [Google Scholar] [CrossRef]
  10. Chung, D.D.L. Electromagnetic interference shielding effectiveness of carbon materials. Carbon 2001, 39, 279–285. [Google Scholar] [CrossRef]
  11. Shukla, V. Review of electromagnetic interference shielding materials fabricated by iron ingredients. Nanoscale Adv. 2019, 1, 1640–1671. [Google Scholar] [CrossRef] [PubMed]
  12. Wang, G.; Zhang, X.; Guo, J.; Zhao, H. Magnetite (Fe3O4)-based nanocomposites for electromagnetic wave absorption. Materials 2020, 13, 4282. [Google Scholar] [CrossRef]
  13. Zhou, X.; Liu, P.; Zong, Y.; Zhao, M.; Liu, Z. Polymer-based composites with Fe3O4 nanoparticles for electromagnetic interference shielding. Compos. Part B Eng. 2021, 223, 109123. [Google Scholar] [CrossRef]
  14. Wanasinghe, D.; Aslani, F.; Ma, G.; Habibi, D. Review of Polymer Composites with Diverse Nanofillers for Electromagnetic Interference Shielding. Nanomaterial 2020, 10, 541. [Google Scholar] [CrossRef] [PubMed]
  15. Wu, J.; Chung, D.D. Combined Use of Magnetic and Electrically Conductive Fillers in a Polymer Matrix for Electromagnetic Interference Shielding. J. Electron. Mater. 2008, 37, 1088–1094. [Google Scholar] [CrossRef]
  16. Zhang, X.; Sun, W. Microwave absorbing properties of double-layer cementitious composites containing Mn-Zn ferrite. Cem. Concr. Compos. 2010, 32, 726–730. [Google Scholar] [CrossRef]
  17. Xie, Y.; Liu, B.; Yin, J.; Zhou, S. Optimum mix parameters of high-strength self-compacting concrete with ultrapulverized fly ash. Cem. Concr. Res. 2002, 32, 477–480. [Google Scholar] [CrossRef]
  18. Azadmanjiri, J.; Simon, G.P.; Suzuki, K.; Selomulya, C.; Cashion, J.D. Phase reduction of coated maghemite (γ-Fe2O3) nanoparticles under microwave-induced plasma heating for rapid heat treatment. J. Mater. Chem. 2012, 22, 617–625. [Google Scholar] [CrossRef]
  19. Yun, J.; Kim, H.-I. Electromagnetic interference shielding effects of polyaniline-coated multi-wall carbon nanotubes/maghemite nanocomposites. Polym. Bull. 2012, 68, 561–573. [Google Scholar] [CrossRef]
  20. Kong, L.; Yin, X.; Zhang, Y.; Yuan, X.; Li, Q.; Ye, F.; Cheng, L.; Zhang, L. Electromagnetic wave absorption properties of reduced graphene oxide modified by maghemite colloidal nanoparticle clusters. J. Phys. Chem. C 2013, 117, 19701–19711. [Google Scholar] [CrossRef]
  21. Sun, H.; Liu, X.; Liu, B.; Yin, Z. Preparation and properties of antimony doped tin oxide nanopowders and their conductivity. Mater. Res. Bull. 2016, 83, 354–359. [Google Scholar] [CrossRef]
  22. Mettler Toledo GmbH. STARe Software, Version 11.04; Mettler Toledo GmbH: Schwerzenbach, Switzerland, 2009.
  23. ImageJ Software. Available online: https://imagej.net/ij/ij/index.html (accessed on 20 August 2024).
  24. Shekhawat, M.S. Thermo Gravimetric and Differential Thermal Analysis of Clay of Western Rajasthan (India). Int. J. Mod. Phys. Conf. Ser. 2013, 22, 458–465. [Google Scholar] [CrossRef]
  25. McCormick, J.R.; Zhao, B.; Rykov, S.; Wang, H.; Chen, J.G. Thermal Stability of Flame-Synthesized Anatase TiO2 Nanoparticles. J. Phys. Chem. B 2004, 108, 17398–17402. [Google Scholar] [CrossRef]
  26. Mazeina, L.; Navrotsky, A. Enthalpy of Water Adsorption and Surface Enthalpy of Goethite (α-FeOOH) and Hematite (α-Fe2O3). Chem. Mater. 2007, 19, 825–833. [Google Scholar] [CrossRef]
  27. Abduh, N.A.Y.; Al-Kathani, A.; Algarni, T.S. Selective Oxidation of Tetrahydrofuran to Gamma-Butyrolactone over Spinel ZnFe2O4 Nanoparticle Catalyst. Catalysts 2023, 13, 692. [Google Scholar] [CrossRef]
  28. Singh, R.; Gupta, S.; Das, B. Synthesis and structural/microstructural characteristics of antimony doped tin oxide. arXiv 2011, arXiv:1107.1807v1. [Google Scholar] [CrossRef]
  29. Takeda, H.; Kudoh, Y. Single-crystal X-ray diffraction study on the bond compressibility of fayalite (Fe2SiO2) and rutile (TiO2) under high pressure. Phys. B+C 1986, 139–140, 333–336. [Google Scholar] [CrossRef]
  30. Djerdj, I.; Tonejc, A.M. Structural Investigations of Nanocrystalline TiO2 Samples. J. Alloys Compd. 2006, 413, 159–174. [Google Scholar] [CrossRef]
  31. Hill, A.H.; Jiao, F.; Bruce, P.G.; Harrison, A.; Kockelmann, W.; Ritter, C. Neutron Diffraction Study of Mesoporous and Bulk Hematite, α-Fe2O3. Chem. Mater. 2008, 20, 4891–4899. [Google Scholar] [CrossRef]
  32. Rykov, A.I.; Tkacova, K.; Šepelák, V. Structural disordering of spinel ferrites induced by mechanical activation. Cryst. Res. Technol. 1993, 28, 53–56. [Google Scholar] [CrossRef]
  33. Monrós, G.; Forés, A.; Badenes, J.A.; Llusar, M.; Sorlí, S.; Tena, M.A. Synthesis and characterization of chromium–tin oxide pigments obtained from the Cr2O3–SnO2 system. Z. Für Anorg. Und Allg. Chem. 2005, 631, 2188–2191. [Google Scholar] [CrossRef]
  34. Wyckoff, R.W.G. IX. Die Kristallstruktur von β-Cristobalit SiO2 (bei hohen Temperaturen stabile Form). Z. Für Krist. Cryst. Mater. 1925, 62, 189–200. [Google Scholar] [CrossRef]
  35. Pecharroman, C.; Gonzalez-Carreno, T.; Iglesias, J.E. The infrared dielectric properties of maghemite, gamma-Fe2O3, from reflectance measurement on pressed powders Sample: A idealized. Phys. Chem. Miner. 1995, 22, 21–29. [Google Scholar] [CrossRef]
  36. Julius, O.E.; Ola, O.V.; Onesmus, O.O. Characterization and Utilization of Clays from Origo and Awo, Southwestern Nigeria. Malays. J. Geosci. 2019, 3, 52–58. [Google Scholar] [CrossRef]
  37. García Ten, J.; Orts, M.J.; Saburit, A.; Silva, G. Thermal conductivity of traditional ceramics. Part I: Influence of bulk density and firing temperature. Ceram. Int. 2010, 36, 1951–1959. [Google Scholar] [CrossRef]
  38. Jaković, M.; Slaviček, I. Analiza Toplinskih Svojstava Građevnih Materijala Primjenom Metode Vrućeg Diska; University of Zagreb: Zagreb, Croatia, 2010; p. 94. [Google Scholar]
  39. Tehnički Propis o Racionalnoj Uporabi Energije i Toplinskoj Zaštiti u Zgradama. Available online: https://narodnenovine.nn.hr/clanci/sluzbeni/dodatni/438515.pdf (accessed on 20 July 2023).
  40. HRN EN 1745:2012 Zidovi i Proizvodi za Zidanje–Metode Određivanja Toplinskih Svojstava. Available online: https://narodne-novine.nn.hr/clanci/sluzbeni/2008_09_110_3240.html (accessed on 20 July 2023).
  41. Dondi, M.; Mazzanti, F.; Principi, P.; Raimondo, M.; Zanarini, G. Thermal Conductivity of Clay Bricks. J. Mater. Civ. Eng. 2004, 16, 8–14. [Google Scholar] [CrossRef]
  42. Gualtieri, M.L.; Gualtieri, A.; Gagliardi, S.; Ruffini, P.; Ferrari, R.; Hanuskova, M. Thermal conductivity of fired clays: Effects of mineralogical and physical properties of the raw materials. Appl. Clay Sci. 2010, 49, 269–275. [Google Scholar] [CrossRef]
  43. HRN ISO 8302:1998 Toplinska Izolacija–Mjerenje Toplinskog Otpora i Srodnih Veličina u Ustaljenom Stanju–Pločasti Uređaj sa Zaštićenom Vrućom Pločom. Available online: https://repozitorij.hzn.hr/norm/HRN+ISO+8302%3A1998 (accessed on 28 July 2023).
  44. Gashti, M.P.; Eslami, S. Optical and electromagnetic characteristics of clay–iron oxide nanocomposites. Res. Chem. Intermed. 2011, 37, 771–784. [Google Scholar] [CrossRef]
  45. Momma, K.; Izumi, F. VESTA 3 for three-dimensional visualization of crystal, volumetric and morphology data. J. Appl. Crystallogr. 2011, 44, 1272–1276. [Google Scholar] [CrossRef]
  46. Titanium Dioxide Polymorphs: Rutile vs. Anatase. Available online: https://www.samaterials.com/titanium-dioxide-polymorphs-rutile-vs-anatase.html (accessed on 26 August 2025).
  47. Bunea, G.; Alexa-Stratulat, S.-M.; Mihai, P.; Toma, I.-O. Use of Clay and Titanium Dioxide Nanoparticles in Mortar and Concrete—A State-of-the-Art Analysis. Coatings 2023, 13, 506. [Google Scholar] [CrossRef]
  48. Lu, L.; He, Y.; Ping, B.; Wang, F.; Hu, S. TiO2 containing electromagnetic wave absorbing aggregate and its application in concrete. Constr. Build. Mater. 2017, 134, 602–609. [Google Scholar] [CrossRef]
  49. Li, Z.; Dong, S.; Wang, X.; Yu, X.; Han, B. Electromagnetic Wave-Absorbing Property and Mechanism of Cementitious Composites with Different Types of Nano Titanium Dioxide. J. Mater. Civ. Eng. 2020, 32, 04020073. [Google Scholar] [CrossRef]
  50. Chicot, D.; Mendoza, J.; Zaoui, A.; Louis, G.; Lepingle, V.; Roudet, F.; Lesage, J. Mechanical Properties of Magnetite (Fe3O4), Hematite (α-Fe2O3) and Goethite (α-FeOOH) by Instrumented Indentation and Molecular Dynamics Analysis. Mater. Chem. Phys. 2011, 129, 862–870. [Google Scholar] [CrossRef]
  51. Wu, W.; Wu, Z.; Yu, T.; Jiang, C.; Kim, W.S. Recent Progress on Magnetic Iron Oxide Nanoparticles: Synthesis, Surface Functional Strategies and Biomedical Applications. Sci. Technol. Adv. Mater. 2015, 16, 023501. [Google Scholar] [CrossRef]
  52. Sayyed, M.I.; Almousa, N.; Elsafi, M. Preparation of Mortar with Fe2O3 Nanoparticles for Radiation Shielding Application. Coatings 2022, 12, 1329. [Google Scholar] [CrossRef]
  53. Zhang, Z.Q.; Yang, C.S.; Cheng, H.; Huang, X.H.; Zhu, Y.H. The Electromagnetic Wave Absorption Performance and Mechanical Properties of Cement-Based Composite Material Mixed with Functional Aggregates with High Fe2O3 and SiC. Rev. Compos. Matér. Adv.-J. Compos. Adv. Mater. 2021, 31, 249–255. [Google Scholar] [CrossRef]
  54. Ng, J.P.S.; Sum, Y.L.; Soong, B.H.; Maier, M.; Monteiro, P.J.M. Electromagnetic Wave Propagation through Composite Building Materials in Urban Environments at Mid-Band 5G Frequencies. IET Microw. Antennas Propag. 2022, 16, 627–638. [Google Scholar] [CrossRef]
  55. Ng, J.P.S.; Sum, Y.L.; Soong, B.H.; Monteiro, P.J.M. Effects of Iron (III) Oxide-Enhanced Building Materials on RF Communications. In Proceedings of the 2022 IEEE Region 10 Conference (TENCON), Hong Kong, China, 1–4 November 2022; pp. 1–6. [Google Scholar] [CrossRef]
  56. Ostermann, R.; Zieba, R.; Rudolph, M.; Schlettwein, D.; Smarsly, B.M. Electrospun Antimony-Doped Tin Oxide (ATO) Nanofibers as a Versatile Conducting Matrix. Chem. Commun. 2011, 47, 12119–12121. [Google Scholar] [CrossRef] [PubMed]
  57. Englund, S.; Kubart, T.; Keller, J.; Scragg, J.J.S.; Platzer-Björkman, C. Antimony-Doped Tin Oxide as Transparent Back Contact in Cu2ZnSnS4 Thin-Film Solar Cells. Phys. Status Solidi (A) 2019, 216, 1900542. [Google Scholar] [CrossRef]
  58. Rani, J.; Sood, S.; Sharma, A. Tin Oxide for Optoelectronic, Photovoltaic and Energy Storage Devices: A Review. J. Mater. Chem. A 2021, 9, 15754–15799. [Google Scholar] [CrossRef]
  59. Koebel, M.M.; Nadargi, D.Y.; Jimenez-Cadena, G.; Romanyuk, Y.E. Transparent, Conducting ATO Thin Films by Epoxide-Initiated Sol–Gel Chemistry: A Highly Versatile Route to Mixed-Metal Oxide Films. ACS Appl. Mater. Interfaces 2012, 4, 2464–2473. [Google Scholar] [CrossRef] [PubMed]
  60. Halim, A.; Gerhardt, R.A. Thin Films Made from Colloidal Antimony Tin Oxide Nanoparticles for Transparent Conductive Applications. MRS Proc. 2013, 1494, 61–66. [Google Scholar] [CrossRef]
  61. Reddy, N.P.; Muniramaiah, R.; Santhosh, R.; Fernandes, J.M.; Padmanaban, D.B.; Maharana, G.; Kovendhan, M.; Joseph, D.P.; Murali, B. Cost-Effective Sb-Doped SnO2 Films as Stable and Efficient Alternative Transparent Con-ducting Electrodes for Dye-Sensitized Solar Cells. J. Mater. Chem. C 2022, 10, 7997–8008. [Google Scholar] [CrossRef]
  62. Ramanathan, R.; Nagarajan, S.; Sanhiyamoorthy, S.; Manavaimaran, B.; Barshilia, H.C.; Mallik, R.C. A highly sensitive and room temperature ethanol gas sensor based on spray deposited Sb doped SnO2 thin films. Mater. Adv. 2024, 5, 293–305. [Google Scholar] [CrossRef]
  63. Kostishin, V.G.; Isaev, I.M.; Salogub, D.V. Radio-Absorbing Magnetic Polymer Composites Based on Spinel Ferrites: A Review. Polymers 2024, 16, 1003. [Google Scholar] [CrossRef]
  64. Ochmann, M.; Vrba, V.; Kopp, J.; Ingr, T.; Malina, O.; Machala, L. Microwave-Enhanced Crystalline Properties of Zinc Ferrite Nanoparticles. Nanomaterials 2022, 12, 2987. [Google Scholar] [CrossRef]
  65. Lorenz, M.; Brandt, M.; Mexner, K.; Brachwitz, K.; Ziese, M.; Esquinazi, P.; Hochmuth, H.; Grundmann, M. Ferri-magnetic ZnFe2O4 Thin Films on SrTiO3 Single Crystals with Highly Tunable Electrical Conductivity. Phys. Status Solidi (RRL) 2011, 5, 438–440. [Google Scholar] [CrossRef]
  66. Xu, J.; Jiang, Y.; Ye, Z.-G.; Xie, Z.; Zheng, L. Partially Inverse Spinel ZnFe2O4 with High Saturation Magnetization Synthesized via a Molten Salt Route. Appl. Phys. Lett. 2011, 99, 202505. [Google Scholar] [CrossRef]
  67. Rani, A.; Yadav, A.; Kumar, R.; Singh, D.; Yadav, R.S. Effect of Fuel Type and Synthesis Temperature on Magnetic Properties of ZnFe2O4 Nanomaterials Synthesized by Sol–Gel Method. J. Sol-Gel Sci. Technol. 2024, 111, 783–793. [Google Scholar] [CrossRef]
  68. Abu Ayana, Y.M.; El-Sawy, S.M.; Salah, S.H. Zinc–Ferrite Pigment for Corrosion Protection. Anti-Corros. Methods Mater. 1997, 44, 381–388. [Google Scholar] [CrossRef]
  69. Li, X.; Kang, Q.; Zhou, C. Research on Absorbing Properties of the Concrete Shielding Material at 3 mm Wave Bands. In Proceedings of the Asia-Pacific Conference on Environmental Electromagnetics (CEEM 2003), Hangzhou, China, 4–7 November 2003; pp. 536–540. [Google Scholar] [CrossRef]
  70. Meng, X.; Xu, W.; Ren, X.; Zhu, M. Progress and Challenges of Ferrite Matrix Microwave Absorption Materials. Materials 2024, 17, 2315. [Google Scholar] [CrossRef] [PubMed]
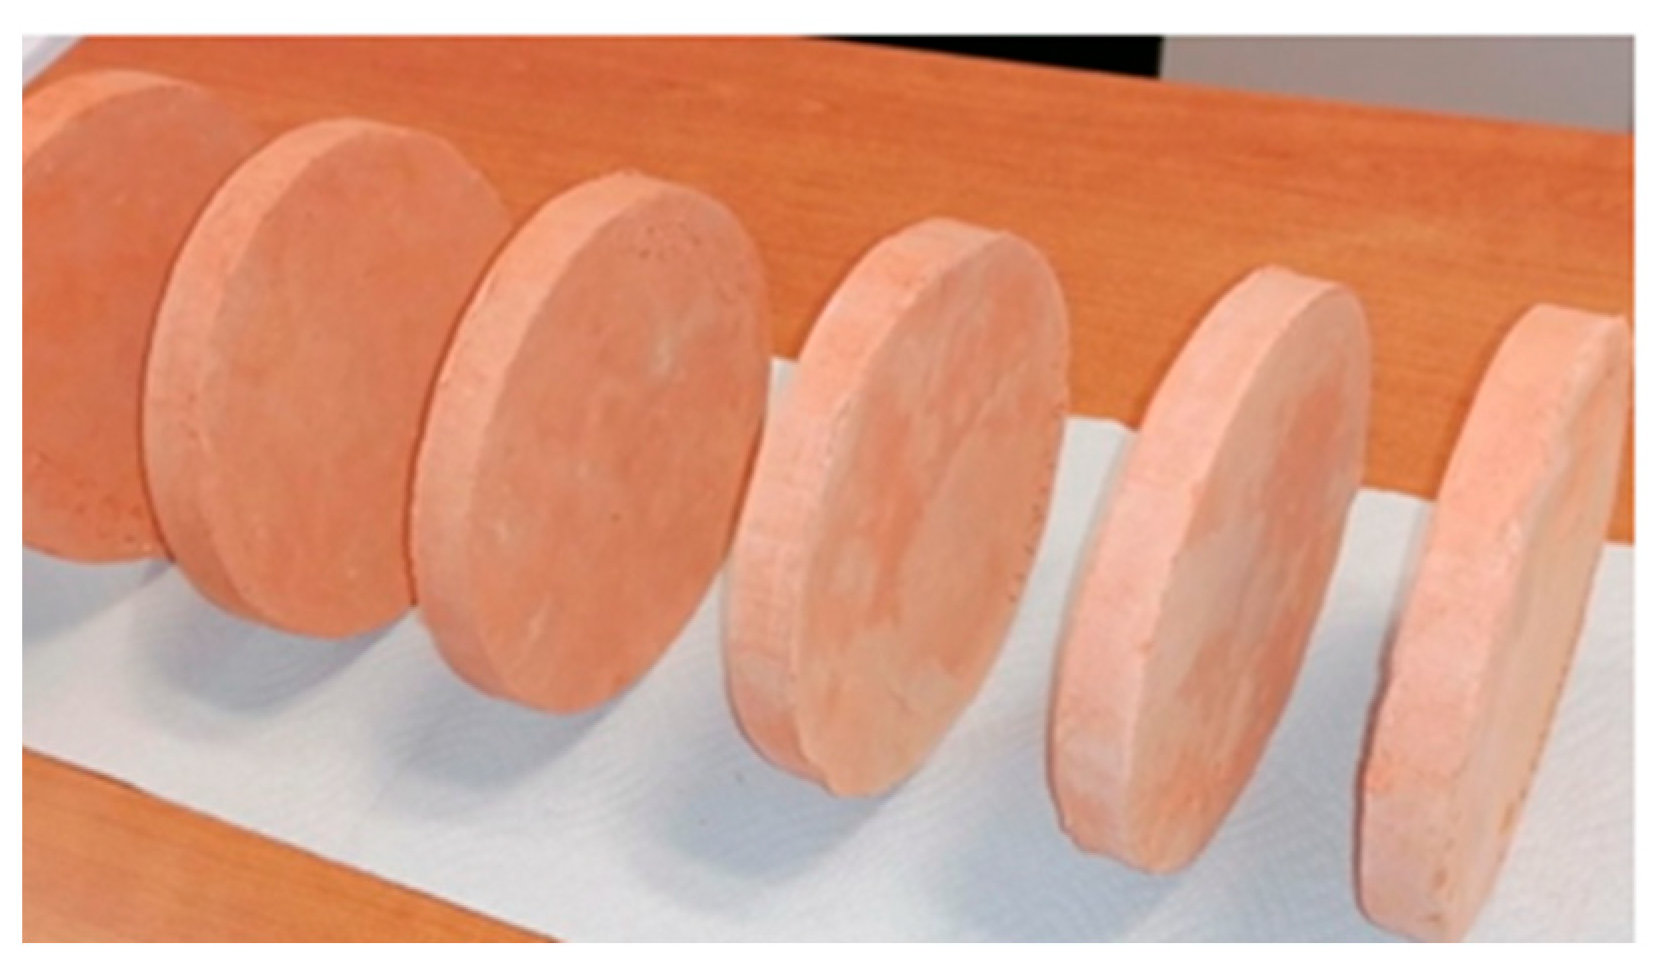
Figure 1. Composite clay disks after heat treatment, in preparation for further testing.
Crystals 15 00959 g001
Figure 2. Schematic of the device used to measure electromagnetic radiation, consisting of two antennas (Antenna 1 and Antenna 2), a spectrum analyzer, and a carrier containing the sample.
Crystals 15 00959 g002
Figure 3. Scheme of the electromagnetic radiation measurement system with the coefficients shown: output signals I01 and I02, reflections S11 and S22, and transmissions S21 and S12.
Crystals 15 00959 g003
Figure 4. Thermogravimetric curve showing mass loss as a function of temperature for: (a) clay; (b) TiO2 R050, rutile; (c) TiO2 A050, anatase, including the inserted DSC curve; (d) γ Fe2O3; (e) ZnFe2O4; and (f) Sb2O3∙SnO2.
Crystals 15 00959 g004
Figure 5. Scanning electron microscopy (SEM) micrograph of the pure clay sample, magnification (a) 300× and (b) 2000×.
Crystals 15 00959 g005
Figure 6. Scanning electron microscopy (SEM) micrographs of the following samples: (a) TiO2 A050 (anatase, 50 nm, magnification 200,000×); (b) TiO2 R050 (rutile, 50 nm, magnification 200,000×); (c) γ-Fe2O3 (magnification 150,000×); (d) ZnFe2O4 (magnification 200,000×); and (e) Sb2O3·SnO2 (magnification 200,000×).
Crystals 15 00959 g006
Figure 7. Rietveld refinement plots of the (a) rutile (TiO2 R050), (b) anatase (TiO2 A050), (c) γ–Fe2O3, (d) ZnFe2O4, and (e) Sb2O3∙SnO2. The observed (), calculated (), and difference plots () for the fit to the PXRD patterns are shown.
Crystals 15 00959 g007
Figure 8. Graphical representation of thermal conductivity (λ) measurements for the clay sample.
Crystals 15 00959 g008
Figure 9. The frequency dependence of the transmission coefficients (S21) for clay (a), 3 and 5 wt.% TiO2 R050 (b,c), TiO2 A050 (d,e), Fe2O3 (f,g), ZnFe2O4 (h,i), and Sb2O3∙SnO2 (j,k).
Crystals 15 00959 g009
Figure 10. Graphical representation of the frequency dependence of the absolute value of absorption (|A|) for clay (a), 3 and 5 wt.% TiO2 R050 (b,c), TiO2 A050 (d,e), Fe2O3 (f,g), ZnFe2O4 (h,i), and Sb2O3∙SnO2 (j,k).
Crystals 15 00959 g010
Table 1. Materials used in the experimental work.
MaterialChemical FormulaManufacturer
Clay-Wienerberger, Đakovo, Croatia
Titanium dioxide R050TiO2 (rutile)MK Nano, Canada
Titanium dioxide A050TiO2 (anatase)
Iron(III) oxideγ-Fe2O3Iolitec, Germany
Zinc FerriteZnFe2O4Nanografi, Turkey
Antimony(III) Tin(IV) oxide (ATO)Sb2O3·SnO2EPRUI, China
Table 2. Specific surface area and calculated particle size of the materials based on B.E.T. data and particle size determined from electron microscopy micrographs using ImageJ software (1.54r) [23].
MaterialsSpecific Surface Area/m2g−1Particle Size/nm *Particle Size/nm ***
Clay39****
TiO2 R050255074 ± 13
TiO2 A050645042 ± 7
γ-Fe2O3393049 ± 7
ZnFe2O4741545 ± 8
Sb2O3·SnO2605024 ± 5
* Manufacturer’s data; ** Supplied in blocks and mechanically ground; therefore, the specific surface area depends on the processing method. *** Data determined by measuring 20 particles from electron microscopy micrographs using ImageJ software [23].
Table 3. Mineralogical composition of the clay sample as determined by ED–XRF.
Clay
Oxideswt.%
SiO264.73
Al2O322.70
CaO2.40
Fe2O34.59
SO30.06
MgO1.39
K2O2.16
Na2O1.02
TiO20.96
MnO0.01
P2O5<0.01
Table 4. Measured thermal conductivity values (λ) and corresponding calculated thermal resistance values (R) for clay and composite samples.
Samplewt.%λ (W m−1 K−1)R (m2 K/W)
Clay 0.2146 ± 0.0100.0890
TiO2—anatase 30.2002 ± 0.0060.0962
50.1970 ± 0.0090.0987
TiO2—rutile30.2231 ± 0.0060.0848
50.2458 ± 0.0130.0773
ZnFe2O430.2187 ± 0.0040.0853
50.2279 ± 0.0040.083
γ-Fe2O330.2305 ± 0.0090.0835
50.2208 ± 0.0030.0864
Sb2O3·SnO230.2185 ± 0.0110.0866
50.2656 ± 0.0100.0737
Table 5. Integrated area under S21 curves (Figure 9) in the specific frequency ranges (2G–5G).
Samplewt.%2G Area
(1.75–1.85 GHz)
3G Area
(2.10–2.30 GHz)
4G Area
(2.60–2.70 GHz)
5G Area
(3.40–3.80 GHz)
Clay 1.1561.5481.0652.428
TiO2 R05032.2943.2431.4113.465
52.0842.1881.5015.408
TiO2 A05032.3673.3791.4713.988
51.5772.5691.3425.725
Fe2O332.4163.3311.4343.009
52.1342.3440.8153.737
ZnFe2O432.4083.3471.5133.628
51.9822.2930.8814.323
Sb2O3·SnO232.3123.3771.4623.478
51.8613.2781.6165.624
Table 6. Integrated area under |A| curves (Figure 10) in the specific frequency ranges (2G–5G).
Samplewt.%2G Area
(1.75–1.85 GHz)
3G Area
(2.10–2.30 GHz)
4G Area
(2.60–2.70 GHz)
5G Area
(3.40–3.80 GHz)
Clay 0.4950.6280.3631.857
TiO2 R05030.1810.4340.1670.643
50.1760.4690.1210.492
TiO2 A05030.1810.4670.1690.735
50.1760.5580.1630.641
Fe2O330.1800.4550.1690.733
50.1670.4820.2720.545
ZnFe2O430.1770.4320.1600.553
50.1090.2150.0930.220
Sb2O3·SnO230.1780.4760.1570.596
50.1510.2760.1430.281
Disclaimer/Publisher’s Note: The statements, opinions and data contained in all publications are solely those of the individual author(s) and contributor(s) and not of MDPI and/or the editor(s). MDPI and/or the editor(s) disclaim responsibility for any injury to people or property resulting from any ideas, methods, instructions or products referred to in the content.