1. Introduction
GH3535 alloy (also known as Hastelloy N alloy) is a nickel-based superalloy. Owing to its excellent high-temperature stability and resistance to molten salt corrosion, it has been successfully applied in the fabrication of pressure vessel components for the fourth-generation thorium-based molten salt reactor (TMSR) [
1,
2,
3]. Given the large dimensions of components such as pressure vessels and pipelines, multiple forming processes are inevitably required during their manufacturing. For the fabrication of TMSR pressure vessel components, extensive welding processes are essential, and welded joints are thus unavoidable in these large-scale components [
4,
5].
Owing to thermal stress, coarse-grained structures, and potential welding pores in welded joints, the mechanical properties (e.g., tensile and creep properties) of such joints are inferior to those of the base metal (BM) [
6,
7,
8]. For instance, the mechanical properties of the heat-affected zone (HAZ) are typically weaker than those of the BM, primarily due to material softening caused by the evolution of the microstructure at high temperatures [
9,
10]. Additionally, the columnar grain microstructure of the deposited metal (DM) may also contribute to its compromised performance [
11,
12]. Furthermore, the heterogeneous structure of welded joints tends to induce phenomena such as deformation mismatch among different regions (i.e., BM, HAZ, and DM), which further impairs joint performance [
13,
14].
However, enhancing the mechanical performance of a specific welded joint is a complex challenge. Beyond selecting an appropriate welding method, numerous factors—such as improper welding parameters and the influence of welding wire composition—can induce various welding defects (e.g., welding cracks), which directly degrade joint performance. Additionally, even in welded joints without obvious defects, the deformation behavior of the joints themselves remains a complex issue. Although the base metal (BM) and deposited metal (DM) of the joint share broad chemical composition similarity, differences in their grain size, second-phase particles, and substructures introduce complexity into the deformation process [
15]. For example, when fractures consistently occur near the weld under specific loading conditions, critical considerations include whether to adopt a strengthening or toughening strategy for the DM, and how to select corresponding welding processes and parameters accordingly. Thus, investigating the deformation behavior of each region in welded joints facilitates the development of welding wires and the optimization of welding parameters, ultimately improving joint performance.
The digital image correlation (DIC) method is an effective technique for investigating strain concentration at the mesoscopic scale [
6,
16,
17,
18]. This characterization approach enables the analysis of deformation behavior in each region of welded joints during loading and provides strain distribution data for the base metal (BM), heat-affected zone (HAZ), and deposited metal (DM) throughout the deformation process [
19]. In this study, the deformation and fracture behaviors of GH3535 alloy welded joints (fabricated using a modified ERNiMo-2 welding wire) were investigated via DIC and complementary methods under room temperature (RT) and high-temperature conditions. The results facilitate a more precise understanding of the deformation and fracture mechanisms of GH3535 alloy welded joints, which in turn offer new insights for the subsequent composition design of welding wires and optimization of welding processes.
2. Experiment
The tension sample is prepared by cutting from the welded plate fabricated by automatic gas tungsten arc welding (GTAW), which is shown in
Figure 1a. The position of the sample cut from the welded plate is shown in
Figure 1b. The actual composition in weight percent of a modified ERNiMo-2 wire and GH3535 alloy is listed in
Table 1. The welding wire used here is a slightly modified version of the standard welding wire for the GH3535 alloy. Its silicon content is lower than that of the standard welding wire, and it has exhibited better weldability than the standard welding wire in previous experiments. The welding process is conducted with parameters as follows: welding current is 150 A, pulse frequency is 2.5 Hz, reference value/peak ratio is 50%, pulse peak duration is 50%, wire inputting speed is about 18 mm/s, welding speed is 1.5 mm/s, high purity argon gas flow rate is 15 L/min. The above parameters are adjusted based on the parameters from our previous study to obtain a smaller heat-affected zone for ease of observation, while ensuring no obvious welding defects are present [
20]. The hardness is obtained by a load of 5000 g and a dwell time of 15 s in a Vickers microhardness measurement. Mean and standard deviation are obtained after six hardness values for each position. The tension samples with 10 mm 4 mm parallel section and 1.6 mm thick are tested in a Zwick Z100 machine with a tension rate of 0.5 mm/min at RT and 700 °C.
With the intention of mapping the variation in strain and characterizing the mechanical performance of the weld zone and heat affected zone during deformation, the Digital Image Correlation (DIC) technique was resorted to during the tensile testing phase. Preceding the test, the tensile specimens were painted white initially and then furnished with a random black speckle pattern to permit data acquisition by the DIC. A high-resolution camera was engaged to capture pictures at a speed of three per second. The DIC equipment is the ACQ-3D manufactured by CSI. Subsequently, the vic-2D software 10.0.80 version was applied to analyze these pictures, aiming to provide two-dimensional strain maps. The tension tests at different temperatures were repeated three times with DIC observation. During the tensile process, DIC was also used as a video extensometer. At 700 °C, fractures all initiate from the deposited metal at a relatively far distance from the fusion line. At RT, fractures initiate twice in the deposited metal near the fusion line and once in the deposited metal at a certain distance from the fusion line. The selection of the smaller specimen sizes and the corresponding welding process is to take into account the applicability of the observation equipment as well as the actual need to observe the base metal, heat-affected zone, and deposited metal within the parallel section. The DIC observation is conducted with an acquisition rate of 1 Hz. The strain distribution of the DIC results after deformation is calculated by the 10.0.80 version calculation software of the Correlated Solutions Instrument. The EBSD sample is prepared by being electro-polished with 10% perchloric acid ethanol solution after grinding with sandpaper and diamond paste, then characterized in a Carl Zeiss Merlin Compact scanning electron microscope. After polishing the specimen of welded joint to a clean surface, it was immersed in a hydrofluoric acid-nitric acid mixed acid for etching. Once the reaction proceeded sufficiently, the solution was filtered to obtain fine precipitated phases. The precipitated phases were repeatedly rinsed until neutral, followed by drying treatment in preparation for subsequent testing. XRD results were obtained by extraction method in deposited metal samples at a Bruker D8 Advance machine. The test was conducted at a step size of 0.02° per 0.15 s and the tube current and voltage of the X-ray tube were set to 40 kV and 40 mA, respectively.
3. Results
Figure 1 illustrates the sample preparation process and hardness distribution along the parallel cross-section.
Figure 1a shows the gas tungsten arc welding (GTAW) equipment and the fabricated welded plate.
Figure 1b presents the location of the tensile specimens extracted from the welded plate. As indicated in
Figure 1c, the gauge section of each tensile specimen covers the base metal (BM), heat-affected zone (HAZ), and deposited metal (DM). Microhardness measurements around the fusion line (designated as the 0 position in
Figure 1d) reveal that the HAZ exhibits the highest hardness value. In the parallel cross-section of the tensile specimens, the deposited metal (DM) shows moderate hardness, while the base metal (BM) has the lowest hardness.
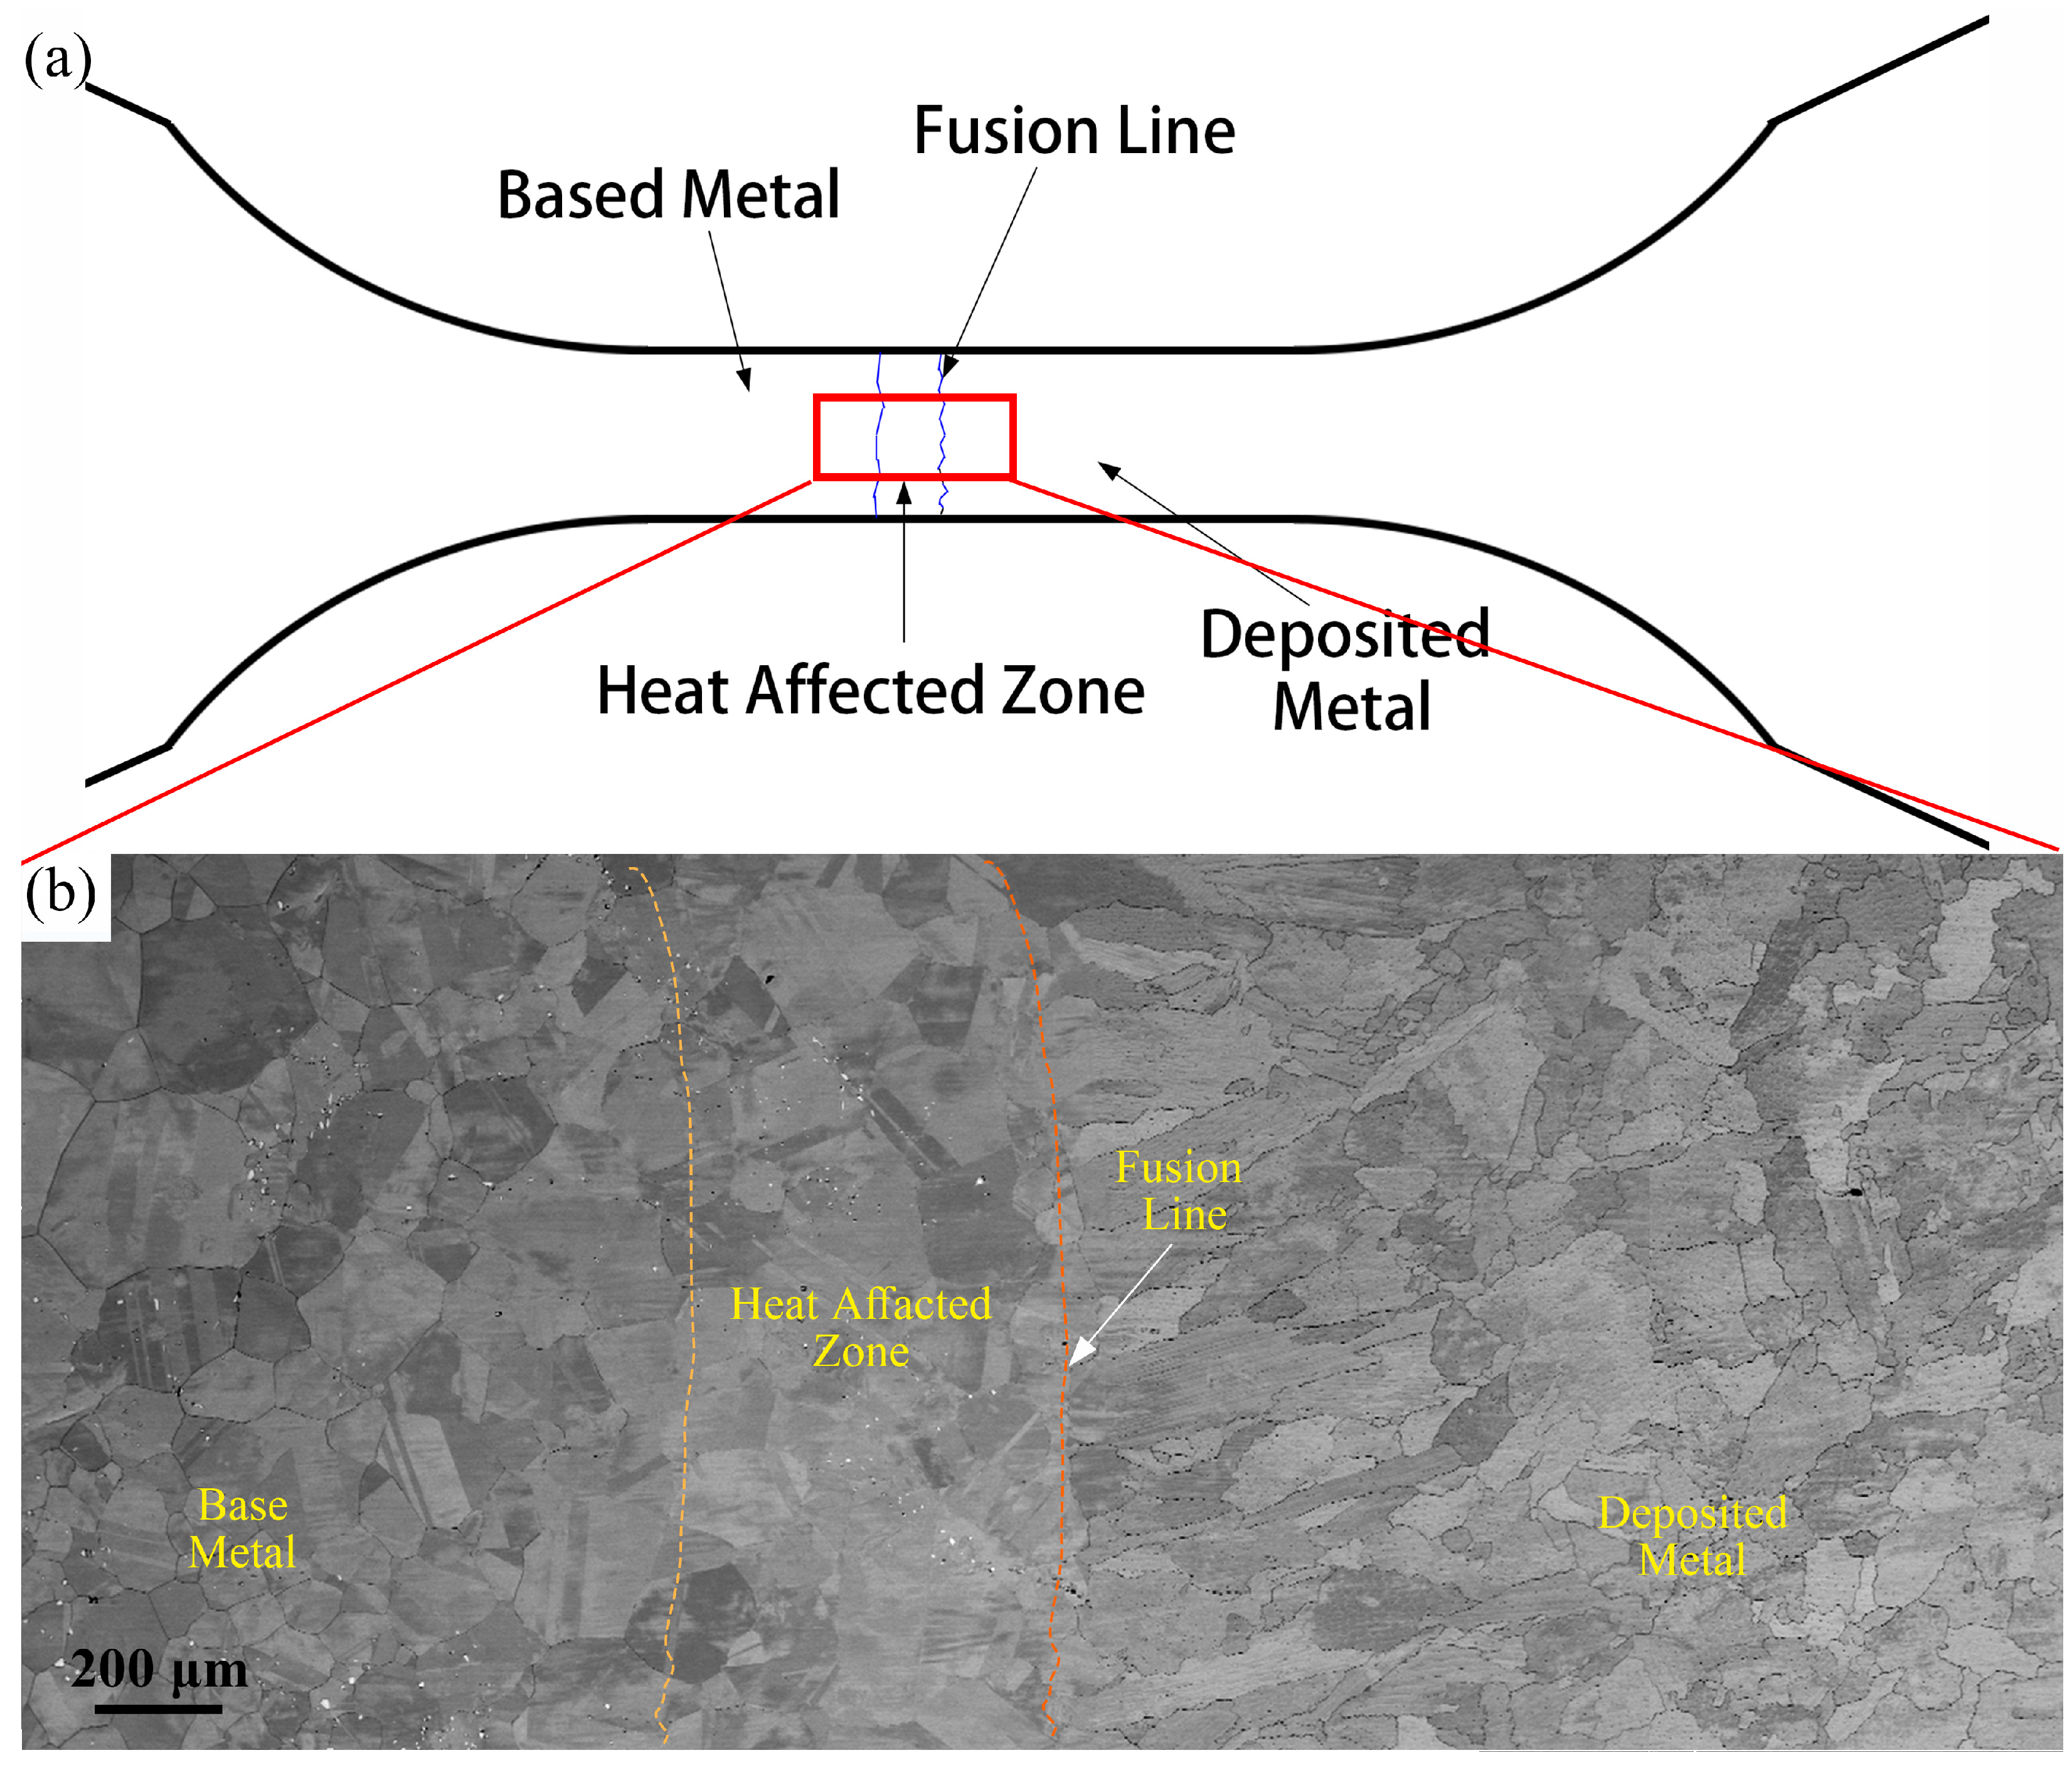
Figure 2 presents the microstructure near the fusion line of the as-welded joint.
Figure 2a shows a structural schematic of the welded joint specimen, while
Figure 2b is a stitched scanning electron microscopy (SEM) image of the joint, covering the base metal (BM), heat-affected zone (HAZ), fusion line (FL), and deposited metal (DM).
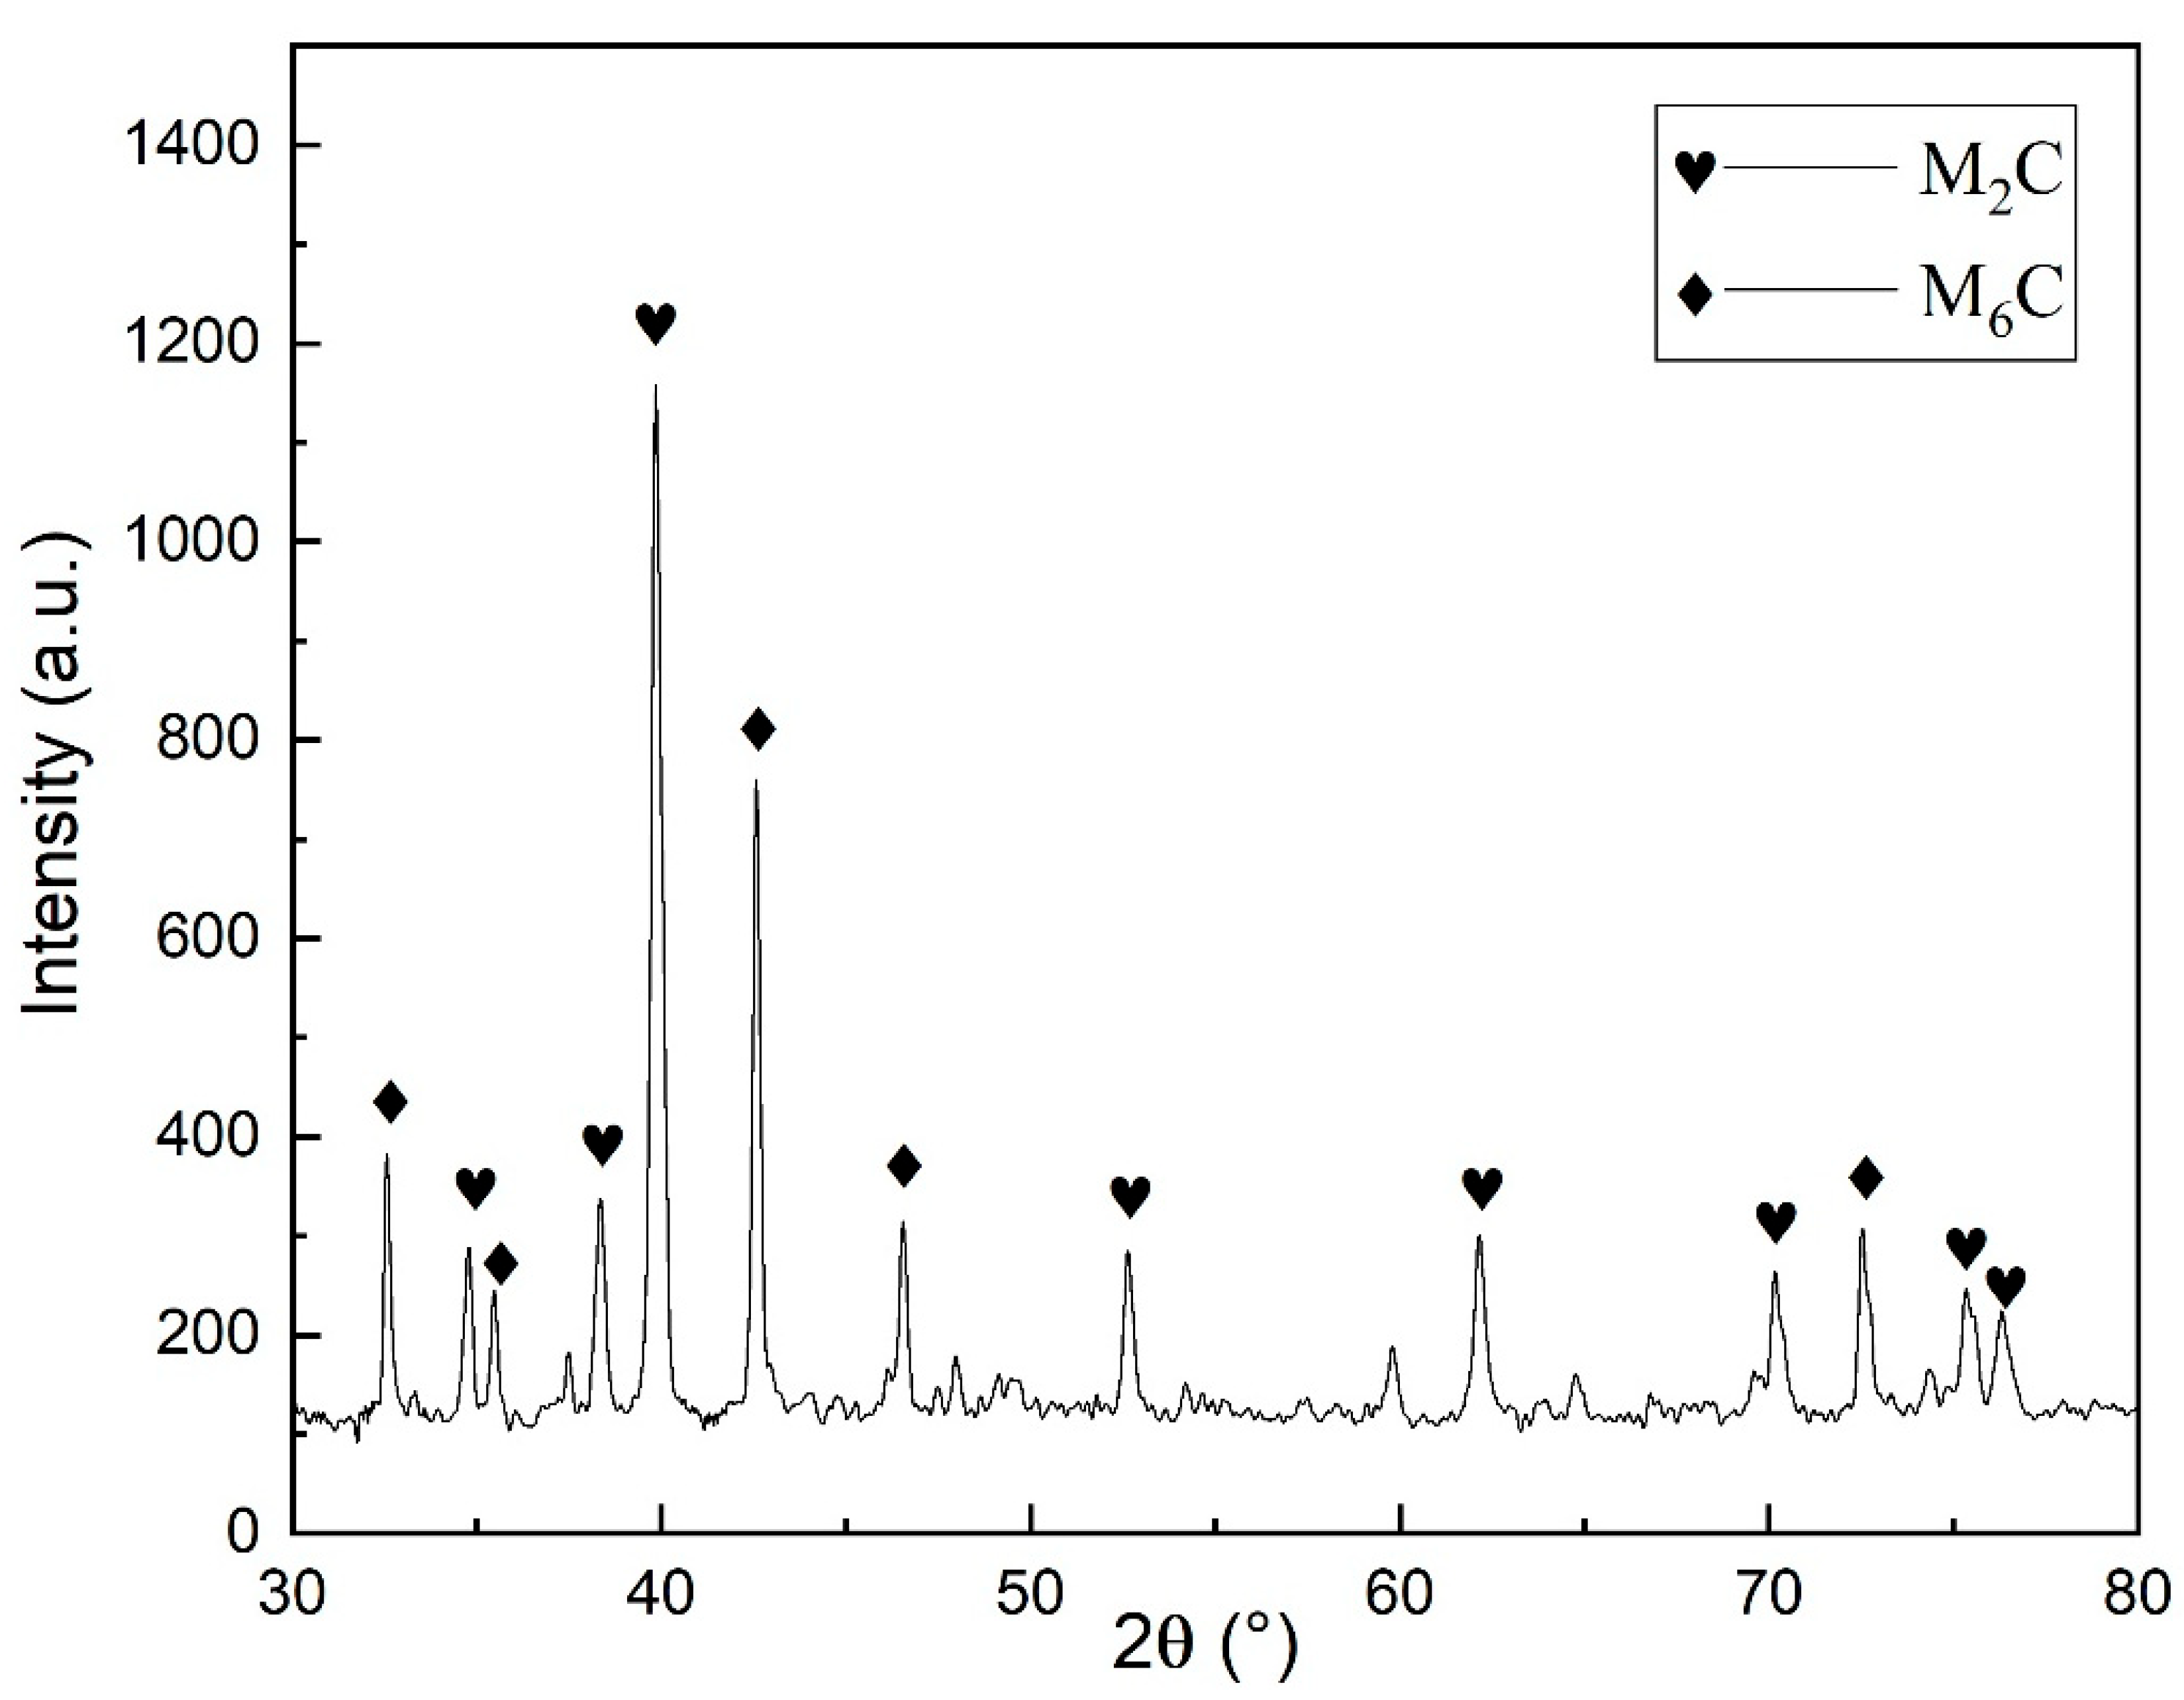
The XRD spectrum of welded joint is presented in
Figure 3. Due to the relatively low volume fraction of carbides, the extraction method was adopted in this study to obtain the XRD patterns of carbides in the samples. This method can avoid the situation where some precipitated phases cannot be detected by XRD due to their small quantity or fine size. It can be seen from the XRD patterns that the carbides in the welded joint are M
2C and M
6C.
Figure 4 exhibits the high-magnification microstructure of the three parts of the welded joint. Point analysis by EDS was carried out on the carbides and the matrix, and the corresponding analysis results are presented in
Table 2. As depicted in
Figure 4a, primary carbides are accompanied within grains of several tens of micrometers in the base metal part. Judging from the EDS results, it is identified as M
6C due to the enrichment of Si element and the relatively lower enrichment level of Mo element, which is in concordance with previous studies [
21]. The eutectic carbide in the vicinity of the fusion line in
Figure 4c can also be ascertained as M
6C for the same reason. The microstructure of the deposited metal in
Figure 4e consists of dendrites, which are several hundred micrometers in length. Eutectic carbides are present between these dendrites, and a small quantity of carbides can also be found within the grain boundaries. According to the previous research, the faint M
2C peak in the XRD result should be contributed by the minor amount of nano-carbides in the deposited metal as shown in
Figure 4f [
20].
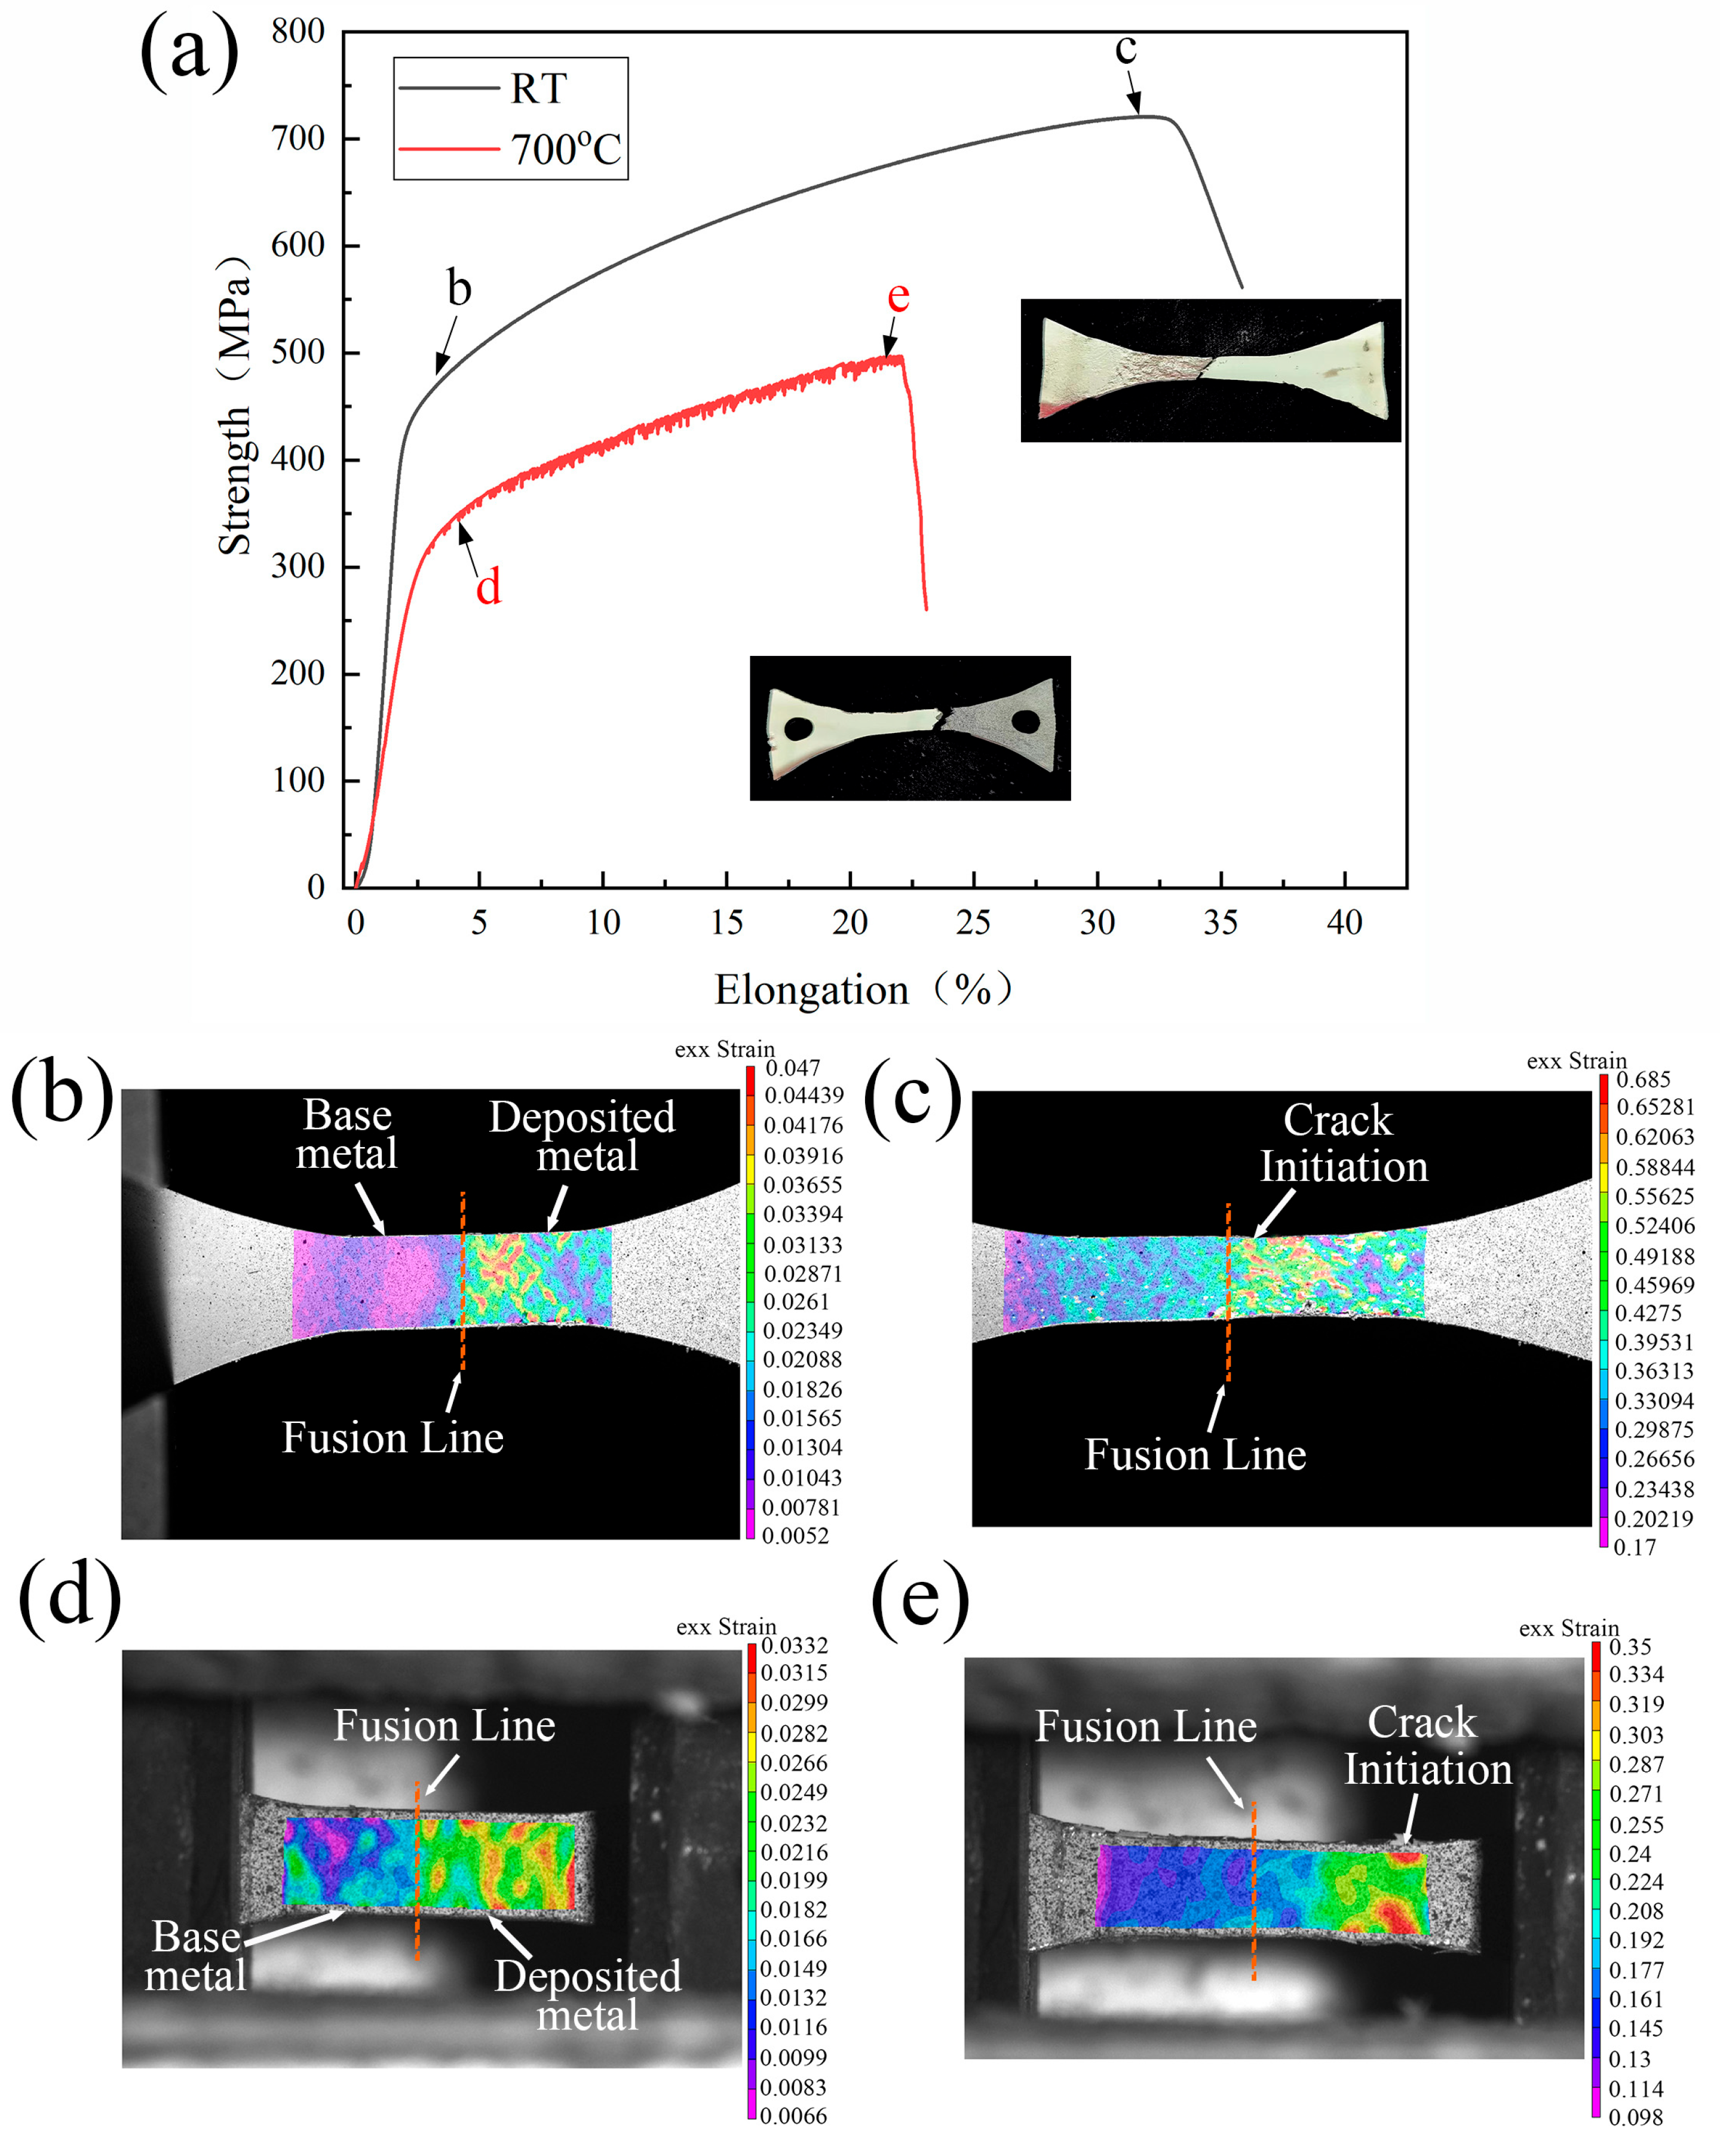
Figure 5a presents the tensile curves and post-test fractured specimens. The welded joints exhibit superior mechanical properties at room temperature (RT) compared to those at 700 °C. Specifically, at RT, the joints have a yield strength (YS) of 440 MPa, tensile strength (TS) of 720 MPa, and elongation (δ) of ~33%. In contrast, at 700 °C, the YS decreases to 330 MPa, TS drops to 500 MPa, and δ reduces to 22%. The RT-tested specimen fractured near the fusion line (FL) in the middle of the parallel gauge section, while the high-temperature-tested specimen fractured in the deposited metal (DM). The red dashed line marking the FL in
Figure 5b–e was determined by correlating the post-fracture microstructure location with speckle characteristics.
Figure 5b,c show the strain distribution of the welded joint specimen at two points marked on the RT tensile curve: near the yield point and prior to fracture. After yielding, strain concentration occurred in the middle of the specimen’s parallel gauge section. Microstructural observation and positioning confirmed that this strain concentration was very close to the FL, while regions farther from the FL showed lower deformation. During tensile testing, this strain concentration intensified, ultimately leading to fracture in the DM adjacent to the FL.
For the high-temperature tests (
Figure 5d,e), strain concentration was first observed in the DM near the yield point (marked on the tensile curve). As tension progressed, local strain remained concentrated in the DM, but the location of strain concentration and cracking was significantly distant from the FL. Compared with the RT tensile specimens, the base metal (BM) contributed far less to deformation at high temperatures, with deformation predominantly localized in the DM. This experiment directly observed the high-temperature softening behavior of the weld metal, providing direct evidence for subsequent ideas regarding the strengthening of welded joints.
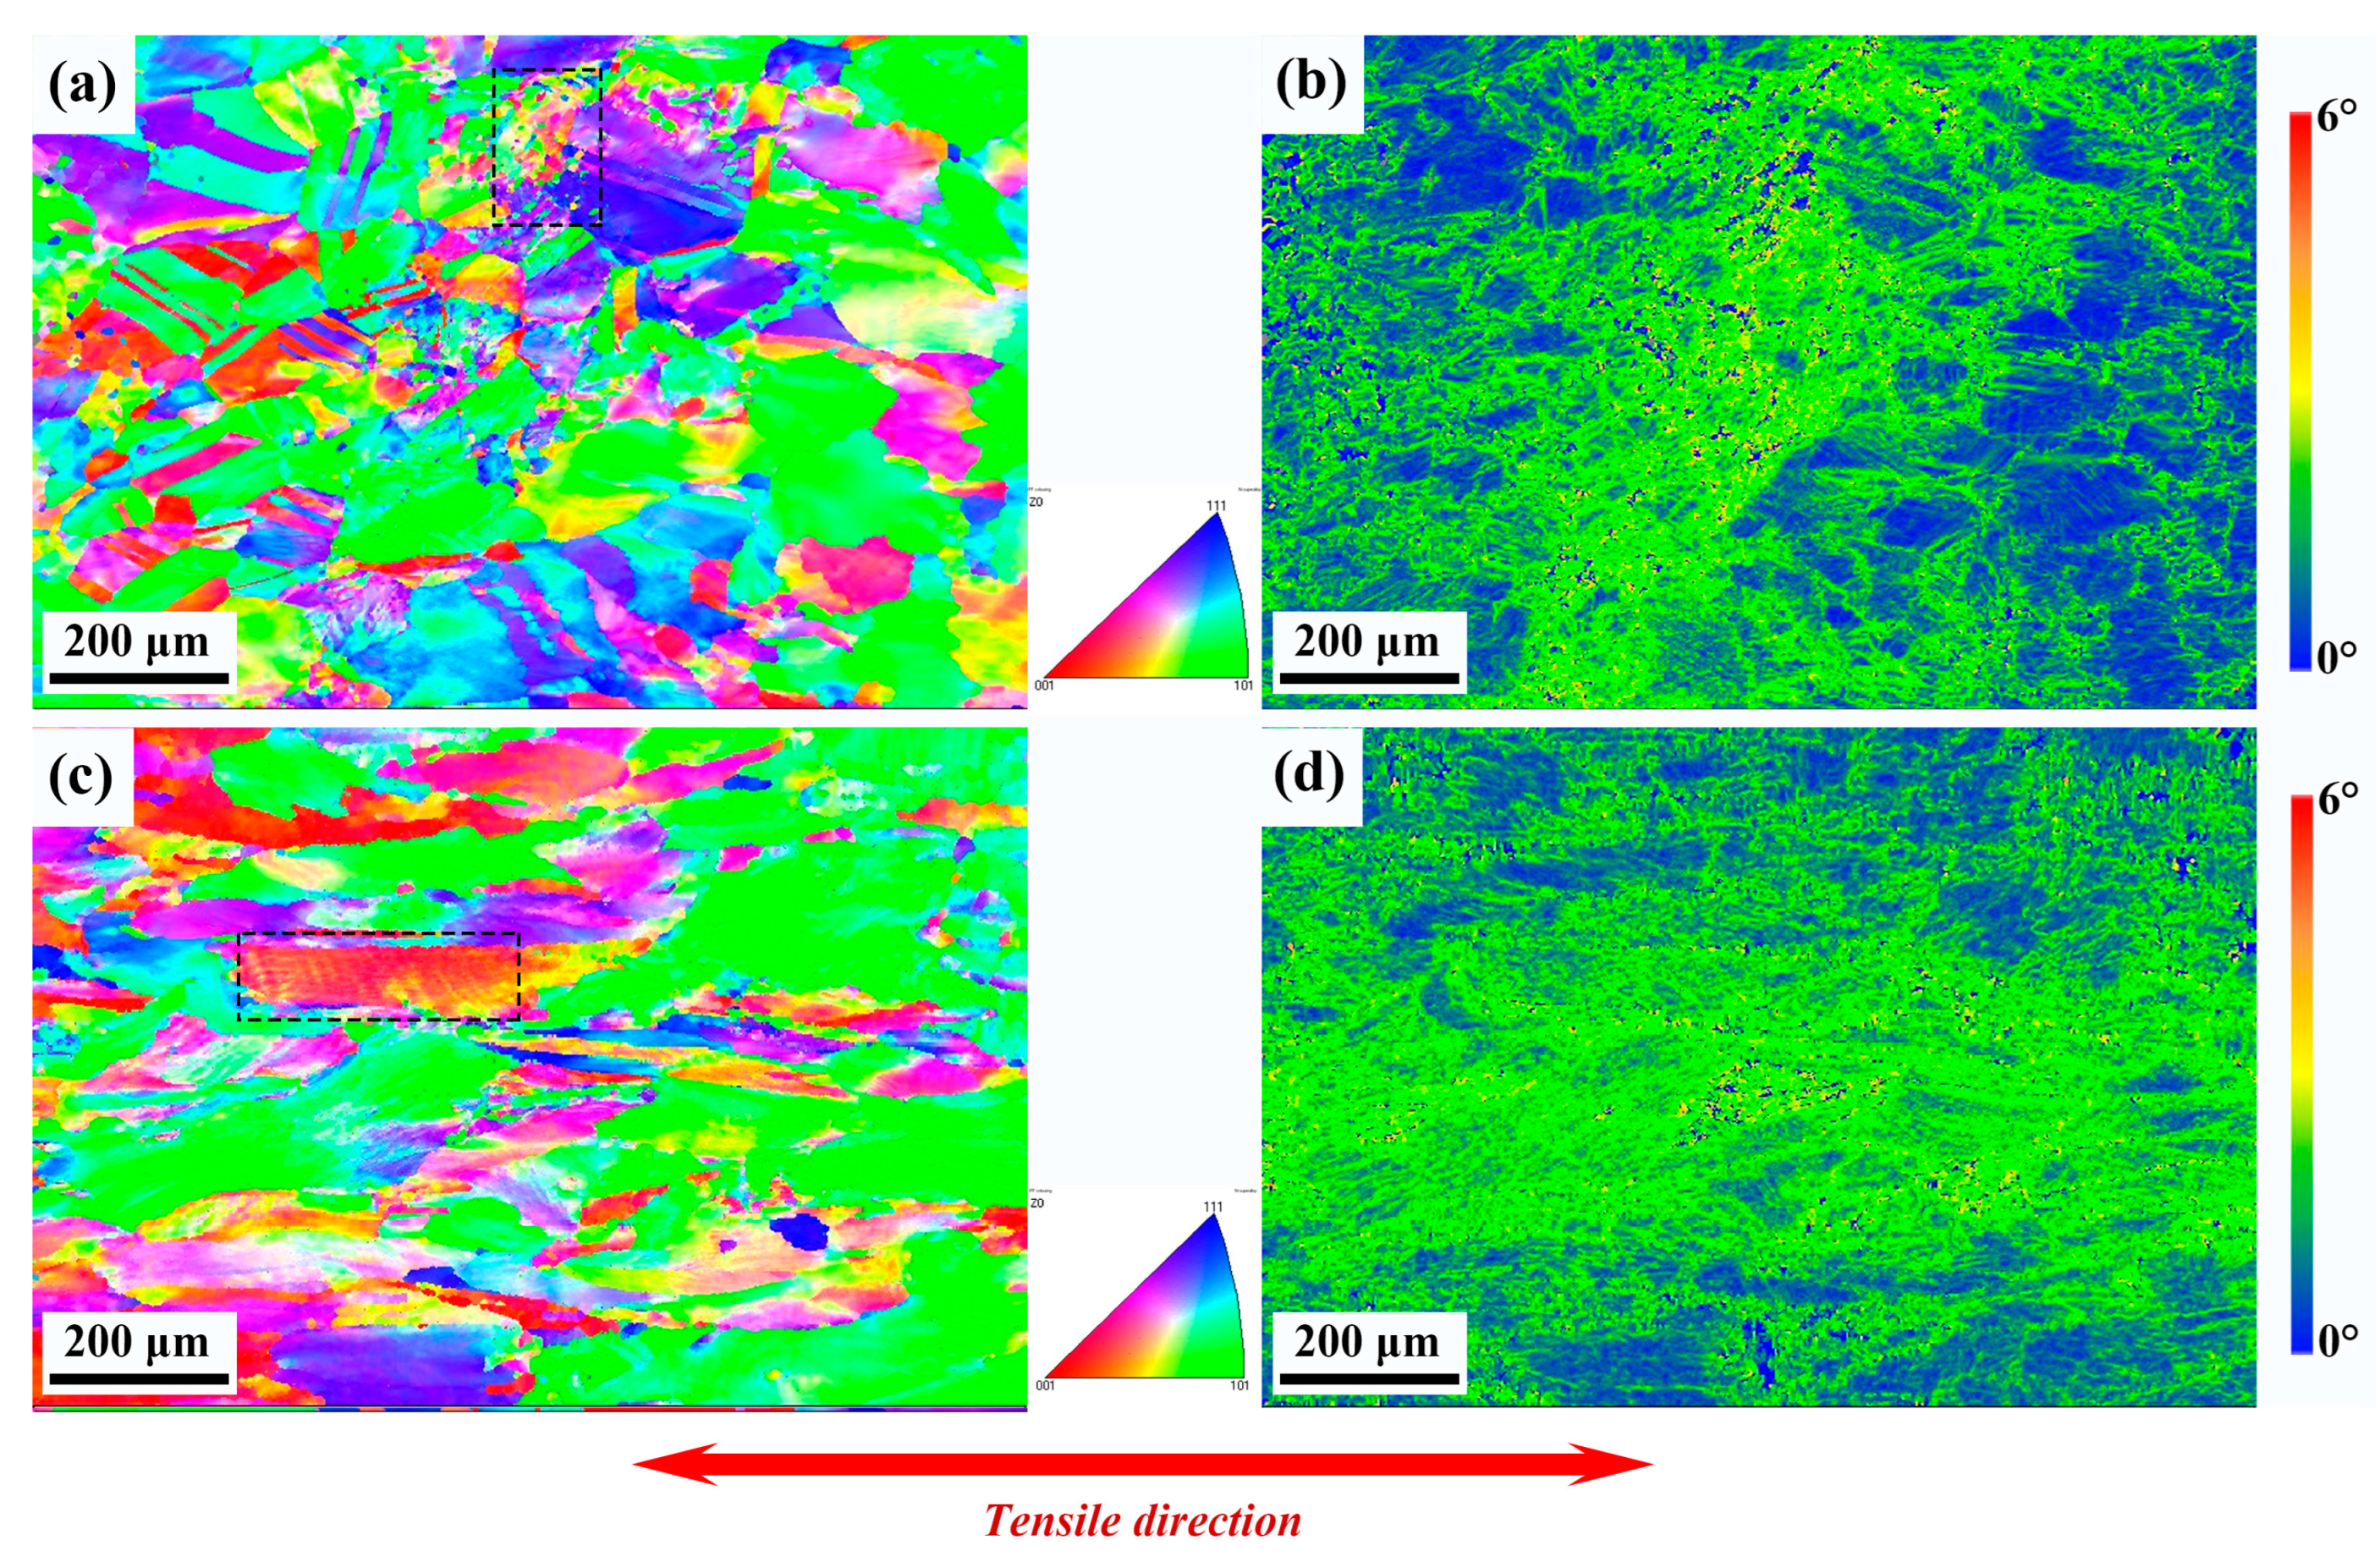
Figure 6a and
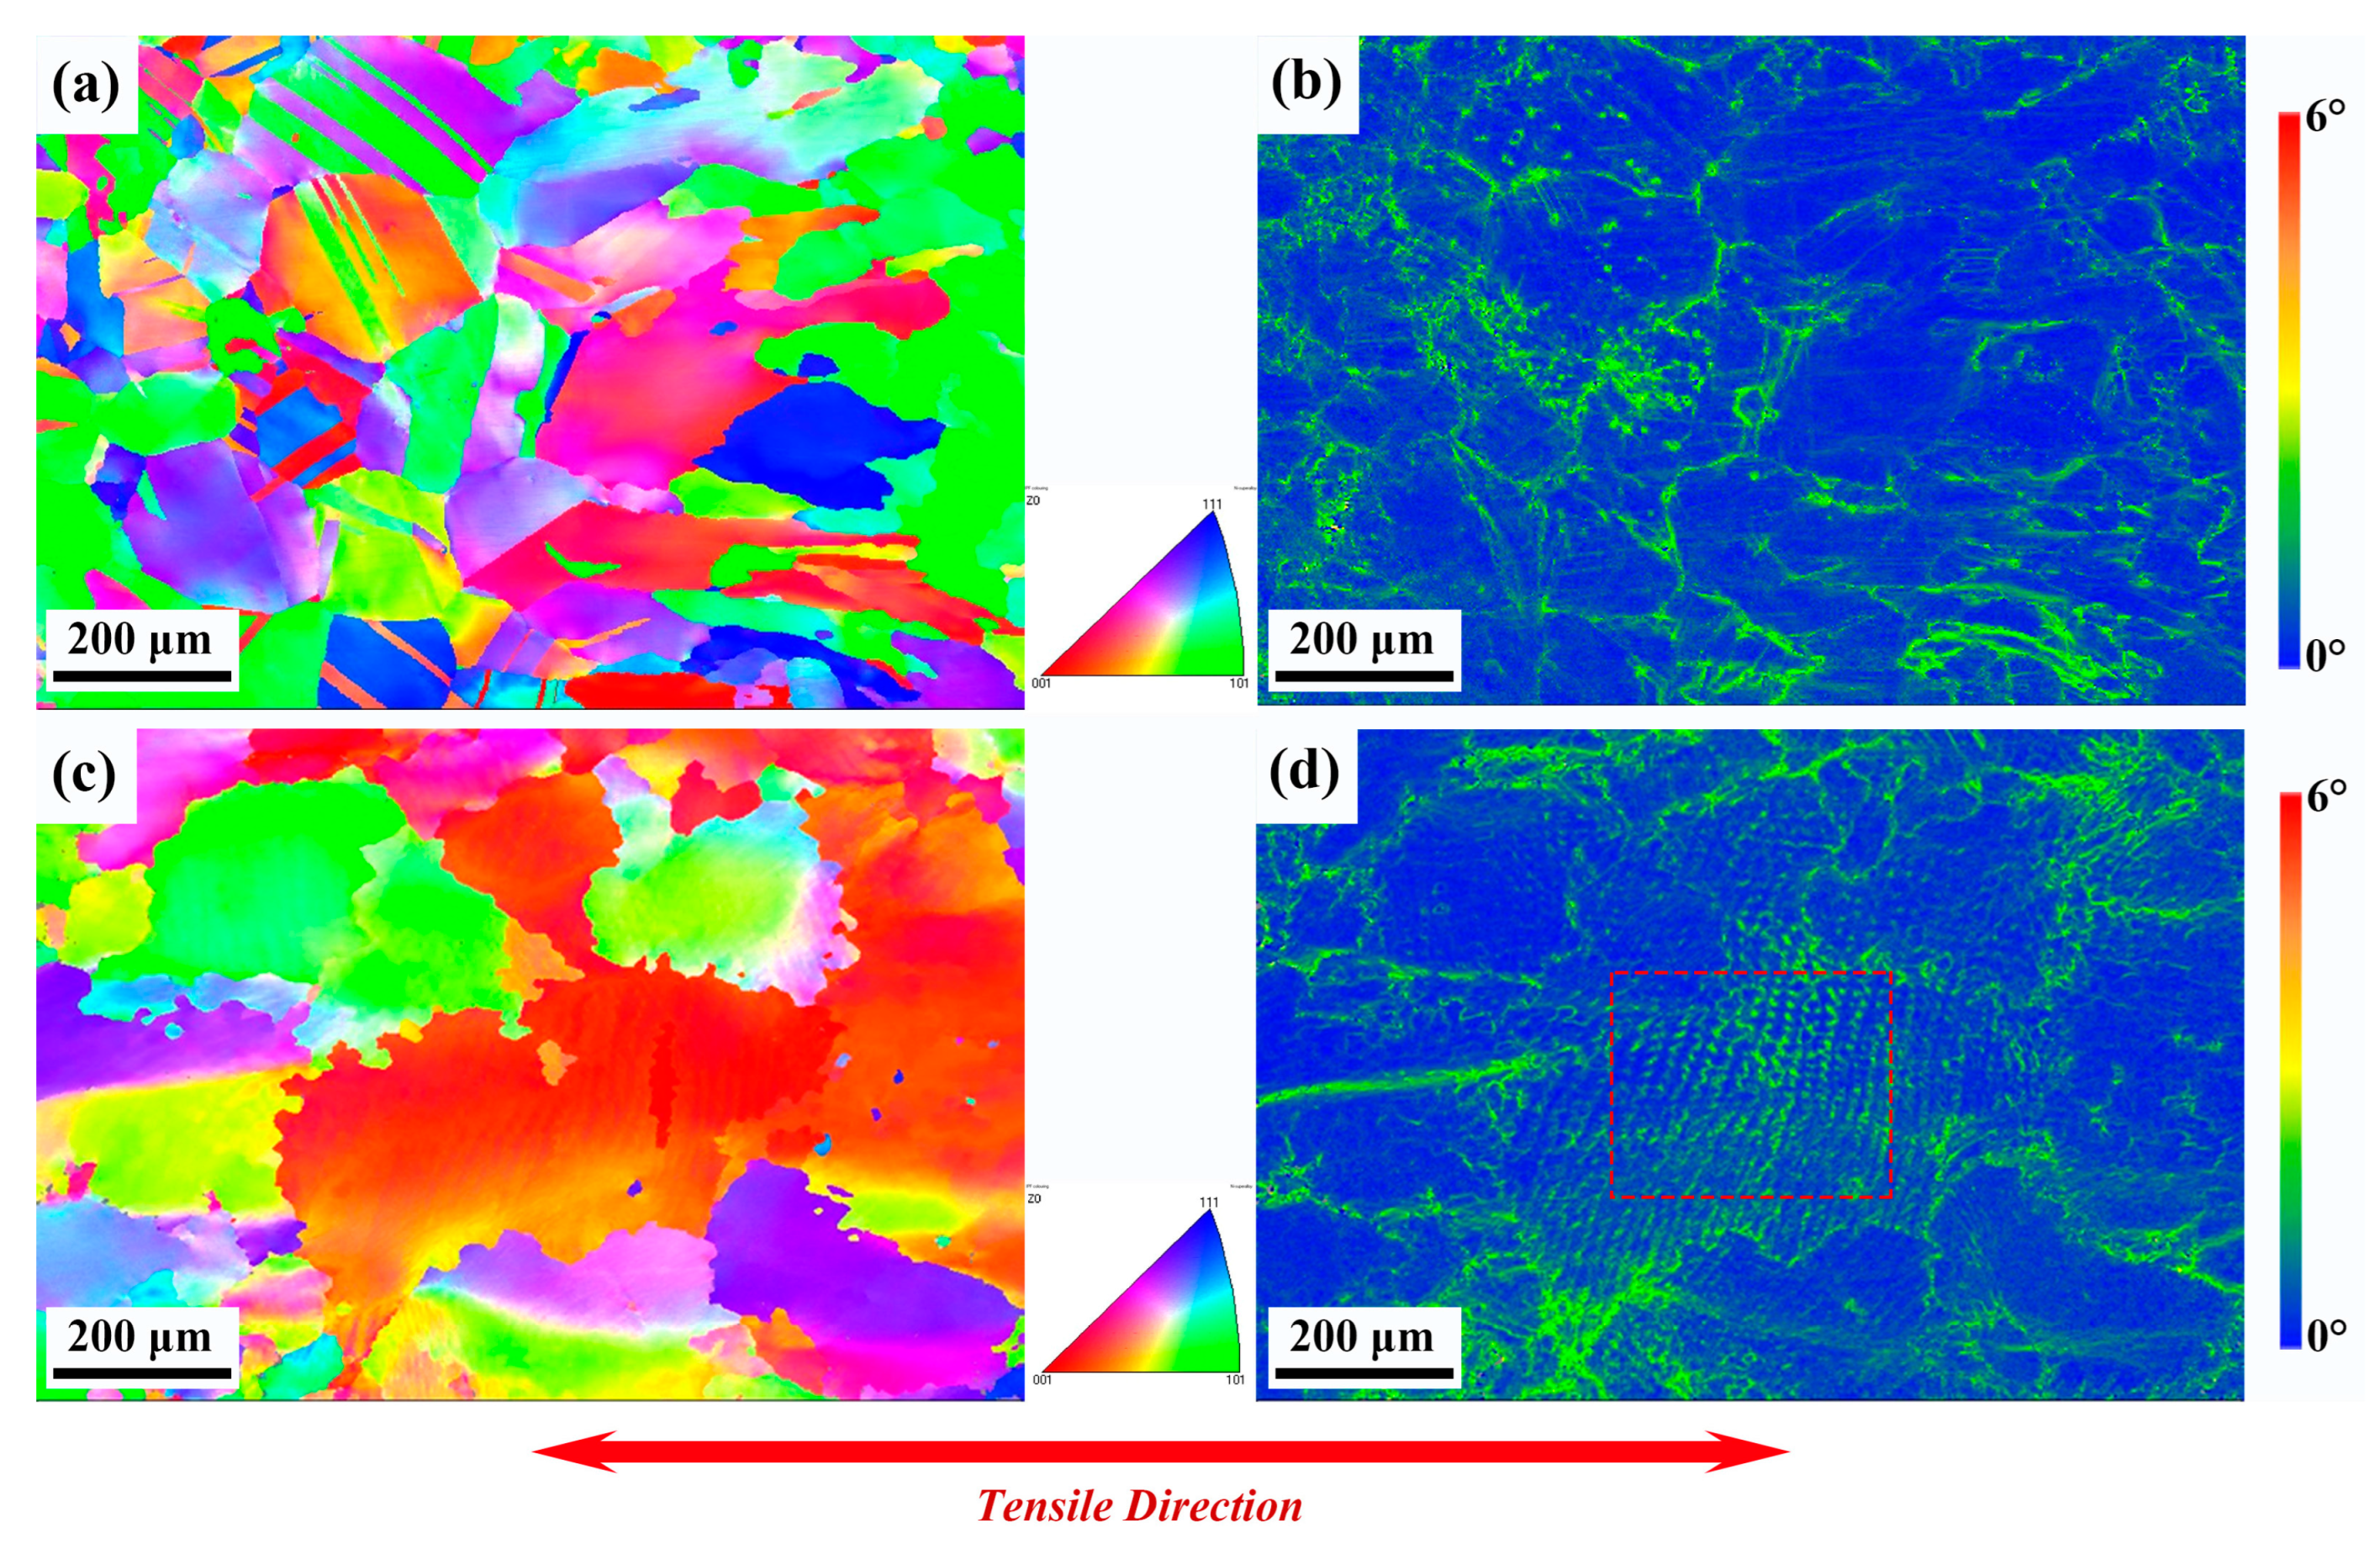
Figure 4b present the inverse pole figure (IPF) and kernel average misorientation (KAM) results near the fusion line (FL) of the room-temperature (RT)-fractured specimen. The IPF map shows the FL is located at the center of this region, and the refined grains (marked by the dashed box in
Figure 6a) indicate severe deformation. The KAM map reveals dislocation distribution near the FL in this local area, also implying severe deformation at the FL under RT conditions. Notably, the deposited metal (DM) adjacent to the FL exhibits low matrix density.
Figure 6c,d show the IPF and KAM results of the DM in the RT-fractured specimen. As observed in
Figure 6d, the dislocation density here is much higher than that near the FL; however, the visible fine grains at grain boundaries are relatively sparse. Additionally, a distinct phenomenon is that dislocation aggregation distributes along the tensile direction—this differs from the tensile-direction-perpendicular distribution near the FL. In the IPF map of
Figure 6c (high-temperature specimen), the FL can also be identified via grain morphology. The KAM results in
Figure 6d show slight dislocation concentration at grain boundaries, which is significantly lower than that at the FL of the RT specimen.
Figure 6 shows that the room-temperature deformed sample has a relatively high dislocation density, yet its overall distribution is relatively uniform.
Figure 7a,b depict the inverse pole figure (IPF) and kernel average misorientation (KAM) results near the fusion line (FL) of the 700 °C-fractured specimen. As shown in the IPF map (
Figure 7a), the FL of the high-temperature specimen can also be identified via grain morphology.
Figure 7c,d present the IPF and KAM results of the deposited metal (DM) near the fracture of the 700 °C-tested specimen. EBSD analysis at these two locations reveals no obvious fine grains, indicating that recrystallization is not significant. Additionally, the dislocation density at both locations is low—particularly near the FL, where no obvious dislocation concentration is observed. Comparing these EBSD results with those of the room-temperature (RT) specimen shows that the dislocation density here is significantly lower than that of the RT specimen. Moreover, a network-like dislocation distribution is observed in the DM adjacent to the fracture surface.
Figure 7 shows that in the sample deformed at high temperature, the overall dislocation density is relatively low; however, it exhibits an obvious characteristic of aggregation near the grain boundaries.
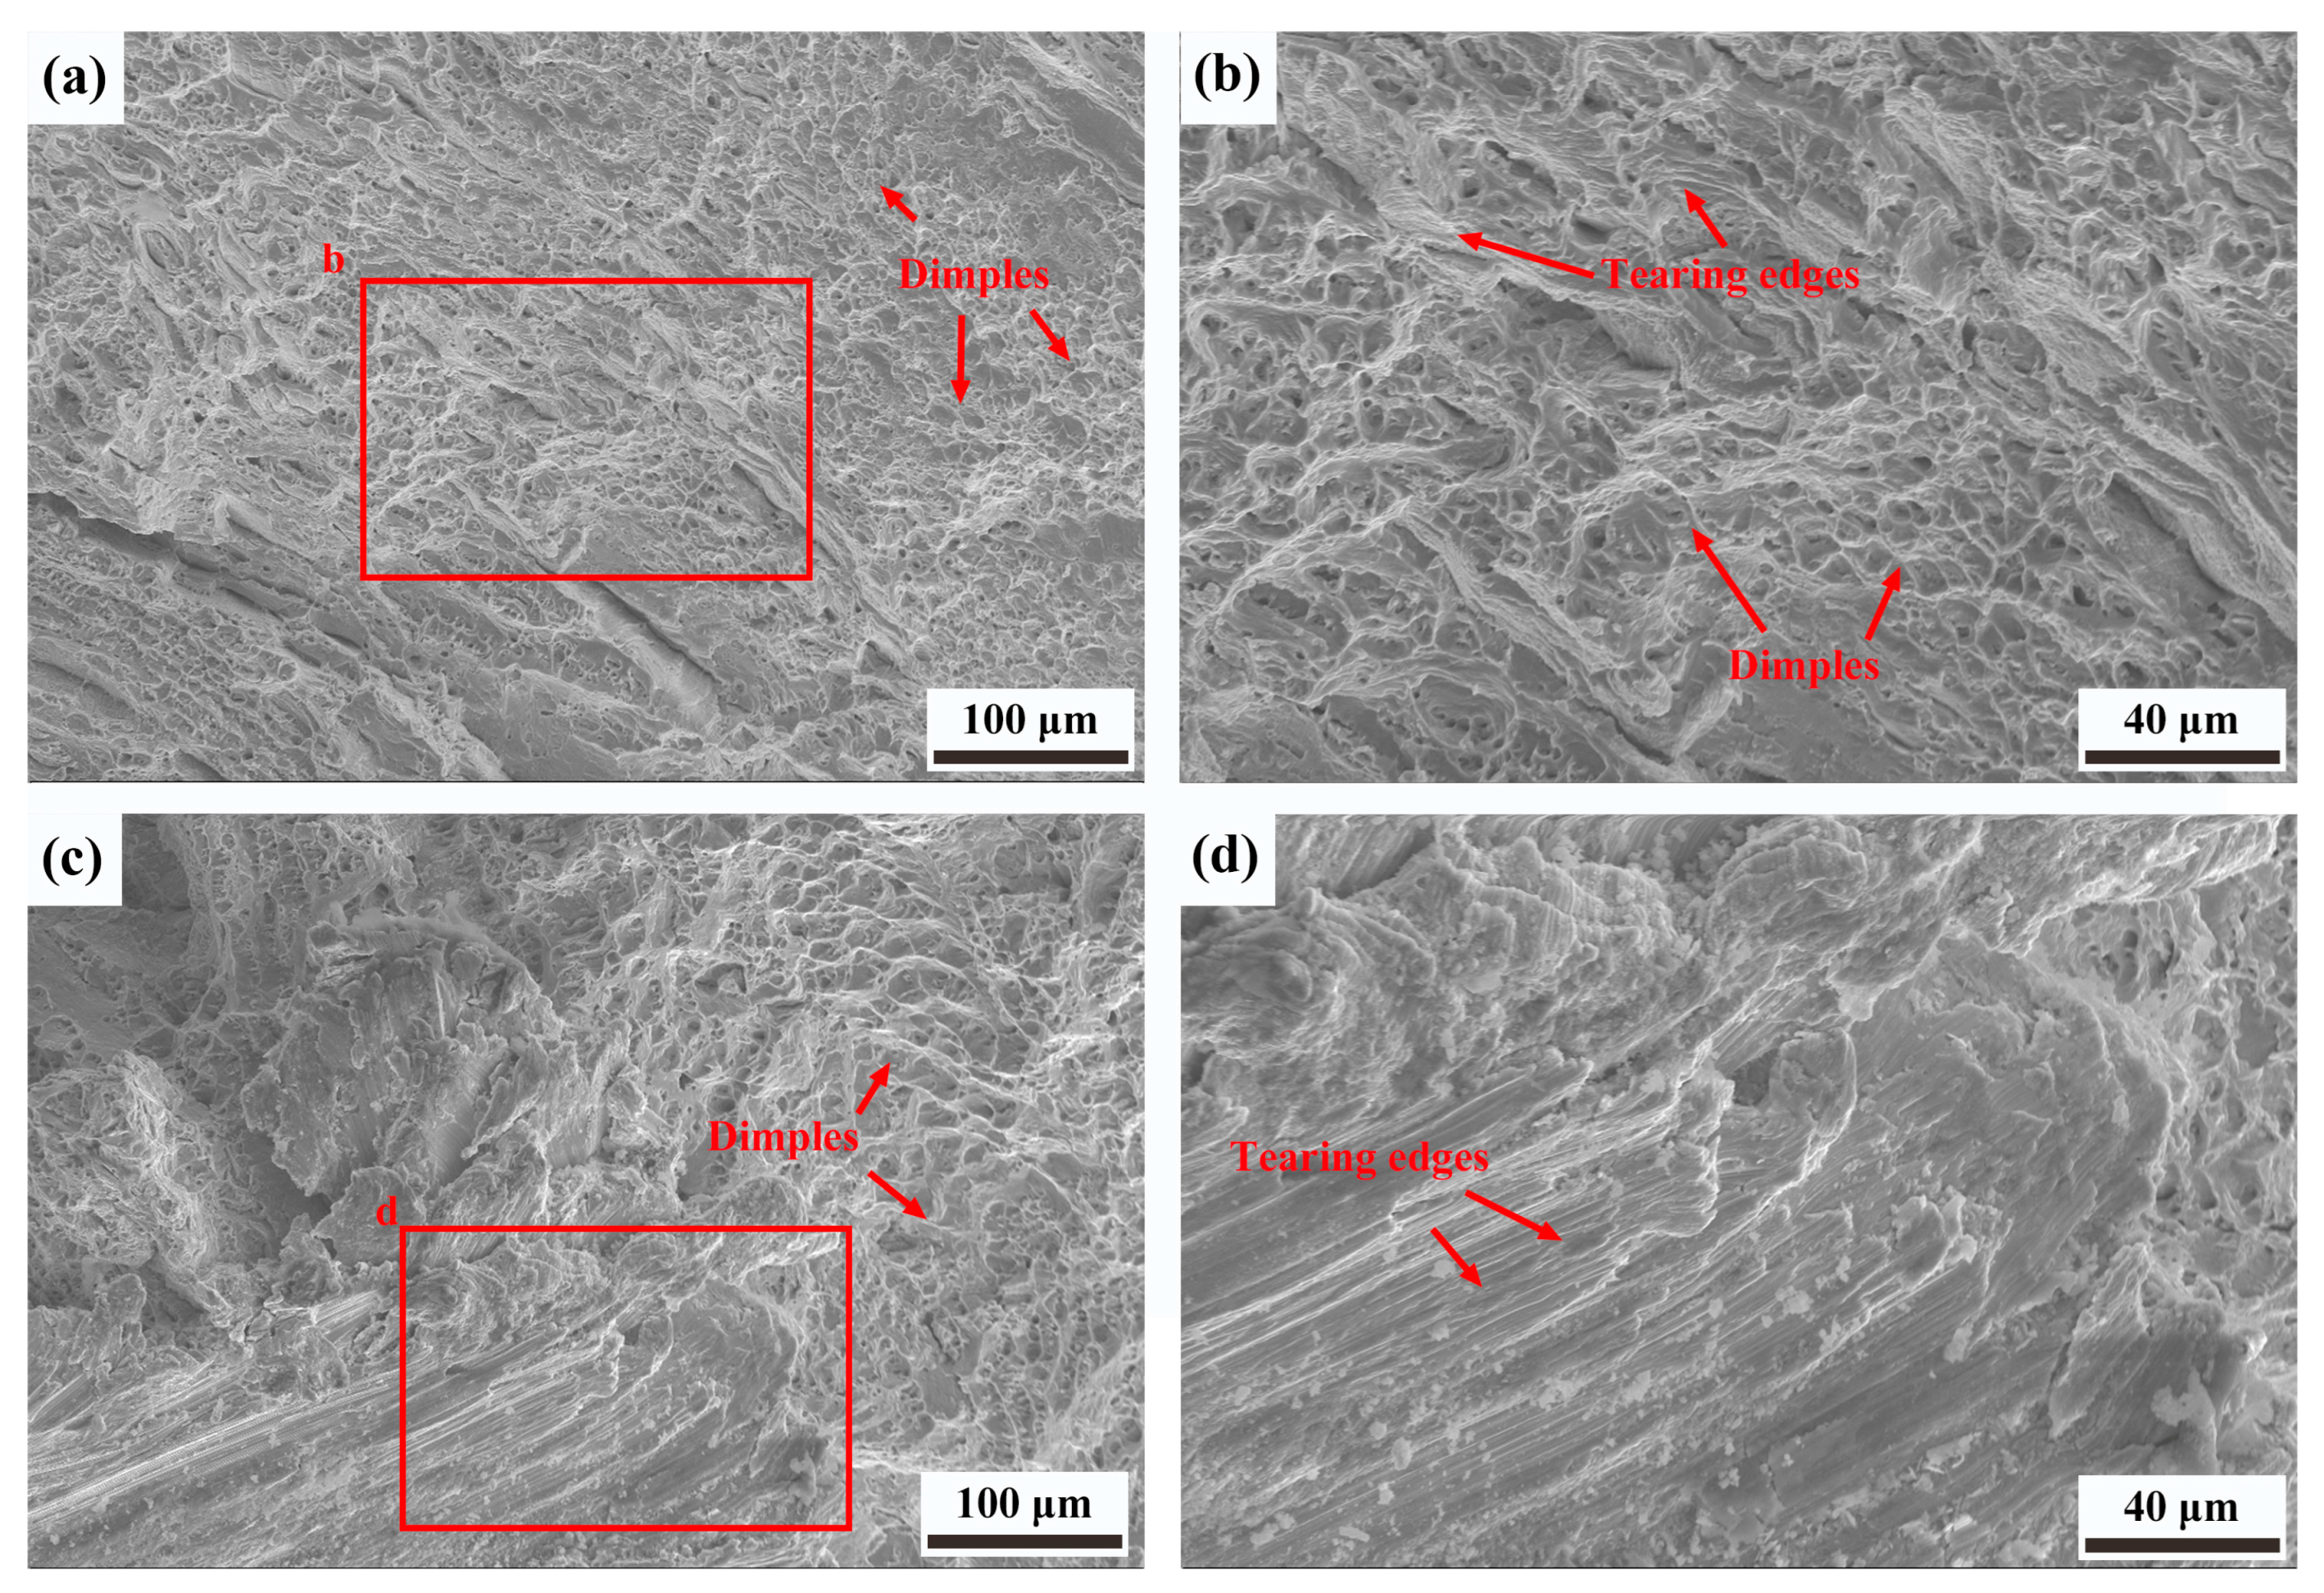
Figure 8a shows the fracture morphology of the room-temperature (RT) specimen, with
Figure 8b presenting a magnified view of the region marked in
Figure 8a.
Figure 8c,d, meanwhile, depict the fracture morphologies of the 700 °C-tested specimens. Both specimens exhibit a mixed fracture morphology consisting of small dimples and tear ridges. The key difference is that under high-temperature tensile conditions, the size and proportion of tear ridges are larger. As clearly observed in
Figure 8c,d, a large number of tear ridges are present—this is evidence that the fracture mode tends toward brittle fracture, which is also consistent with the elongation values obtained from the tensile curves.
4. Discussion
In GH3535 welded joints fabricated using the modified ERNiMo-2 welding wire, the HAZ did not exhibit the softening issue commonly observed in some other metals. Based on hardness measurements and deformation region analysis at room temperature (RT) and high temperature, neither softening nor preferential deformation occurred in the HAZ. As evident from the strain distribution in
Figure 5, fracture occurred in the deposited metal (DM) near the fusion line (FL) at RT, and in the DM far from the FL at high temperature. This indicates that although hardness tests show the DM has higher hardness than the base metal (BM), the DM is more susceptible to deformation during tensile loading. The increase in hardness may be caused by the residual stress from welding [
22]. It is worth noting that although regions with lower hardness tend to deform first and thus are prone to fracture in many welded joints, this does not conform to GH3535 alloy welded joints. The actual fracture behavior depends on other factors in the microstructure.
At RT, strain concentrated in the DM near the FL both at yielding and near fracture. At 700 °C, multiple strain concentration regions emerged in the DM at initial yielding, with no obvious concentration at the subsequent fracture location. As illustrated in
Figure 5e, significant strain concentration occurs near the fracture site (local strain ≈ 35%). Although this local strain is lower than that near the fracture site of the room temperature (RT) specimen (local strain ≈ 65%,
Figure 5c), it is confined to an extremely small region. Meanwhile, the deformation of the base metal is approximately 10% at high temperature versus 30% at RT. At high temperature, the ratio of strain in the fracture zone to that in the low-strain region of the parallel section is approximately 3; at room temperature (RT), this ratio is approximately 2. This difference in strain ratios further confirms that strain concentration in the welded joint is more severe under high-temperature conditions. Meanwhile, this phenomenon also indicates that strain concentration develops gradually during high-temperature deformation, confirming that under 700 °C, the deposited metal is more prone to deformation and fracture.
EBSD analysis of grain deformation and dislocation distribution reveals the following: For the RT deformed specimen, the Kernel Average Misorientation (KAM) map of the DM (
Figure 6b) shows extremely high dislocation density in this region, with dislocations distributed along the FL. In contrast, no obvious high-density dislocations are observed near the FL of the high-temperature deformed specimen. Even though the DM near the fracture surface undergoes significant deformation (
Figure 7c,d), and its dislocation density is higher than that near the FL (
Figure 7d), it remains notably lower than that of the RT deformed specimen. The dislocation distribution characterized by EBSD supports the strain distribution results from DIC.
A network-like dislocation arrangement was observed within DM grains adjacent to the fracture surface. TEM was used to characterize dislocation morphology, with observations conducted under two-beam conditions for better comparability. As shown in
Figure 9a,b, the RT-deformed DM had relatively high dislocation density and distinct slip bands—consistent with the features in
Figure 6c. In contrast, the 700 °C-deformed microstructure (
Figure 9c,d) exhibited overall lower dislocation density than the RT specimen. No obvious slip bands were observed in the 700 °C-deformed DM matrix; instead, relatively uniform dislocation tangles and a small number of dislocation wall structures were present. Additionally, due to the limitation of TEM observation scale, the network dislocation walls in
Figure 7d could not be fully visualized, but the dislocation wall structures in
Figure 9d may correspond to these network dislocation walls.
In the DM of the welded joint, the accumulation of dislocations and strains is confined to grain boundaries under the combined effects of deformation and dynamic recovery. Under high-temperature tensile conditions with dynamic recovery, the strain-concentrated region of the DM fractures when local deformation reaches only ~35%. Microscopically, its dislocations are mainly distributed at grain boundaries; by contrast, dislocations are observed in grain and grain boundaries at room temperature. This contributes to relatively uniform macro- and microscale distributions of the welded joint, with delayed necking and fracture [
23]. Additionally, the coarser grain boundaries of the DM result in higher inhomogeneity of dislocation concentration at grain boundaries compared to the BM under high temperatures.
At RT, dislocation multiplication leads to strain hardening in the deformed regions, which drives deformation to spread to undeformed regions—resulting in relatively uniform deformation of the DM in the RT-tested specimen. In contrast, at 700 °C, dislocation recovery occurs, limiting the strain hardening effect induced by DM deformation while weakening the hardness caused by residual stress [
24]. Consequently, the cross-sectional area of the deformed DM tends to decrease before significant strengthening is achieved, leading to strain concentration. This makes the overall deformation uniformity of the DM at 700 °C markedly lower than that at RT.
In previous studies, when adjusting the parameters of GH3535 alloy welded joints under different heat inputs, it was found that if the hardness of the deposited metal was made higher than that of the base metal and heat-affected zone through heat input, the joint would be more likely to fracture in the base metal part during thermal stretching [
8]. Our results show that when the hardness of the deposited metal is lower than that of the heat-affected zone but slightly higher than that of the base metal, it will make the deformation concentrate more easily in the deposited metal. This indicates that the welding thermal history and microstructure morphology may affect the subsequent deformation behavior through material hardness and other microstructural characteristics, which provides a new perspective for the subsequent adjustment of welding processes and welding wire compositions. The specimens with 0 wt.% Si contain relatively few carbides, resulting in an insignificant strengthening effect. Therefore, adopting strengthening strategies such as carbide strengthening to enhance the strength of the DM may be a more effective approach to improve the high-temperature tensile properties of GH3535 welded joints.

