Article

Synthesis of Multidoped Zirconia by Hydrothermal Method with Sequential Annealing

by
Yuriy Alexsandrovich Garanin
1,2,*,
Rafael Iosifivich Shakirzyanov
1,2,
Dmitriy Igorevich Shlimas
1,2,
Milana Abasovna Saidullayeva
1,2,
Daryn Boranbaevich Borgekov
1,2 and
Malik Erlanovich Kaliyekperov
1,2
1
Engineering Profile Laboratory, L.N. Gumilyov Eurasian National University, Satpayev St., Astana 010008, Kazakhstan
2
Laboratory of Solid State Physics, The Institute of Nuclear Physics, Almaty 050032, Kazakhstan
*
Author to whom correspondence should be addressed.
Crystals 2025, 15(10), 904; https://doi.org/10.3390/cryst15100904
Submission received: 30 September 2025 / Revised: 12 October 2025 / Accepted: 15 October 2025 / Published: 17 October 2025
(This article belongs to the Special Issue Ceramic Materials: Structural, Mechanical and Dielectric Properties)

Abstract

Over more than half a century of using zirconia in technology and industry, researchers have faced several challenges related to the performance of this material. It is believed that some issues regarding the low performance of the zirconia ceramics can be solved by using a multidoping strategy. In this study, nanoparticles with the composition (1 − x)⸱ZrO2 − x⸱MD (where MD—multi-dopant Y:Ce:Mg:Ca with cation relationship 1:1:1:1 and x = 0.05–0.25 mol. %) were synthesized using a hydrothermal method followed by annealing. XRD and Raman spectroscopy analyses demonstrated that in the concentration range of x = 0.10–0.25 mol.%, the only detectable phase in the synthesized samples was the tetragonal phase of zirconia. SEM analysis revealed that the size of the final particles ranged from 20 to 50 nm. It was demonstrated that using obtained nanoparticles as precursors for sintering leads to the formation of multiphase ceramics. The microhardness and biaxial flexural strength of the ceramic samples vary depending on the dopant concentration in the range of 600–1400 HV and 25–200 MPa respectively. Mechanical properties mostly depend on porosity and grain size in the sintered material. The study shows that the multidoping strategy has high potential to obtain new constructional ceramics and components for solid oxide fuel cells.

Graphical Abstract

1. Introduction

Due to its excellent mechanical properties, high melting point, chemical inertness at high temperatures, high catalytic activity, corrosion resistance, biocompatibility and excellent ionic conductivity zirconium dioxide (ZrO2) has big potential of in many industry application including catalyst [1], optical lens production [2], protective coatings [3], thermal barrier coatings (TBCs) [4], biomedical applications [5], membranes [6], and solid oxide fuel and electrolysis cells (SOFC) [7]. However, by its nature, ZrO2 is polymorphic and can have three allotropic modifications of the crystal lattice: in the temperature range from RT to 1170 °C, ZrO2 is characterized by a monoclinic type of crystal lattice (m-ZrO2); when heated above 1170 °C, m-ZrO2, experiencing a martensitic transition, undergoes a phase transformation from a monoclinic to a tetragonal type of crystal lattice (t-ZrO2); when heated above 2370 °C, the tetragonal type of crystal lattice transforms into a cubic one (c-ZrO2) [8]. Meanwhile, the excellent properties of ZrO2 discussed earlier are more characteristic of the high-temperature c and t-ZrO2 phases. Currently, there are two approaches to stabilizing high-temperature c and t-ZrO2 phases. The first approach is to introduce dopants in the form of oxides of yttrium (Y2O3), magnesium (MgO), cerium (CeO2) and calcium (CaO) [9,10,11]. In this approach, larger doping ions are incorporated into the ZrO2 crystal lattice, resulting in its distortion and the appearance of various defects, as a result of which the high-temperature phases are stabilized at room temperature. The second approach is the synthesis of ZrO2 nanoparticles with sizes no larger than 10–20 nm. In this case, because of to the Gibbs–Thomson effect, metastable high-temperature phases can exist at room temperature and without doping [12,13].
However, both approaches have a number of disadvantages. When stabilizing the c- and t-ZrO2 phases through dopant incorporation, issues such as low-temperature aging (for yttria dopant) [14] and eutectoid decomposition (magnesia and calcia dopants) [15] arise, leading to a significant degradation of functional properties. Results from studies of the low-temperature degradation of yttrium-doped zirconium oxide, as well as the high-temperature degradation of Zr(Ca)O2 and Zr(Mg)O2, show that each doping option has its own advantages and disadvantages. Cerium oxide is also a proven substitution component. Research on the simultaneous combination of these components is of interest from a materials science perspective, as it offers the potential to achieve superior properties from each component in one material [16,17].
In the case of the synthesis of metastable nanoparticles c and t-ZrO2, when heated above ≈700 °C, the particles grow beyond the critical size, which is accompanied by phase transformations of the type t (or c)-ZrO2 → m-ZrO2 [13], which makes it impossible to use such nanoparticles as a precursor for the production of ceramics.
One of the most used methods for the synthesis of ZrO2 nanoparticles is hydrothermal synthesis [18,19]. By varying a number of parameters (temperature and time of synthesis, pH of the medium, mineralizers, type of starting materials) of hydrothermal synthesis, it is possible to obtain ZrO2 nanoparticles with the desired phase composition [13]. In addition, during the hydrothermal synthesis of ZrO2 nanoparticles, it is possible to introduce stabilizing additives that are incorporated into the lattice and stabilize the high-temperature phases after increasing the particle size [20,21]. In addition to the standard doping of ZrO2 with one of its stabilizing elements, multi-doping is also used, which can lead to an improvement in their functional properties. For instance, hydrothermal synthesis of ZrO2 with simultaneous doping by Y2O3 and CeO2, allows the synthesis of nanoparticles with enhanced photocatalytic properties [22,23]. Lee and all showed that simultaneous addition of yttrium to cerium-doped ZrO2 at certain concentrations resulted in significant improvement in ionic conductivity [24]. T. Wen and all investigated the effect of introducing additional trivalent metal oxide dopants on the electrochemical properties of zirconia and showed that the use of yttrium as a dopant leads to an increase in ionic conductivity, and also improved the stability and response time of oxygen sensors based on them [25]. Moreover, the use of the multidoping strategy affects the mechanical properties of ZrO2-based ceramics. Min-sung Park et al. synthesized YSZ ceramics doped with Lu3+ for potential application as an oxygen-ion conductor and demonstrated that the introduction of this dopant at certain concentrations can improve the microhardness and flexural strength [26]. In the work of Miquel Turon-Vinas et al., it was shown that Ca- and Ce co-doped zirconia exhibits higher hardness values (≈12 GPa) and biaxial tensile strength (≈900 MPa) compared to Ce-doped zirconia (6–10 GPa and 400–600 MPa, respectively) [27]. MgO and Y2O3 co-doped zirconia also exhibits higher compressive strength (900 MPa) compared to MgO-doped zirconia and additionally prevents the degradation of mechanical properties under cyclic thermal shock conditions [28]. Mirela Petricianu et al. synthesized zirconia multi-doped with rare metal oxides (La2O3, Nd2O3, Sm2O3, Gd2O3, Yb2O3) using the hydrothermal synthesis method and found that such a combination of dopants significantly reduces thermal conductivity, heat capacity, and diffusion coefficient, while maintaining excellent mechanical properties, making it a highly promising material for use as a high-temperature anticorrosion protective coating [16]. At the same time, multidoping zirconia with MgO and CeO allows the phase composition to be adjusted by varying the CeO concentration, as well as improving cold compressive strength and thermal shock resistance [29]. It has also been reported that multidoping zirconia with CaO and MgO using the co-precipitation method followed by annealing increases conductivity and charge mobility [30].
Ceramics based on multi-substituted ZrO2 can prove to be excellent electrolytes in solid fuel oxide cells. As mentioned earlier, multi-doping of ZrO2 can produce a large number of oxygen vacancies, which are a key factor in ionic conductivity [24,31]. Furthermore, the use of nanoparticles as a precursor for ceramic production can allow the creation of multiple grain boundaries, making it difficult for ionic conductivity to degrade over time [32].
In our work, we study the possibility of synthesizing multi-doped zirconia nanoparticles by hydrothermal synthesis and the subsequent production of ceramics based on them with potential use as an electrolyte in solid fuel oxide cells. The use of Y, Ce, Mg, and Ca as dopants is motivated by the fact that ceramics made from Zr(Y)O2, Zr(Ce)O2, Zr(Mg)O2, and Zr(Ca)O2 have demonstrated outstanding properties and have found widespread industrial application [33,34,35,36]. Moreover, to our knowledge, information on the specifics of multi-doping with Y, Ce, Mg, and Ca ions has not yet been published. Our results reveal previously unknown features of multi-doping of zirconium oxide, as well as some technological aspects of producing bulk ceramics.

2. Materials and Methods

(1 − x)⸱ZrO2 − x⸱MD nanoparticles (where x = 0.05–0.25 mol. %) were obtained by hydrothermal synthesis in a steel autoclave with a Teflon liner. The starting materials used were 0.1 mol/L solutions of ZrOCl2·8H2O, Ce(NO3)3·6H2O, Y(NO3)3·6H2O, Mg(NO3)2·6H2O, CaCl2 (all reagents were from Sigma Aldrich, (Darmstadt, Germany) with 99.99% purity) with distilled water. The concentration of Y, Ce, Mg, Ca ions in the solution varied from 0.05 to 0.25, and the ratio of Y:Ce:Mg:Ca in the solution was always 1:1:1:1. A 1 mol/L solution of NH3·H2O with distilled water was used as a mineralizer. The salt solution was mixed with a mineralizer until a pH of 9 was reached. The Teflon insert was filled to 90%, after which it was placed in a drying oven at a temperature of 130 °C and kept for 12 h. After synthesis, the powder was centrifuged 5 times in distilled water at 6000 rpm for 5 min, after which it was filtered using a paper filter. The resulting powder was crystallized at a temperature of 650 °C for 30 min in a muffle furnace with a heating rate of 10 °C/min. Chemical reactions occurring during the synthesis of (1 − x)⸱ZrO2 − x⸱MD nanoparticles are presented in the Supplementary Materials, Equations (S1)–(S12).
The synthesis of bulk ceramic samples was carried out using standard ceramic technology. Pre-crystallized (1 − x)⸱ZrO2 − x⸱MD nanoparticles were pressed in a steel mold using a hydraulic press (Paratus, Yekaterinburg, Russia) with an applied pressure of 450 MPa. The obtained press blanks were annealed at a temperature of 1500 °C for 5 h in a Nabertherm LHT 08/18 muffle furnace (Nabertherm, Lilienthal, Germany) with a heating rate of 10 °C/min. Before and after annealing, the geometric parameters and mass of all samples were measured in order to determine the parameters of geometric density and shrinkage. The porosity of sintered tablets was calculated using the formula:
p = 1 ρ e x p ρ t h e o · 100 % ,
where ρ e x p is geometrical density and ρ t h e o is theoretical density.
The theoretical density ρ t h e o was calculated using the effective medium formulas (weighted average by volume concentration). The Rietveld fitting results were used for the calculations.
The mass loss of nanoparticles after hydrothermal synthesis under temperature exposure was assessed using thermogravimetric analysis (TGA) with a Themys One (Setaram KEP Technology, Caluire, France). The samples were heated in an argon atmosphere with a partial pressure of 0.5 MPa from room temperature to 1200 °C at a heating rate of 10 °C/min. X-ray phase analysis was carried out by X-ray diffraction (XRD) on a Rigaku SmartLab diffractometer (Rigaku Hold corp, Tokyo, Japan) with CuKα radiation in Bragg–Brentano geometry. Structural analysis was performed using the whole powder pattern fitting (WPPF, Rietveld method) approach with Rigaku SmartLab Studio software [37]. The size of the coherent scattering region (CSR) was calculated using the Scherrer Equation [38]:
d X R D = 0.9 λ β c o s θ
where β is the full width at half maximum (FWHM) for each of the reflections, λ wavelength of X-ray radiation (CuKα = 0.15406 нм) 0.9 is a coefficient related to the spherical particles.
In addition, the phase analysis of the synthesized samples was investigated by Raman spectroscopy on an Enspectr M532 spectrometer (Spectr-M LLC, Chernogolovka, Russia) with a wavelength of 532 nm. The morphology and size of the nanoparticles were examined by scanning electron microscopy using a Helios 5 CX scanning electron microscope (SEM, Thermo Fisher Scientific, Eindhoven, The Netherlands). Surface morphology and elemental analysis of bulk ceramic samples were investigated by SEM using a ThermoFisher Phenom X scanning electron microscope (Thermo Fisher Scientific, Eindhoven, The Netherlands) with an energy dispersive X-ray (EDX) spectroscopy attachment. The microhardness of the samples was assessed using the Vickers method on a Dupoline-M1 microhardness tester (Metkon Instruments Inc., Bursa, Turkey). Before the microhardness assessment, the surface of the experimental samples was polished on a Tegramin grinding and polishing machine (Struers, Ballerup, Denmark) was used for a sample preparation before the indentation tests. For each sample, microhardness was measured at loads of 0.025, 0.1, and 1 kg at 10 points for each load.
The strength of the tablets was estimated by calculating the biaxial flexural strength when the disk was compressed on 3 supports with a pin [39]:
σ f l e x = 3 1 + ν P 4 π t 2 1 + 2 ln a b + ( 1 ν ) ( 2 + ν ) 1 b 2 2 a 2 a 2 R 2 ,
where
  • σ f l e x —Flexural strength;
  • P—Load in N;
  • υ—Poisson’s ratio (0.305);
  • t—Disk thickness;
  • a—Radius of the circle on which the spherical supports are located;
  • b—Radius of the pin pressing on the disk;
  • R—Radius of ceramic disk.
The load during compression test was measured by a universal electromechanical single-column WalterBai LFM-L 10 kN machine (Walter + Bai AG, Löhningen, Switzerland).

3. Results and Discussion

After the hydrothermal process, the resulting powders exhibit an amorphous nature, characterized by an X-ray diffraction halo and a broad peak (Figure 1a). The presence of this peak may indicate the formation of zirconium dioxide nuclei. In the Raman spectra of the (1 − x)⸱ZrO2 − x⸱MD samples (Figure 1b), a mode appears around 600 cm−1, which suggests the presence of c-ZrO2 phase nuclei [40].
The TGA curve is shown in Figure 1c. As seen in the figure, the thermograms exhibit a characteristic region of sharp mass loss in the range of 150–200 °C. This region corresponds to the removal of physically adsorbed water from the powder. Between 200 and 650 °C, a region with a gentler slope is observed, which is associated with the release of chemisorbed water and -OH groups from the nanoparticles during heating. The DTA thermograms shown in Figure 1d display distinct endothermic and exothermic peaks, corresponding to the vaporization and the crystallization process of the nanoparticles, respectively. Based on the DTA results, the crystallization temperature of the powders obtained via the low-temperature hydrothermal process is approximately 400 °C.
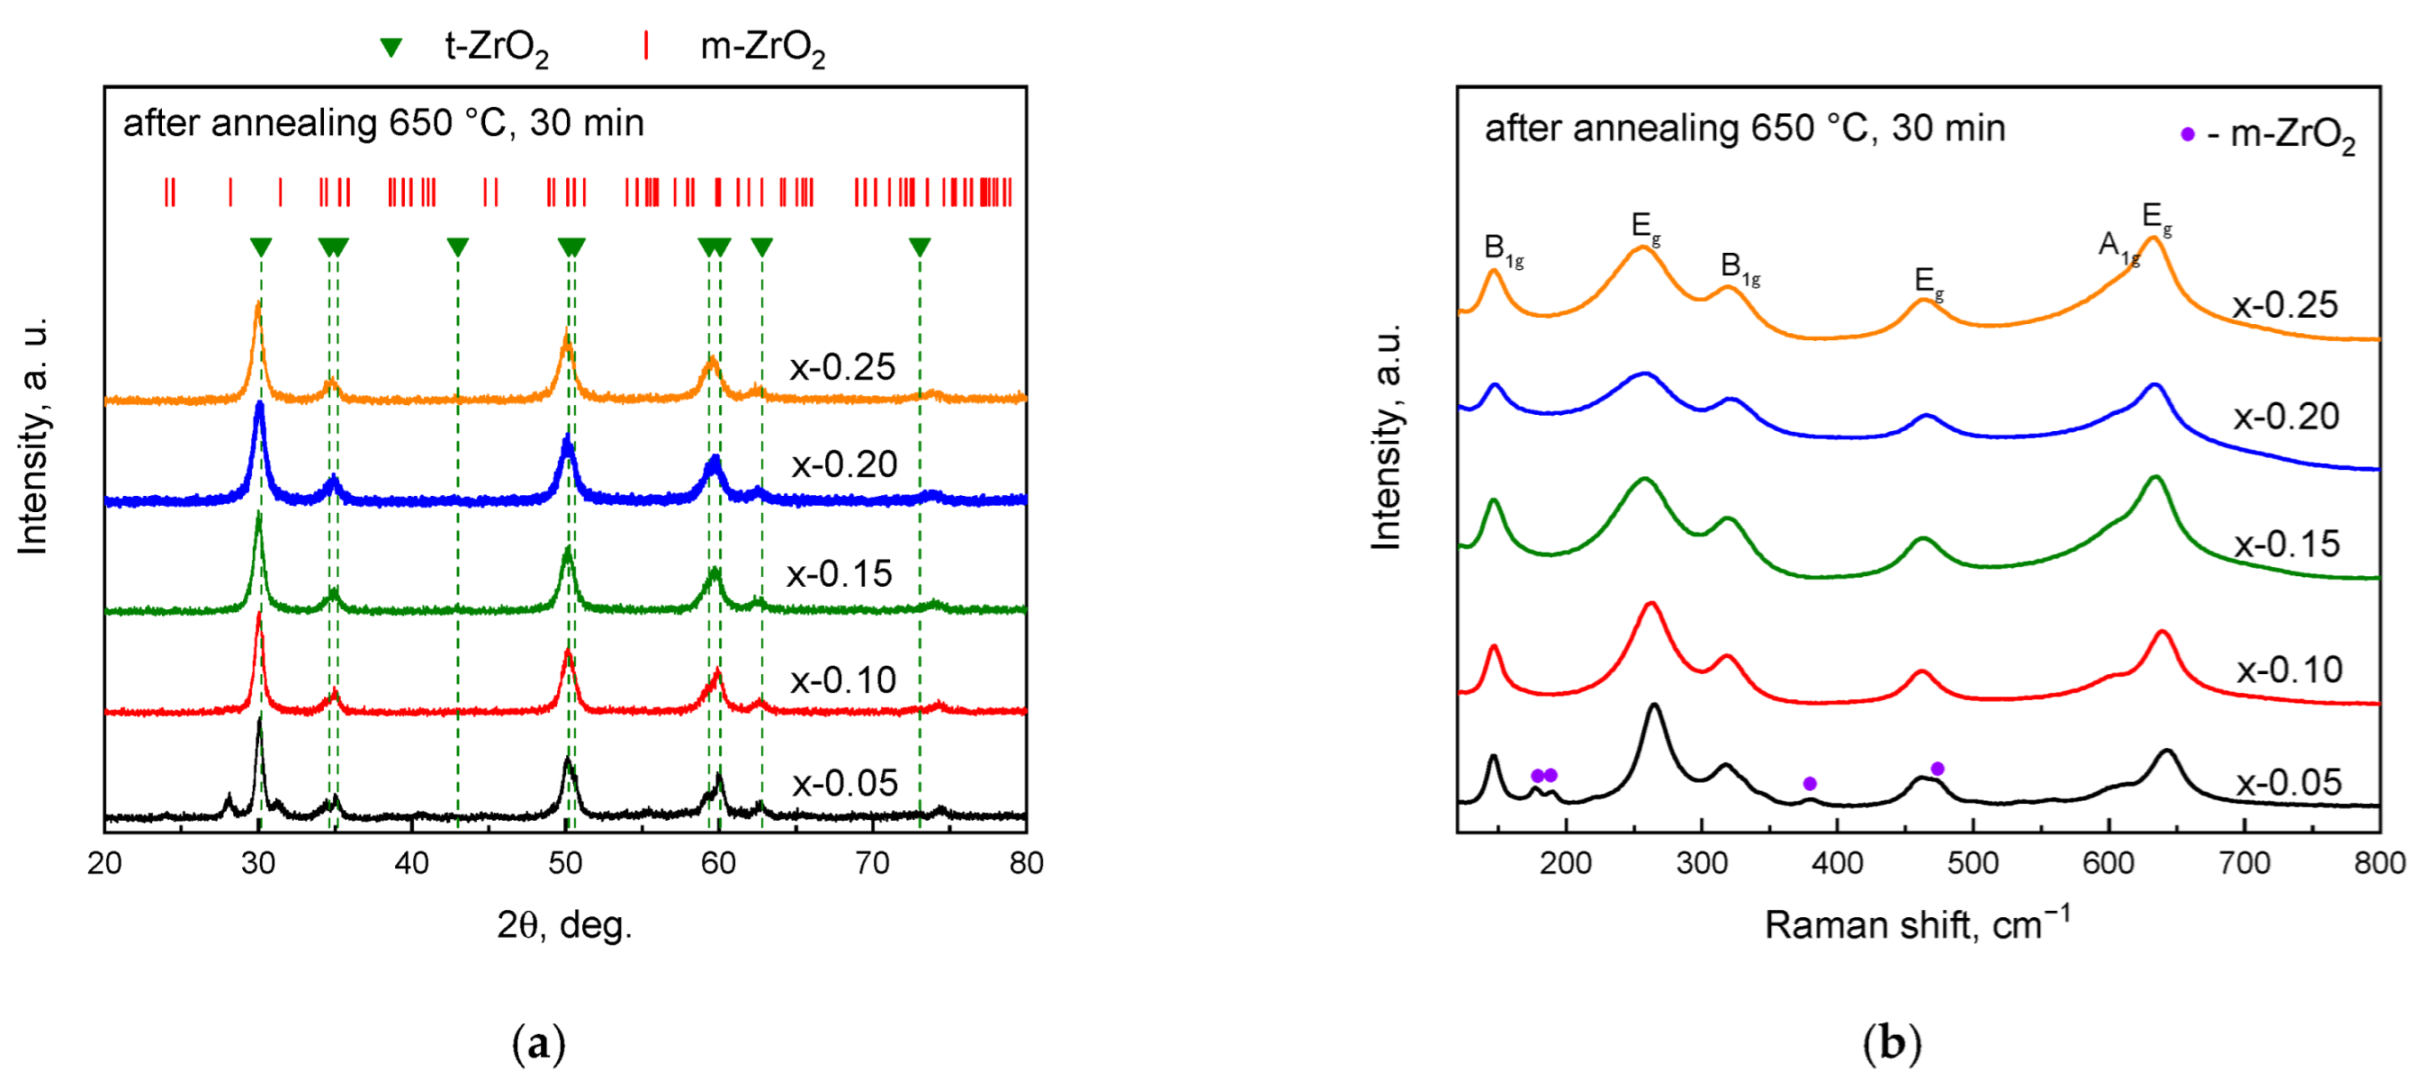
Figure 1b shows the XRD pattern of the samples annealed at 650 °C for 30 min. The set of peaks in the XRD pattens corresponds to the PDF card 00-060-0505 of the t-ZrO2. The CSR, calculated using Equation (2) after peak fitting, is in the range of 10–15 nm for all (1 − x)⸱ZrO2 − x⸱MD particles. Small peaks corresponding to the monoclinic phase were observed for the sample with x = 0.05. This feature indicates an optimal substitution concentration required to obtain a single-phase product. Table 1 presents the data on the variations in lattice parameters of the (1 − x)⸱ZrO2 − x⸱MD particles. With increasing concentration of x, a linear change is observed in the lattice parameter a as well as in the unit cell volume V, indicating the incorporation of dopant ions into the crystal lattice.
Single-phase product formation was additionally confirmed by Raman spectroscopy. Figure 2b shows that all samples exhibit six modes at 147, 260, 316, 466, and 640 cm−1, which are characteristic of the t-ZrO2 phase (A1g + 2B1g + 3Eg). In addition, the 0.95⸱ZrO2-0.05⸱MD sample displays four modes at 177, 199, 380, and 474 cm−1, which are characteristic of the m-ZrO2 phase. These findings are in good agreement with the XRD results. As the concentration of x increases, a shift in the modes toward lower wavenumbers is observed, similar to the trend seen in the XRD data. The shift in the modes in the Raman spectra may be attributed to various phenomena within the crystal lattice, such as an increase in unit cell volume or changes in crystallinity, which are associated with defects and disorder within the lattice [41].
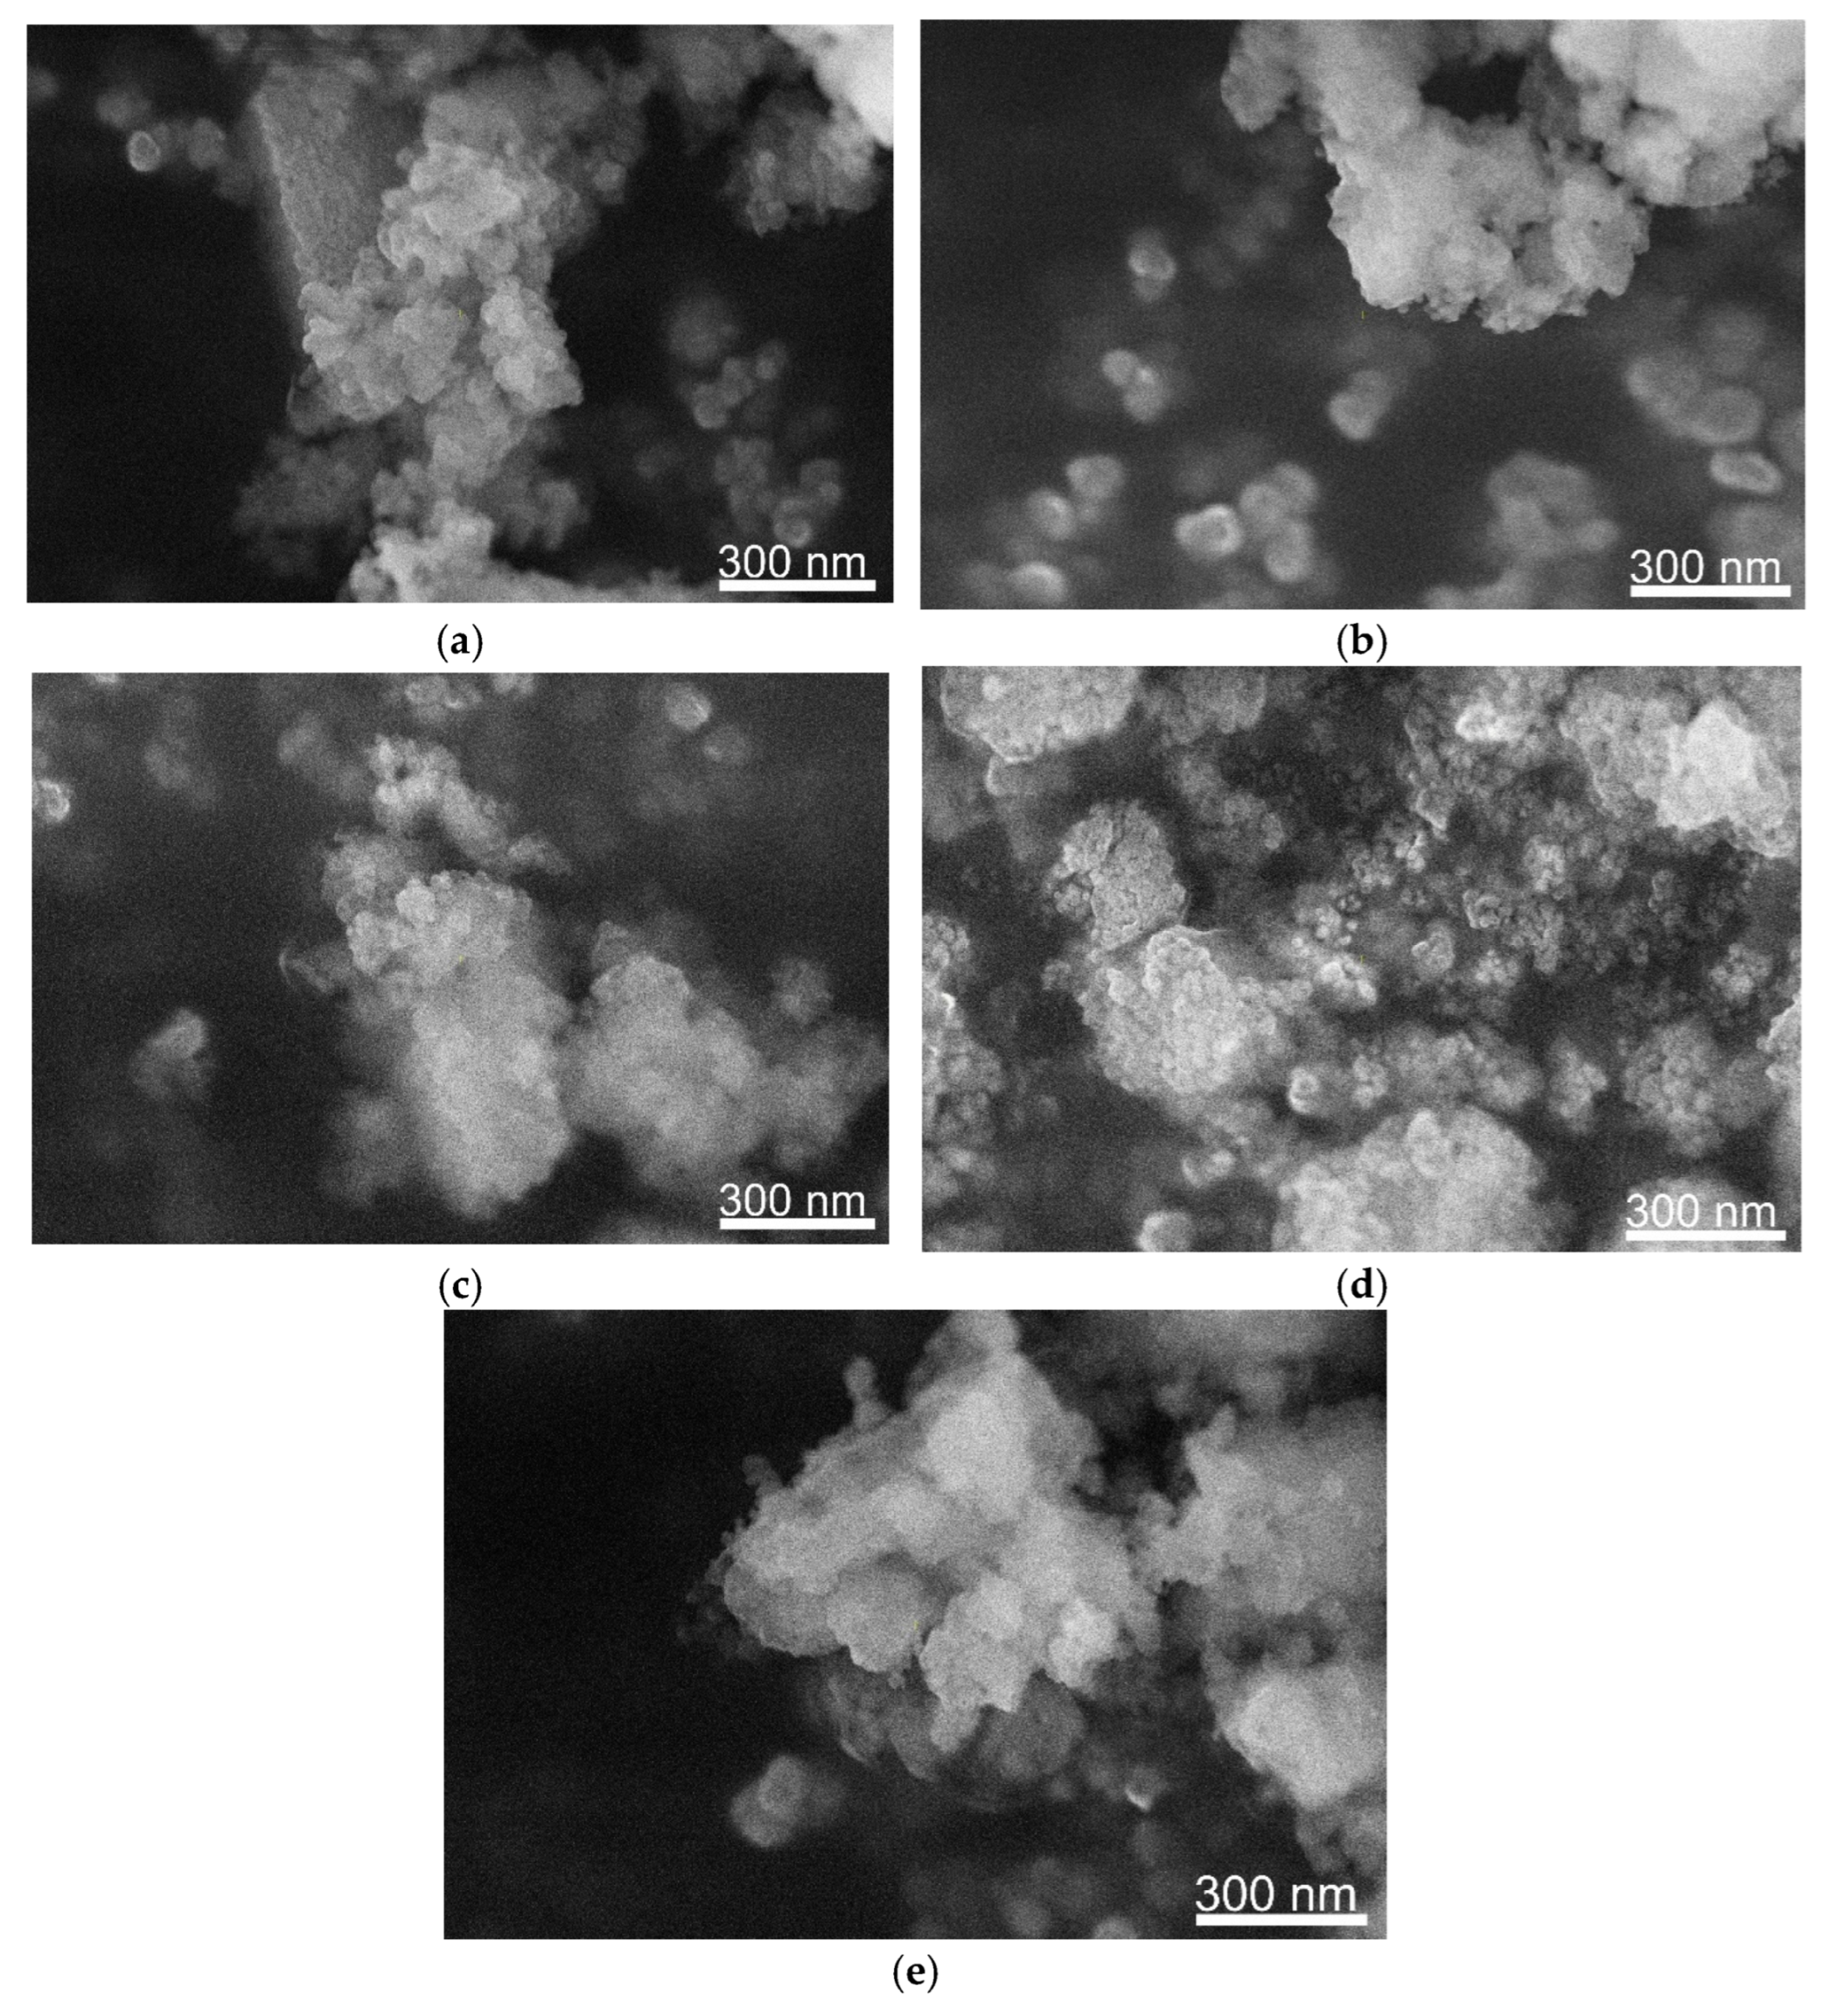
Figure 3 shows the SEM images of (1 − x)⸱ZrO2-x⸱MD nanoparticles. The presented data indicate that, due to electrostatic forces and high surface energy, the samples form large agglomerates composed of spherical nanoparticles with sizes ranging from 20 to 50 nm. Variation in the concentration of x does not lead to significant changes in the morphology or size of the (1 − x)⸱ZrO2 − x⸱MD nanoparticles.
The results of XRD phase analysis, SEM, and DTA/TGA indicate that the Gibbs–Thomson effect is overcome in powders that have undergone thermal annealing. Thus, multi-substitution allows for overcoming the phase instability of ZrO2 nanoparticles upon heating.
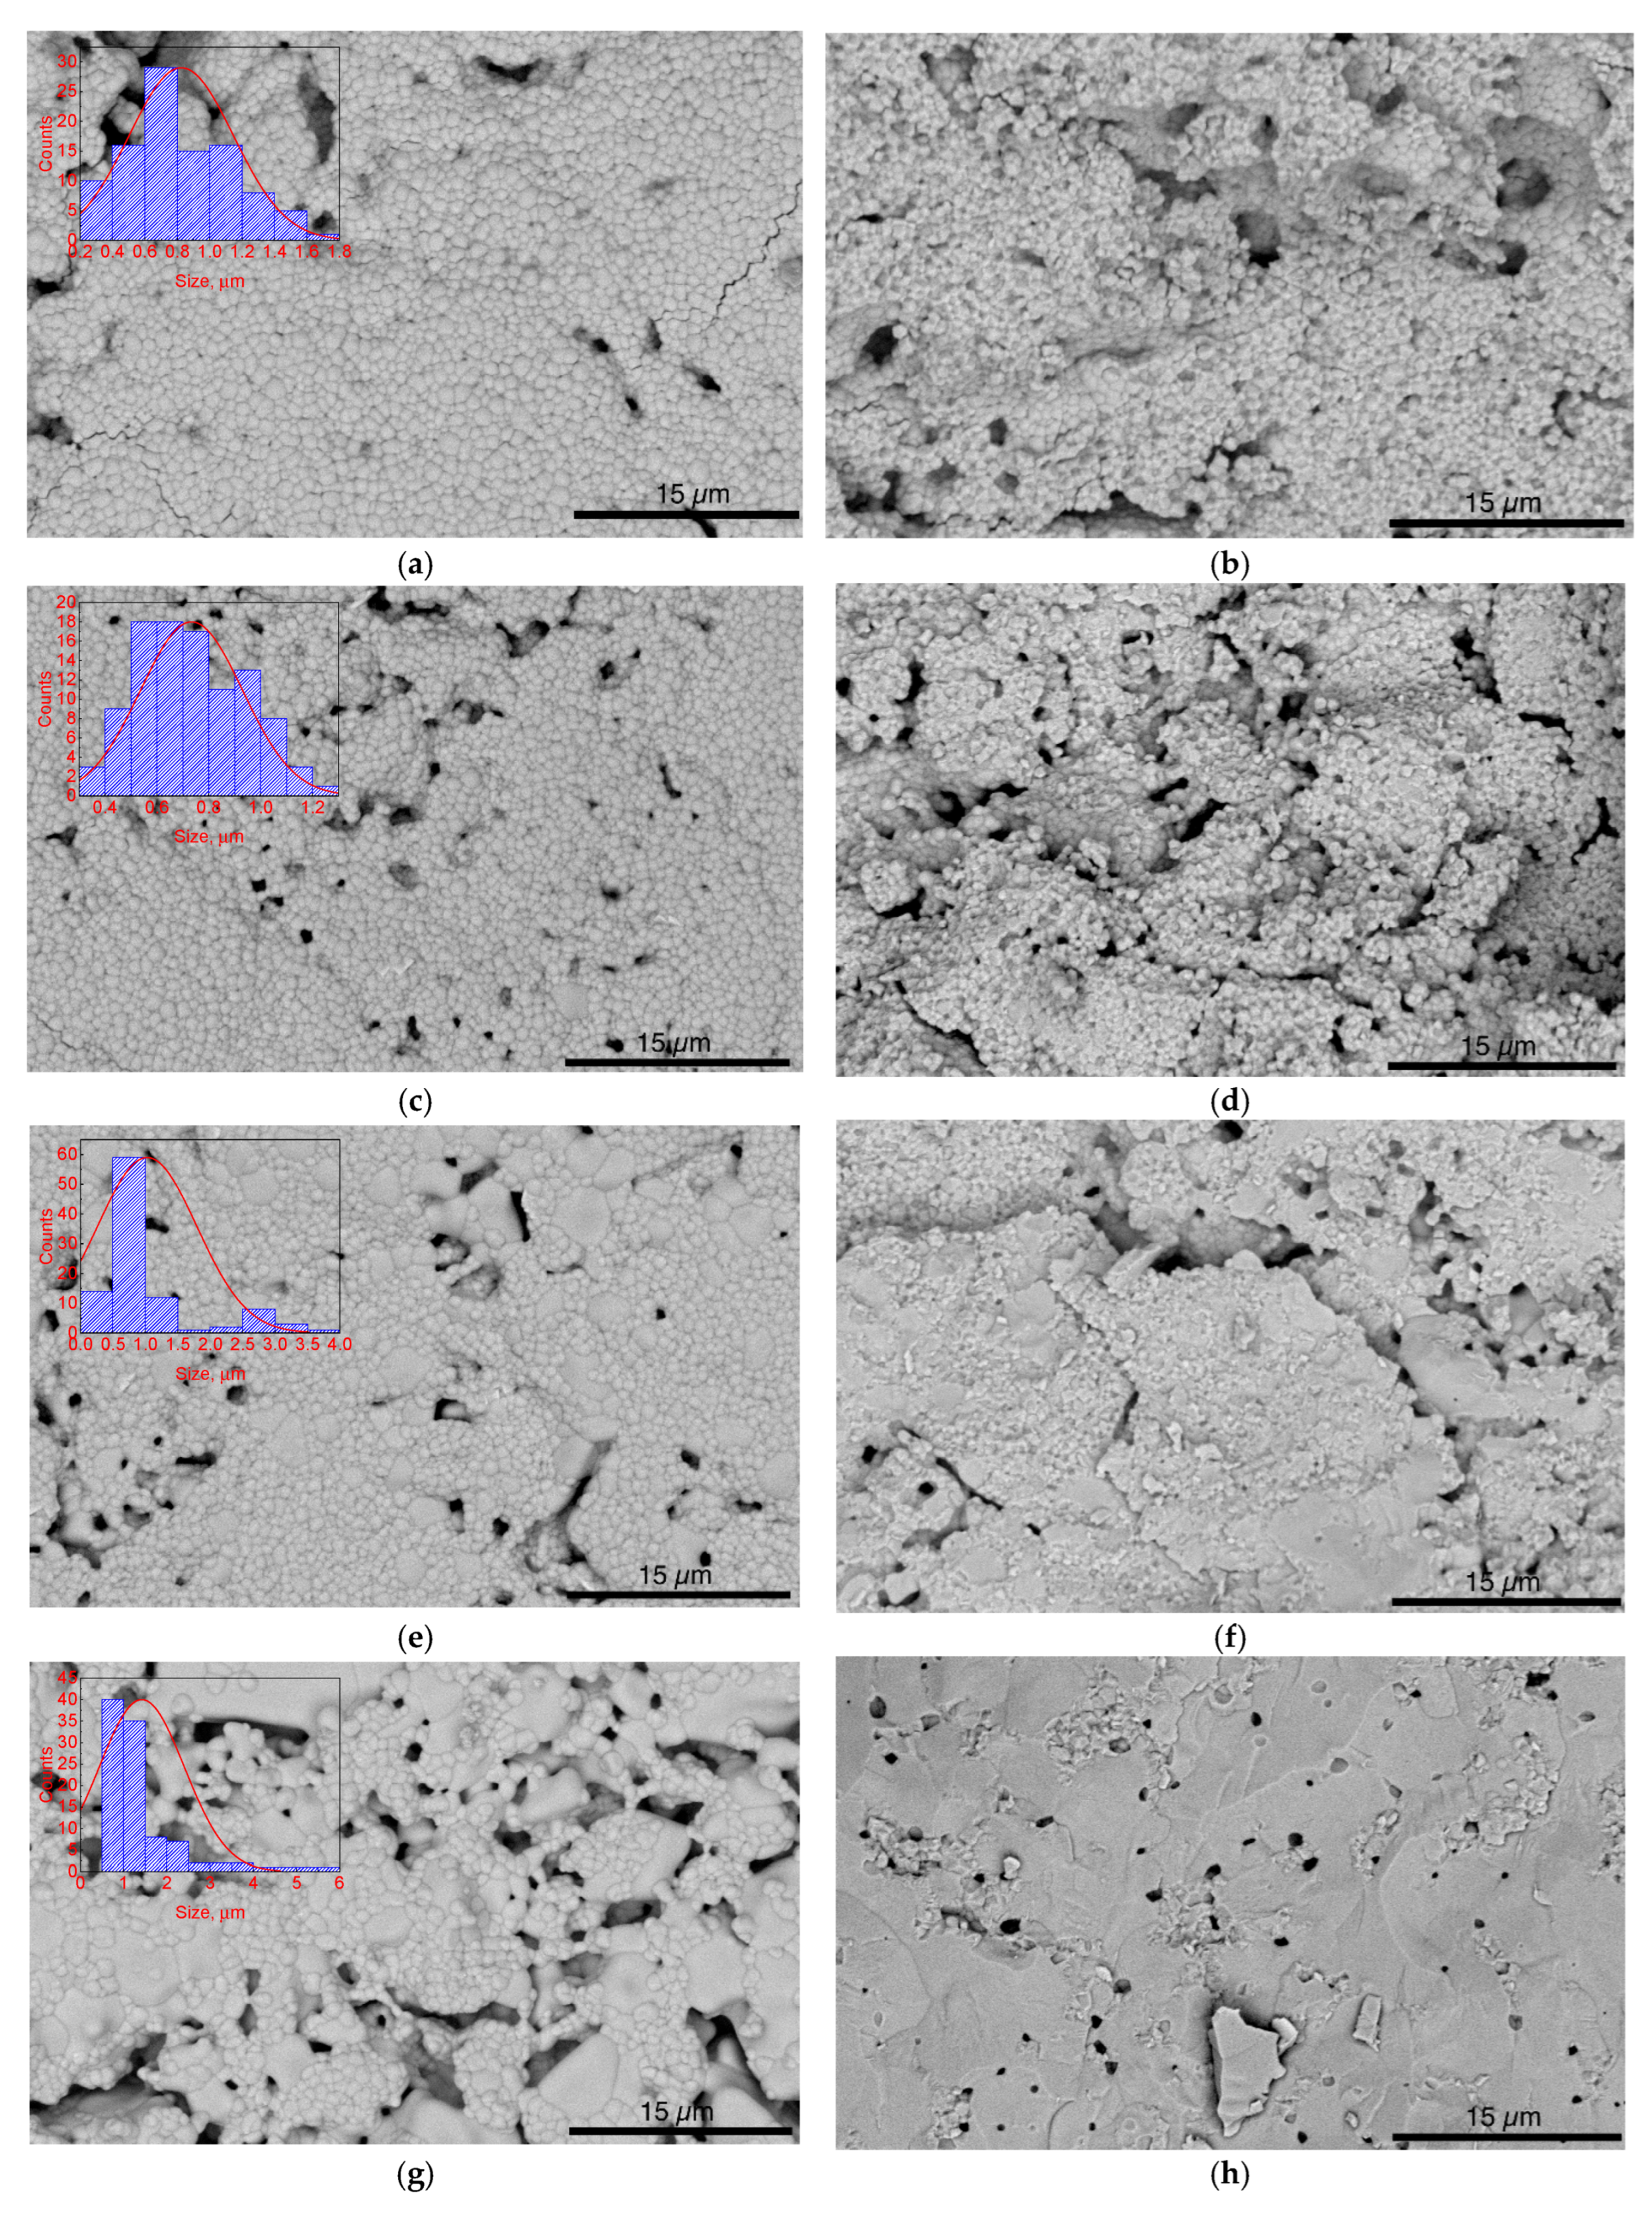
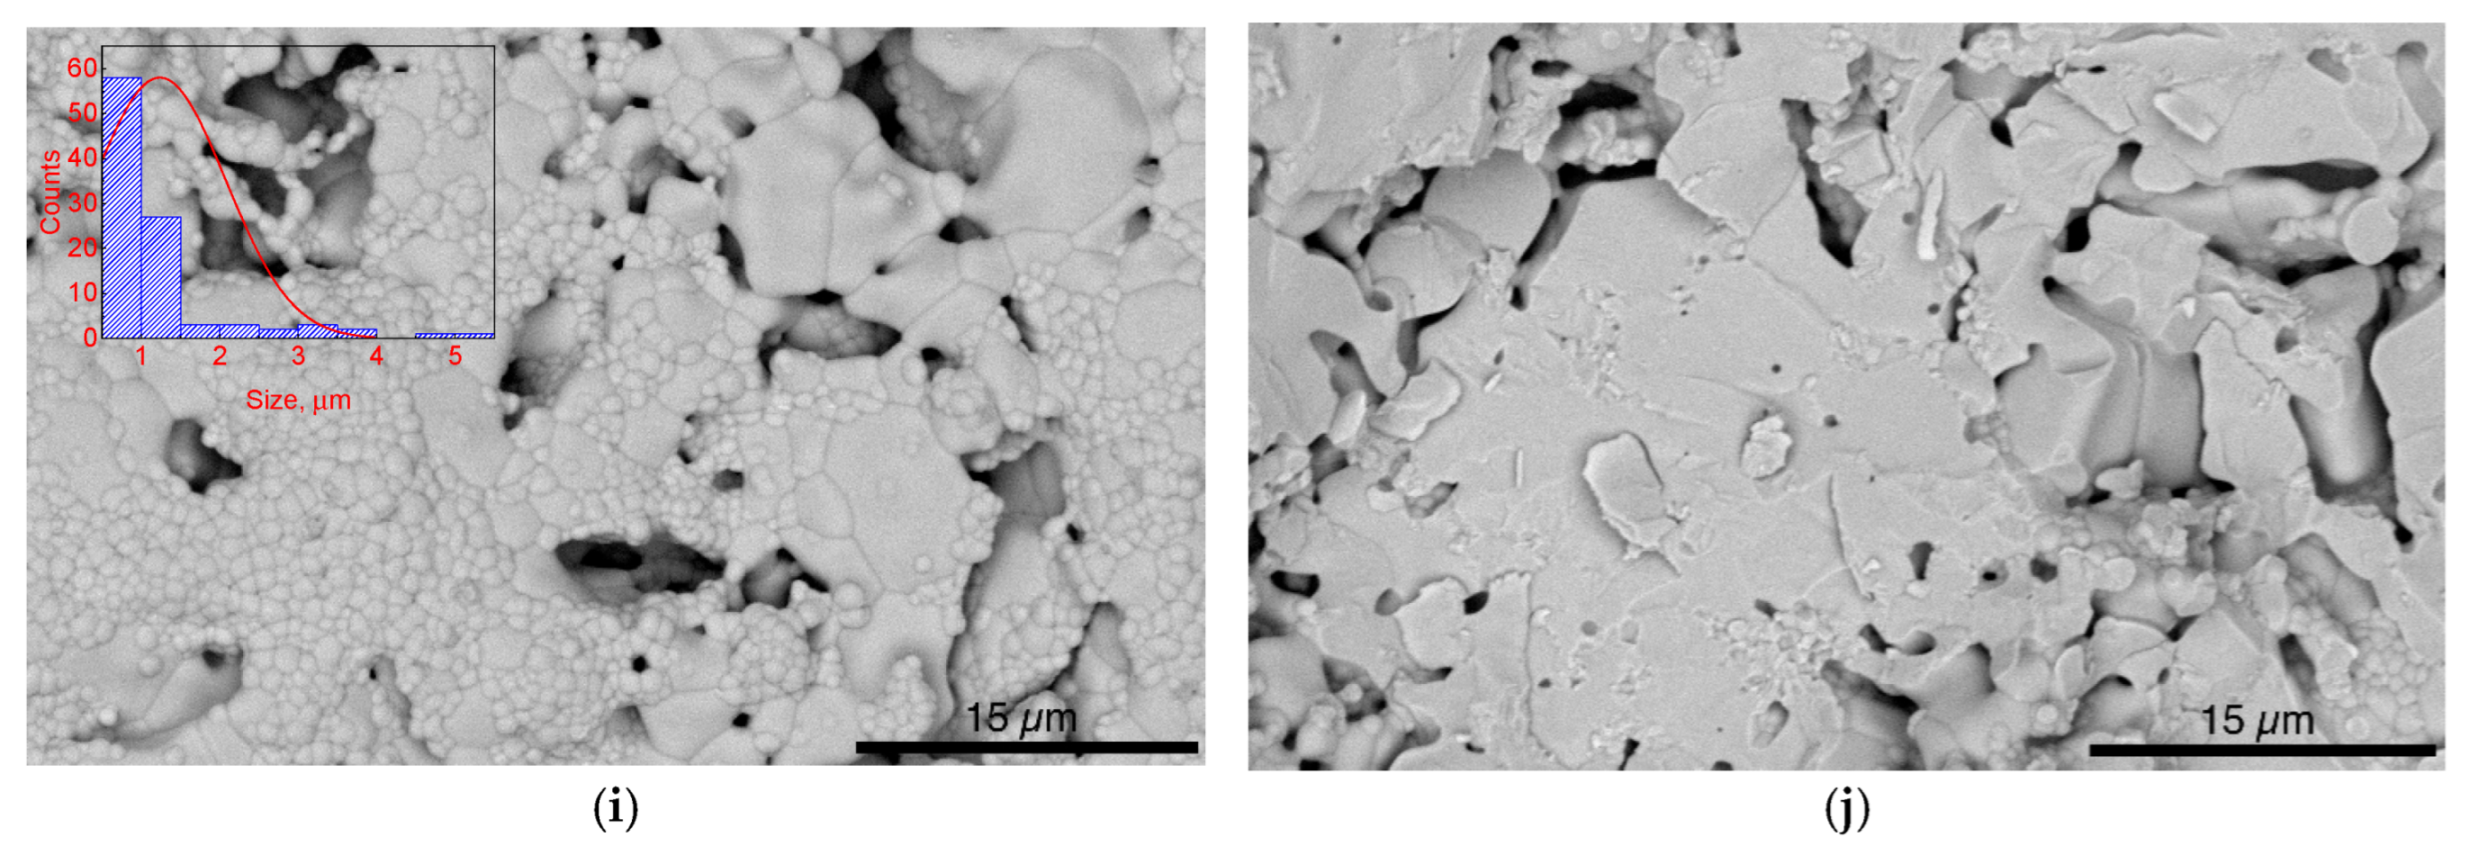
Figure 4 shows SEM images of the surface and cross-sectional views of bulk (1 − x)⸱ZrO2 − x⸱MD ceramic tablets. All samples are characterized by a porous microstructure with grain sizes ranging from 200 nm to 6 μm. In samples with a dopant concentration of x of 0.05 and 0.10 (Figure 3a,c), cracks are observed on the surface, the presence of which can be explained by the c, t → m-ZrO2 phase transition that occurred during high-temperature annealing of the green bodies. Along with an increase in the dopant concentration, an increase in the grain size occurs and the absence of phase transitions occurs. Despite partial preservation of average grain sizes in the range of 400–600 nm for all samples, the proportion of grains sized 2–6 μm increases significantly with increasing concentration of x.
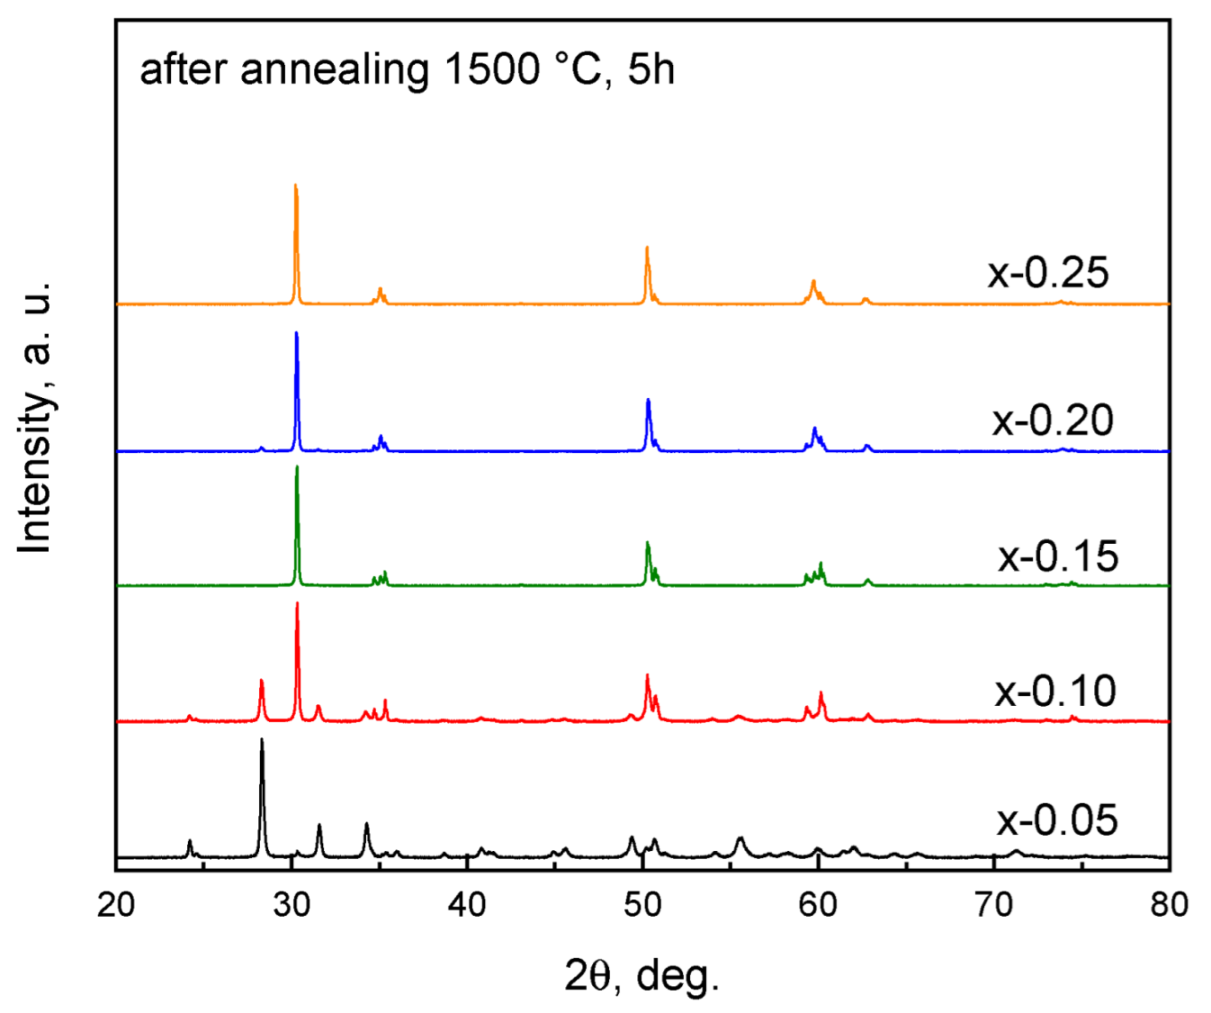
Figure 5 shows XRD data for bulk ceramic samples after sintering at 1500 °C for 5 h. The data shows that the sample with a concentration of x = 0.05 (Figure 5 and Figure S1a,b) is characterized by a predominant content of the m-ZrO2 phase (PDF No. 00-036-0420). The change in phase composition compared to powder samples is due to the increase in particle size due to thermal annealing. During the sintering process, due to the increase in average grain size, the size factor for stabilizing high-temperature phases completely disappears, and stabilizing additives play the primary role. An increase in the concentration of dopants leads to a decrease in the proportion of m-ZrO2 and at the same time rise in the proportion of high-temperature phases c, t-ZrO2. Meanwhile, the Rietveld fitting results (Table 2) show the presence of both t-ZrO2 and c-ZrO2 phases at concentrations of x = 0.10–0.25 (Figure 5 and Figure S1c–j). According to the SEM results, it was established that an increase in the dopant concentration leads to an increase in grain size. It can be assumed that an increase in grain size leads to a grain boundary segregation-induced phase transformation from the tetragonal phase to the cubic phase [42].
Table 3 presents the chemical composition of the synthesized samples, obtained using EDX. Despite the absence of peaks characteristic of CeO2, MgO, Y2O3, and CaO oxides in the XRD patterns, as well as an increase in the unit cell volume and a shift in the peak center due to the incorporation of cations (Table 1), no Mg or Ca elements were detected in the sintered samples. The absence of Mg and Ca in the sintered samples is most likely due to insufficient mineralization of the salts during hydrothermal synthesis. The deviation from the stoichiometric composition is due to the peculiarities of the EDX spectra. The obtained EDX spectra revealed an overlap of the energy peaks of the elements Zr, Y, and Au, used for deposition of the conductive layer. The EDX method also has low accuracy in determining the amount of oxygen. Therefore, during the hydrothermal synthesis of (1 − x)⸱ZrO2 − x⸱MD nanoparticles, a more careful approach to the selection of the type and concentration of mineralizers is required.
Table 2 compares the phase concentrations, lattice volume, porosity, and geometric density of the sintered tablets. The nonlinear change in porosity and density can be explained as follows. It is known that grain boundaries act as sinks for pores and defects. According to SEM results, increasing the dopant concentration leads to an increase in grain size and, consequently, a decrease in grain surface area (interface area). Therefore, pores are less effectively transported to the surface, resulting in the formation of a larger number of intragranular pores, which increase the overall porosity of the tablets.
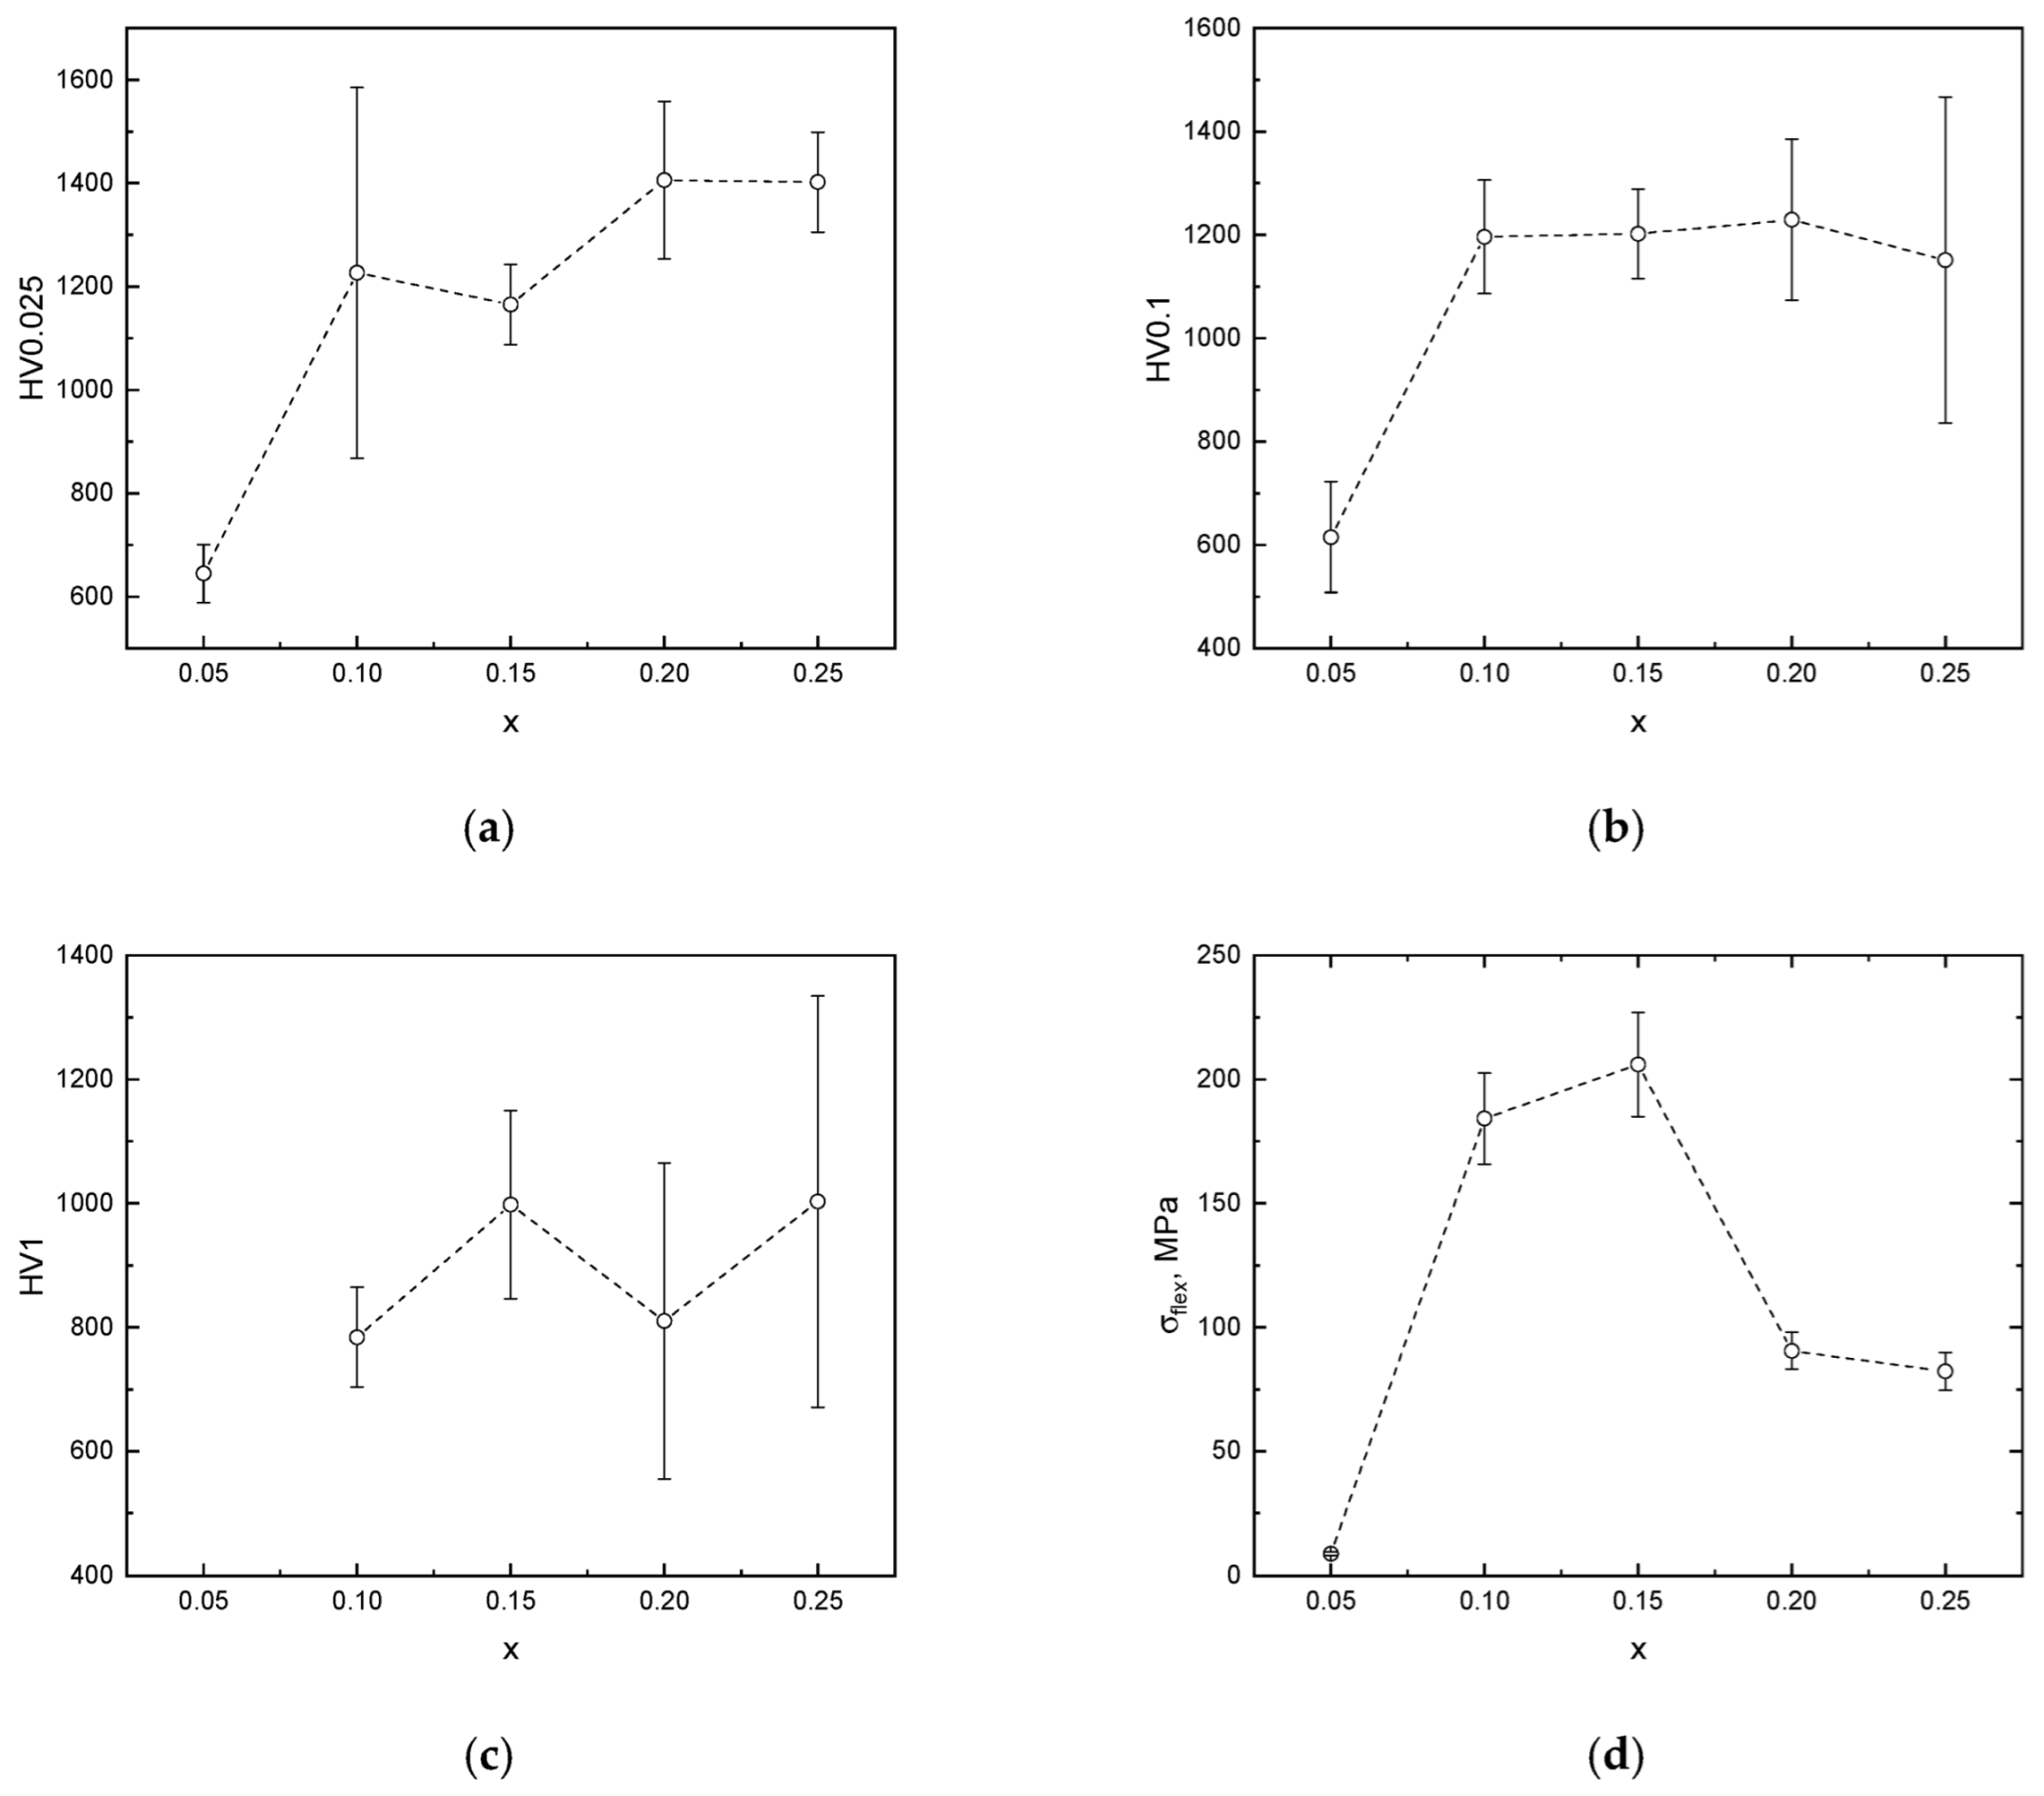
Figure 6 shows the results of HV microhardness measurements under various loads. A microhardness of HV0.025 can reflect the local mechanical properties of a material without the influence of porosity. HV0.1 represents intermediate material properties, taking into account both the local properties of the material and porosity. Finally, the results of HV1 microhardness measurements are directly related to the porosity of the material being measured. When measuring HV0.025 microhardness, it can be seen that increasing the concentration leads to an increase in hardness values due to a decrease in the proportion of the monoclinic phase at low dopant concentrations (Table 3). At the same time, at a load of HV0.1, starting from a concentration of x = 0.10, the microhardness values reach a plateau with a slight decrease. In this case, the porosity of the samples begins to contribute to the material’s hardness. At a load of HV1, the microhardness values vary significantly with both increasing and decreasing concentrations of x and are characterized by high error values, due to the high porosity of the samples. Figure 6d shows the σflex data. In this experiment, σflex characterizes not the local strength properties of the material, but rather its properties at the macroscopic level. The dependence of σflex on concentration shows a maximum at x = 0.15, followed by a sharp decline. This fact may be related to several factors, the most important of which is porosity. Another important factor is the high content of stabilized c,t-ZrO2 phases, which exhibit high flexural strength. The decrease in σflex values is also due to the increased proportion of larger grains. It is known that small grain size can be considered a strengthening factor for ceramics. The propagation of dislocations caused by mechanical stress in a polycrystalline structure can be stopped by the pinning effect at grain boundaries. As the grain boundary area decreases, the likelihood of this effect occurring decreases, which also leads to a decrease in σflex values.
Preliminary results on the synthesis of multidoped zirconia samples have shown that the use of a single mineralizer can lead to the almost complete absence of certain cations in the precursor powders and sintered ceramics. Fabrication of green bodies from nanosized powders results in sintered products with high porosity. During the sintering of bulk ceramics from nanoprecursor with low concentration of MD, t → m and t → c phase transformation occurs, which indicates that the Gibbs–Thomson effect takes place in the micron size grains. According to the chemical reactions (10)–(12), provided in the Supplementary, mutltidoping in Zr1−x(Y0.25xCe0.25xCa0.25xMg0.25x)O2−0.25x creates oxygen vacancy in the range 0.0375–0.1875 vacancies per unit formula. For this reason, the ceramic products synthesized in this study have sufficient strength to be used as components of SOFC. However, their high porosity makes them more suitable for use as cathodes or anodes, after estimation of ionic conductivity. Future studies will focus on the influence of mineralizer selection, pressing conditions, thermal annealing, low-temperature degradation, and high-temperature electrical conductivity measurements to study the effect of multidoping on ionic conductivity in (1 − x)⸱ZrO2 − x⸱MD ceramics.

4. Conclusions

In this study, multidoped ceramics were synthesized from (1 − x)⸱ZrO2 − x⸱MD nanoparticles obtained by the hydrothermal method. It was found that, despite the absence of diffraction peaks related to secondary phases of dopants (MgO, Y2O3, CeO, CaO) in the diffraction patterns of (1 − x)⸱ZrO2 − x⸱MD, Mg and Ca were absent from the ceramic samples. The absence of Mg and Ca can be explained by insufficient mineralization of Mg and Ca salts, which requires additional selection of hydrothermal synthesis parameters. At the same time, the synthesized (1 − x)⸱ZrO2 − x⸱MD particles are characterized by nanoscale size with good size homogeneity. A shift in the peak position and an increase in the unit cell volume indicate the incorporation of doping elements into the ZrO2 crystal lattice. Raman spectroscopy results showed that the nanoparticles are characterized by the presence of only the t-ZrO2 phase. Mechanical properties mostly depend on porosity and grain size in the sintered material. The samples with a concentration of x = 0.15 exhibit the best mechanical properties, such as microhardness (1200 HV0.1) and biaxial flexural strength (200 MPa).

Supplementary Materials

The following supporting information can be downloaded at https://www.mdpi.com/article/10.3390/cryst15100904/s1, Figure S1: XRD patterns and Rietveld analysis results of bulk (1 − x)⸱ZrO2 – x MD samples, where (a,b) x = 0.05, (c,d) x = 0.10, (e,f) x = 0.15, (g,h) x = 0.20, (I,j) x = 0.25; Equations (S1)–(S12): chemical reactions occurring during the synthesis of (1 − x)⸱ZrO2 − x⸱MD nanoparticles.

Author Contributions

Conceptualization, Y.A.G., D.I.S. and R.I.S.; methodology, Y.A.G., R.I.S., D.I.S., D.B.B. and M.E.K.; software, M.A.S.; validation, M.A.S., M.E.K. and R.I.S.; formal analysis, Y.A.G.; investigation, M.E.K., M.A.S. and Y.A.G.; resources, D.B.B.; data curation, R.I.S. and Y.A.G.; writing—original draft preparation, Y.A.G. and R.I.S.; writing—review and editing, Y.A.G., D.I.S. and D.B.B.; visualization, Y.A.G., M.A.S. and M.E.K.; supervision, D.B.B.; project administration, D.I.S.; funding acquisition, D.B.B. and D.I.S. All authors have read and agreed to the published version of the manuscript.

Funding

This research was funded by the Science Committee of the Ministry of Education and Science of the Republic of Kazakhstan (No. BR21882390).

Data Availability Statement

The raw data supporting the conclusions of this article will be made available by the authors on request.

Conflicts of Interest

The authors declare no conflicts of interest.

References

  1. Bi, F.; Ma, S.; Gao, B.; Liu, B.; Huang, Y.; Qiao, R.; Zhang, X. Boosting Toluene Deep Oxidation by Tuning Metal-Support Interaction in MOF-Derived Pd@ZrO2 Catalysts: The Role of Interfacial Interaction between Pd and ZrO2. Fuel 2024, 357, 129833. [Google Scholar] [CrossRef]
  2. Peuchert, U.; Okano, Y.; Menke, Y.; Reichel, S.; Ikesue, A. Transparent Cubic-ZrO2 Ceramics for Application as Optical Lenses. J. Eur. Ceram. Soc. 2009, 29, 283–291. [Google Scholar] [CrossRef]
  3. Abrashov, A.A.; Grigoryan, N.S.; Vagramyan, T.A.; Meshalkin, V.P.; Kotel’nikova, A.V.; Gribanova, A.A. Protective Adhesive Zirconium Oxide Coatings. Prot. Met. Phys. Chem. Surf. 2016, 52, 1170–1174. [Google Scholar] [CrossRef]
  4. Fang, H.; Wang, W.; Deng, S.; Yang, T.; Zhu, H.; Huang, J.; Ye, D.; Guo, X. Interaction between Yb2O3-Y2O3 Co-Stabilized ZrO2 Ceramic Powder and Molten Silicate Deposition, and Its Implication on Thermal Barrier Coating Application. Mater. Charact. 2021, 180, 111418. [Google Scholar] [CrossRef]
  5. Malode, S.J.; Shetti, N.P. ZrO2 in Biomedical Applications. In Metal Oxides for Biomedical and Biosensor Applications; Elsevier: Amsterdam, The Netherlands, 2022; pp. 471–501. [Google Scholar] [CrossRef]
  6. Bortot Coelho, F.E.; Magnacca, G.; Boffa, V.; Candelario, V.M.; Luiten-Olieman, M.; Zhang, W. From Ultra to Nanofiltration: A Review on the Fabrication of ZrO2 Membranes. Ceram. Int. 2023, 49, 8683–8708. [Google Scholar] [CrossRef]
  7. Agarkov, D.; Borik, M.; Buzaeva, E.; Korableva, G.; Kulebyakin, A.; Kuritsyna, I.; Larina, N.; Kyashkin, V.; Lomonova, E.; Milovich, F.; et al. Structure and Physical Properties of Ceramic Materials Based on ZrO2-Sc2O3 for SOFC Electrolytic Membranes Obtained from Powders of Melted Solid Solutions with a Similar Composition. Membranes 2023, 13, 717. [Google Scholar] [CrossRef] [PubMed]
  8. KERAMIDAS, V.G.; WHITE, W.B. Raman Scattering Study of the Crystallization and Phase Transformations of ZrO2. J. Am. Ceram. Soc. 1974, 57, 22–24. [Google Scholar] [CrossRef]
  9. Chen, B.; Wu, M.; Liu, Q.; He, C.; Yang, Y.; Ye, X.; Gao, C.; Huang, Z.; Min, X.; Zheng, X.; et al. One-Step Synthesis of t-ZrO2 from Zircon Using Magnesium-Calcium Minerals as Stabilizers. Ceram. Int. 2022, 48, 29997–30004. [Google Scholar] [CrossRef]
  10. Zhang, H.; Lu, H.; Zhu, Y.; Li, F.; Duan, R.; Zhang, M.; Wang, X. Preparations and Characterizations of New Mesoporous ZrO2 and Y2O3-Stabilized ZrO2 Spherical Powders. Powder Technol. 2012, 227, 9–16. [Google Scholar] [CrossRef]
  11. Giniyatova, S.G.; Shakirzyanov, R.I.; Garanin, Y.A.; Sailaukhanov, N.A.; Kozlovskiy, A.L.; Volodina, N.O.; Shlimas, D.I.; Borgekov, D.B. Investigation of the Phase Composition, Structural, Mechanical, and Dielectric Properties of (1 − x)∙ZrO2-X∙CeO2 Ceramics Synthesized by the Solid-State Method. Appl. Sci. 2024, 14, 2663. [Google Scholar] [CrossRef]
  12. Thakur, M.; Vij, A.; Singh, F.; Rangra, V.S. Spectroscopic Studies of Metastable Tetragonal ZrO2 Nanocrystals. Spectrochim. Acta A Mol. Biomol. Spectrosc. 2024, 305, 123495. [Google Scholar] [CrossRef] [PubMed]
  13. Garanin, Y.; Shakirziyanov, R.; Borgekov, D.; Volodina, N.; Shlimas, D.; Zdorovets, M. Influence of Precursors and Mineralizers on Phase Formation in ZrO2 Nanoparticles Synthesized by the Hydrothermal Method. Sci. Rep. 2025, 15, 26165. [Google Scholar] [CrossRef]
  14. Matsui, K.; Nakamura, K.; Saito, M.; Kuwabara, A.; Yoshida, H.; Ikuhara, Y. Low-Temperature Degradation in Yttria-Stabilized Tetragonal Zirconia Polycrystal: Effect of Y3+ Distribution in Grain Interiors. Acta Mater. 2022, 227, 117659. [Google Scholar] [CrossRef]
  15. Czeppe, T.; Zieba, P.; Pawlowski, A. Crystallographic and Microchemical Characterization of the Early Stages of Eutectoid Decomposition in MgO-Partially Stabilized ZrO2. J. Eur. Ceram. Soc. 2002, 22, 35–40. [Google Scholar] [CrossRef]
  16. Petriceanu, M.; Ioniță, F.G.; Piticescu, R.R.; Nicoară, A.I.; Matei, A.C.; Ioța, M.A.; Tudor, I.A.; Caramarin, Ș.; Ciobota, C.F. Effect of Doping ZrO2 on Structural and Thermal Properties. Inorganics 2024, 12, 290. [Google Scholar] [CrossRef]
  17. Ma, X.; Gong, J.; Wang, J.; Li, A.; Gao, P.; Wang, X.; Yang, B. Microstructure and High-Temperature Phase Stability of Co-Precipitation (Mg0.2Al0.2Ce0.2Y0.2Zr0.2)O1.6 High Entropy Ceramics Powders. Ceram. Int. 2024, 50, 40181–40184. [Google Scholar] [CrossRef]
  18. Sathya, A.; Anburaj, D.B.; Porkalai, V.; Muthuvel, A.; Al-Zaqri, N. Hydrothermal Synthesis of ZrO2 Nanoparticles: Study on Structural, Optical, Morphology Properties and Photocatalyst Activity. Phys. Solid. State 2025, 67, 196–206. [Google Scholar] [CrossRef]
  19. Mohsen, Q.; Al-Gethami, W.S.; Zaki, Z.; Alotaibi, S.H.; Ibrahim, M.M.; Ezzat, M.; Amin, M.A.; Kamel, M.M.; Mostafa, N.Y. Effect of PH on Hydrothermal Synthesis of ZrO2 Nanoparticles and Their Electrocatalytic Activity for Hydrogen Production. Int. J. Electrochem. Sci. 2022, 17, 22073. [Google Scholar] [CrossRef]
  20. Tsukada, T.; Venigalla, S.; Morrone, A.A.; Adair, J.H. Low-Temperature Hydrothermal Synthesis of Yttrium-Doped Zirconia Powders. J. Am. Ceram. Soc. 1999, 82, 1169–1174. [Google Scholar] [CrossRef]
  21. Zhi, H.; Gao, L.; Zhang, S.; Liu, S.; Zhao, J. Hydrothermal Synthesized F Doped ZrO2 Powders with Novel Photocatalytic Activities. Inorg. Chem. Commun. 2024, 162, 112170. [Google Scholar] [CrossRef]
  22. Li, Q.; Liu, L.; Wang, Z.; Wang, X. Continuous Hydrothermal Flow Synthesis and Characterization of ZrO2 Nanoparticles Doped with CeO2 in Supercritical Water. Nanomaterials 2022, 12, 668. [Google Scholar] [CrossRef]
  23. Reddy, C.V.; Reddy, I.N.; Shim, J.; Kim, D.; Yoo, K. Synthesis and Structural, Optical, Photocatalytic, and Electrochemical Properties of Undoped and Yttrium-Doped Tetragonal ZrO2 Nanoparticles. Ceram. Int. 2018, 44, 12329–12339. [Google Scholar] [CrossRef]
  24. Lee, J.H.; Kim, J.; Kim, S.W.; Lee, H.W.; Song, H.S. Characterization of the Electrical Properties of Y2O3-Doped CeO2-Rich CeO2–ZrO2 Solid Solutions. Solid. State Ion. 2004, 166, 45–52. [Google Scholar] [CrossRef]
  25. Wen, T.; Yuan, L.; Yan, Z.; Jin, Y.; Liu, Z.; Yu, J. Enhancement of the Electrochemical Performance in MgO Stabilized ZrO2 Oxygen Sensors by Co-Doping Trivalent Metal Oxides. Curr. Appl. Phys. 2022, 39, 133–139. [Google Scholar] [CrossRef]
  26. Park, M.S.; Jo, K.; Lee, H.; Lee, H. Lu2O3–Y2O3–ZrO2: A Lu3+ Co-Doped YSZ System—Oxygen-Ion Conductor with High Electrical Conductivity and Improved Mechanical Properties. J. Mater. Res. Technol. 2023, 27, 8403–8411. [Google Scholar] [CrossRef]
  27. Turon-Vinas, M.; Zhang, F.; Vleugels, J.; Anglada, M. Effect of Calcia Co-Doping on Ceria-Stabilized Zirconia. J. Eur. Ceram. Soc. 2018, 38, 2621–2631. [Google Scholar] [CrossRef]
  28. Wen, T.; Yuan, L.; Liu, T.; Sun, Q.; Jin, E.; Tian, C.; Yu, J. Enhanced Ionic Conductivity and Thermal Shock Resistance of MgO Stabilized ZrO2 Doped with Y2O3. Ceram. Int. 2020, 46, 19835–19842. [Google Scholar] [CrossRef]
  29. Jin, E.; Yuan, L.; Yu, J.; Ding, D.; Xiao, G. Enhancement of Thermal Shock and Slag Corrosion Resistance of MgO–ZrO2 Ceramics by Doping CeO2. Ceram. Int. 2022, 48, 13987–13995. [Google Scholar] [CrossRef]
  30. Zeeshan, N.; Rafiuddin. Solid Electrolytes Based on {1 − (X + y)}ZrO2-(x)MgO-(y)CaO Ternary System: Preparation, Characterization, Ionic Conductivity, and Dielectric Properties. J. Adv. Res. 2018, 9, 35–41. [Google Scholar] [CrossRef]
  31. Yeh, T.H.; Chou, C.C. Doping Effect and Vacancy Formation on Ionic Conductivity of Zirconia Ceramics. J. Phys. Chem. Solids 2008, 69, 386–392. [Google Scholar] [CrossRef]
  32. Lang, J.; Ren, K.; Wang, Y. Probing the Long-Term Thermal Stability Mechanism of Multi-Rare-Earth Oxide-Doped Zirconia for Solid Oxide Fuel Cell Electrolyte. J. Eur. Ceram. Soc. 2024, 44, 116681. [Google Scholar] [CrossRef]
  33. Kumar, A.; Kumar, P.; Dhaliwal, A.S. Phase Transformation Behavior of Ca-Doped Zirconia Sintered at Different Temperatures. J. Korean Ceram. Soc. 2022, 59, 370–382. [Google Scholar] [CrossRef]
  34. Salikhodzha, Z.M.; Bairbayeva, G.B.; Popov, A.I.; Kassymkhanova, R.N.; Zhangylyssov, K.B.; Popova, E.; Konuhova, M. DFT Study of Oxygen Ion Migration in Mg-Doped Cubic Zirconia. Solids 2025, 6, 55. [Google Scholar] [CrossRef]
  35. Mahato, N.; Gupta, A.; Balani, K. Doped Zirconia and Ceria-Based Electrolytes for Solid Oxide Fuel Cells: A Review. Nanomater. Energy 2012, 1, 27–45. [Google Scholar] [CrossRef]
  36. Kelly, J.R.; Denry, I. Stabilized Zirconia as a Structural Ceramic: An Overview. Dent. Mater. 2008, 24, 289–298. [Google Scholar] [CrossRef] [PubMed]
  37. Toraya, H. Whole-Powder-Pattern Fitting without Reference to a Structural Model: Application to X-Ray Powder Diffraction Data. J. Appl. Crystallogr. 1986, 19, 440–447. [Google Scholar] [CrossRef]
  38. Szepesi, C.J.; Adair, J.H. High Yield Hydrothermal Synthesis of Nano-Scale Zirconia and YTZP. J. Am. Ceram. Soc. 2011, 94, 4239–4246. [Google Scholar] [CrossRef]
  39. Stawarczyk, B.; Özcan, M.; Hallmann, L.; Ender, A.; Mehl, A.; Hämmerlet, C.H.F. The Effect of Zirconia Sintering Temperature on Flexural Strength, Grain Size, and Contrast Ratio. Clin. Oral. Investig. 2013, 17, 269–274. [Google Scholar] [CrossRef]
  40. Garanin, Y.; Shakirzyanov, R.; Borgekov, D.; Kozlovskiy, A.; Volodina, N.; Shlimas, D.; Zdorovets, M. Study of Morphology, Phase Composition, Optical Properties, and Thermal Stability of Hydrothermal Zirconium Dioxide Synthesized at Low Temperatures. Sci. Rep. 2024, 14, 29398. [Google Scholar] [CrossRef] [PubMed]
  41. Mishra, S.; Kumar, L.; Firoz, M.K.; Lakshya, A.K.; Roy, A.; Chowdhury, A. Correlation between Oxygen-Related Defects and Lattice Strain in Tetragonal Phase Stabilized Doped-Zirconia Systems. Materialia 2023, 32, 101895. [Google Scholar] [CrossRef]
  42. Matsui, K.; Horikoshi, H.; Ohmichi, N.; Ohgai, M.; Yoshida, H.; Ikuhara, Y. Cubic-Formation and Grain-Growth Mechanisms in Tetragonal Zirconia Polycrystal. J. Am. Ceram. Soc. 2003, 86, 1401–1408. [Google Scholar] [CrossRef]
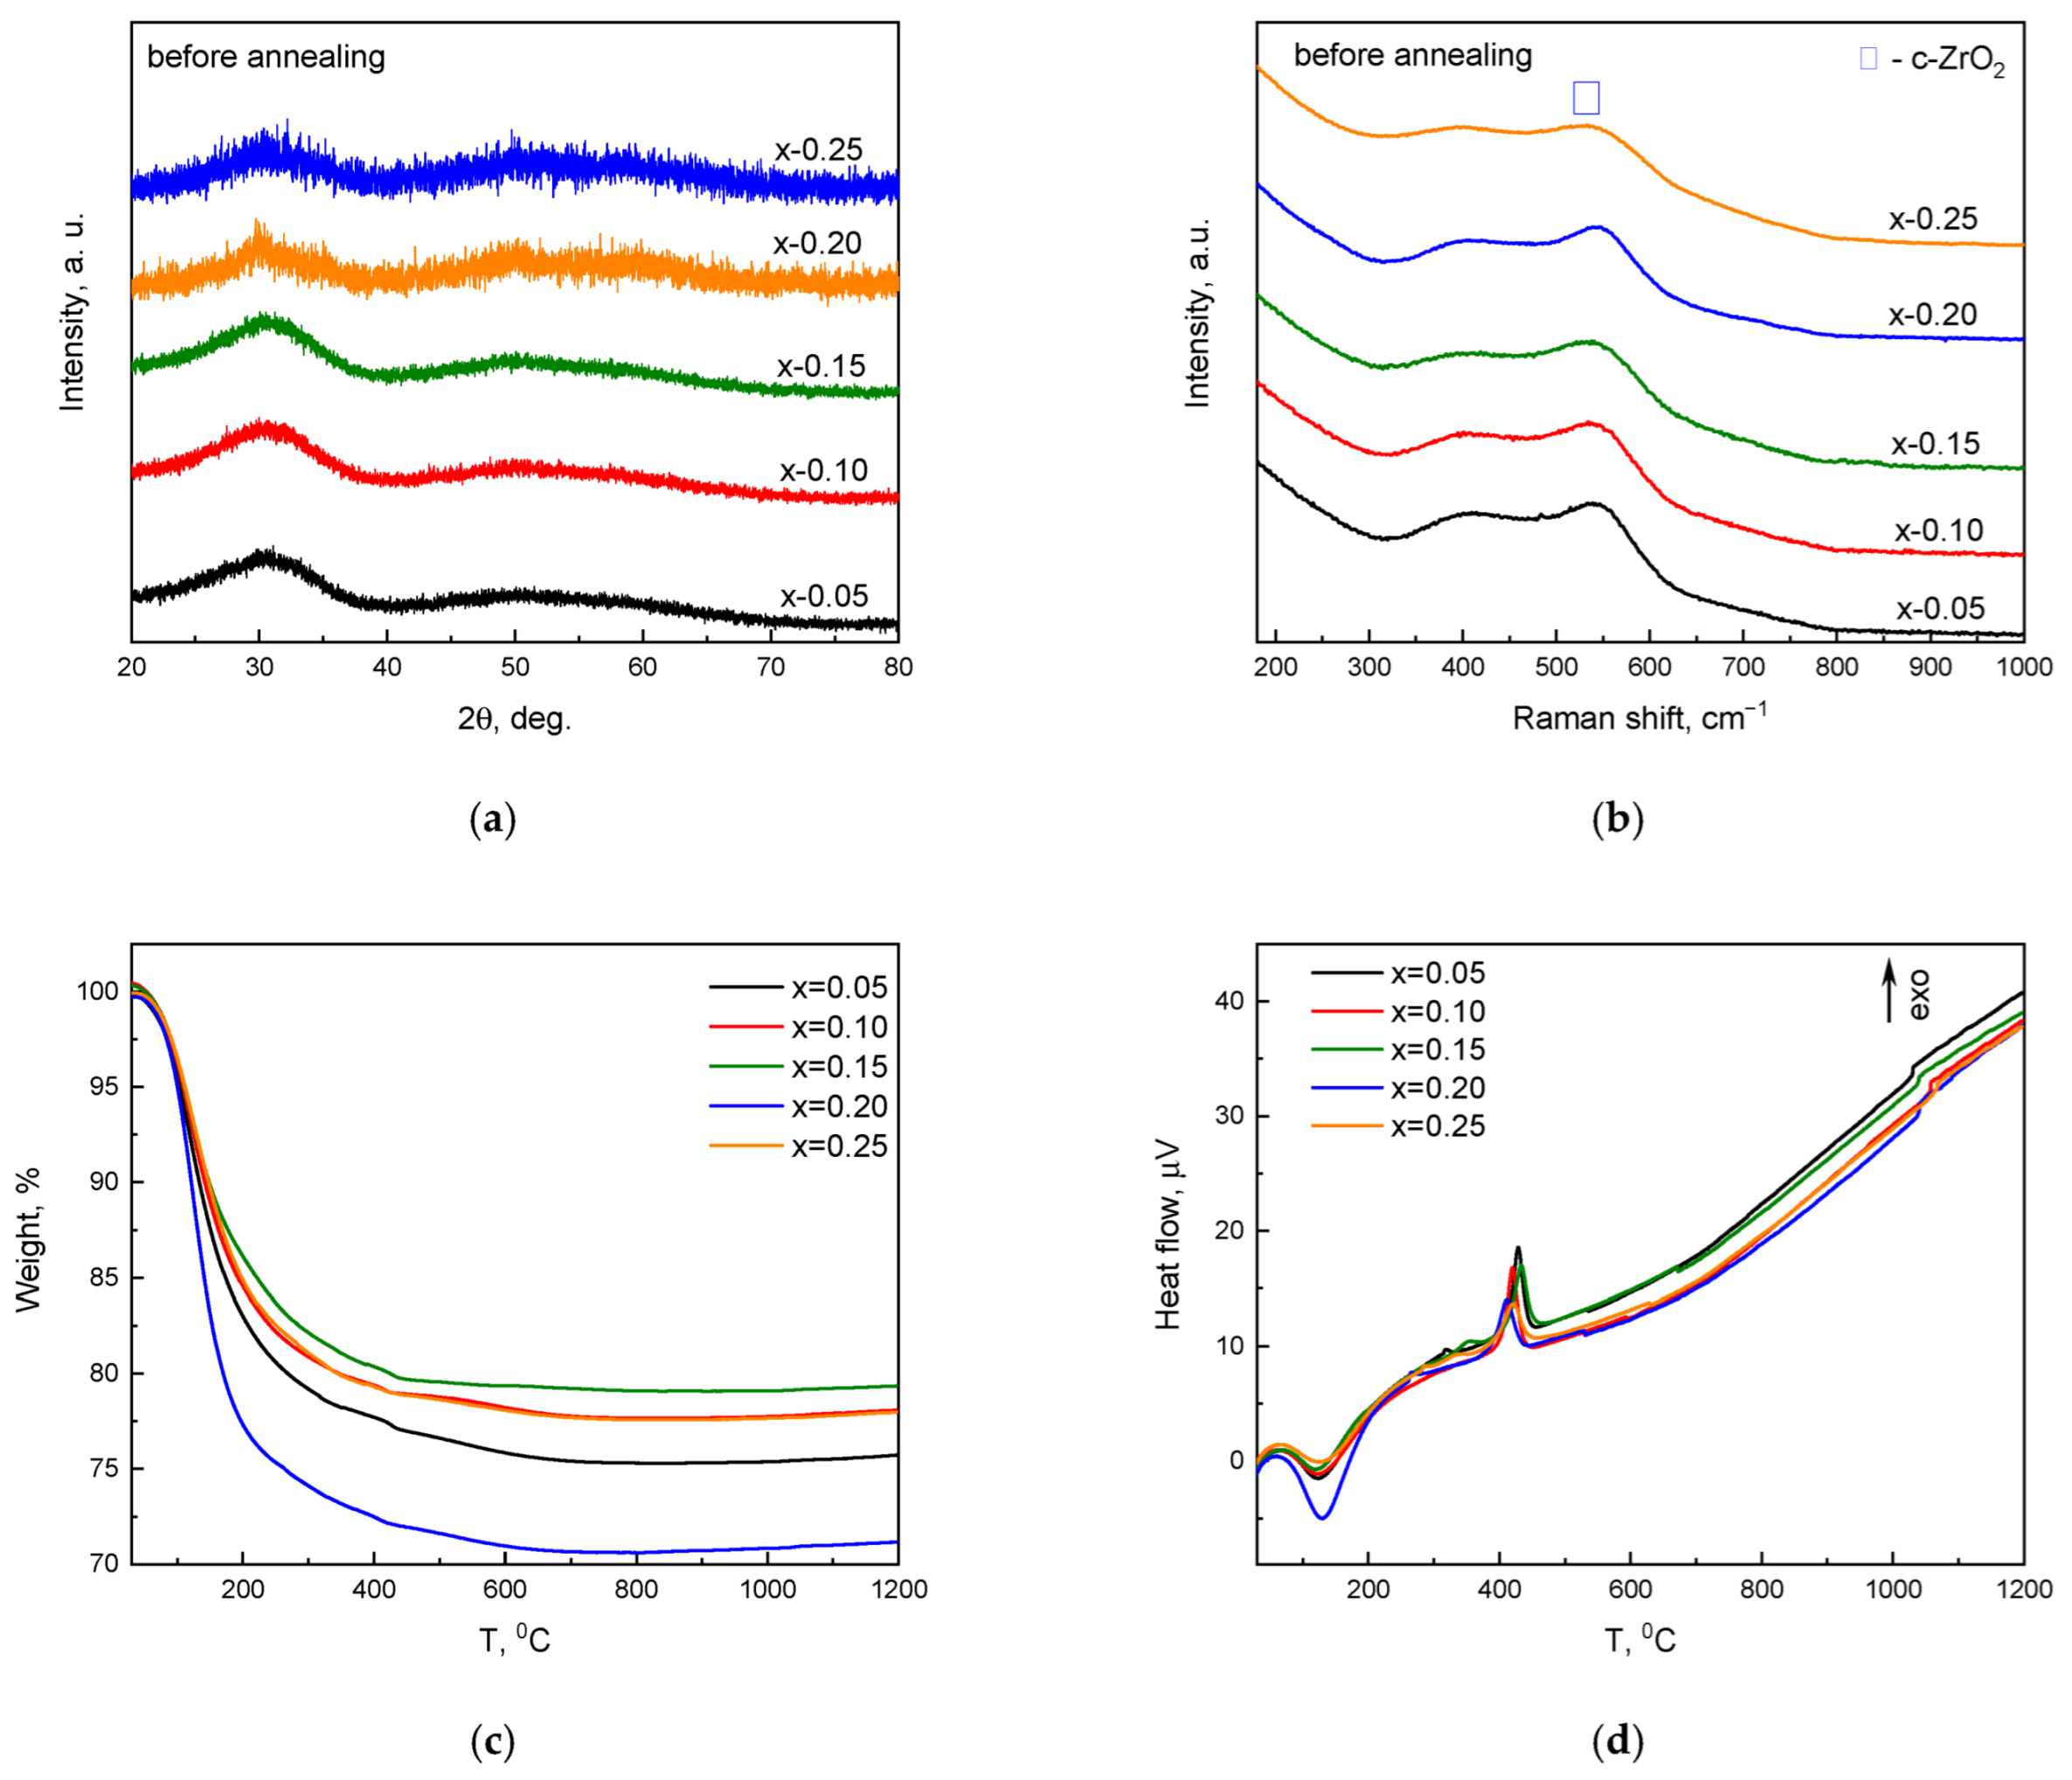
Figure 1. XRD patterns (a), Raman spectra (b), TGA (c) and DTA (d) thermograms of (1 − x)⸱ZrO2 − x⸱MD nanoparticles before annealing.
Crystals 15 00904 g001
Figure 2. XRD patterns (a) and Raman spectra (b) of (1 − x)⸱ZrO2 − x⸱MD nanoparticles after annealing.
Crystals 15 00904 g002
Figure 3. SEM images of (1 − x)⸱ZrO2-x⸱MD nanoparticles, where (ae) x = 0.05–0.25, respectively.
Crystals 15 00904 g003
Figure 4. SEM images of the surface (a,c,e,g,i) and cross-sections (b,d,f,h,j) of (1 − x)⸱ZrO2 − x⸱MD ceramic samples after sintering, where (a,b) x = 0.05, (c,d) x = 0.10, (e,f) x = 0.15, (g,h) x = 0.20, (i,j) x = 0.25.
Crystals 15 00904 g004aCrystals 15 00904 g004b
Figure 5. XRD patterns of bulk (1 − x)⸱ZrO2 − x⸱MD samples after annealing 1500 °C.
Crystals 15 00904 g005
Figure 6. Results of measuring microhardness HV at different loads (ac) and σflex (d).
Crystals 15 00904 g006
Table 1. Lattice parameters (a, c), unit cell volume (V) for t-ZrO2 phase, weighted profile R-factor (Rwp), and profile R-factor (Rp) for (1 − x)⸱ZrO2 − x⸱MD nanoparticles after annealing at 650 °C.
x, mol.%a, Åc, ÅV, Å3Rwp, %Rp, %
0.053.60065.185767.22917.0512.90
0.103.61025.188467.62517.6913.29
0.153.61395.180667.66217.7913.48
0.203.62565.184168.14616.9612.75
0.253.62715.195568.35017.8813.49
Table 2. Phase composition, unit cell volume, porosity and density of bulk samples (1 − x)⸱ZrO2 − x⸱MD.
xPhase NamePhase Content, %StatisticVPorosity, % ρ e x p , g/cm2
RwpRpΧ2
0.05m-ZrO294.469.847.062.0666141.724104.99
t-ZrO25.5467.357
c-ZrO20
0.1m-ZrO246.289.237.001.7646142.44275.41
t-ZrO244.5967.645
c-ZrO29.13134.794
0.15m-ZrO207.665.851.1584-95.39
t-ZrO272.467.686
c-ZrO227.6135.944
0.2m-ZrO25.68.426.511.3798142.187174.87
t-ZrO235.467.659
c-ZrO259.0135.983
0.25m-ZrO209.357.031.7145-164.87
t-ZrO227.267.764
c-ZrO272.8136.548
Table 3. Elemental composition of bulk samples (1 − x)⸱ZrO2 − x⸱MD.
x, mol.%Zr, wt %Y, wt %Ce, wt %Mg, wt %Ca, wt %O, wt %
ExperimentTheoreticalExperimentTheoreticalExperimentTheoreticalExperimentTheoreticalExperimentTheoreticalExperimentTheoretical
0.0570.570.840.20.910.41.430.00.250.00.4128.926.16
0.1072.367.611.11.833.92.880.00.500.00.8322.726.35
0.1569.764.332.12.775.44.360.00.760.01.2522.826.55
0.2066.560.993.53.726.95.860.01.020.01.6723.126.74
0.2562.557.614.24.687.67.370.01.280.02.1125.726.95
Disclaimer/Publisher’s Note: The statements, opinions and data contained in all publications are solely those of the individual author(s) and contributor(s) and not of MDPI and/or the editor(s). MDPI and/or the editor(s) disclaim responsibility for any injury to people or property resulting from any ideas, methods, instructions or products referred to in the content.