Abstract
This work is motivated by the need to enhance efficiency and radiation resistance and reduce weight in high-performance photovoltaic devices, with applications spanning both terrestrial and space environments. Metamorphic buffers are key enablers for reducing defect formation in lattice-mismatched structures, which are among the most widespread technologies for high-efficiency photovoltaic energy conversion. Although many systems have been created, absolute certainty about the effective relaxation mechanism remains unattained. In this work, MOVPE-grown step-graded buffers with variable In content were obtained on Ge substrates and investigated to identify the critical thresholds that govern strain relaxation and defect formation. The results show that the buffers are fully strained when the In top-layer content is <6.0%, while a degree of relaxation in the entire structure appears when the In top-layer content is >6.0%. In addition, the relaxation phenomenon is paralleled by the formation of a tilt angle between the layers and the substrate. We also found evidence that the appearance of relaxation is not limited to the upper layer but is presented by the structure as a whole. The effects of Te doping inside the InGaAs layers were also investigated: Te does not influence the structure of the crystal, but it introduces a Burstein–Moss blue shift in the photoluminescence energy of about 20 meV. Eventually, to reduce defect formation with the goal of achieving high-efficiency photovoltaic devices, a thick layer with a lower In content was grown onto the overshoot material (In0.12Ga0.88As). The results obtained confirm the high quality of the buffers and unveil the critical points, which are responsible for the most important changes in the buffer architecture and should be considered in future material engineering. The results provide valuable insights for the design of high-performance, sustainable photovoltaic devices and contribute to the advancement of III–V semiconductor integration on Ge substrates.
1. Introduction
In recent years, the growing energy demand, together with the increase in efficiency needs, has boosted the research of photovoltaic (PV) technologies with a focus on the production of high-efficiency multi-junction (MJ) solar cells, with the aim of maximising the output power per unit area [1,2]. However, the development and large-scale application of such devices are hampered by their high cost and the complexity of their systems [3,4], and the identification of a sustainable approach is essential to create a competitive solution in the solar energy market. In particular, efforts to come up with more efficient solutions are mainly triggered by an increase in population density in big cities, where the space available is small and the cost of land is high [5,6], and by space application technologies [4,7,8,9] which demand both improved efficiency and radiation resistance on the one hand and reduced weight on the other. Metamorphics (MMs), buffer structures obtained by metal organic vapour phase epitaxy, have attracted a great deal of attention for their potential to reduce defects in lattice-mismatched structures. In particular, by engineering their bandgap, it is possible to meet electronic requirements [10], tackling current mismatch limitations associated with the monolithic triple-junction (3J) InGaP/InGaAs/Ge cells [11]. Amongst the different architectures, step-graded ones have proven effective in minimising roughness and defects [12]. However, the relaxation thresholds and underlying mechanisms are still not fully understood. In addition, many systems grown on GaAs substrates [10,11,13,14] have been reported, while very little research has been carried out with Ge ones. The adoption of a Ge substrate is integral to the development of upright MM structures. In this approach, the mechanical detachment of the substrate [15] supports a more sustainable fabrication process by enabling substrate reuse—potentially lowering production costs—and facilitating the realisation of lighter devices. While inverted MM structures require an InGaP buffer to ensure that most of the light reaches the InGaAs bottom cell [16], upright structures only require an InGaAs buffer, since the Ge bottom junction has a lower bandgap (Eg) than InGaAs [17]. Herein, we investigate step-graded MM structures of InxGa1−xAs grown on Ge substrates, employing AlGaAs as a nucleation layer. Starting from a lattice-matched film, we sequentially deposited InGaAs layers with increasing In content. Then, we investigated the relaxation mechanisms of these MM structures step by step by High-Resolution X-Ray Diffraction (HRXRD) and Reciprocal Space Maps (RSMs), and we correlated the structural properties’ evolution with surface roughness analysed by Atomic Force Microscopy (AFM). Both techniques identified the range between 6.0 and 8.0% as the In composition conditions in which relaxation occurs and misfit dislocations appear. Photoluminescence (PL) spectroscopy allowed us to probe the optical properties of the InGaAs layers, which exhibited good emission efficiency even at In concentrations associated with the generation of dislocations. In a further step, to form part of an MJ photovoltaic structure, the MM buffers were n-doped by incorporating Te and Si during growth. The impact of doping on materials crystalline properties, morphology, and electro-optical features was evaluated through Electrochemical Capacitance–Voltage (ECV) analysis. Finally, a thick layer with reduced indium content was eventually grown atop the highest indium composition layer (In0.12Ga0.88As)—referred to as an “overshoot”—to mitigate defect formation and provide a suitable foundation for subsequent layer growth, aiming to meet the electronic requirements for the realisation of a high-performance MJ device.
2. Materials and Methods
Material growth was performed by a Veeco© E400G MOVPE (Plainview, NY, USA) industrial reactor. The metal–organic precursors, employed during growth of the III–V structures, were trimethylindium, trimethylgallium, trimethylaluminum, and pure arsine. Diethyltellurium and disilane were used for n-doping, targeting a final concentration in the range of 1–3 × 1018 cm−3. Growth processes were conducted under low-pressure conditions, typically in the range of 30–50 Torr, and at temperatures between 600 and 650 °C, while hydrogen was employed as a gas vector. Buffer samples were deposited onto 4-inch [001] Ge substrates characterised by miscut angles of 6 and 9° towards the [110] crystallographic direction. Since the results obtained are consistent across both angles, in this work we present the characterisation outcomes corresponding to the latter angle, which is less commonly explored in the literature. The nucleation layer consists of AlxGa1−xAs with an aluminum composition of x = 0.40 and a thickness ranging between 10 and 50 nm. It was grown under conditions of a high V/III ratio (greater than 100). Step-graded buffers were obtained by sequentially adding layers with increasing In content (1.4, 2.7, 3.4, 4.9, 6.7, 8.0, 9.0, and 12.0%). Each layer was 300 nm thick except for the lattice-matched one, characterised by a double thickness (as indicated in Figure 1).
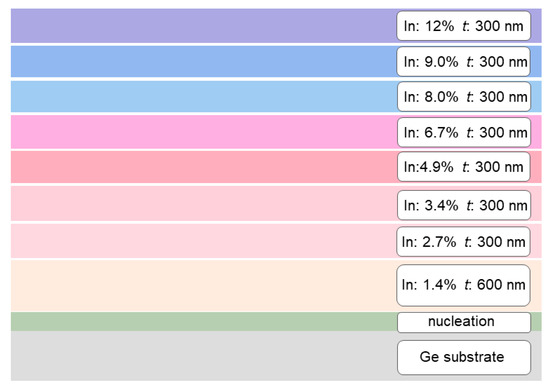
Figure 1.
Scheme of the structure obtained after the addition of all layers with increasing In content. For each layer, composition and thickness is reported. The nucleation layer, indicated by the green bar, is constituted by AlGaAs material. The colors were selected arbitrarily and vary across the InGaAs layers to reflect the differences in indium concentration and the resulting variations in optical properties.
In a subsequent step, a 2.5 µm thick layer with reduced In content was grown on the overshoot layer (In0.12Ga0.88As) and investigated. The decision to apply n-type co-doping with Te and Si is driven by three reasons: (i) the significant improvement in morphology observed in Te-doped InGaAs [18]; (ii) Te’s ability to generate high doping levels thanks to its high incorporation rate and low diffusion coefficient [19]; (iii) the potential to achieve a lower resistance and higher reliability compared to Te-only doping [20]. The series of step-graded structures was then characterised by means of HRXRD using a Bruker D8 Discover diffractometer (Karlsruhe, Germany) working at Cu Kα radiation, which is selected by means of a Ge (220) 4 bounce crystal “channel-cut” monochromator in Bartels geometry. Structural relaxation and tilt were investigated by performing RSMs in correspondence with the asymmetric −224 and symmetric 004 reflection, respectively, and data visualisation and analysis were carried out with the software LEPTOS (version 7) provided by Bruker [21]. Surface morphology was examined through AFM images using a Nanosurf Studio instrument (Liestal, Switzerland). Measurements were acquired in wavemode (a non-contact mode) via photo-thermal excitation. n-Doping profiles were assessed by ECV profiling employing a CVP21 profiler produced by Ingenieurbüro Wolff für Elektronik und Programmentwicklungen (Villingen-Schwenningen, Germany), employing an etching solution of ammonia (50%) containing ammonium tartrate (0.6 M). PL experiments were also performed by exciting the sample at 532 nm (2.33 eV). The PL signal was collected with a detector from Avantes, model AvaSpec-HSC 1024×58TEC-EVO (Apeldoorn, The Netherlands), equipped with a 200 µm entrance slit, 300 lines/mm grating, and with spectral sensitivity covering the visible spectral range from 300 nm to 1000 nm. Samples were mounted on a helium-cooled closed-cycle cryostat for measurements at cryogenic temperatures.
3. Results and Discussion
Figure 2 shows RSMs acquired in correspondence with the asymmetric −224 reflection for selected samples within the series with increasing layers.
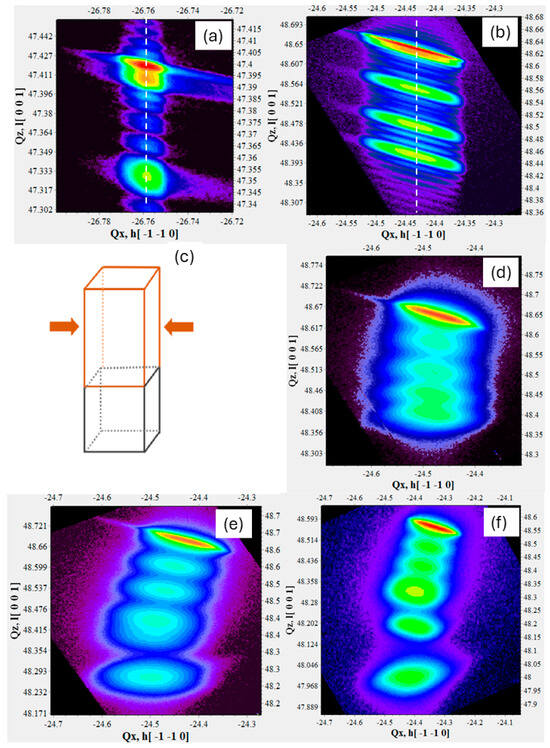
Figure 2.
Representative RSMs acquired in correspondence with −224 asymmetric reflection on samples with top-layer In content equal to 3.4% (a), 4.9% (b), 6.7% (d), 8.0% (e), and 12.0% (f). A scheme of a material subjected to compressive strain is also provided (c). The color scale was applied to indicate varying signal intensities across the map, with blue corresponding to regions of lower intensity and red to regions of higher intensity.
At first glance, a marked difference is obtained between samples with a top-layer indium content below and above 6%. In the case of samples with a top-layer indium content below 6%, the intensity maxima in the RSMs—corresponding to the substrate and the various InGaAs layers—align vertically (Figure 2a,b), demonstrating that the in-plane lattice constant () is the same, while the out-of-plane one (a⊥) changes with higher indium content. This experimental evidence shows that layers are completely strained and subjected to a compressive force along the growth plane as represented in the scheme in Figure 2c. On the contrary, when the top-layer indium content is increased and reaches percentages above 6%, a shift along the reciprocal space coordinate Qx-axis also appears, thus accounting for at least a partial relaxation in all layers of the graded structure (Figure 2d–f). It is interesting to note that the appearance of a relaxation degree in InxGa1−xAs buffers with top xIn > 6% is not limited to the upper layer, but it involves all the underlying ones, demonstrating that after reaching a threshold the energy is released by the structure as a whole.
For all of these buffers, we calculated the relaxation degree with the following equation [22]:
where denotes the in-plane lattice constant of the layer, the lattice constant of the layer in free-standing conditions, and the in-plane lattice constant of the substrate, derived from Ge literature data [23]. The lattice parameters of the layers were obtained by calculating ΔQx and ΔQz reciprocal space shifts with respect to the substrate, using the tetragonal approximation. Table 1 illustrates the relaxation degrees of the upper four layers.

Table 1.
Relaxation (R) obtained for the upper four layers in buffers with In max. of 4.9, 6.7, 8.0, 9.0, and 12.0% (Layer 4 represents the topmost part of the structure, while Layer 1 is positioned as the fourth-to-last layer, lying deeper within the stack).
The obtained values led us to classify our samples into three main groups: (i) structures with a top-layer indium content below 6%, exhibiting no relaxation or negligible relaxation degrees; (ii) structures with a top-layer indium content corresponding to the “threshold composition” of 6.7% (for which relaxation values are very close to 50%); (iii) structures with a large top-layer indium content (above 7%) displaying significant relaxation, with values well above 50%.
Another important point concerns whether metamorphic III–V layers are affected or not by tilt angles with respect to the substrate. This phenomenon can strongly influence material quality by promoting defect formation which, in turn, can impact device performance [24]. In this regard, the role of 004 RSMs becomes crucial as they are sensitive exclusively to perpendicular lattice spacing and are therefore suitable to detect any tilt [25]. Our results unveil that the major variations occur at the same indium content responsible for the changes in strain. For top-layer indium contents below 6%, the peaks in the RSMs remain vertically aligned, thus accounting for no tilt, while larger contents result in a strong azimuthal dependence of the shift along the Qx-axis. For example, Figure 3a shows 004 RSM for the sample with a top-layer indium content equal to 4.9%, while in Figure 3b,c we can observe the comparison between 004 RSMs referring to a sample with a larger top-layer indium content (12.0%). Tilt was observed in all samples with top-layer indium concentrations equal to or above 6.7%, confirming this value as the threshold. In Figure 3b,c, we report the results for the sample with a maximum indium content of 12%, as it provides the most complete and representative structure. The discussion applies to simpler structures with a lower indium content in the top layers. In reciprocal space, three distinct regions can be identified: (i) Qx shifts gradually along the horizontal axis, indicating that the tilt increases linearly (up to the 6.7% indium layer); (ii) Qx remains constant, suggesting that a “saturation” tilt angle is reached (up to the 9.0% indium layer); (iii) an additional shift appears, suggesting a further increase in tilt angle (peak at lower Qz values), occurring in correspondence with the topmost layer (12.0% In content). The comparison between measurements acquired at 0° and 180° azimuths (perfectly mirrored) indicates that the tilt is not random but occurs along a preferential direction, likely aligned with the crystallographic [110] axis, which corresponds to the miscut direction of the Ge substrate. This experimental evidence confirms that the resulting InGaAs layers do not consist of randomly oriented tilted blocks but rather exhibit a coherent tilt across the graded layers.
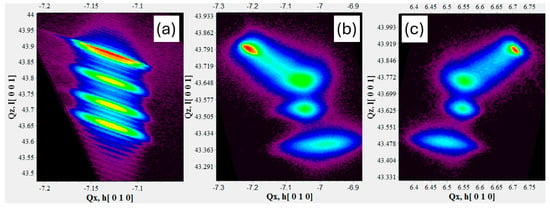
Figure 3.
Representative RSMs acquired in correspondence of 004 symmetric reflection on samples with top-layer In content equal to 4.9% (a) and 12.0% (b,c). The color scale was applied to indicate varying signal intensities across the map, with blue corresponding to regions of lower intensity and red to regions of higher intensity.
A reasonable explanation of the observed tilts lies in the imbalance between the number of dislocations along the two different perpendicular directions due to the asymmetry in misfit components at the growth surface [24]. Since relaxation and surface morphology in MM buffers are correlated [26], we carried out an AFM investigation to detect and monitor any change as a function of the In content of the top layer. In Figure 4b, representative samples are chosen to show the evolution of surface roughness with the progressive addition of layers. The most significant variation occurs when shifting from the lattice-matched sample (In concentration: 1.3%) to the one with a top-layer indium concentration of 4.9%, when characteristic low-frequency “ripples” appear. These features seem to become sharper as In content increases. To verify this rationale, we calculated the roughness as a function of In composition (Figure 4a). At first sight, we observe that the obtained trend is very well represented by a linear function up to the sample with a top-layer indium percentage equal to 8.0%, at which point roughness reaches 1.8 nm.
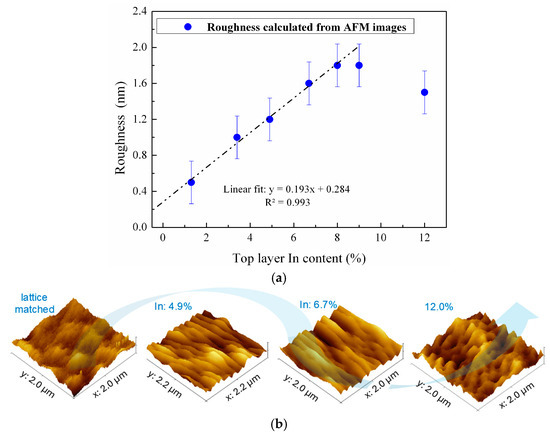
Figure 4.
(a) Graph illustrating the trend of surface roughness versus top-layer In content. Data up to In content equal to 8.0% are interpolated by a linear function, whose equation is also shown. (b) Evolution of surface features along the series of buffers with increasing In content. Three-dimensional AFM images refer to 2 × 2 μm2 surface areas.
For larger concentrations, a slight decrease is detected. Furthermore, quite interestingly, when the top-layer indium content reaches 8.0%, a misfit dislocation network appears (Figure 5).
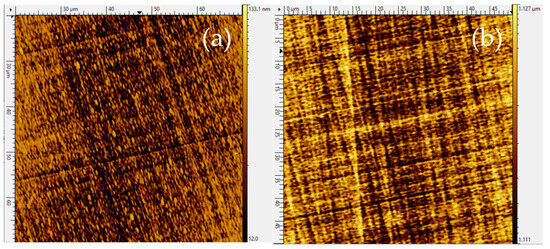
Figure 5.
AFM images acquired in wavemode on 50 × 50 μm2 surface portions of two samples with a large (>6%) top-layer In content: 8.0% (a) and 12.0% (b).
To gather insights into the optical properties of the MM InxGa1-xAs buffers, we performed PL measurements both at cryogenic and room temperature. Figure 6a shows the PL spectra of the samples as a function of the indium percentage in the top layer, acquired at 16 K and 300 K. All samples present easily detectable PL emission, suggesting high radiative recombination efficiency, even at high indium concentrations where dislocations are present. As expected, the energy of the PL recombination red-shifts with increasing indium content. Figure 6b shows the shift in PL energy as a function of the In percentage of the top layer compared with data extracted from the literature [27].
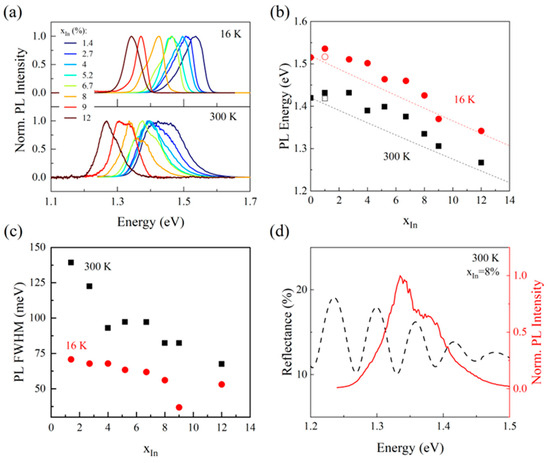
Figure 6.
PL properties of the InGaAs layers. (a) Continuous-wave PL spectra as a function of In content from 1.4% (dark blue) to 12% (dark red), acquired at 16 K (top) and 300 K (bottom) under 532 nm excitation. (b) Energy of the PL maximum as a function of In content extracted from the measurements in (a) at 16 K (red) and 300 K (black). The dotted lines are extracted from Ref. [27]. The empty red circle and black square correspond to the sample without Te doping at 16 K and 300 K, respectively. (c) Full-width at half-maximum (FWHM) of the PL line as a function of In content extracted from the measurements in (a) at 16 K (red) and 300 K (black). (d) Overlay of the PL spectrum at 300 K for the sample with 8.0% In (red solid line) with its corresponding reflectance measurement (black dashed line).
The PL red-shift follows the trend reported in the literature but moves rigidly towards slightly higher energy for every indium percentage point, both at 16 K and at room temperature. This slight discrepancy is not determined by the experimental setup, because a comparison of a reference GaAs sample acquired in the same conditions as those used to detect the InGaAs PL yields a result that is perfectly compatible with what is found in the literature, as seen in Figure 6b for In = 0%. The origin of the shift towards higher energies of the InGaAs PL can be ascribed to the high doping levels of the samples that populate the conduction band with donor carriers. The role of doping and this discrepancy with the literature will be further discussed later. The spectra reported in Figure 6a clearly show a variation in the linewidth of the direct PL bandgap acquired for different xIn. An analysis of the linewidth, performed by measuring the full-width at half-maximum of each PL spectrum, is reported in Figure 6c. The analysis shows a monotonic decrease of the linewidth of the band-to-band recombination with increasing xIn. We do not expect this behaviour to be dependent on the nucleation of extended defects, but rather on subtle modifications of the alloy band structure when changing its composition [28]. It should be noted that the PL seems to have a complex line-shape, seldom presenting more than one peak or some spectral weight at lower or higher energy with respect to the PL maximum. To investigate this feature, we performed reflectance measurements, which revealed strong thin-film interference behaviour, as reported in Figure 6d for the sample with a top-layer indium content of 8.0%, for which the effect is most evident. The superimposition of the reflectance and the PL spectra shows that the former strongly modifies the shape of the latter, with maxima and minima of reflectance in correspondence with local features of the PL spectrum.
A further step of this research involved the growth of a thick layer (2.5 µm) on the In0.12Ga0.88As overshoot. Figure 7 illustrates the −224 RSM obtained for this structure.
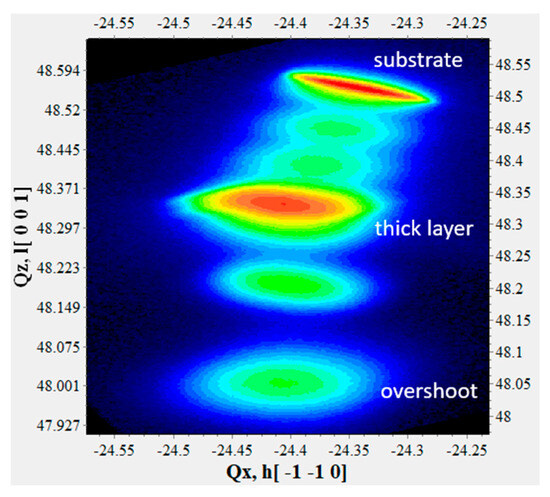
Figure 7.
RSM acquired in correspondence with −224 asymmetric reflection of the complete multi-layered structure with the addition of a 2.5 μm thick layer with a lower In content. The color scale was applied to indicate varying signal intensities across the map, with blue corresponding to regions of lower intensity and red to regions of higher intensity.
As expected, the reflection generated by the thick surface layer exhibits an intermediate lattice parameter between overshoot and substrate. As far as the paremeter is concerned, the value obtained is comparable to that of the overshoot. These results suggest that the presence of a thick layer reduces superficial layers’ relaxation by helping to contain compressive strain. As expected, an increase in the overshoot thickness results in a more relaxed thick layer. Regarding morphology, the misfit dislocation network, obtained at the top of this structure, is well evident in the 2D 50 × 50 µm2 AFM image shown in Figure 8. In this case, the surface roughness is 1.3(1) nm, and a first estimate of the dislocation density leads to a reduced value if compared to the multi-layered structure with the overshoot at the top.
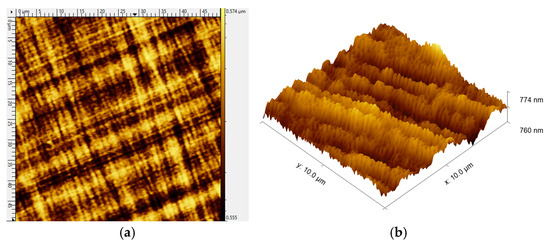
Figure 8.
Two-dimensional 50 × 50 µm2 (a) and three-dimensional 10 × 10 µm2 (b) AFM images acquired on the surface of the thick layer.
Since the optimisation of the MM InGaAs-based structures is aimed at the realisation of high-efficiency solar devices, we also explored the role of doping to assess whether a large n-carrier concentration has an impact on the material properties. Specifically, the disilane (Si2H6) flow corresponds to approximately 1 × 10⁻⁴ relative to the total alkyl flow, while the diethyltellurium (DETe) flow is approximately 1 × 10⁻². A lattice-matched InxGa1-xAs layer with an In content of 1.4% was obtained in both the presence and absence of DETe in the growth chamber. The ECV profiles shown in Figure 9a evidence that the n-type carrier concentration doubles in the presence of Te, from 1.8 to 3.6 × 1018 cm−3.
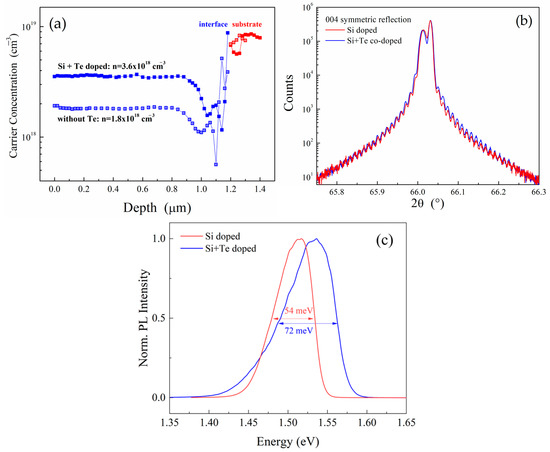
Figure 9.
Comparison of InGaAs layers lattice-matched on Ge obtained in the presence and absence of Te doping investigated by means of ECV (a), HRXRD (b), and PL measured at 16 K under 532 nm excitation (c).
As we can observe from Figure 9b, HRXRD curves are almost superimposable in all their features, thus accounting for the fact that neither crystalline parameters nor thickness are affected by the presence of Te in the compound semiconductor material. On the other hand, the high doping level has a clear impact on the PL properties of the material. PL spectra of the samples with and without Te doping were acquired at 16 K, to minimise both the contribution of nonradiative transitions and the thermal broadening. As expected, Figure 9c shows that the PL of the Te-doped sample presents a larger linewidth with respect to that of the sample without Te doping, particularly in the low-energy tail of the emission, with an increase of ~33% from 54 meV to 72 meV. Another notable difference between the two PL spectra is that the Te-doped sample is evidently blue-shifted by approximately 20 meV. This observation is consistent with previous reports on highly Te-doped GaAs [29] and can be explained by the Burstein–Moss effect [30,31], where donor electrons fill the conduction band and shift the apparent bandgap to higher energies. The white dots in Figure 6b represent the PL energy of the sample without Te doping: it can clearly be seen that the discrepancy between the experimental results and the literature is strongly diminished. Nevertheless, it is not reduced to zero because the samples are still strongly doped with Si (1.8 × 1018 cm−3). This does not suppress the Burstein–Moss, and most importantly the ~15 meV shift that is still present is in agreement with that observed in the literature for Si-doped GaAs at this dopant concentration [32]. Eventually, based on the observed rigid shift of the PL peak towards higher energies in all Te-doped samples (Figure 6), it is reasonable to conclude that the effect of Te doping is consistent across the series and does not significantly depend on the indium composition of the InGaAs layers.
4. Conclusions
The results achieved in this work represent an advancement toward the realisation of high-efficiency, lightweight, and radiation-resistant photovoltaic devices for both terrestrial and space applications. One of the strategies to tackle energy limits in traditional monolithic 3J InGaP/InGaAs/Ge cells lies in replacing the bottom cell with a heteroepitaxial III–V material, whose bandgap is engineered to allow the removal and reuse of the Ge substrate. In pursuit of this goal, InxGa1−xAs step-graded buffers were grown on Ge substrates by MOVPE, adding layers with progressively increasing In content. A comprehensive study was carried out to investigate the crystalline features, morphology, and optical properties along the series of samples in order to monitor relaxation mechanisms and threshold compositions. The results show that buffers are fully strained when the top-layer indium content is <6.0%, while a relaxation degree appears in the entire structure when the top-layer indium content is >6.0%. Furthermore, the relaxation phenomenon is accompanied by the emergence of a tilt angle between the layers and the substrate. As far as morphology is concerned, roughness increases linearly with increasing indium maximum content up to 8.0%, when it reaches 1.8 nm and a misfit dislocation network is evidenced. PL experiments show good optical properties for the samples, with a slight blue-shift of the recombination line that is ascribed to the high doping level. To meet electronic targets necessary for the realisation of an effective MJ device, we explored the effects induced by the addition of a 2.5 µm thick layer to reduce defects and improve electronic properties. Additionally, tellurium doping was introduced in the growth chamber with the purpose of monitoring the influence of the n-carrier concentration on the crystallographic, chemical, and optical properties. These results provide valuable insights into the design of III–V heteroepitaxial layers on Ge and contribute to the development of more efficient and sustainable multi-junction photovoltaic devices. In our future work, we are planning to further increase the indium content with the purpose of meeting the electronic requirements for an optimised bandgap, always considering crystalline quality and minimisation of defect formation.
Author Contributions
Writing—original draft, writing—review and editing, investigation, data curation, visualisation, formal analysis, E.A.; conceptualisation, funding, writing—review and editing, supervision, investigation, project administration, N.A.; writing—original draft, writing—review and editing, investigation, data curation, J.P.; conceptualisation, methodology, writing—review and editing, E.G.; MOVPE growth activity, data curation, S.D.; MOVPE growth activity, data curation, A.F.; supervision, project administration, F.P.; supervision, project administration, R.C.; supervision, funding, project administration, G.T. All authors have read and agreed to the published version of the manuscript.
Funding
This study is a result of the research project “nuovi Concetti, mAteriali e tecnologie per l’iNtegrazione del fotoVoltAico negli edifici in uno scenario di generazione diffuSa” [CANVAS], funded by the Italian Ministry of the Environment and Energy Security, through the Research Fund for the Italian Electrical System (type-A call, published on G.U.R.I. n. 192 on 18 August 2022).
Data Availability Statement
The raw data supporting the conclusions of this article will be made available by the authors on request.
Acknowledgments
We are thankful to Fernando Rinaldi, application scientist at the Bruker Corporation, for his advice during X-ray measurements.
Conflicts of Interest
Authors Elisabetta Achilli, Nicola Armani and Gianluca Timò were employed by RSE (Ricerca Sul Sistema Energetico). Authors Erminio Greco, Salvatore Digrandi, Andrea Fratta, and Roberta Campesato were employed by CESI S.p.A. The authors declare that they have no known competing financial interests or personal relationships that could have appeared to influence the work reported in this paper.
Abbreviations
The following abbreviations are used in this manuscript:
| PV | Photovoltaics |
| MM | Metamorphic |
| MOVPE | Metal Organic Vapour Phase Epitaxy |
| MJ | Multi-Junction |
| 3J | Triple Junction |
| HRXRD | High Resolution X-Ray Diffraction |
| RSM | Reciprocal Space Map |
| AFM | Atomic Force Microscopy |
| PL | Photoluminescence |
| ECV | Electrochemical Capacitance–Voltage |
References
- Li, S.; Hao, C.; Wu, P.; Ji, J.; Yang, Y.; Yao, J. Review of Multi-junction Solar Cell & Factors Impacting the Efficiency of Multi-junction Solar Cell. Energy Source Part A 2023, 45, 12737–12758. [Google Scholar]
- Yamaguchi, M.; Dimroth, F.; Geisz, J.F.; Ekins-Daukes, N.J. Multi-junction solar cells paving the way for super high-efficiency. J. Appl. Phys. 2021, 129, 240901. [Google Scholar] [CrossRef]
- Peters, I.M.; Gallegos, C.D.R.; Lüer, L.; Hauch, J.A.; Brabec, C.J. Practical limits of multijunction solar cells. Prog. Photovolt. 2023, 31, 1006–1015. [Google Scholar] [CrossRef]
- Chiu, P.T. Chapter four—Space applications of III–V single- and multijunction solar cells. In Photovoltaics for Space; Elsevier: Amsterdam, The Netherlands, 2023; pp. 79–127. [Google Scholar]
- Meinardi, F.; Bruni, F.; Brovelli, S. Luminescent solar concentrators for building-integrated photovoltaics. Nat. Rev. Mat. 2017, 2, 17072. [Google Scholar] [CrossRef]
- Pearce, P.M.; Halme, J.; Jiang, J.K.; Ekins-Daukes, N.J. Efficiency limits and design principles for multi-junction coloured photovoltaics. Energy Environ. Sci. 2024, 17, 1189–1201. [Google Scholar] [CrossRef]
- Raya-Armenta, J.M.; Bazmohammadi, N.; Vasquez, J.C.; Guerrero, J.M. A short review of radiation-induced degradation of III–V photovoltaic cells for space applications. Sol. Energy Mat. Sol. C 2021, 23, 111379. [Google Scholar] [CrossRef]
- Takamoto, T.; Washio, H.; Juso, H. Application of InGaP/GaAs/InGaAs triple junction solar cells to space use and concentrator photovoltaic. In Proceedings of the 2014 IEEE 40th Photovoltaic Specialist Conference (PVSC), Denver, CO, USA, 8–13 June 2014; pp. 1–5. [Google Scholar]
- Skachkov, A. Optimization of the structure of a GaInP/GaAs/Ge triple-junction solar cell with an Al0.1Ga0.9As/Al0.8Ga0.2As integrated Bragg reflector. Optoelectronics 2014, 50, 423–427. [Google Scholar] [CrossRef]
- He, Y.; Yan, W. Fabrication and simulation of GaInAs Solar cells using compositionally step-graded AlGaInAs buffers on GaAs substrate. Opt. Quant. Electron. 2020, 52, 372. [Google Scholar] [CrossRef]
- Takamoto, T.; Kaneiwa, M.; Imaizumi, M.; Yamaguchi, M. InGaP/GaAs-based multijunction solar cells. Progr. Photovolt. 2005, 13, 495–511. [Google Scholar] [CrossRef]
- Du, B.; Gu, Y.; Zhang, Y.G.; Chen, X.Y.; Xi, S.P.; Ma, X.Y.; Ji, W.Y.; Shi, Y.H.; Li, X.; Gong, H.M. Effects of continuously or step-continuously graded buffer on the performance of wavelength extended InGaAs photodetectors. J. Cryst. Growth 2016, 440, 1–5. [Google Scholar] [CrossRef]
- Kim, H.; Xu, S.; Liu, C.; Lekhal, K.; Kuech, T.; Mawst, L. MOCVD-Grown In0.22Ga0.78As Metamorphic Buffer Layer with Ultralow Threading Dislocation Density. Cryst. Growth Des. 2024, 24, 3707–3713. [Google Scholar] [CrossRef]
- Stephen, N.; Kumar, P.; Gocalinska, A.; Mura, E.; Kepaptsoglou, D.; Ramasse, Q.; Pelucchi, E.; Arredondo, M. Dislocation and strain mapping in metamorphic parabolic-graded InGaAs buffers on GaAs. J. Mater. Sci. 2023, 58, 9547–9561. [Google Scholar] [CrossRef] [PubMed]
- Winter, E.; Schreiber, W.; Schygulla, P.; Souza, P.L.; Janz, S.; Lackner, D.; Ohlmann, J. III–V material growth on electrochemically porosified Ge substrates. J. Cryst. Growth 2023, 602, 126980. [Google Scholar] [CrossRef]
- Xu, J.; Yang, K.; Xu, Q.; Zhu, X.; Wang, X.; Lu, M. Fabrication and Irradiation Effect of Inverted Metamorphic Triple Junction GaInP/GaAs/InGaAs Solar Cells. Crystals 2022, 12, 670. [Google Scholar] [CrossRef]
- Heini, M.; Aierken, A.; Li, Z.H.; Zhao, X.F.; Sailai, M.; Shen, X.B.; Xu, Y.; Liu, H.T.; Li, Y.D.; Guo, Q.; et al. Changes in Output Parameters of 1 MeV Electron Irradiated Upright Metamorphic GaInP/GaInAs/Ge Triple Junction Solar Cell. AIP Adv. 2018, 8, 105022. [Google Scholar] [CrossRef]
- Law, J.J.M.; Carter, A.D.; Lee, S.; Huang, C.-Y.; Lu, H.; Rodwell, M.J.W. Co-doping of InxGa1−xAs with silicon and tellurium for improved ultra-low contact resistance. J. Cryst. Growth 2013, 378, 92–95. [Google Scholar] [CrossRef]
- Orzali, T.; Vert, A.; Lee, R.T.P.; Norvilas, A.; Huang, G.; Herman, J.L.; Hill, R.J.W.; Papa Rao, S.S. Heavily tellurium doped n-type InGaAs grown by MOCVD on 300 mm Si wafers. J. Cryst. Growth 2015, 416, 243–247. [Google Scholar] [CrossRef]
- Gou, Y.; Wang, H.; Wang, J.; Yang, H.; Deng, G. High performance p++-AlGaAs/n++-InGaP tunnel junctions for ultra-high concentration photovoltaics. Opt. Express 2022, 30, 23763–23770. [Google Scholar] [CrossRef]
- Ulyanenkov, A. LEPTOS: Software for interpretation of X-ray reflectivity and X-ray diffraction data from multilayers and superlattices. Proc. SPIE 2004, 5536, 1–15. [Google Scholar]
- Chen, Z.; Long, J.; Sun, Q.; Wang, X.; Wu, X.; Li, X.; Yu, M.; Luo, X.; Zhao, H.; Fu, Y.; et al. Stress Analysis of Flexible GaInP/GaAs/InGaAs Solar Cells Based on Cu Thin-Film Substrates. Adv. Energy Sustain. Res. 2022, 4, 2200136. [Google Scholar] [CrossRef]
- Vaitkus, A.; Merkys, A.; Sander, T.; Quirós, M.; Thiessen, P.A.; Bolton, E.E.; Gražulis, S. A workflow for deriving chemical entities from crystallographic data and its application to the Crystallography Open Database. J. Cheminform. 2023, 15, 123. [Google Scholar] [CrossRef]
- Goldman, R.S.; Kavanagh, K.L.; Wieder, H.H.; Ehrlich, S.N.; Feenstra, R.M. Effects of GaAs substrate misorientation on strain relaxation in InxGa1−xAs films and multilayers. J. Appl. Phys. 1998, 83, 5137–5149. [Google Scholar] [CrossRef]
- Dolabella, S.; Borzì, A.; Dommann, A.; Neels, A. Lattice Strain Defects Analysis in Nanostructured Semiconductor Materials and Devices by High-Resolution X-Ray Diffraction: Theoretical and Practical Aspects. Small Methods 2021, 6, 2100932. [Google Scholar] [CrossRef] [PubMed]
- Gou, Y.; Wang, H.; Wang, J.; Zhang, Y.; Niu, R.; Chen, X.; Wang, B.; Xiao, Y.; Zhang, Z.; Liu, W.; et al. 1064 nm InGaAs metamorphic laser powerconverts with over 44% efficiency. Opt. Express 2022, 30, 42178. [Google Scholar] [CrossRef] [PubMed]
- Goetz, K.-H.; Bimberg, D.; Jürgensen, H.; Selders, J.; Solomonov, A.V.; Glinskii, G.F.; Razeghi, M. Optical and crystallographic properties and impurity incorporation of GaxIn1−xAs (0.44<x<0.49) grown by liquid phase epitaxy, vapor phase epitaxy, and metal organic chemical vapor deposition . J. Appl. Phys. 1983, 54, 4543–4552. [Google Scholar] [CrossRef]
- Adachi, S. Physical Properties of III–V Semiconductor Compounds; John Wiley & Sons: New York, NY, USA, 1992. [Google Scholar]
- Jiang, D.-S.; Makita, Y.; Ploog, K.; Queisser, H.J. Electrical properties and photoluminescence of Te-doped GaAs grown by molecular beam epitaxy. J. Appl. Phys. 1982, 53, 999–1006. [Google Scholar]
- Moss, T.S. The Interpretation of the Properties of Indium Antimonide. Proc. Phys. Soc. Sect. B 1954, 67, 775. [Google Scholar] [CrossRef]
- Burstein, E. Anomalous Optical Absorption Limit in InSb. Phys. Rev. 1954, 93, 632. [Google Scholar] [CrossRef]
- Borghs, G.; Bhattacharyya, K.; Deneffe, K.; Van Mieghem, P.; Mertens, R. Band-gap narrowing in highly doped n- and p-type GaAs studied by photoluminescence spectroscopy. J. Appl. Phys. 1989, 66, 4381–4386. [Google Scholar] [CrossRef]
Disclaimer/Publisher’s Note: The statements, opinions and data contained in all publications are solely those of the individual author(s) and contributor(s) and not of MDPI and/or the editor(s). MDPI and/or the editor(s) disclaim responsibility for any injury to people or property resulting from any ideas, methods, instructions or products referred to in the content. |
© 2025 by the authors. Licensee MDPI, Basel, Switzerland. This article is an open access article distributed under the terms and conditions of the Creative Commons Attribution (CC BY) license (https://creativecommons.org/licenses/by/4.0/).