3.1. Synthesis of Nano-BaCO3
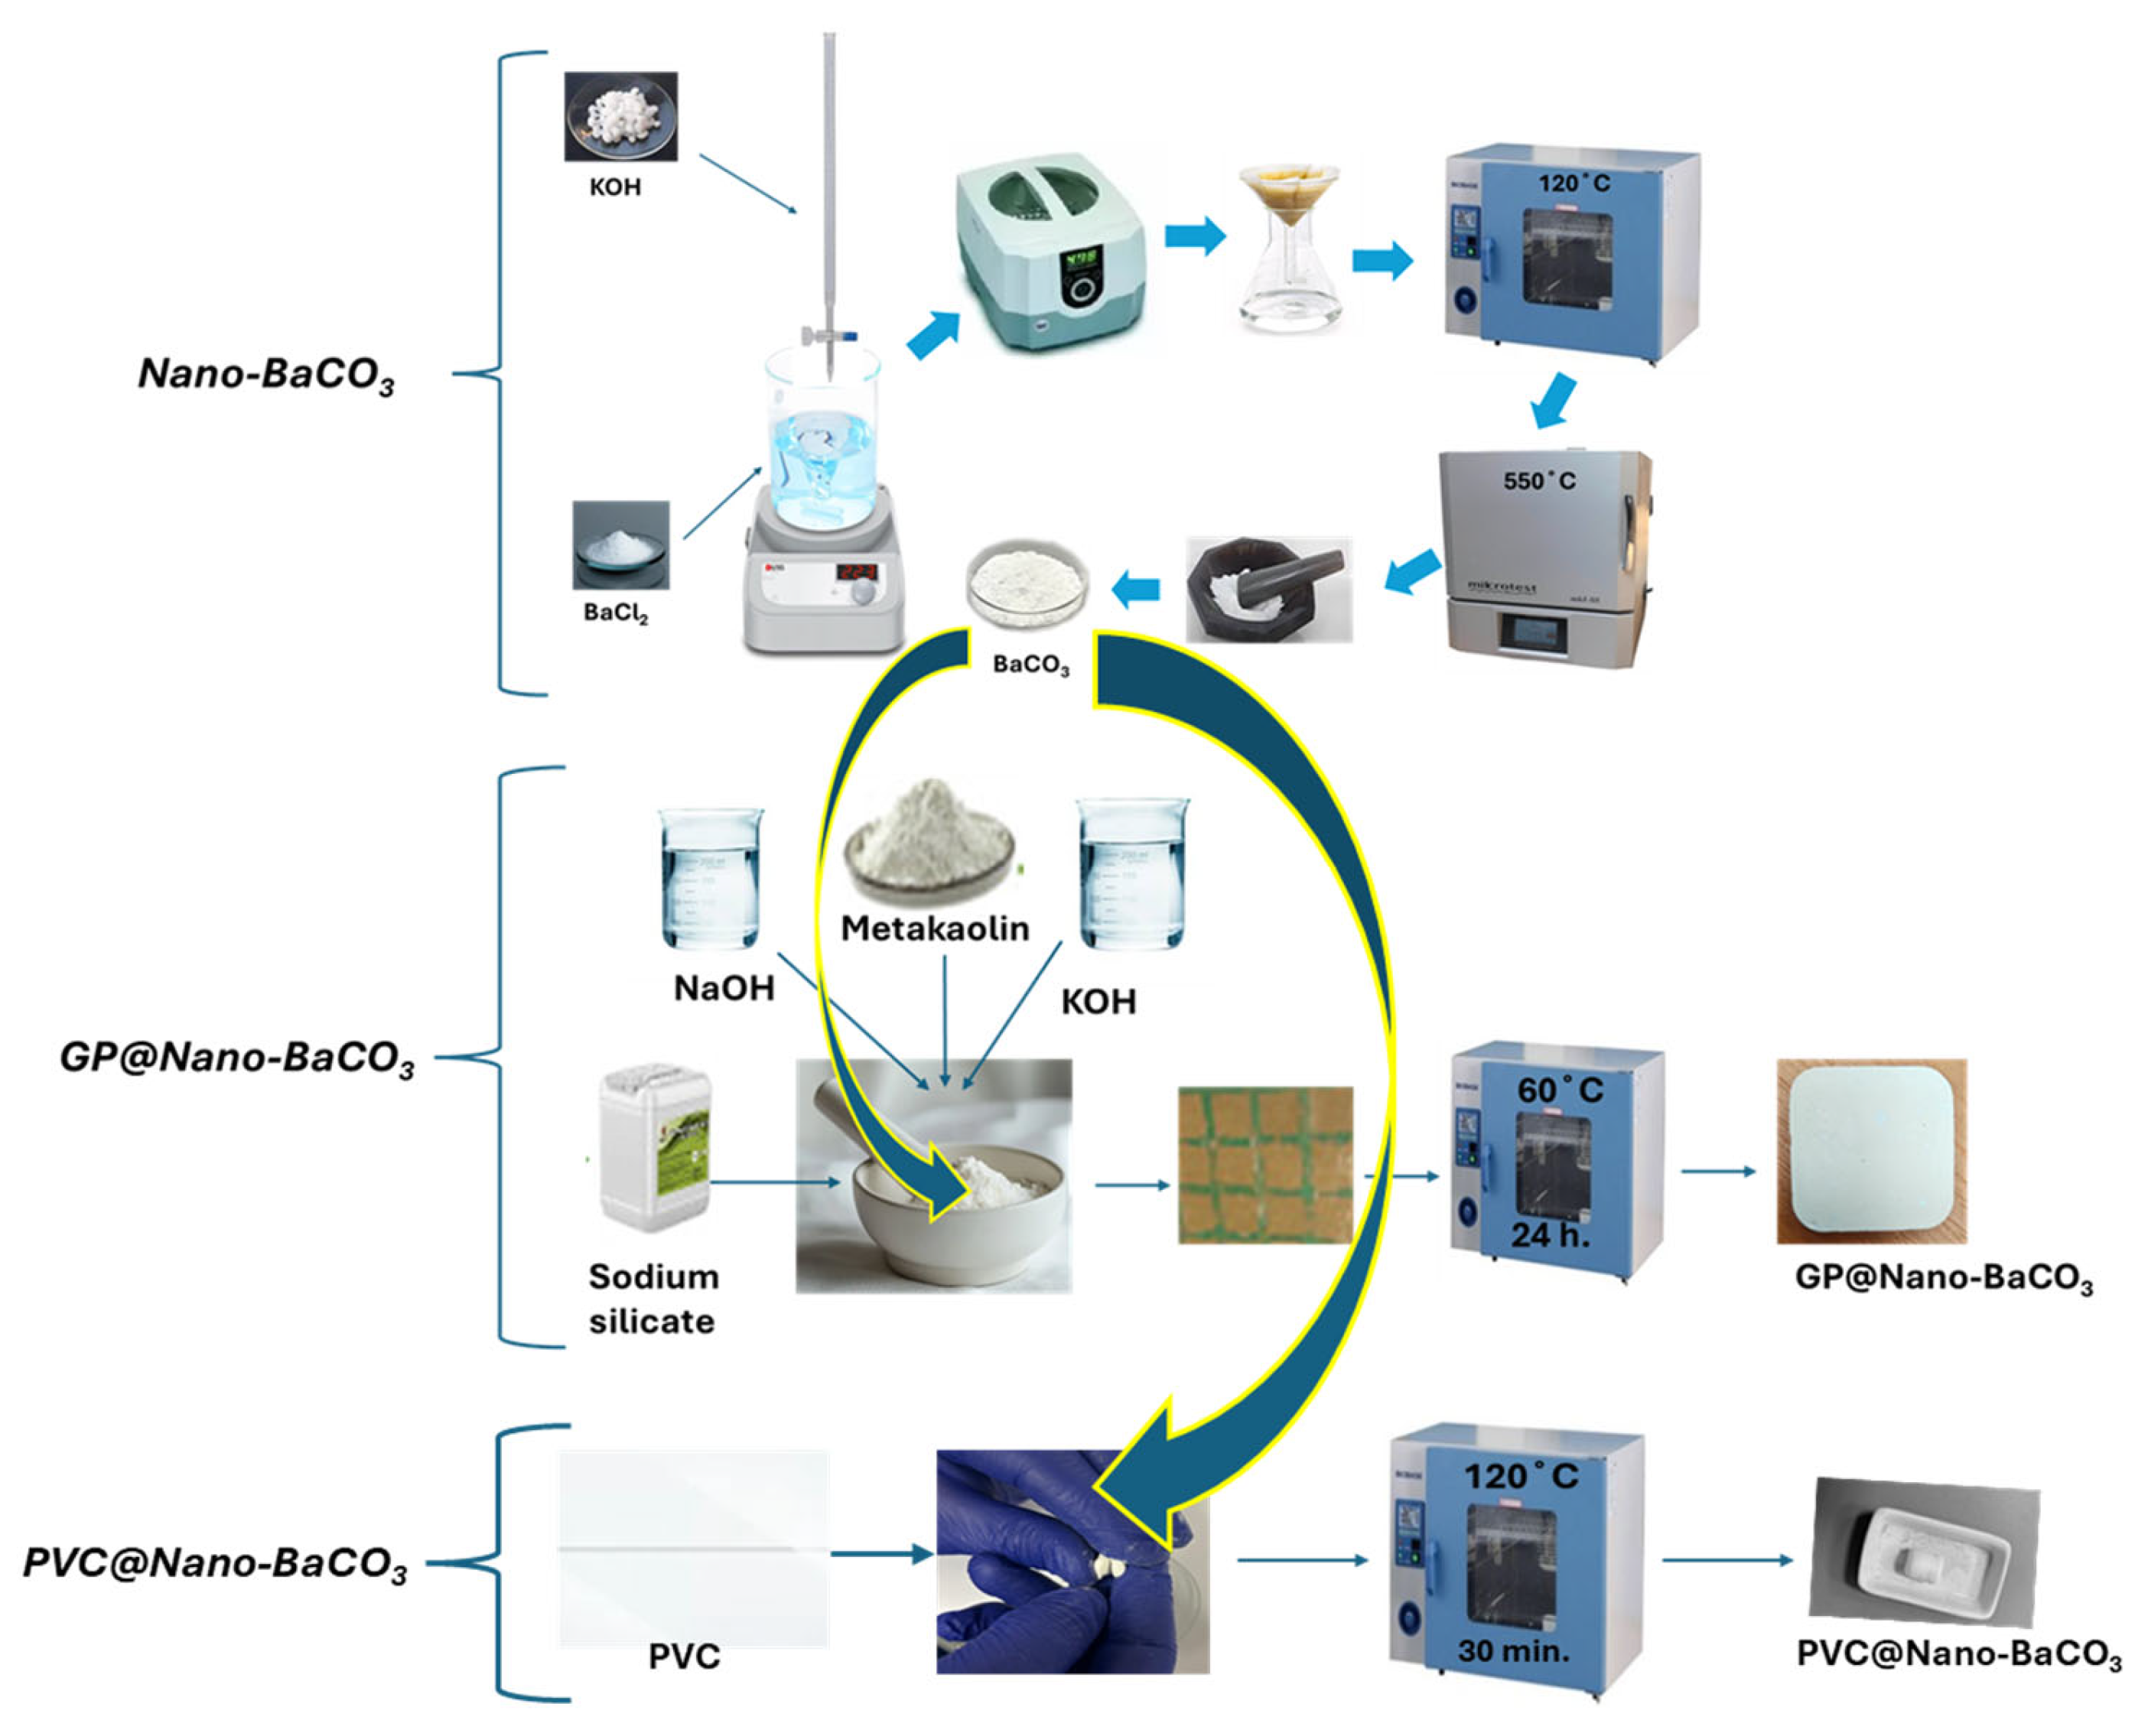
The synthesis of BaCO
3 nanoparticles was carried out in October 2024 in open brakers through the reaction between 50 mL of barium chloride solution, BaCl
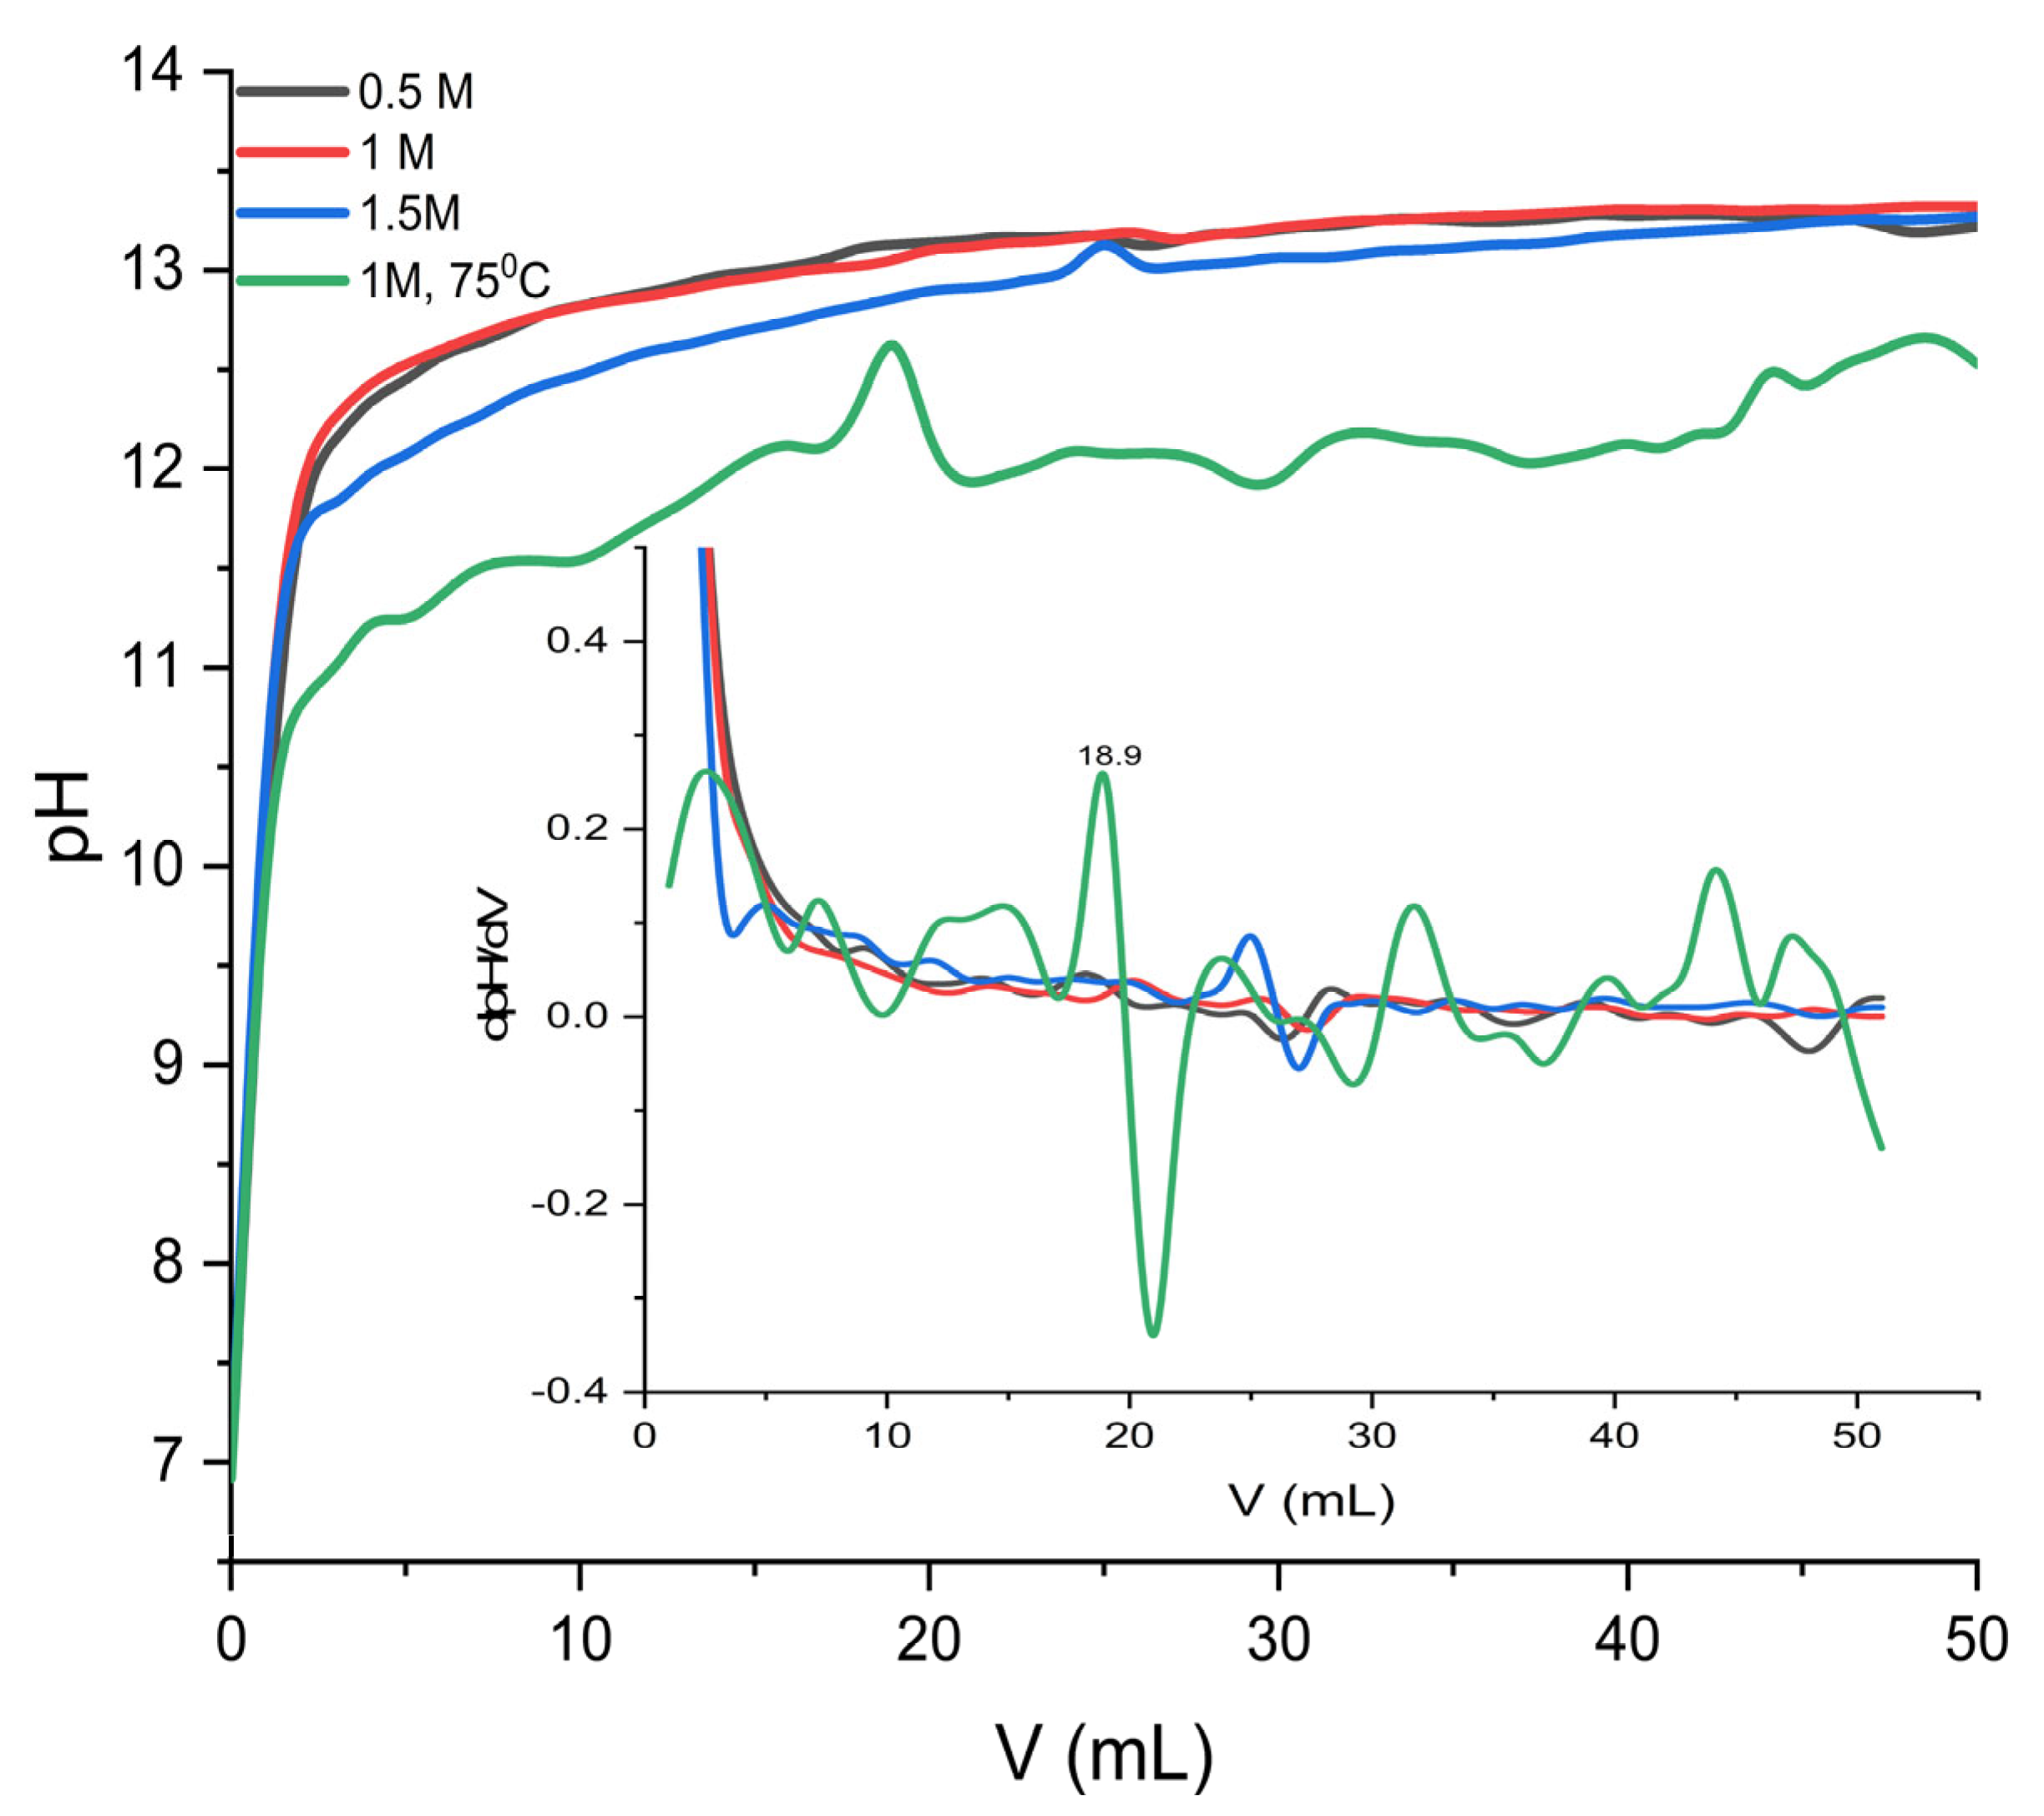
2 (pH = 6.92), and 50 mL of potassium hydroxide solution, KOH 1 M (pH = 13.4), under continuous stirring at 1500 rpm for 2 h, without the addition of an external carbon source. During this process, the evolution of pH as a function of the volume of added KOH provides valuable insight into how both the concentration of Ba
2+ ions and the synthesis temperature affect particle formation, as illustrated in
Figure 2. The evolution of dpH as a function of the dV of added KOH highlights how the concentration of Ba
2+ and the synthesis temperature influence the process, as shown in
Figure 2. For solutions prepared at 23 °C, corresponding to concentrations of 0.5 M, 1.0 M, and 1.5 M, the pH–V curves show a rapid increase in pH in the first 15 to 20 mL, followed by a flattening in the range of 12.5 to 13.5 mL, indicating the gradual attainment of saturation and the balanced formation of precipitate. The slight increase in the final pH with the concentration of Ba
2+ suggests more efficient conversion kinetics and a faster consumption of available carbonate ions, which favors nucleation and crystallite development.
The dpH/dV derivative shows low and steady values, characteristic of a controlled reaction, with the gradual formation of the solid phase. In contrast, the sample synthesized at 75 °C exhibits a distinct behavior: the lower initial pH ~10.32 (after addition of 1 mL KOH) increases slowly and unevenly, and the dpH/dV curve shows wide fluctuations and a pronounced maximum around 18.9 mL. This peak indicates a sudden stage of nucleation and the accelerated growth of crystallites. This behavior is attributed to a combination of the decrease in pKw with temperature, the change in carbonate equilibria, and the intensification of gas–liquid mass transfer.
After the precipitation, the suspensions were ultrasonicated for 10 min, in an open beaker. The Mauna Loa monthly mean for the ambient CO
2 for October 2024 was 422.38 ppm [
14]. The low solubility product of BaCO
3 (Ksp ≈ 5.1 × 10
−9) ensures that even the limited carbonate concentration derived from air is sufficient to trigger immediate precipitation with Ba
2+ ions. Converting 0.025 mol Ba
2+ (0.5 M) fully to BaCO
3 requires 0.025 mol CO
2, which at ~420 ppm corresponds to ~1.45 m
3 of air. Converting 0.05 mol (1 M) requires 2.9 m
3, and converting 0.075 mol (1.5 M) requires 4.35 m
3. A conservative estimate of the convective sweep over the liquid surface (free-stream velocity ~0.2 m·s
−1 in a ventilated lab; free surface area ≈2.8 × 10
−3 m
2 for a 6 cm diameter beaker) gives an air throughput of ~0.00056 m
3·s
−1, i.e., ~4.0 m
3 over 2 h, exceeding or comparable to the amount needed for 0.025–0.05 mol CO
2.
Thus, the continuous uptake of CO
2 from ambient air compensates for the absence of forced bubbling and drives the complete precipitation of BaCO
3. Our results are consistent with the literature on BaCO
3 obtained via the composite-hydroxide-mediated (CHM) route [
16]. Both approaches show that CO
2 bubbling is not mandatory when there is a strong basic source and favorable mass transfer conditions, in our case KOH 1 M. Carbonation continues during post-stirring handling, drying, and calcination, leading to BaCO
3 as the final phase.
All the results suggest that, at ambient temperatures, the synthesis process of BaCO3 particles is uniform and predictable, with the gradual formation of well-defined crystallites, while at high temperatures, the reaction becomes more dynamic, with accentuated variations in pH and its derivative, favoring rapid nucleation.
Given that the environment becomes strongly basic and gradually adds KOH, the process can be described as follows:
Step 1: Initially, Ba
2+ ions react with OH
− from KOH.
This reaction occurs quickly and causes the pH of the solution to increase.
Step 2: In an open system, OH
− and CO
2 ions in the air form the carbonate ion:
Step 3: Barium carbonate (BaCO3) is precipitated.
Barium ions react with carbonate ions formed in situ, leading to the formation of the solid precipitate:
The overall reaction is expressed as follows:
After filtration and washing, the samples were dried at 120 °C followed by calcination for 2 h at 550 °C. To determine the calcination yield, the powder was weighed before and after calcination, as presented in
Table 2.
The concentration of Ba2+ has a positive effect on yield. Temperature positively influences yield, probably by accelerating the compound formation process and favoring a more stable crystal lattice.
3.2. ATR-FTIR Analysis
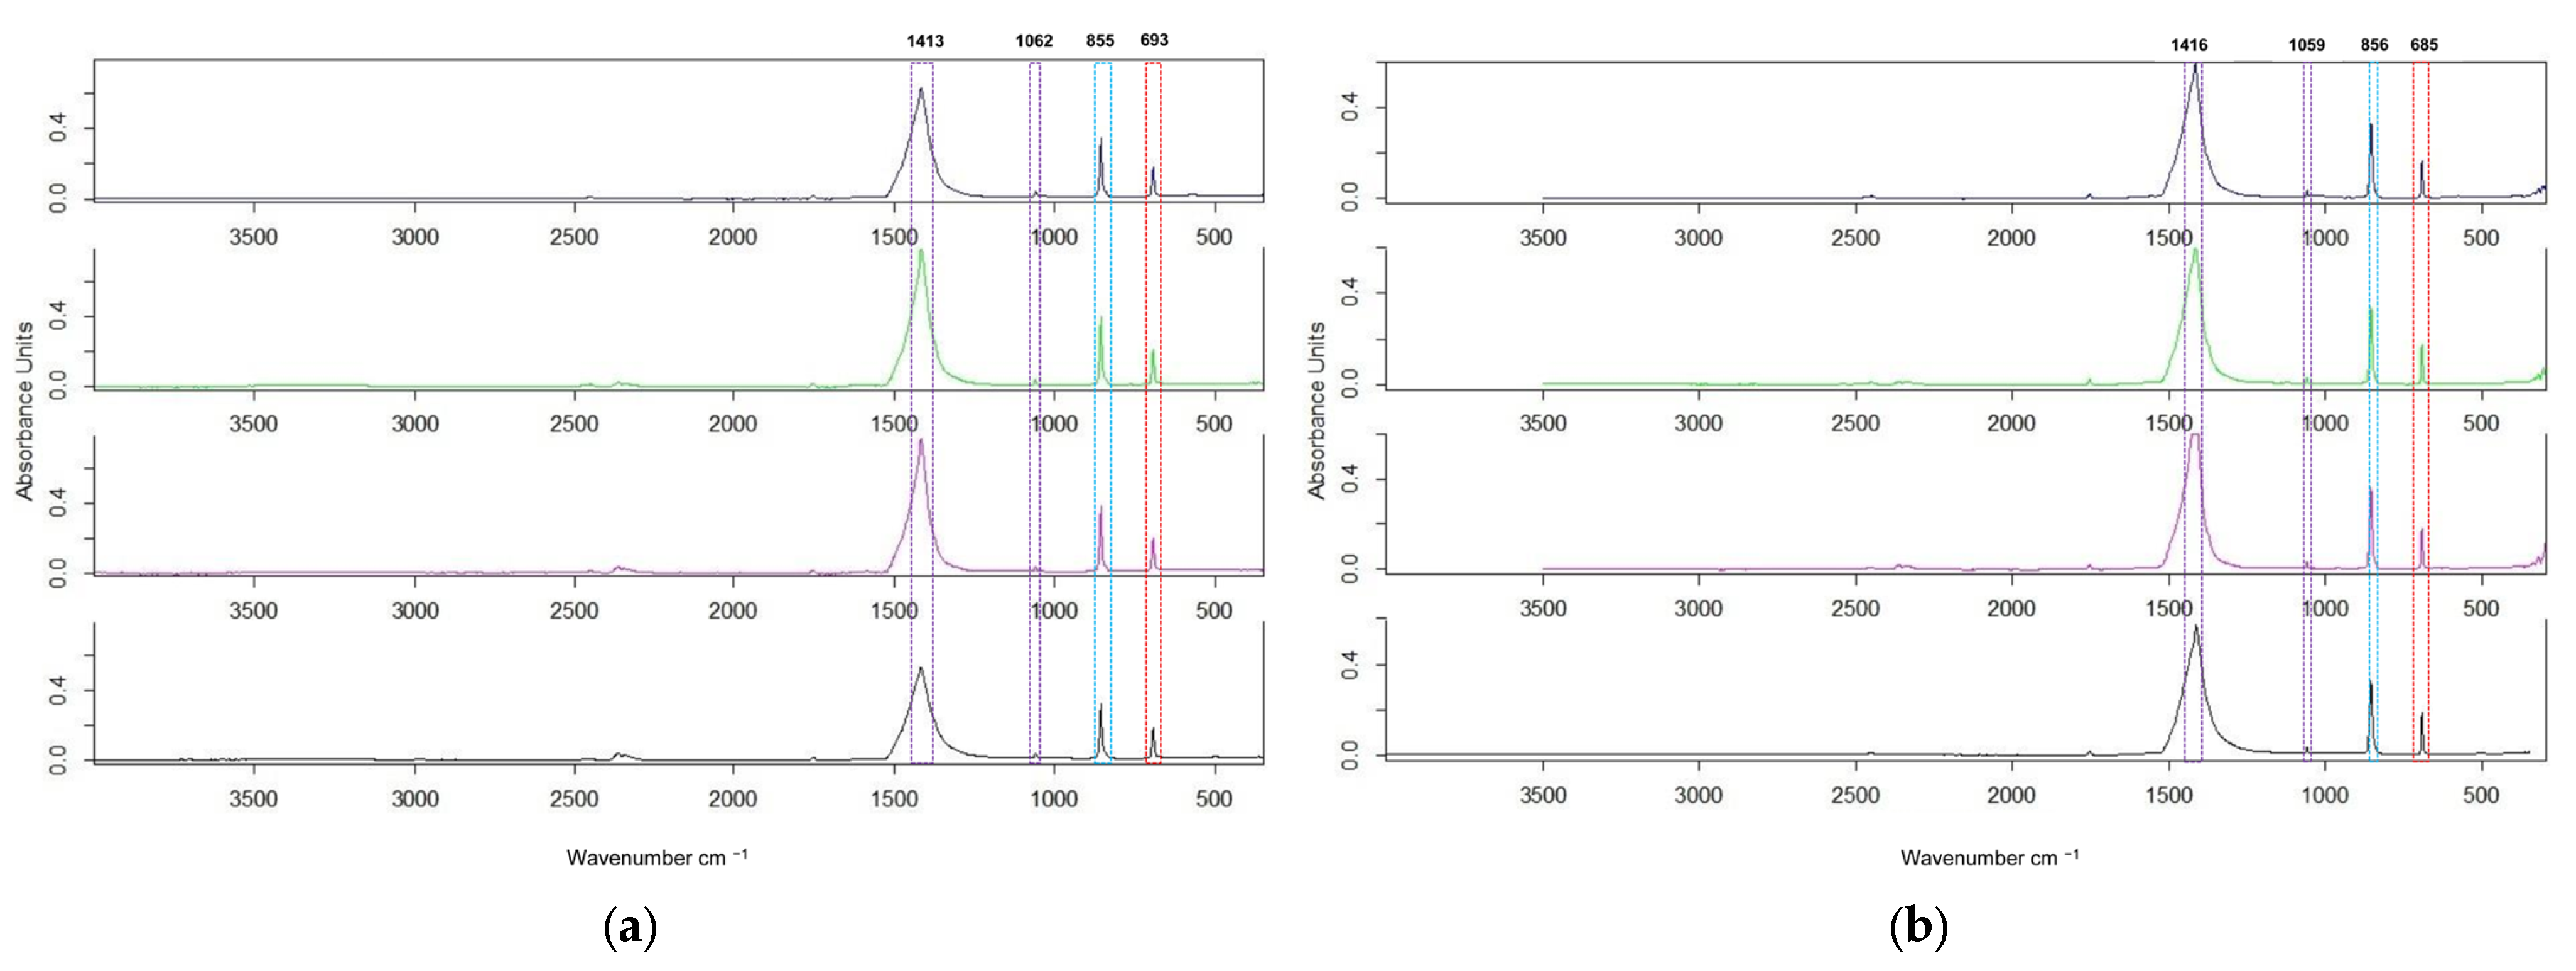
In
Figure 3, the ATR-FTIR spectra of all samples, before and after calcination at 550 °C, show peaks between 3500 and 350 cm
−1, given by the Opus 7.0 software of the spectrometer.
Because of absent OH stretching (~3640 cm
−1), indicated by absent hydroxide phases, we analyzed the spectra between 1650 and 300 cm
−1. The ATR-FTIR spectra of all samples, before and after calcination, exhibited the characteristic carbonate group absorptions [
16,
18,
19,
20].
The intense band, observed at 1416/1413 cm−1, corresponds to the asymmetric stretching vibration (ν3) of the C-O bonds.
The band at 1062/1059 cm−1 is attributed to the symmetric stretching vibration (ν1). This vibration, usually inactive in the infrared spectrum of the free carbonate ion, becomes active in the witherite spectrum due to reduced crystallographic symmetry.
Two additional absorption bands confirm the presence of the CO32− anion: one at 855/856 cm−1, corresponding to the out-of-plane bending vibration (ν2), and a second one at 683/685 cm−1, associated with the in-plane bending vibration (ν4).
The positions and intensities of these absorption bands are consistent with those previously reported in the literature for crystalline barium carbonate, confirming the successful formation of BaCO3.
While Raman spectroscopy was not performed herein, the expected witherite fingerprint is consistent with the phase assigned by our IR analysis and aligns with representative BaCO
3 reports [
21,
22,
23,
24], as summarized in
Table 3.
The differences in band intensities arise from the distinct selection rules: Raman spectroscopy is the most sensitive to changes in polarizability (making ν1 dominant), whereas IR spectroscopy is driven by changes in dipole moment (favoring ν3).
3.3. Structural Characterization of Nano-BaCO3 Particles
Crystallinity and phase analysis were confirmed using XRD analysis [
9,
10].
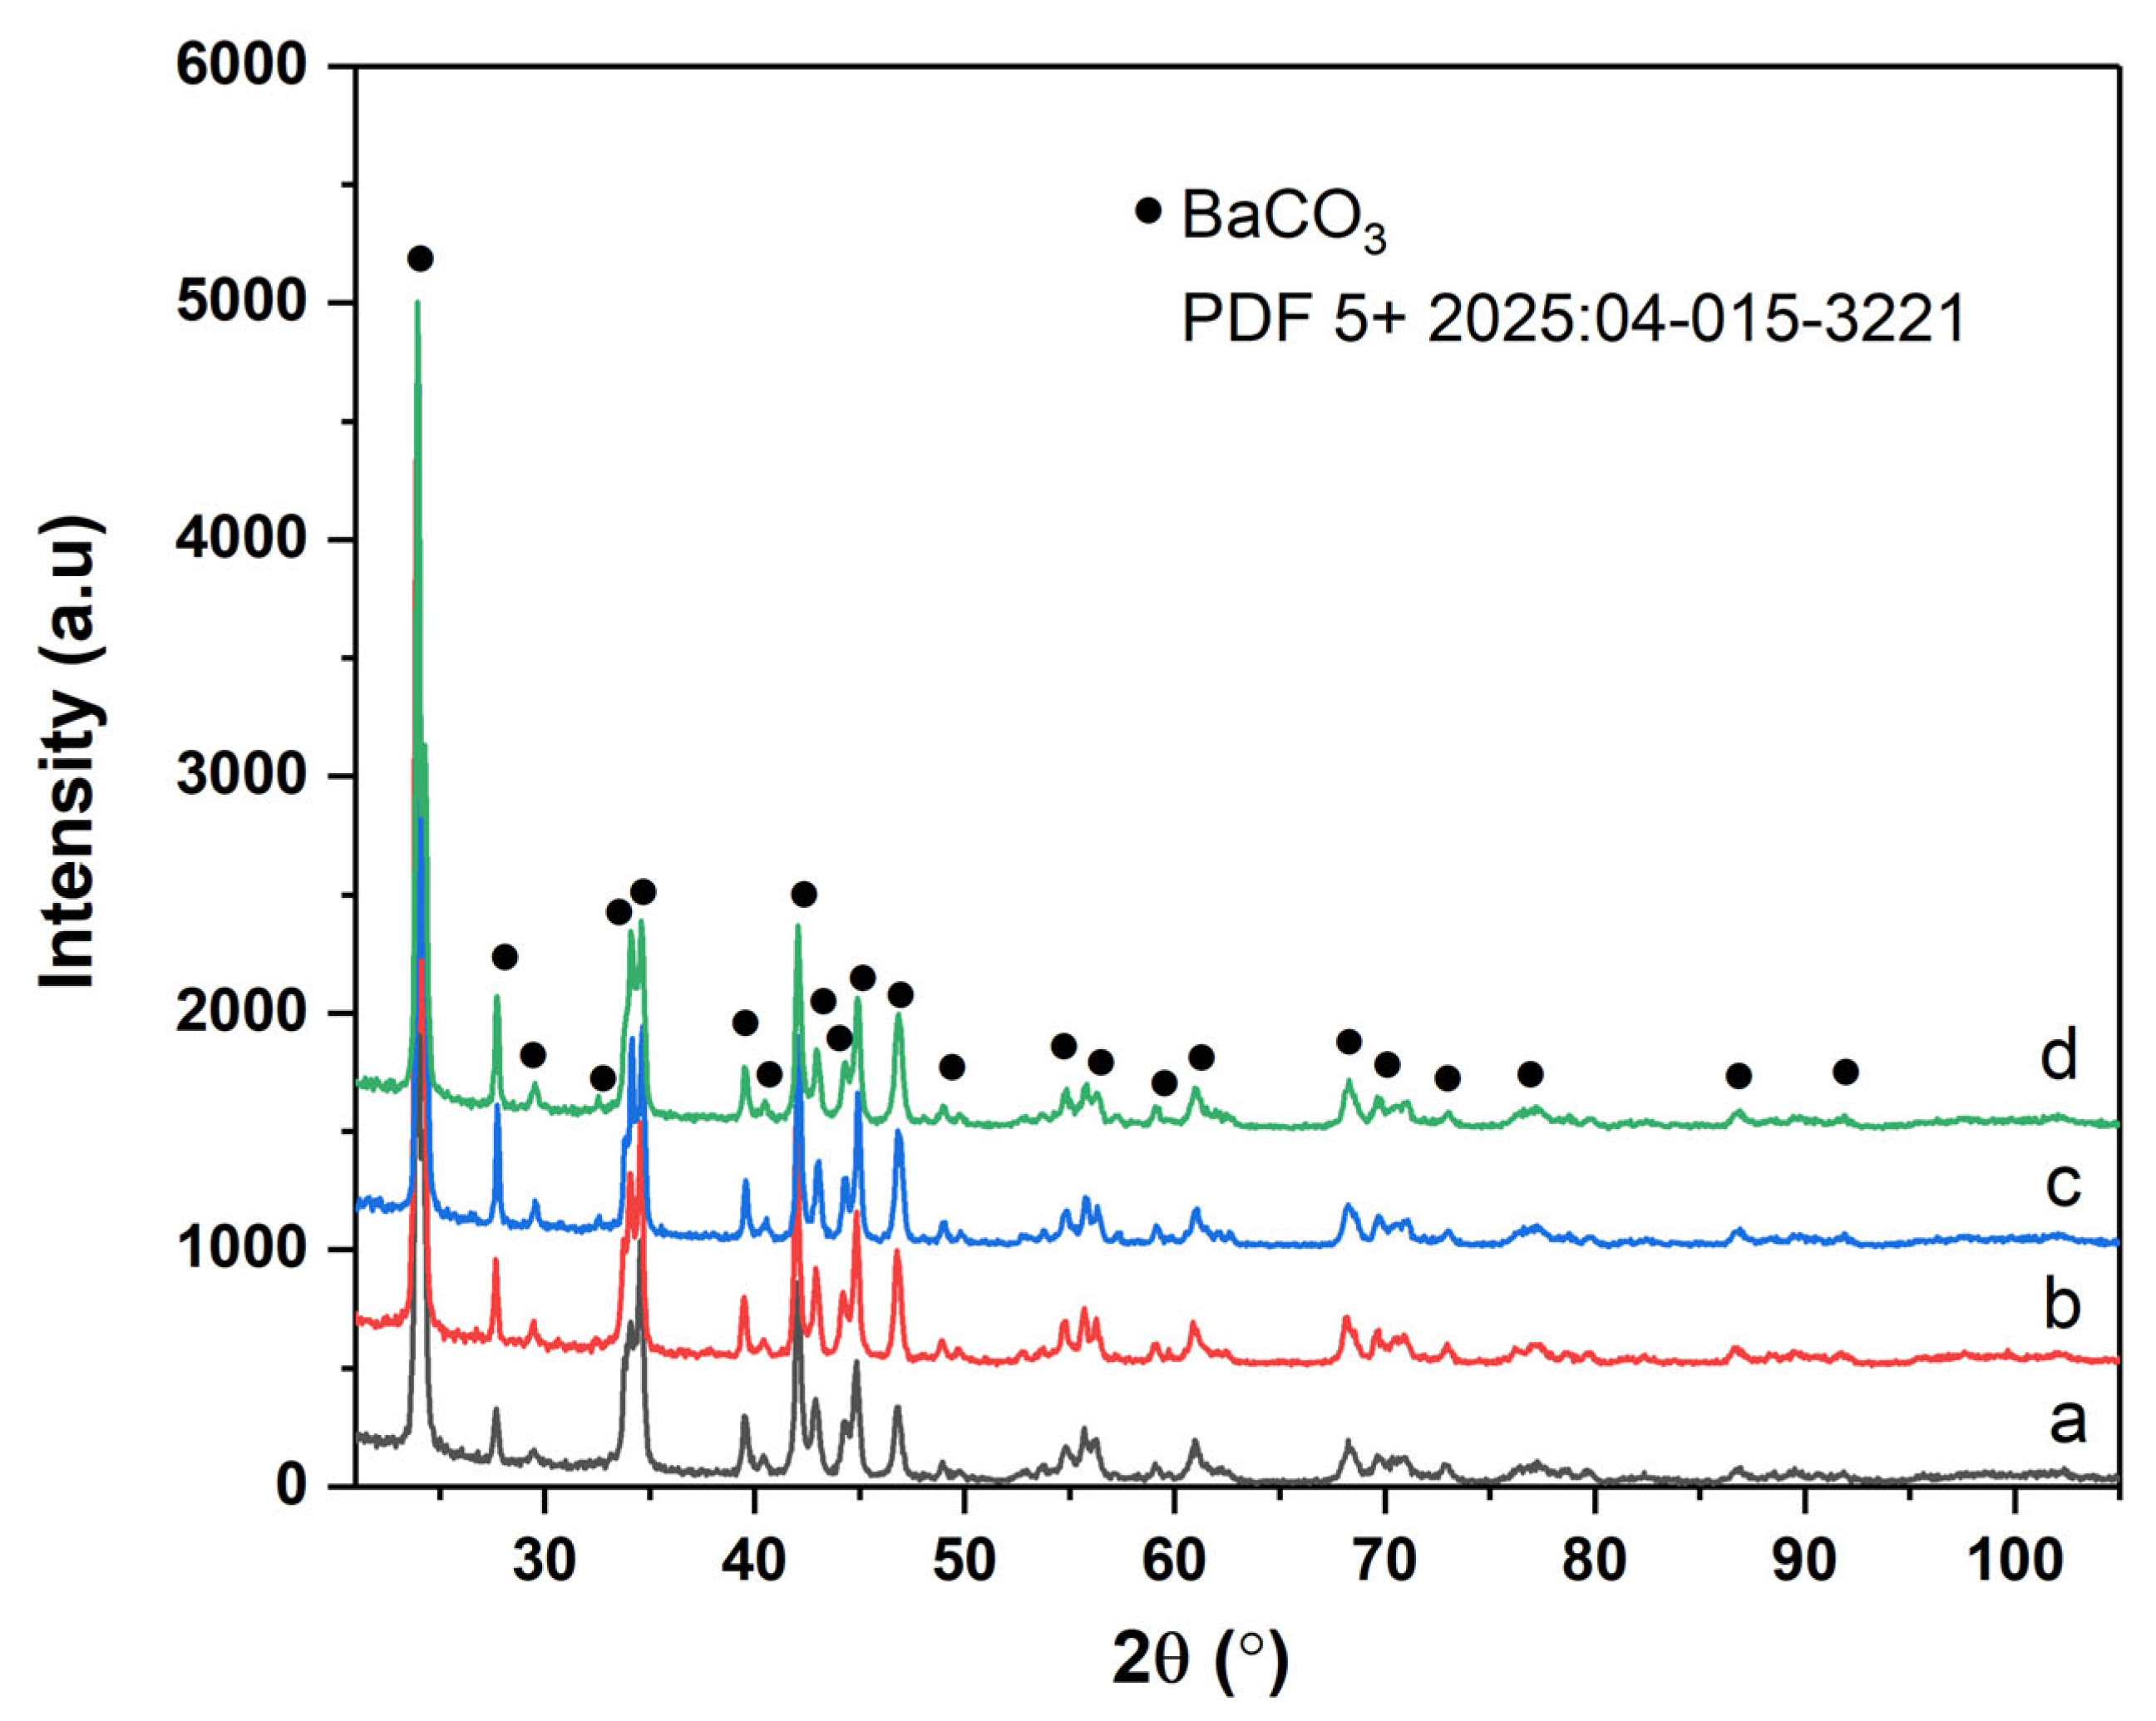
Figure 4 shows the XRD pattern of samples prepared using BaCl
2 and KOH under laboratory conditions. All the samples consisted of a single phase of well-crystallized witherite BaCO
3 (PDF 5+202504-015-3221) [
10,
15,
21]. The diffraction lines are sharp and well-resolved, indicating a high degree of crystallinity across synthesis conditions. No secondary phases such as Ba(OH)
2, BaO, or BaCO
3 polymorphs (e.g., witherite-type) were detected, suggesting that the reaction conditions effectively favored the formation of a single, pure orthorhombic BaCO
3 phase. The microstructural parameters (crystallite size and lattice parameters,
Table 4) were determined by means of Rietveld refinement (Whole powder pattern fitting) using PDXL 2 software (Rigaku, Japan) and the Crystallographic information file of the BaCO
3 04-015-3221 PDF5+ 2025 DB card.
The XRD structural analysis of BaCO3 samples synthesized at different concentrations of Ba2+ ions (0.5 M, 1.0 M, 1.5 M) and at distinct temperatures (room temperature and 75 °C) revealed significant variations in the size of the crystallites, under the conditions of the relative stability of the lattice parameters. The values obtained for the lattice constants a, b, and c show variations below 0.3%, which indicates the preservation of the same crystalline phase, without major structural distortions induced by the change in the composition of the synthesis solution or the treatment temperature.
For samples obtained at room temperature, a progressive increase in crystallite size was observed from 52.00 ± 2.6 nm for the concentration of 0.5 M Ba
2+ to 56.26 ± 2.7 nm for 1.0 M and 64.74 ± 1.4 nm for 1.5 M (
Table 3). This trend can be correlated with a reduction in the number of initial nuclei and the favoring of particle growth as the concentration of the precursor increases. The effect of temperature was investigated by comparing the 1.0 M sample synthesized at room temperature with that obtained by holding the temperature at 75 °C. The results indicate a significant increase in crystallite size, from 56.26 ± 2.7 nm to 86.65 ± 1.1 nm, which corresponds to a relative increase of about 54%. This amplification is attributed to the intensification of coalescence and Ostwald ripening processes at higher temperatures, when the mobility of ionic species and the diffusion rate increase, favoring the preferential growth of large crystallites at the expense of small ones. The elemental cell volume, calculated based on lattice parameters, remained practically constant for all samples (305.10 ± 0.36 Å
3), confirming that the observed differences are due to crystalline growth processes and not to fundamental structural changes.
These results demonstrate that both the concentration of Ba2+ ions in the synthesis solution and the heat treatment temperature are key factors in controlling the size of BaCO3 crystallites, with direct implications for the functional properties of the material, such as thermal stability, sintering behavior, and catalytic activity.
To establish a quantitative relationship between crystallite size (D) and synthesis parameters, namely Ba
2+ concentration (C) and temperature (T), a regression-based analysis was performed using Minitab
® 2, according to [
25,
26]. Weighted least squares (WLS) regression was applied to account for measurement uncertainties. The model was fitted in logarithmic form to capture multiplicative effects [
14]:
where C is Ba
2+ concentration (M); T is a binary variable (0 = room temperature; 1 = 75 °C); and α, β, and γ are regression coefficients. After back-transformation, the predictive equation becomes the following:
with A =
eα representing the baseline crystallite size at C = 0 and T = 0. The fitted parameters are as follows:
A = 45.78 ± 1.76 nm.
β = 0.229 ± 0.029, indicating that each 1 M increase in Ba2+ concentration increases crystallite size by approximately e0.229 ≈ 25.8% at constant temperature.
γ = 0.409 ± 0.015, corresponding to a multiplicative increase in e0.409 ≈ 50.5% when synthesis is performed at 75 °C compared to room temperature.
The exponential model showed superior statistical performance, with adjusted R2 = 0.986 and residual diagnostics confirming the validity of model assumptions. This quantitative approach allows for the predictive estimation of crystallite size for intermediate synthesis parameters and supports process optimization for targeted BaCO3 properties.
Increasing precursor concentration and synthesis temperature led to the progressive sharpening of IR bands, indicative of improved crystallinity. XRD confirmed witherite as the dominant phase, with a marked reduction in peak broadening for the 1 M and 75 °C sample, correlating with the highest FTIR band resolution, and no Ba(OH)
2 reflections were observed within detection limits. The integrated analysis demonstrates that subtle modifications in synthesis parameters significantly influence BaCO
3 structural order, with direct implications for tailoring material properties for optoelectronic, catalytic, and advanced ceramic applications [
26].
3.4. Morphological Characterization of Nano-BaCO3
The morphology of the synthesized barium carbonate (BaCO
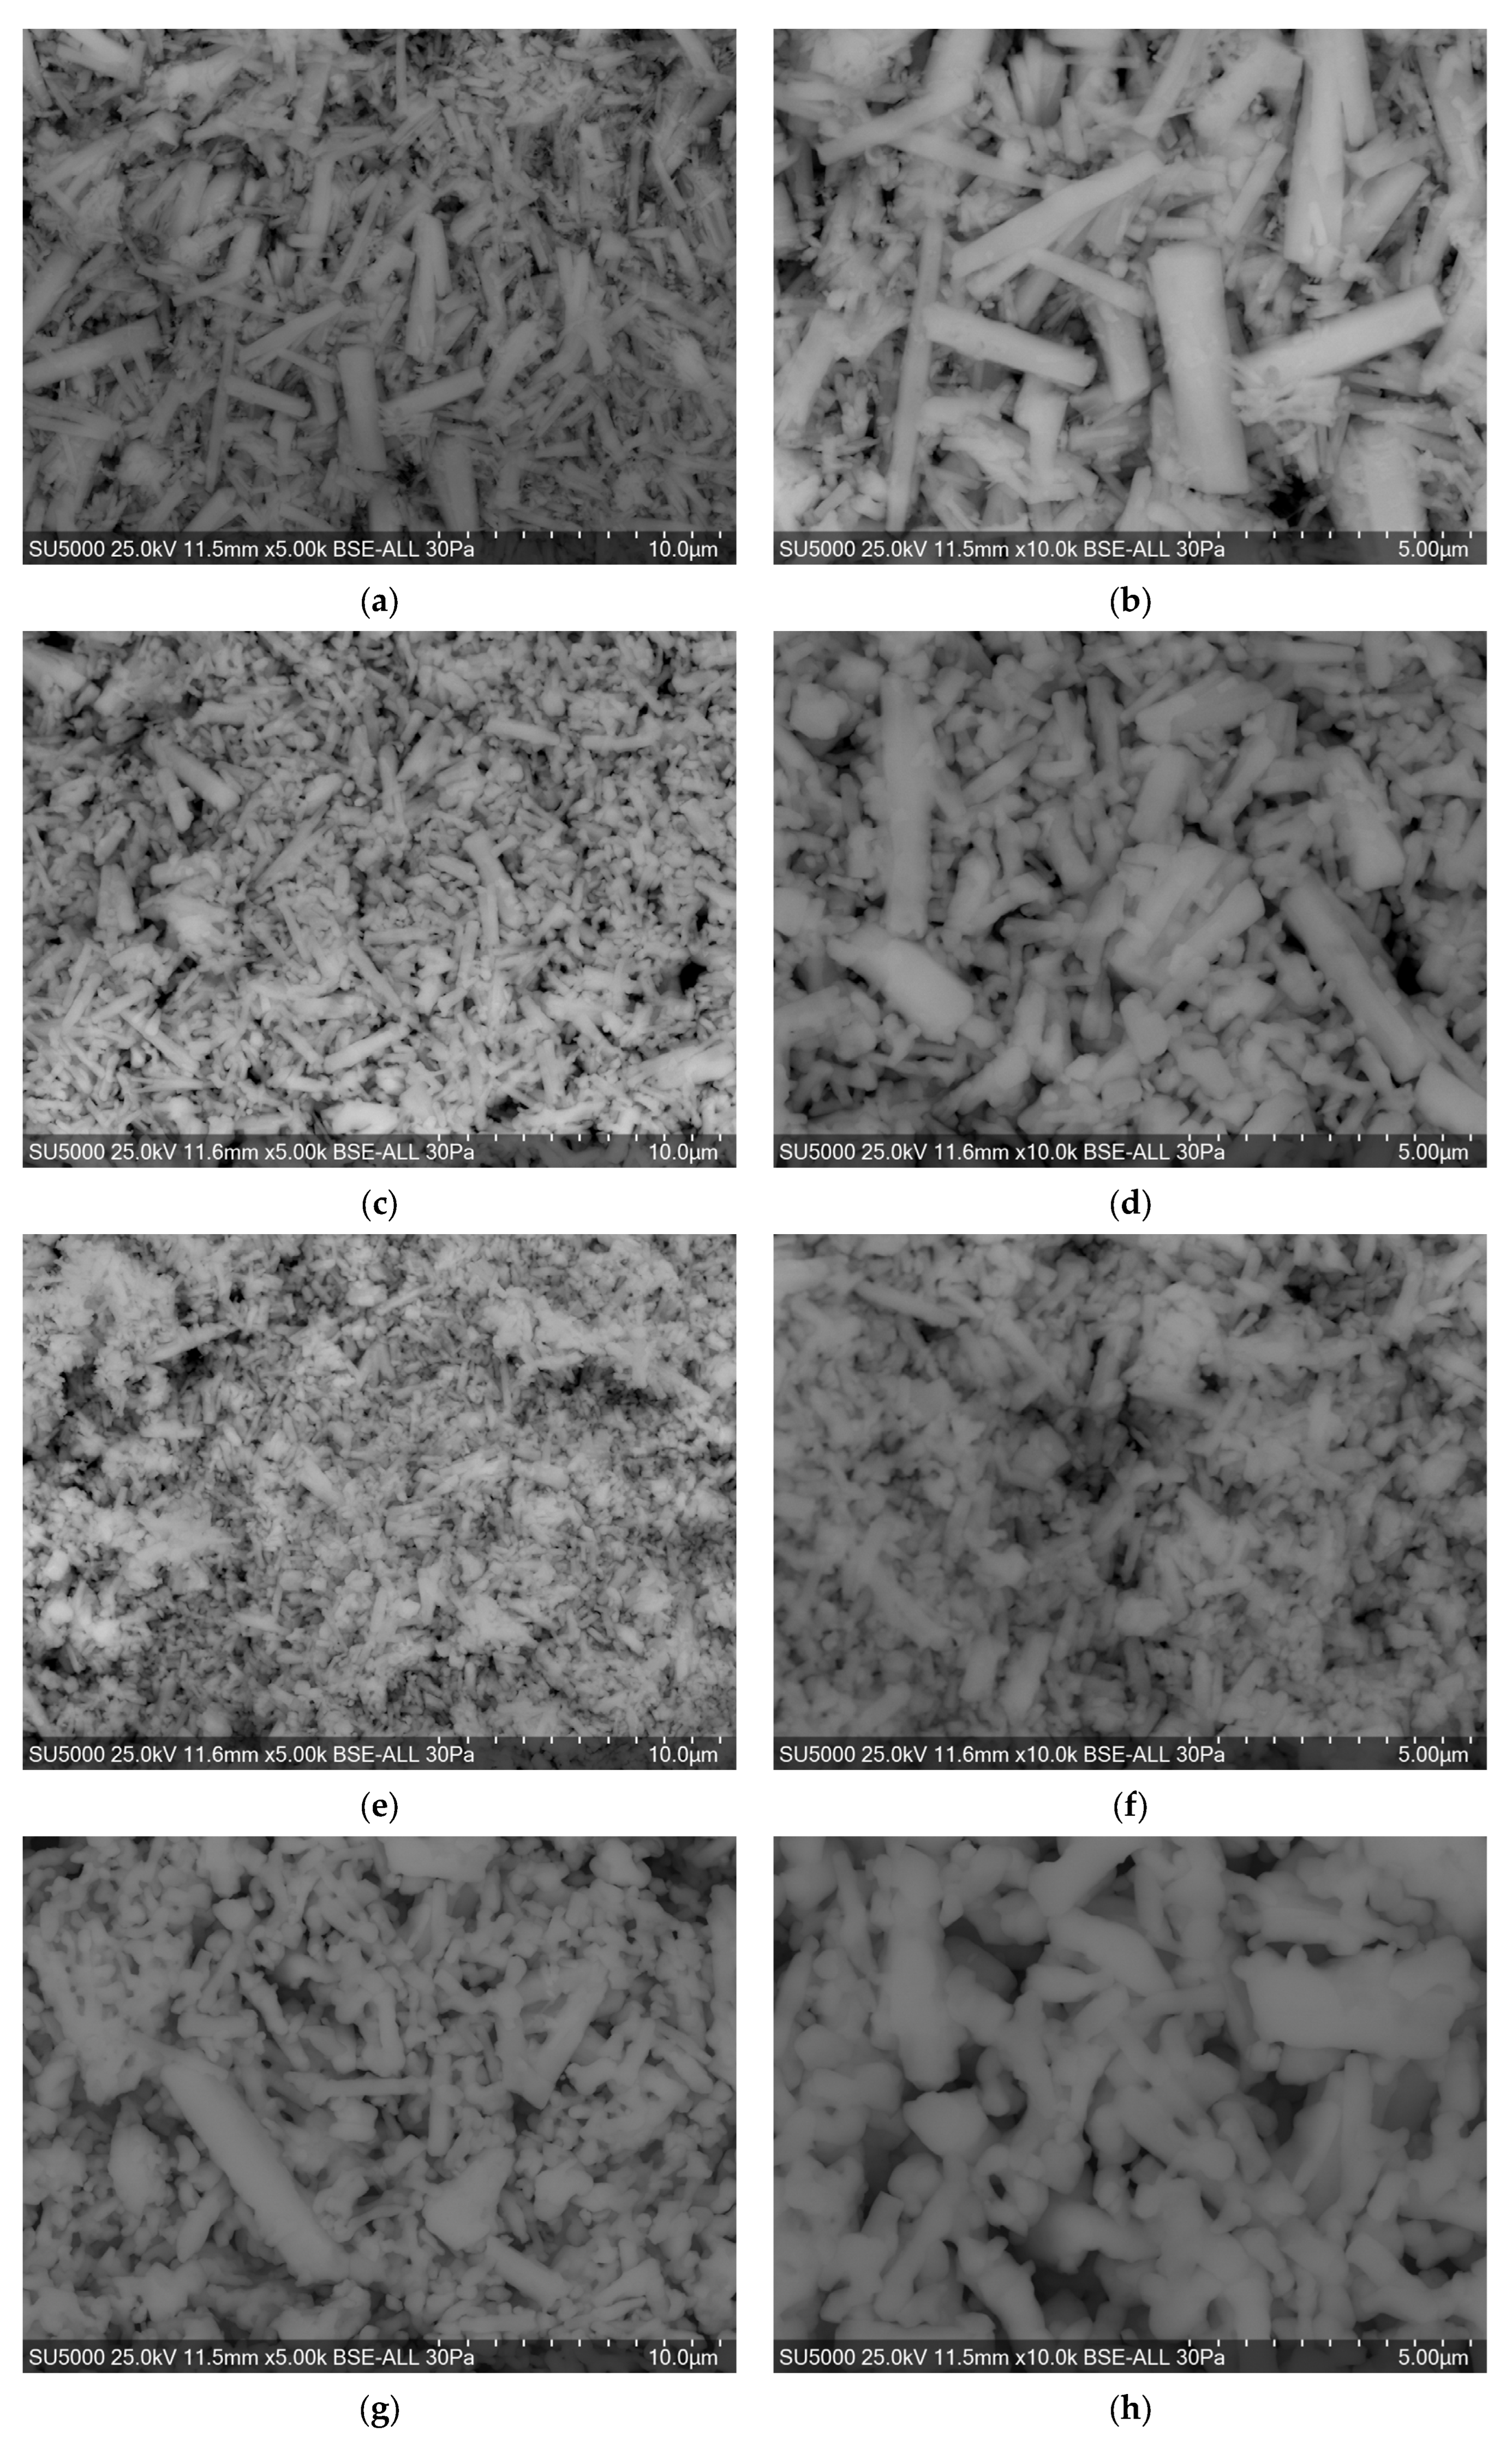
3) particles was investigated using scanning electron microscopy (SEM) at an accelerating voltage of 25 kV and a scan integration time of 30 s. Imaging was performed in backscattered electron (BSE) mode, which emphasizes compositional contrast and topographical differences, providing valuable insights into particle habit and aggregation patterns. Representative micrographs at 5000× and 10,000× magnifications for different precursor concentrations and synthesis conditions are presented in
Figure 5.
SEM observations show that BaCO
3 particles predominantly exhibit a rod-like morphology, with variations in alignment, length, and edge definition depending on synthesis conditions. For the 0.5 M precursor concentration (
Figure 5a,b), the particles display relatively shorter rod-like structures that are moderately aggregated and have smooth contours. The particle population is somewhat polydisperse in length, and individual rods appear loosely associated, indicating a relatively slow and uniform nucleation and growth process under low supersaturation.
At the 1.0 M concentration (
Figure 5c,d), the rods are more elongated and well-defined, often forming aligned or intergrown assemblies. The aspect ratio increases compared to the 0.5 M sample, and crystal edges appear sharper, reflecting more pronounced directional growth. The overall morphology suggests a shift toward growth-dominated kinetics, with enhanced anisotropic extension along specific crystallographic axes.
The 1.5 M sample (
Figure 5e,f) also presents rod-like particles but with increased clustering and partial intergrowth, which sometimes obscures individual rod boundaries. The higher ionic strength likely promoted rapid nucleation and simultaneous growth, leading to less ordered assemblies and the formation of compact, randomly oriented rod bundles.
The sample synthesized at 1.0 M using heating conditions (Nano-BaCO
3/1/75;
Figure 5g,h) reveals uniform rod-like particles that are smaller and more evenly distributed than in the conventional synthesis. The rods maintain a well-defined morphology, and their dispersion is improved. This suggests that heating enhances nucleation control and suppresses excessive aggregation, enabling better control over rod growth and particle separation.
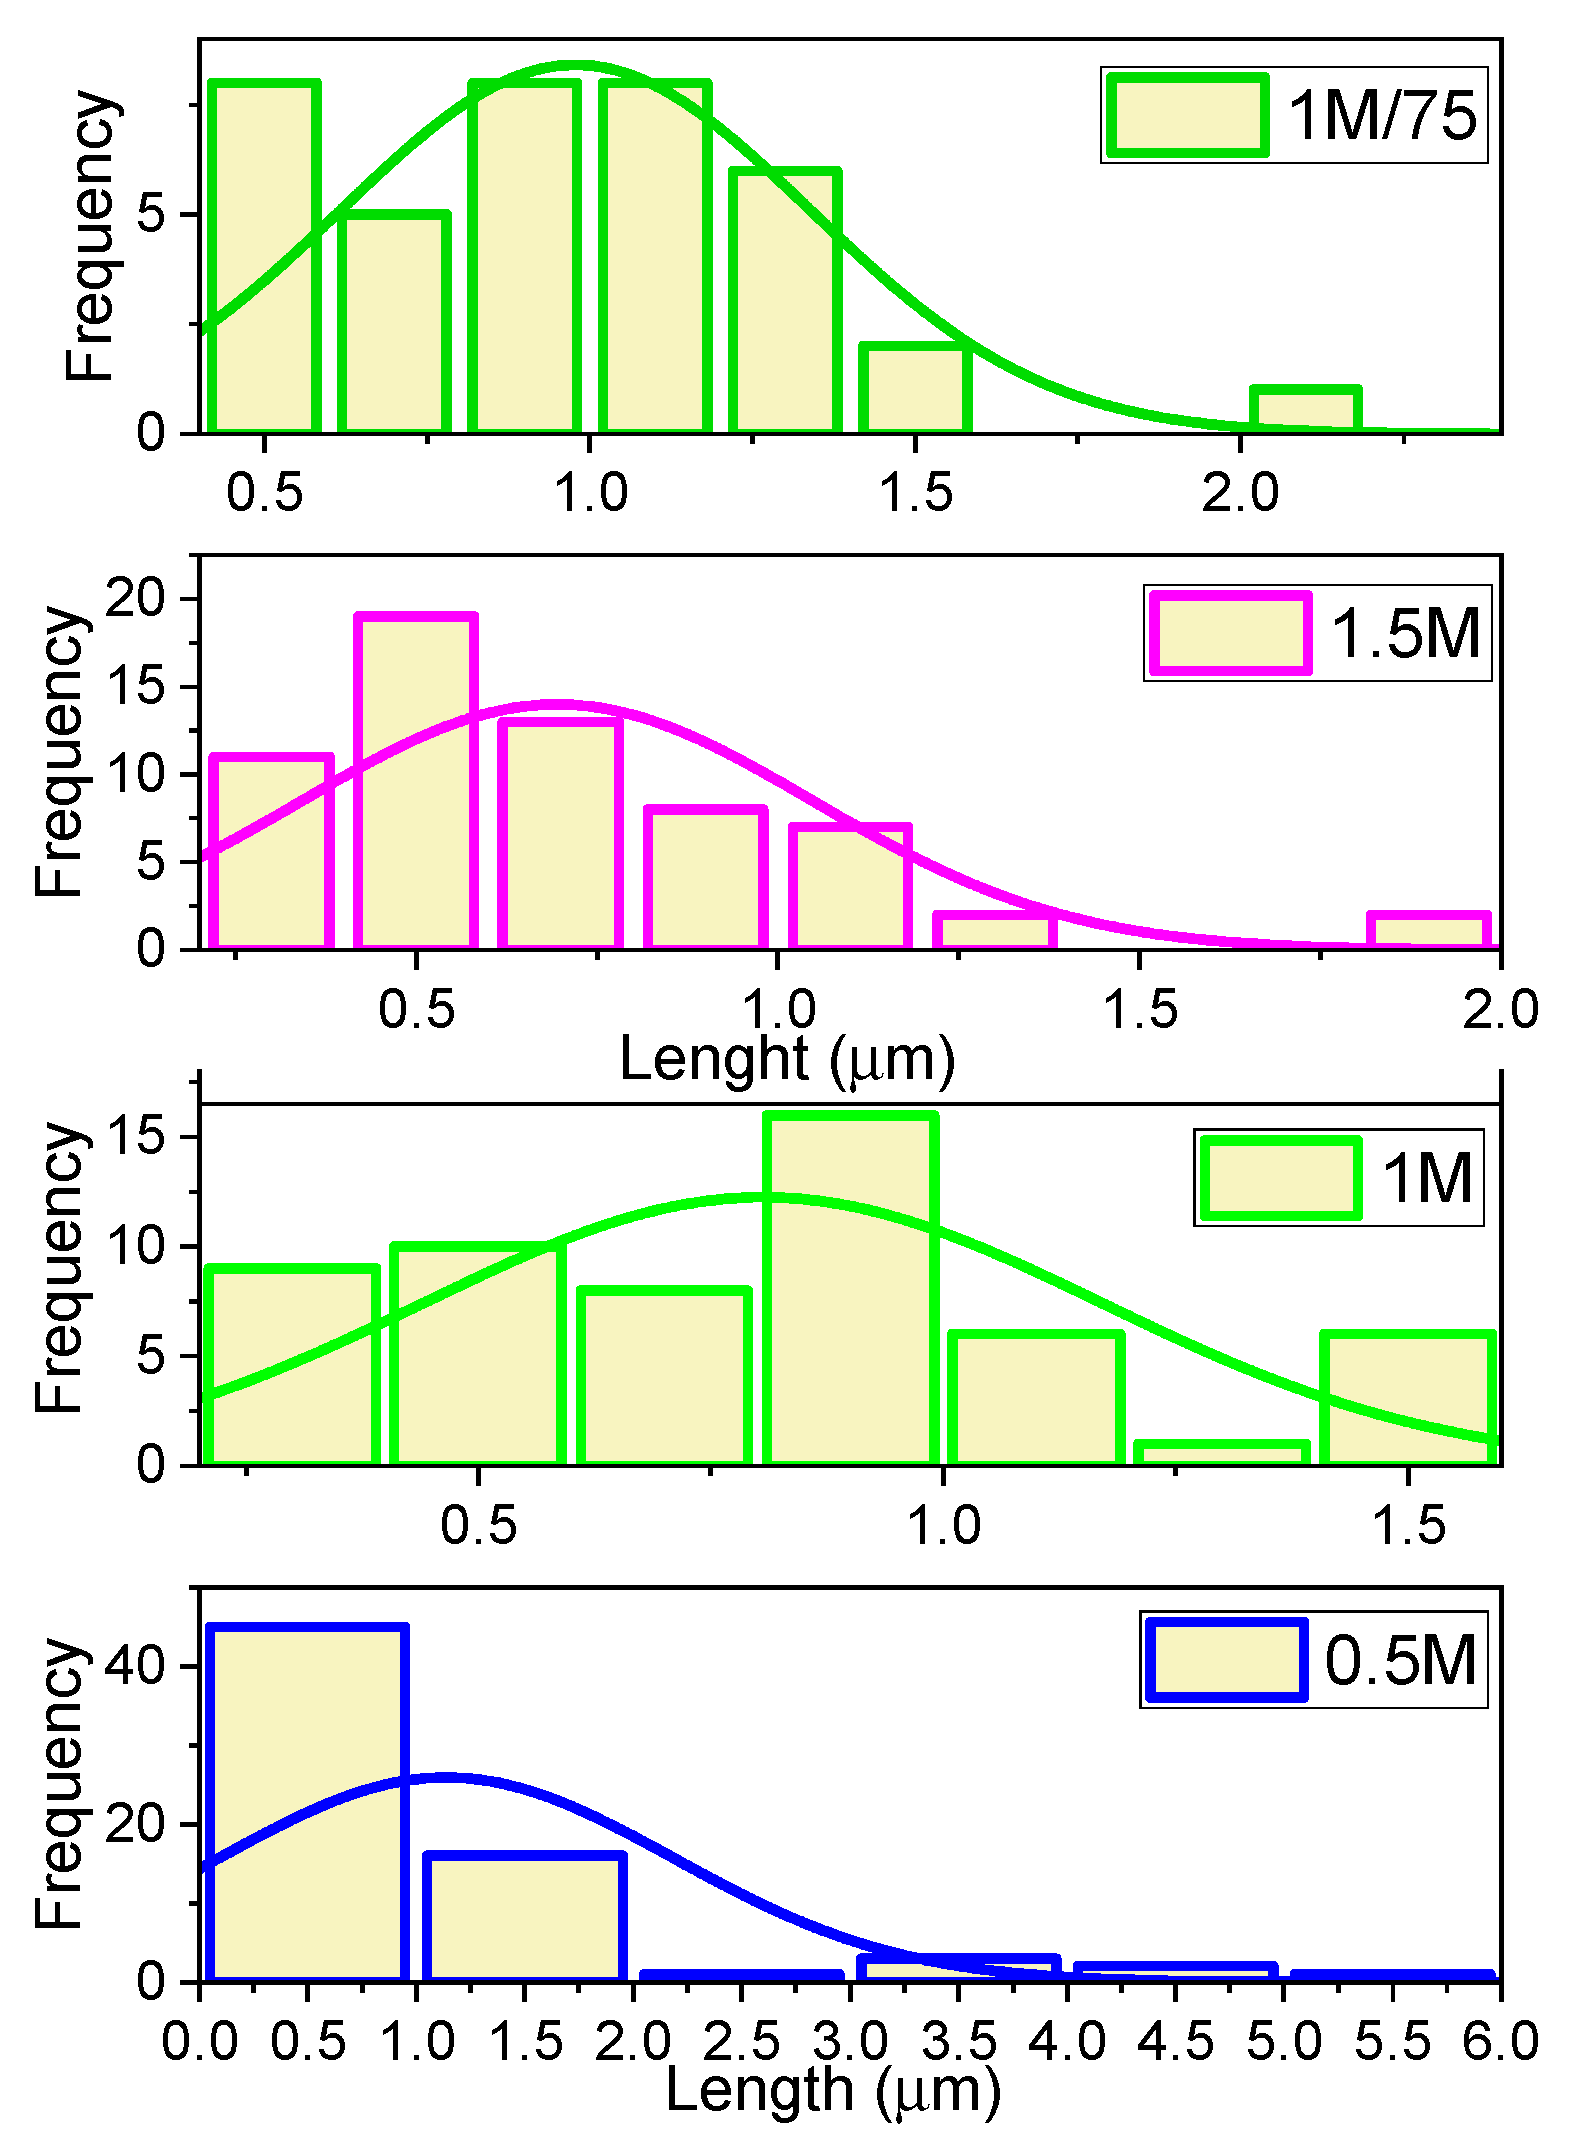
The BaCO
3 length distribution histograms obtained at different concentrations of the precursor solution (0.5 M, 1 M, 1 M/75, and 1.5 M) in
Figure 6 show statistically significant variations in morphology, reflecting the direct influence of the supersaturation regime on the nucleation and crystal growth processes. In the case of BaCO
3 particles synthesized from the 0.5 M concentration solution, it displays a strongly asymmetrical distribution to the right, with a maximum in the range of 0.3–0.5 μm and a very long tail, extending to about 5–6 μm. This high polydispersity is characteristic of low-supersaturation regimes, where nucleation is limited and existing particles benefit from an extended growth time, leading to the formation of significantly longer rods. The stem length departition histogram of Nano-BaCO
3/1 particles is characterized by an almost symmetrical distribution, centered around 0.9–1.0 μm, but with a slight presence of both short (<0.5 μm) and longer (>1.5 μm) particles. The average width of the distribution suggests a balance between nucleation and growth, resulting in a particle with relatively uniform dimensions but with a structural diversity useful in functional applications. The BaCO
3/1.5 sample shows an asymmetrical distribution to the right, with a maximum frequency at 0.5–0.6 μm and an extended tail to higher values (~2 μm). This shape is specific to systems with high supersaturation, where rapid nucleation generates many small nuclei, while a small fraction of particles continue on the path of accelerated growth, leading to moderate polydispersity.
The length distribution histogram of Nano-BaCO3/1/75 shows an almost symmetrical distribution, slightly shifted to the right, with a single pronounced peak around 1.0 μm. This reflects a controlled growth regime and uniform nucleation and elongation, good conditions for obtaining a homogeneous stem population. The comparative analysis highlights that the most uniform and controlled distribution is obtained for the Nano-BaCO3/1/75 sample, while the maximum variability is associated with the Nano-BaCO3/0.5 sample. The 1.5 M concentration regime favors the obtaining of short rods with moderate dispersion, being suitable for applications requiring small dimensions, and intermediate concentrations, such as 1 M, ensure a compromise between homogeneity and dimensional diversity.
In conclusion, SEM observations confirm that rod-like morphology is characteristic of all synthesized BaCO3 samples, with size, uniformity, and degree of aggregation strongly influenced by precursor concentration and synthesis conditions. Temperature-assisted synthesis yielded the most homogeneous rod-shaped structures, while higher precursor concentrations under conventional conditions resulted in larger, more agglomerated assemblies.
3.5. BET Analysis
The experimental values for BET surface, total pore volume, and maximum pore volume are presented in
Table 5.
BET analysis highlights significant differences between GP and PVC matrices, as well as the effects of the addition of BaCO3 nanoparticles on textural properties. The GP sample presents a high specific surface area (36.21 m2/g) and a considerable pore volume (0.938 cm3/g), with average pore sizes of 10.37 nm (adsorption) and 16.57 nm (desorption), which confirms its mesoporous nature and its ability to adsorb organic molecules. In contrast, PVC has negative and undefined values for the BET parameters, which suggests a compact structure, lacking accessible porosity and, implicitly, a negligible specific surface area.
The incorporation of BaCO3 nanoparticles leads to obvious changes. In the case of GP@Nano-BaCO3, the specific surface area decreases to 22.63 m2/g, and the pore volume drastically reduces to 0.062 cm3/g, indicating a partial occlusion of the pore network by the particles. However, the average pore size increases slightly (10.65–18.79 nm), suggesting that the nanoparticles may preferentially be located in micropores or in intermediate zones, causing a redistribution of the pore network.
In the case of PVC@Nano-BaCO3, the addition of BaCO3 causes the appearance of incipient porosity, with a specific surface area of 0.0359 m2/g and an extremely low pore volume (0.000232 cm3/g). However, the pore diameters (25.77–28.05 nm) are in the macroporous range, suggesting that the BaCO3 nanoparticles generated a more open texture, without ensuring the significant development of the surface area.
In conclusion, the GP presents an intrinsic structure favorable for adsorption and photocatalysis, and the integration of Nano-BaCO3 reduces the available surface area but modifies the pore distribution, which may influence the diffusion mechanisms and access to the active centers. In contrast, PVC is texturally inert, and only by the addition of BaCO3 does it acquire an incipient porosity.
3.6. Photocatalytic Activity of GP@Nano-BaCO3 and PVC@Nano-BaCO3
Because of the greatest rate production, Nano-BaCO
3/1/75 nanoparticles with good crystallinity and nanoscale crystallite dimension were incorporated into GP and PVC matrices to comparatively assess their photocatalytic performance. The formulation of PVC@Nano-BaCO
3 corresponds to 4.8 wt.% Nano-BaCO
3/1/75 particles, calculated to the total mass. The formulation of GP@Nano-BaCO
3 corresponds to 1.1 wt.% Nano-BaCO
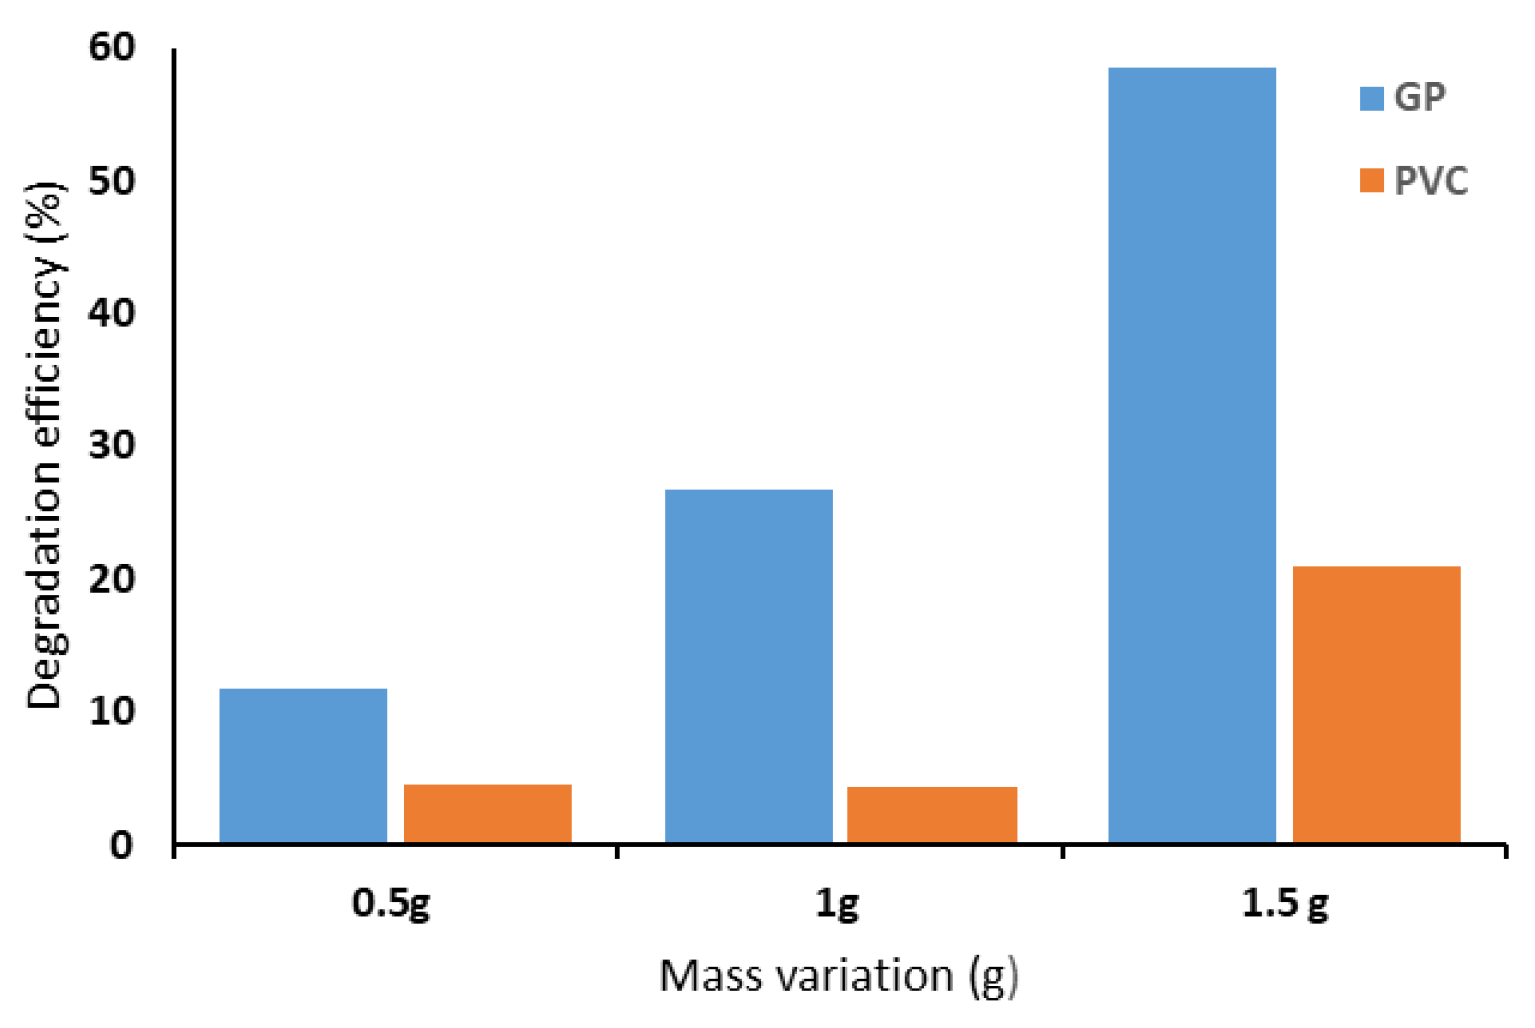
3.1/75 particles relative to the total formulation. Before modification, the pristine materials were examined, in dark conditions, to establish their baseline capacity for MB adsorption. As illustrated in
Figure 7, both GP and PVC showed improved removal efficiency with increasing catalyst dosage, though the effect was far more significant for GP. At 0.5 g, GP removed ~12% of MB compared to ~5% for PVC; at 1.0 g, GP reached ~27%, while PVC exhibited little variation; and at 1.5 g, GP achieved ~58% versus ~21% for PVC. These results confirm the superior adsorption capacity of GP, likely associated with its porosity and larger surface area, whereas PVC displayed a lower intrinsic affinity for MB [
26]. Based on these findings, 1.5 g of catalyst in 100 mL of MB solution (15 ppm) was identified as the optimal dosage and subsequently adopted for all further experiments under sunlight radiation.
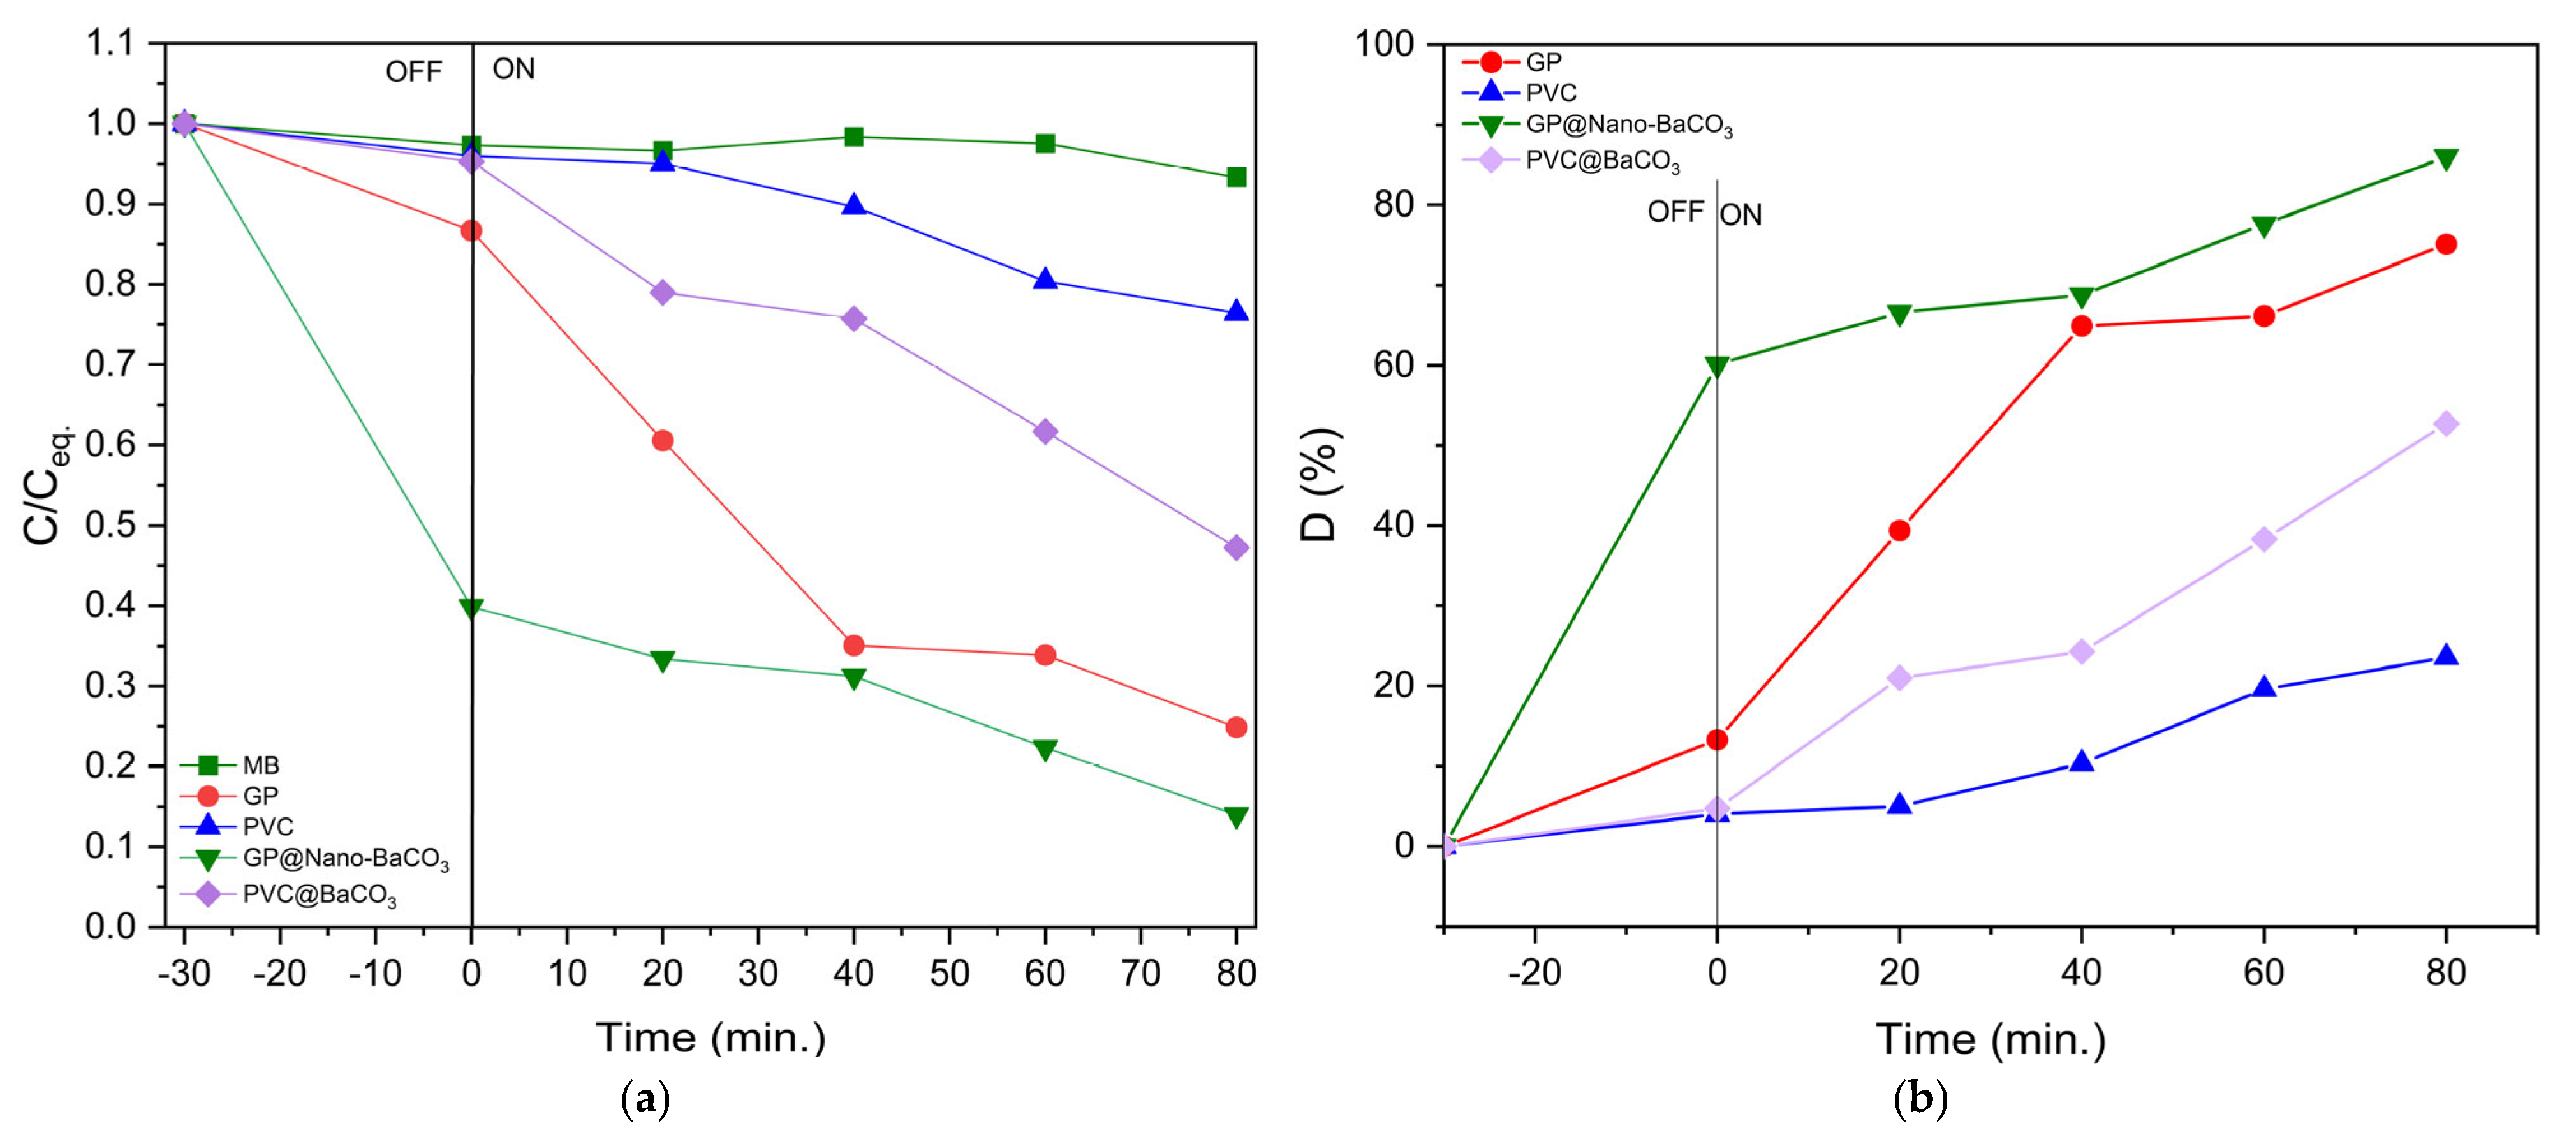
Figure 8 compares the degradation of MB using pristine GP and PVC with their corresponding composites incorporating Nano-BaCO
3/1/75 particles. Under dark conditions, both GP and PVC exhibited only moderate adsorption, as evidenced by a slight initial decrease in absorbance followed by stabilization, reflecting surface saturation and equilibrium adsorption. This behavior indicates that, in the absence of irradiation, the removal of MB is governed exclusively by physical and chemical adsorption phenomena at the catalyst surface.
When exposed to natural sunlight, a marked difference emerged between pristine materials and composites. GP and PVC alone showed limited photocatalytic activity, whereas the incorporation of BaCO
3 nanoparticles significantly enhanced degradation efficiency. GP@Nano-BaCO
3 consistently outperformed PVC@Nano-BaCO
3, reflecting the higher surface area and porosity of GP, which provide more accessible active sites for both adsorption and subsequent photocatalytic reactions. The continuous decrease in MB absorbance with irradiation time confirms the activation of photocatalytic processes, attributed to the in situ generation of reactive oxygen species (ROS), such as hydroxyl radicals (•OH
−) and superoxide anions (•O
2−). These species effectively attack the chromophoric groups of MB, leading to progressive molecular cleavage and eventual mineralization [
11].
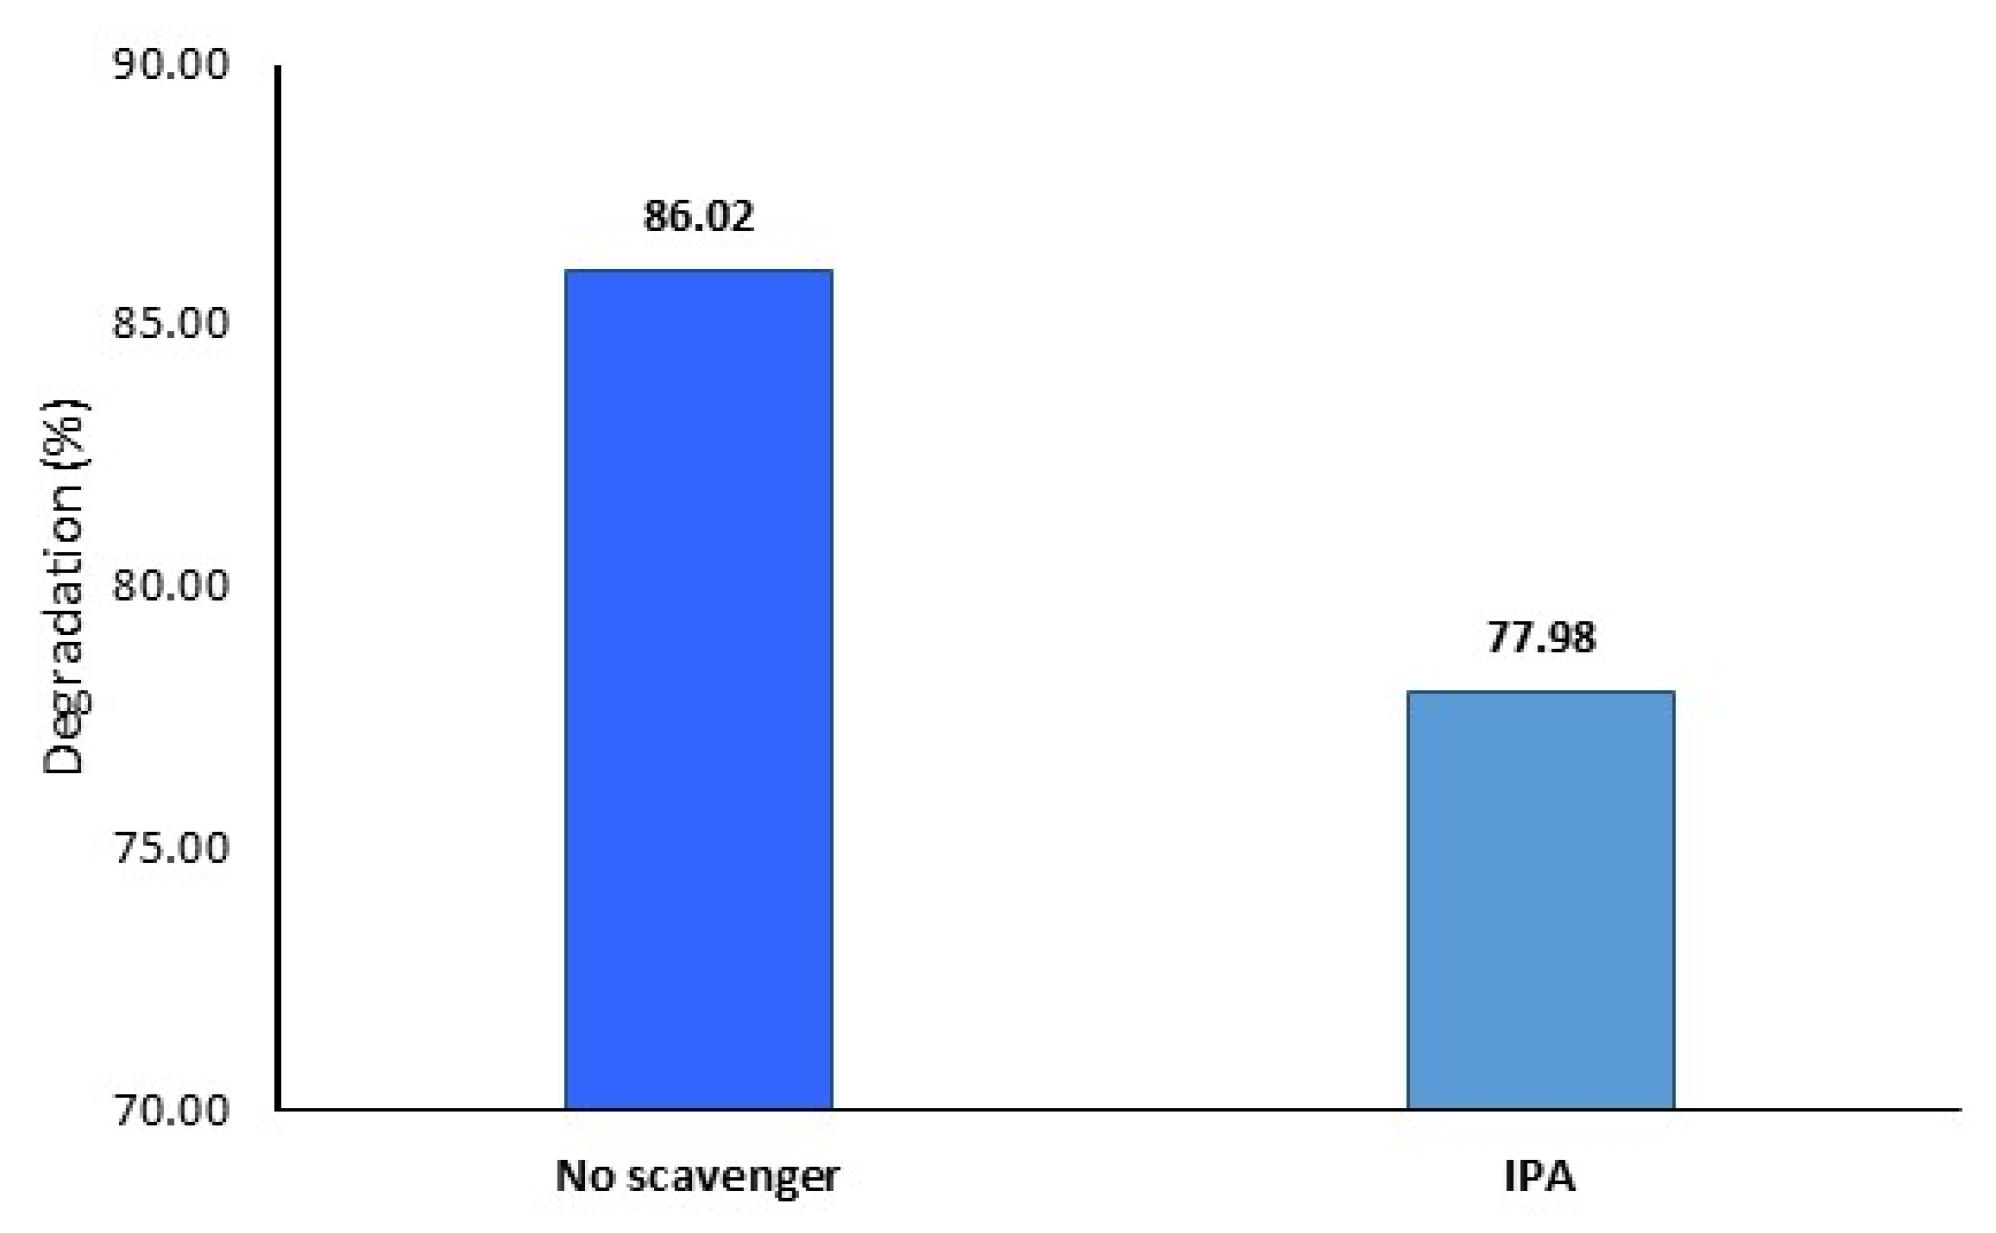
The mechanism of the photodegradation of MB using GP@Nano-BaCO
3 was explored using isopropanol (IPA) as a scavenger to capture hydroxyl radicals (OH
−). As shown in
Figure 9, the result indicates that the photocatalytic efficiency of GP@Nano-BaCO
3 decreased when IPA was used. This suggests that •O
2− radicals play a major role in MB degradation, while •OH
− has a minor role.
The superior performance of the composites, particularly GP@Nano-BaCO3, can be directly correlated with structural improvements evidenced by sharper FTIR bands and reduced XRD peak broadening, which confirm enhanced crystallinity and long-range order. This synergy between adsorption capacity and photocatalytic reactivity underscores the importance of nanoparticle incorporation as a strategy to boost the efficiency of both GP and PVC matrices for water purification applications.
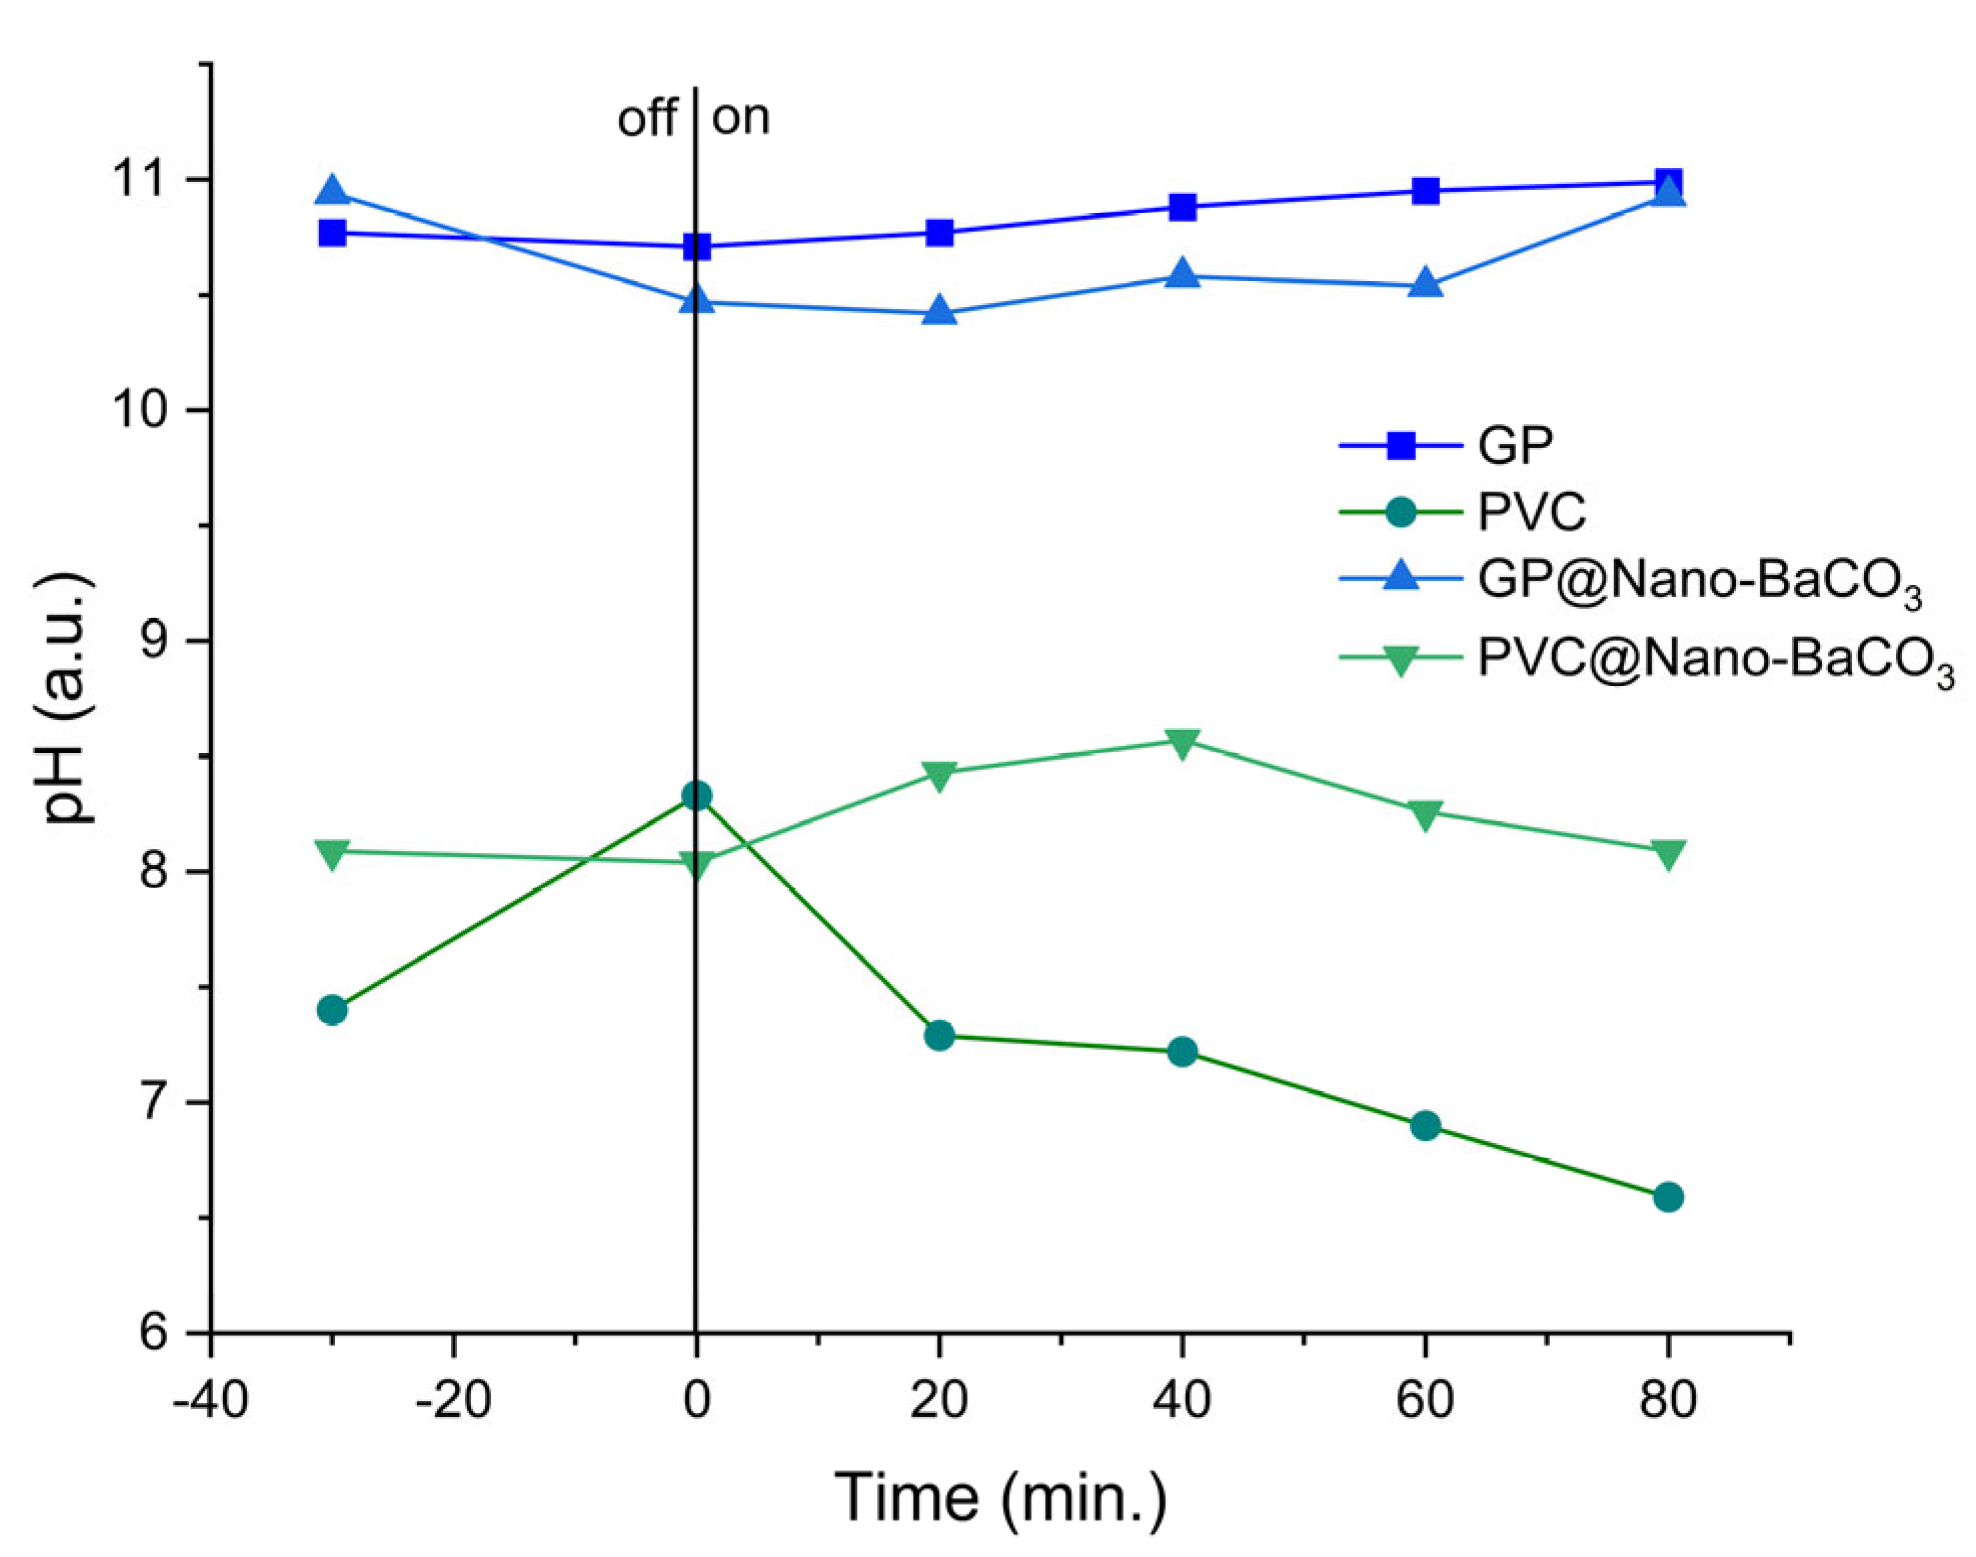
In continuity with the adsorption and photocatalytic results, the monitoring of pH under solar irradiation provides further clarification of the role played by the embedded BaCO
3 nanoparticles (
Figure 10). For the pristine supports, GP maintained a nearly constant alkaline pH (~10.7–11.0), while PVC showed a gradual acidification. GP@Nano-BaCO
3 displayed only a small transient dip followed by stabilization and a slight recovery toward ~10.9, whereas PVC@Nano-BaCO
3 exhibited a mild alkalinization in the first 20–40 min (to ~8.5) and then a gentle drift back toward ~8.0. Because BaCO
3 is immobilized inside the polymeric/geopolymeric matrices, these trends cannot be ascribed to bulk dissolution but to interfacial carbonate buffering at the MB solution–catalyst boundary. The effect is more marked for GP@Nano-BaCO
3 than for PVC@Nano-BaCO
3, consistent with the higher hydrophilicity and better nanoparticle dispersion in the GP, which enhance solution access to BaCO
3.
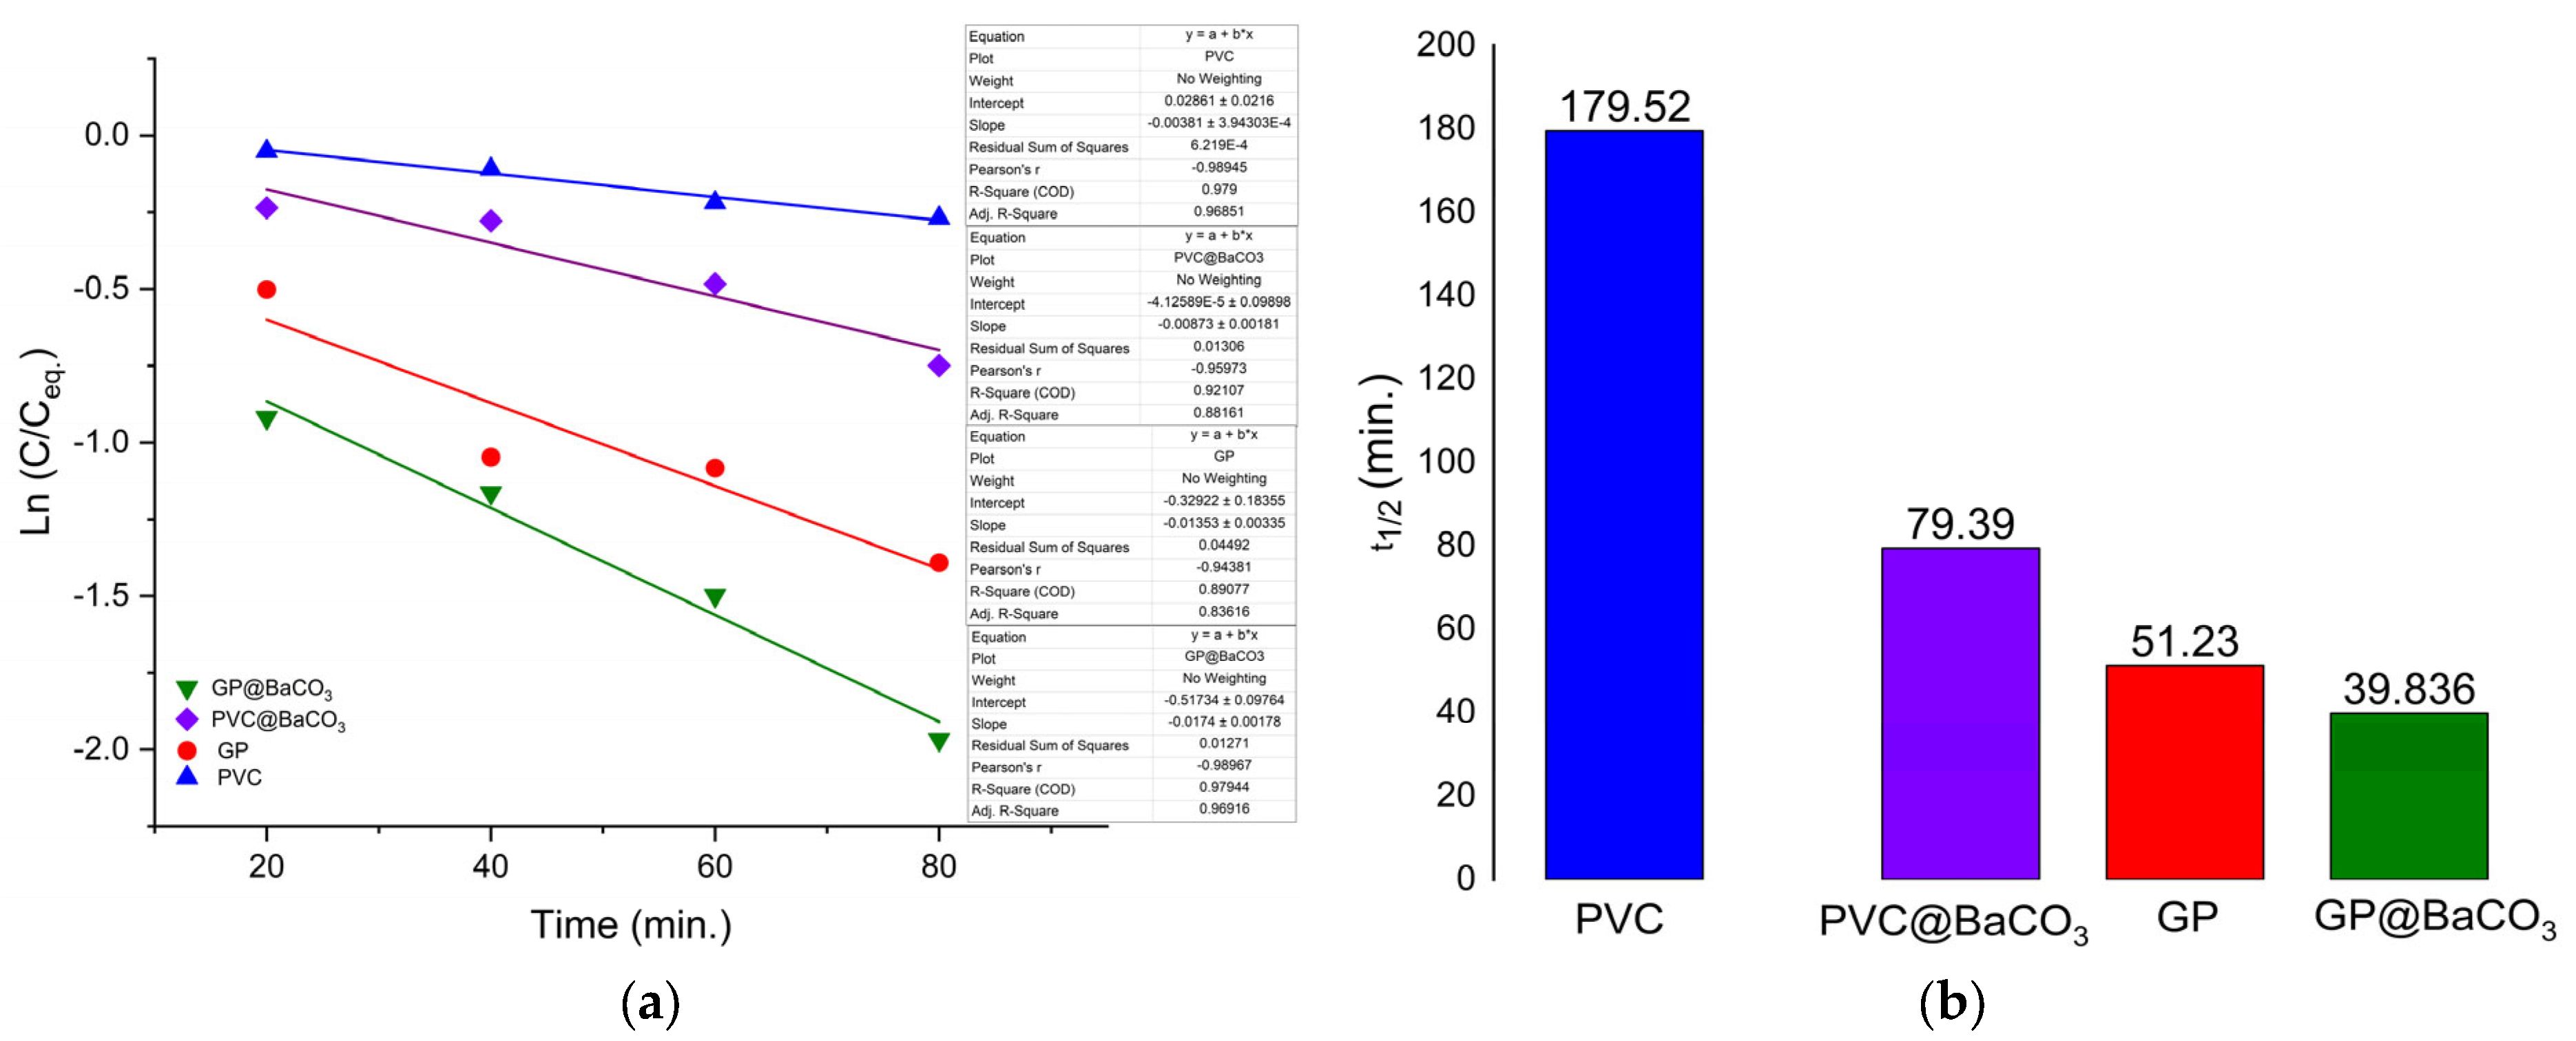
The photocatalytic degradation of MB was further evaluated through kinetic modeling using the pseudo-first-order rate law, as presented in
Figure 11.
The kinetic analysis of MB degradation highlights the significant role of BaCO
3 nanoparticles in accelerating the photocatalytic process (see
Table 3). Without BaCO
3 nanoparticles, the calculated rate constants were k ≈ 1.35 × 10
−2 for GP and k ≈ 3.86 × 10
−3 for PVC, corresponding to a t
1/2 of ≈51 and ≈179 min, respectively. Upon incorporating BaCO
3, the degradation efficiency improved markedly, with k ≈ 1.17 × 10
−2 min
−1 for GP@Nano-BaCO
3 and k ≈ 8.7 × 10
−3 min
−1 for PVC@Nano-BaCO
3, corresponding to shorter half-lives of ≈39 and ≈79 min, as presented in
Table 6.
The results presented help us to conclude that in PVC@Nano-BaCO3, the nanoparticles tend to be less exposed, being partially embedded in a hydrophobic matrix. Thus, the contact between the active surface and MB is reduced, resulting in a lower kinetic constant.
Such kinetic behavior is consistent with literature data on heterogeneous photocatalysis, where dye degradation typically follows pseudo-first-order kinetics [
27].
When benchmarked against related systems reported in the literature, several important observations emerge, as presented in
Table 7.
Compared to other fillers previously incorporated into GP and PVC matrices (e.g., TiO2, Fe2O3, ZnO, or perlite-based systems), BaCO3 presents several distinctive advantages. While other composites often require UV activation and involve multistep syntheses, GP@Nano-BaCO3 and PVC@Nano-BaCO3 reacted under sunlight irradiation using BaCO3 nanoparticles obtained through a simple route using only atmospheric CO2.
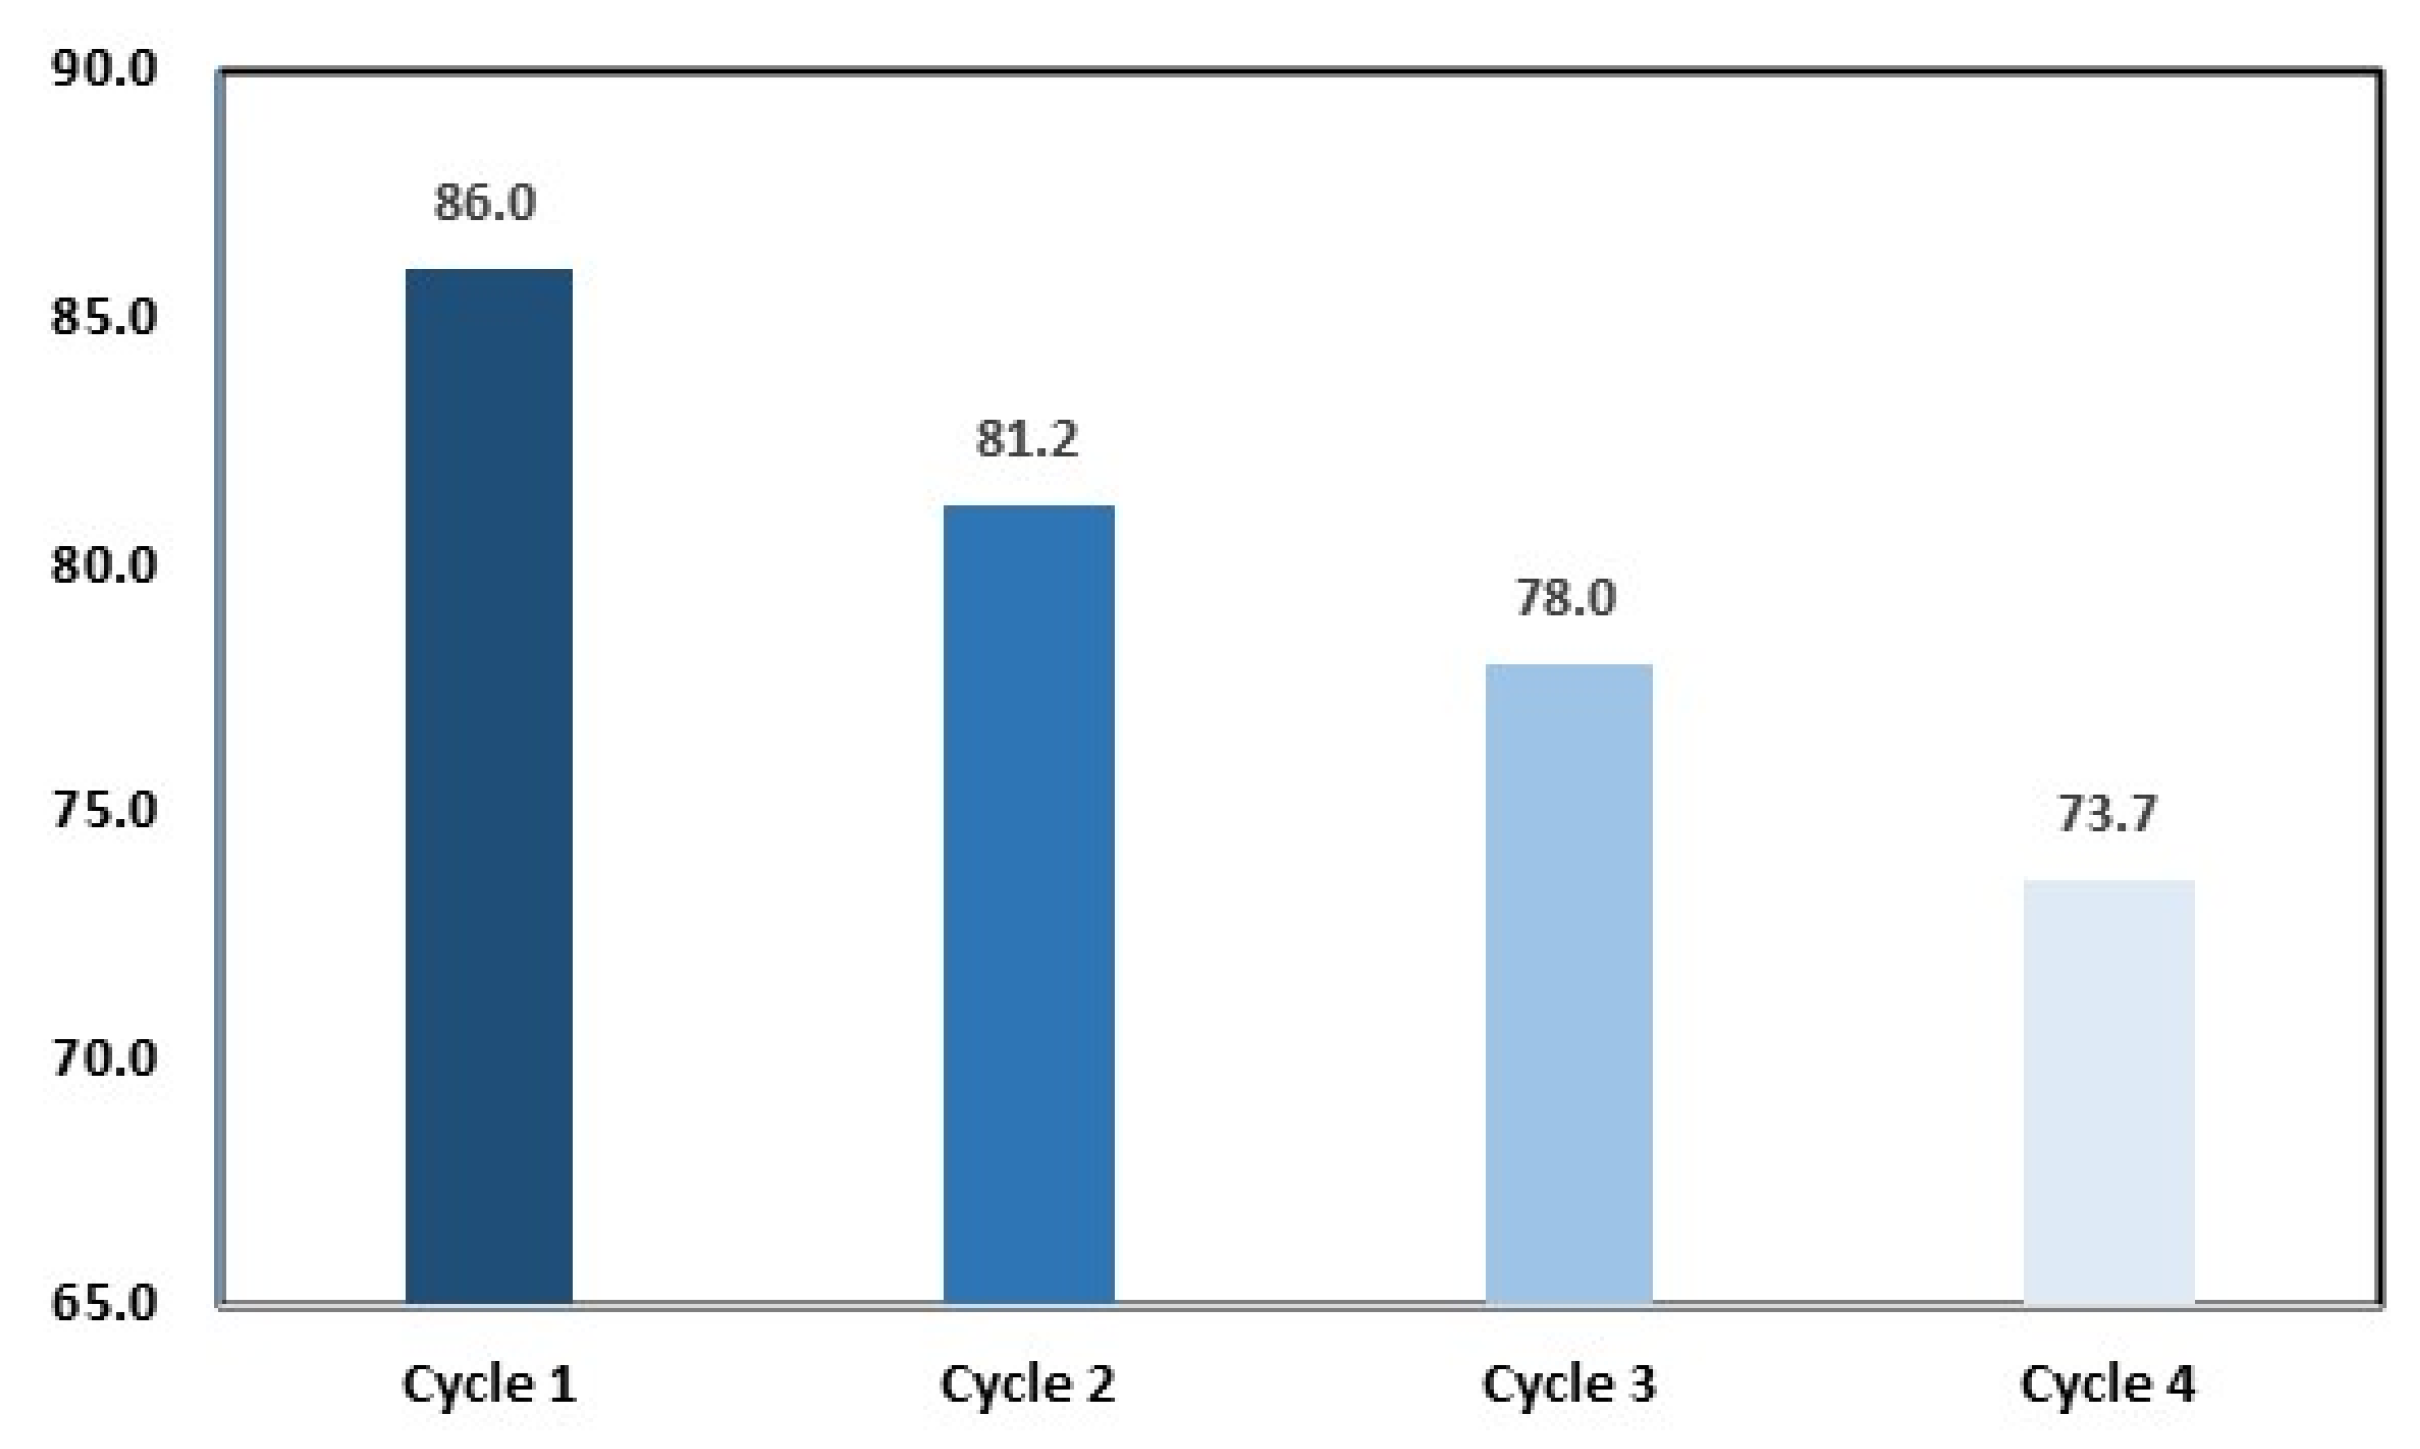
Regarding recycling, the GP@Nano-BaCO3 catalyst was investigated during four cycles.
During the recycling process, the photodegradation resulted in an MB degradation of 86%, 81.2%, 78%, and 73.7, from the first cycle to the fourth, respectively, indicating a slight reduction inefficiency after four cycles, as shown in
Figure 12. This slight decrease can be attributed to the activation of sites on the catalyst surface or phase alteration. To complement this, a BET analysis of GP@BaCO
3 was conducted after four cycles. The specific surface area becomes 21.96 g/cm
3, demonstrating that micropores disappeared and shifted to mesopores, due to MB adsorption onto the catalyst surface during the degradation process.
