Article

Synthesis, Crystal Structure and Optical Properties of Novel 1,10-Phenanthroline Derivatives Containing 2,6-Diisopropylphenoxy Substituents

1
Laboratory of Chemistry of Rare-Earth Elements, Faculty of Chemistry and Pharmacy, Sofia University “St. Kliment Ohridski”, 1164 Sofia, Bulgaria
2
Faculty of Chemistry and Pharmacy, Sofia University “St. Kliment Ohridski”, 1 James Bourchier Blvd., 1164 Sofia, Bulgaria
3
Inorganic Solid State Chemistry, Saarland University, Campus Geb. C4 1, 66123 Saarbrücken, Germany
*
Authors to whom correspondence should be addressed.
Crystals 2025, 15(10), 883; https://doi.org/10.3390/cryst15100883 (registering DOI)
Submission received: 8 September 2025 / Revised: 3 October 2025 / Accepted: 10 October 2025 / Published: 13 October 2025
(This article belongs to the Section Organic Crystalline Materials)

Abstract

Two phenanthroline derivatives, 2-(2,6-diisopropylphenoxy)-9-phenyl-1,10-phenanthroline and 2,9-bis(2,6-diisopropylphenoxy)-1,10-phenanthroline, were synthesized. The unsymmetrical derivative was obtained in high yield through a sequence combining Suzuki coupling and nucleophilic substitution. The crystal structures of both compounds were determined by single-crystal X-ray diffraction and examined by Hirshfeld surface analysis, which outlined the main intermolecular interactions responsible for the packing. The optical properties were studied by UV–Vis absorption and fluorescence spectroscopy in different solvents. The unsymmetrical compound showed stronger intramolecular charge transfer and more pronounced solvatochromism, while the symmetrical analog had a higher fluorescence quantum yield and longer excited-state lifetime. These results demonstrate the role of substitution symmetry in controlling molecular organization and photophysical properties of phenanthroline derivatives, with relevance to sensing and optoelectronic applications.

1. Introduction

1,10-Phenanthroline (phen) is a well-known heteroaromatic framework whose photophysical properties can be finely adjusted through structural modification [1,2].
Over the past two decades, derivatives with extended π-conjugation and donor–acceptor substituents have been designed to strengthen fluorescence, induce intramolecular charge-transfer (ICT) states, and promote solvatochromic responses. Push–pull architectures with phenanthroline as the electron-accepting core and aryl-vinyl donor groups are typical examples, showing intense emission and solvent-dependent shifts [3]. Introducing aromatic substituents such as phenyl, naphthyl, or anthryl strongly perturbs the electronic structure of the parent heterocycle, often reducing the HOMO–LUMO gap and enhancing radiative transitions [4]. In this way, weakly emissive phenanthrolines can be transformed into efficient fluorophores with an ICT character. A recent study on 3,8-diaryl-phenanthrolines demonstrated that larger aromatic units (anthracene, pyrene) favor charge-transfer states and solvent-sensitive fluorescence [4], while broader surveys confirm that conjugation and donor/acceptor substitution are reliable design principles for improving brightness and environmental responsiveness [5]. The symmetry of substitution on the phenanthroline core is another key factor. Symmetrically substituted derivatives often display delocalized excited states, which may reduce transition dipoles or lead to symmetry breaking in polar solvents [6]. In contrast, asymmetric substitution creates a permanent dipole and promotes stronger ICT transitions, resulting in larger solvatochromic shifts [7]. Comparative studies confirm this difference: D–π–A dyes typically show intense solvent-dependent emission and large Stokes shifts, while analogous symmetric A–π–A systems display weaker effects [6]. Nevertheless, direct comparisons between symmetric and asymmetric substitution patterns in solution remain limited, and systematic correlations with experimental photophysical data are scarce. Several phenanthroline derivatives bearing phenyl, phenoxy, or related groups have been reported, with tailored optical responses. Unsymmetric substitution frequently produces pronounced solvent-dependent emission color changes [8,9], while V-shaped 2,9-disubstituted systems have shown solvatochromism in both absorption and emission [10]. Substitution at positions such as 2,9- or 5,6- is known to perturb the π-system and generate measurable shifts, a principle widely exploited in chemosensor design [1]. More recently, Muñoz et al. (2024) showed that enlarging the aromatic substituent (from phenyl to pyrenyl) in 3,8-diaryl-phenanthrolines leads to red-shifted absorption/emission and stronger ICT character [4], consistent with other work on ICT-active phenanthrolines [10]. Beyond solution-phase spectroscopy, single-crystal X-ray diffraction remains indispensable for establishing the precise molecular geometry, packing motifs, and intermolecular interactions that shape the overall behavior of organic luminophores. Hirshfeld surface analysis provides a powerful way to visualize and quantify non-covalent contacts, offering complementary insight into how the solid-state organization stabilizes the crystal lattice and relates to observed photophysical properties [11]. Despite the importance of such analyses, relatively few studies have connected crystallographic packing motifs with solvent-dependent absorption and emission behavior in phenanthroline derivatives. For phenanthroline derivatives in particular, linking molecular structure to both electronic transitions and intermolecular interactions is essential to rationalize and predict their optical response.
Tailored phenanthroline luminophores are highly relevant for applications in organic light-emitting diodes [12], fluorescent sensors [1,6], solvatochromic probes [6] and photonic devices [13,14,15].
In this work, we focus on two closely related phenanthroline derivatives that differ only in substitution symmetry. 2-(2,6-diisopropylphenoxy)-9-phenyl-1,10-phenanthroline (1) carries an unsymmetric substitution pattern (a single phenoxy and a different aryl group), while 2,9-bis(2,6-diisopropylphenoxy)-1,10-phenanthroline (2) is symmetrically disubstituted with two identical phenoxy substituents. Our objective is to clarify how this subtle structural variation governs their structural and photophysical behavior. Specifically, we report the following:
(i)
Single-crystal X-ray diffraction and Hirshfeld surface analysis to determine molecular geometry and intermolecular interactions;
(ii)
UV–Vis absorption spectra in different solvents to assess band energies and molar absorptivities;
(iii)
Fluorescence emission spectra and quantum yields (Φ) to evaluate solvatochromic shifts and efficiencies, complemented by fluorescence lifetimes (τ) to distinguish between radiative and non-radiative decay channels.
By comparing compounds (1) and (2) under identical conditions, this study demonstrates that unsymmetric substitution strengthens ICT transitions and enhances solvatochromism relative to the symmetric analog, while crystallographic analysis reveals the role of packing and non-covalent interactions. This structural variation (one phenoxy versus two phenoxy substituents) influences dipole formation and the nature of the excited states, with the asymmetric derivative favoring intramolecular charge transfer, whereas the symmetric analog shows stronger emission intensity and a longer excited-state lifetime. These results provide a deeper understanding of structure–property relationships in phenanthroline luminophores and guidance for the design of efficient fluorophores for sensing, OLEDs, and photonic applications.

2. Materials and Methods

All reagents were of analytical grade and used without further purification unless stated otherwise.
The solvents used for the spectroscopic measurements were purchased from Sigma-Aldrich (St. Louis, MO, USA) and were of >99.99% purity (HPLC-grade).
Infrared spectra were collected on a Shimadzu IRSpirit-X spectrometer coupled with an ATR attachment (Shimadzu, Tokyo, Japan). UV–Vis spectra were recorded in acetonitrile on a Thermo Scientific Evolution 300 spectrophotometer (Thermo Fisher Scientific, Waltham, MA, USA).
The fluorescence was measured in different solvents by a Varian Cary Eclipse spectrometer (Agilent, Santa Clara, CA, USA) equipped with a 150 W Xe flash lamp as an excitation source. The measurements were performed at room temperature.
The single crystal data set was collected using a Bruker D8 Venture diffractometer with a microfocus sealed tube and a Photon II detector (Bruker, Karlsruhe, Germany). Monochromated MoKa radiation (l = 0.71073 Å) was used. Data were collected at 143(2) K and corrected for absorption effects using the multi-scan method. The structure was solved by direct methods using SHELXT [16] and was refined by full matrix least squares calculations on F2 (SHELXL2018 [17] in the graphical user interface Shelxle [18]).

Synthesis of the 1,10-Phenanthroline Derivates

The starting material for the synthesis of the two novel compounds, 2,9-bis(2,6-diisopropylphenoxy)-1,10-phenanthroline (2) and 2-(2,6-diisopropylphenoxy)-9-phenyl-1,10-phenanthroline (1), is 9-chloro-1-methyl-1,10-phenanthrolin-2(1H)-one (3) [19] (Scheme 1). For the preparation of 2,9-bis(2,6-diisopropylphenoxy)-1,10-phenanthroline (2), 9-chloro-1-methyl-1,10-phenanthrolin-2(1H)-one (3) was treated [19] with an excess of POCl3. The resulting 2,9-dichloro-1,10-phenanthroline (4) was later reacted with 2,6-diisopropylphenol under conditions previously reported in the literature [20,21] for nucleophilic reaction. It should be noted that in contrast with reported procedures [22,23] for the preparation of 2,9-bis-aryloxyphenanthrolines, the substitution of the two chlorine atoms was achieved without applying transition metal catalysts or expensive ligands.
Commonly used strategies for the preparation of 2-aryl-9-chlorophenanthrolines rely on the modification of 2,9-dichlorophenanthroline (4) by Suzuki reaction [24,25,26]. However, this method could lead to the formation of a small quantity of a double-arylated product that could contaminate the target compound. According to our preliminary studies, these complex reaction mixtures are hard to separate due to the relatively high polarity of the phenanthroline derivatives and their similar chromatographic properties. Therefore, for the synthesis of 2-(2,6-diisopropylphenoxy)-9-phenyl-1,10-phenanthroline (1), a fundamentally new approach was applied to the synthesis of unsymmetrical 2,9-disubstituted phenanthrolines. Following this new strategy, the chlorine atom of 9-chloro-1-methyl-1,10-phenanthrolin-2(1H)-one (3) was substituted with a phenyl group using the Suzuki reaction, catalyzed by the stable palladium complex PdCl2(PPh3)2. Subsequently, the arylated product (5) was treated with POCl3, and 2-chloro-9-phenyl-1,10-phenanthroline (6) was obtained in a higher yield compared with the previously reported methods [26], which proves the reasonability of our approach. In order to obtain 2-(2,6-diisopropylphenoxy)-9-phenyl-1,10-phenanthroline (1), 2-chloro-9-phenyl-1,10-phenanthroline (6) was treated with 2,6-diisopropylphenol under the nucleophilic conditions described.
The reactions were monitored by TLC on silica gel 60 F254. 1H and 13C NMR spectra were recorded on a Bruker AVNEO 400 spectrometer (at 400 MHz for 1H and 100.6 MHz for 13C, respectively). Chemical shifts are given in ppm. Melting points were determined on an SRS MPA120 EZ-Melt apparatus.
Phenylboronic acid was purchased from Acros Organics, 2,6-diisopropylphenol was purchased from ThermoScientific, and all other organic reagents and solvents were purchased from local suppliers and used as received.
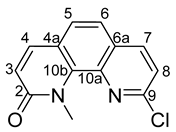
  • 9-chloro-1-methyl-1,10-phenanthrolin-2(1H)-one (3)
Crystals 15 00883 i001
This was prepared from 35.830 g (10.51 mmol) 9-chloro-1-methyl-1,10-phenanthrolinium methylsulfate as described [19] in 94% yield (24.306 g).
1H NMR (500 MHz, CDCl3) δ 8.13 (d, J = 8.5 Hz, 1H, H4-phen), 7.77 (d, J = 9.3 Hz, 1H, H7-phen), 7.61 (d, J = 8.4 Hz, 1H, H6-phen), 7.56 (d, J = 8.4 Hz, 1H, H5-phen), 7.48 (d, J = 8.5 Hz, 1H, H3-phen), 6.92 (d, J = 9.3 Hz, 1H, H8-phen), 4.42 (s, 3H, N-CH3). 13C NMR (126 MHz, CDCl3) δ 163.85 (s, C2-phen), 147.29 (s, C9-phen), 139.03 (s, C4-phen), 138.93 (s, 4C10b-phen), 138.81 (s, C7-phen), 136.97 (s, 4C10a-phen), 128.83 (s, 4C6a-phen), 127.29 (s, C6-phen), 123.18 (s, C8-phen), 123.05 (s, C3-phen), 121.80 (s, C5-phen), 121.26 (s, 4C4a-phen), 37.26 (s, N-CH3). Rf TLC 0.60 (silica, ethyl acetate). m.p. 145.3–151.1 °C.
  • 2,9-dichloro-1,10-phenanthroline (4)
Crystals 15 00883 i002
This was prepared from 4.005 g, (16.37 mmol) 9-chloro-1-methyl-1,10-phenanthrolin-2(1H)-one (3) as described [19] in 88% yield (3.306 g).
1H NMR (500 MHz, CDCl3) δ 8.21 (d, J = 8.4 Hz, 2H, H4, H7-phen), 7.83 (s, 2H, H5, H6-phen), 7.65 (d, J = 8.4 Hz, 2H, H3, H8-phen). 13C NMR (126 MHz, CDCl3) δ 152.00 (s, C2, C9-phen), 144.95 (s, 4C10a, 4C10b-phen), 138.75 (s, C4, C7-phen), 127.72 (s, 4C4a, 4C6a-phen), 126.24 (s, C5, C6-phen), 124.92 (s, C3, C8-phen). Rf TLC 0.75 (neutral Al2O3, hexanes–dichloromethane = 3:4), 0.56 (silica, hexanes–ethylacetate = 2:1). m.p. 230.0–235.6 °C.
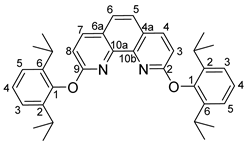
  • 2,9-bis(2,6-diisopropylphenoxy)-1,10-phenanthroline (2)
Crystals 15 00883 i003
In a round bottom Schlenk flask, 2,9-dichloro-1,10-phenanthroline (4) (0.300 g, 1.3 mmol), 2,6-diisopropylphenol (0.655 g, 3.674 mmol) and anhydrous K2CO3 (0.996 g, 7.207 mmol) were suspended in N-methyl-2-pyrrolidone (NMP) (4.8 mL) at room temperature. The vessel was purged with argon, and the mixture was stirred and heated at 160 °C for 24 h. NMP was removed under reduced pressure, and the residue was dissolved in 300 mL ethyl acetate. The resulting solution was transferred to a separatory funnel, washed with water (3 × 40 mL), and dried with anhydrous Na2SO4. After filtration, the solvent was removed under reduced pressure, and the crude dark brown solid product (1.040 g) was purified by flash column chromatography (16 g silica, eluting with hexanes/dichloromethane and then pure dichloromethane). The yield was 0.556 g (87%) of yellow crystals.
1H NMR (500 MHz, CDCl3) δ 8.11 (d, J = 8.7 Hz, 2H, H4, H7-phen), 7.61 (s, 2H, H5, H6-phen), 7.27 (dd, J = 13.8, 6.1 Hz, 2H, H4-2- and 9-(2,6-diisopropylphenoxy)), 7.13 (d, J = 7.6 Hz, 4H, H3, H5-2- and 9-(2,6-diisopropylphenoxy)), 7.01 (d, J = 8.3 Hz, 2H, H3, H8-phen), 3.04 (hept, J = 6.6 Hz, 4H, CH-iPr), 1.02 (d, J = 6.5 Hz, 24H, CH3-iPr). 13C NMR (126 MHz, CDCl3) δ 162.64 (s, C2, C9-phen), 147.58 (s, 4C10a, 4C10b-phen), 144.29 (s,4C1-2- and 9-(2,6-diisopropylphenoxy)), 141.24 (s, 4C4a, 4C6a-phen), 139.56 (s, C4, C7-phen), 125.86 (s, C2,C6-2- and 9-(2,6-diisopropylphenoxy)), 125.81 (s, C4-2- and 9-(2,6-diisopropylphenoxy)), 124.42 (s, C3, C5-2- and 9-(2,6-diisopropylphenoxy)), 123.78 (s, C5, C6-phen), 111.42 (s, C3, C8-phen), 27.19 (s, 4C, CH-iPr), 23.43 (s, 8C, CH3-iPr). Rf TLC 0.57 (silica, hexanes–ethyl acetate = 20:1). m.p. 172.8–189.7 °C. Anal. calcd. %, C, 81.17; H, 7.57; N, 5.26; O, 6.01, found % C, 81.15; H, 7.65; N, 5.22; O, 6.06.
  • 1-methyl-9-phenyl-1,10-phenanthrolin-2(1H)-one (5)
Crystals 15 00883 i004
In a round-bottom Schlenk flask, to 9-chloro-1-methyl-1,10-phenanthrolin-2(1H)-one (3) (0.979 g, 4.0 mmol), phenylboronic acid (0.585 g, 4.8 mmol), Na2CO3·10H2O (4.578 g, 16 mmol) and PdCl2(PPh3)2 (86.8 mg, 123.7 μmol, 3 mol%), we added H2O (8.0 mL), ethanol (4.0 mL) and toluene (8.0 mL). The system was purged with argon and stirred at 80 °C for 18 h. After cooling to room temperature, the reaction mixture was transferred to a separatory funnel, and the product was extracted with CHCl3 (8 × 20 mL). The combined organic layers were dried with MgSO4 and, after filtration, the solvent was removed under reduced pressure. The residual pale-yellow crude product (1.278 g) was purified by flash column chromatography (26 g silica, eluting with hexanes, dichloromethane and ethyl acetate). The yield was 1.208 g of pale-yellow crystals, which were recrystallized from ethyl acetate (40 mL). The final step led to the formation of 1.035 g (91%) pale-yellow needles.
Important Note: No matter whether silica or alumina is used, the starting compound, 9-chloro-1-methyl-1,10-phenanthrolin-2(1H)-one, and the product, 1-methyl-9-phenyl-1,10-phenanthrolin-2(1H)-one, are chromatographically indistinguishable on TLC.
1H NMR (500 MHz, CDCl3) δ 8.24 (d, J = 8.6 Hz, 1H, H7-phen), 8.17 (dt, J = 7.3, 1.4 Hz, 2H, H2, H6–9–phenyl), 8.00 (d, J = 8.6 Hz, 1H, H8-phen), 7.79 (d, J = 9.3 Hz, 1H, H4-phen), 7.58–7.53 (m, 4H, H5-phen, H6-phen, H3, H5–9–phenyl), 7.52–7.47 (m, 1H, H4–9–phenyl), 6.92 (d, J = 9.3 Hz, 1H, H3-phen), 4.60 (s, 3H, CH3–N). 13C NMR (126 MHz, CDCl3) δ 164.26 (s, C2-phen), 154.60 (s, 4C9-phen), 139.95 (s, 4C10b-phen), 139.20 (s, C4-phen), 139.17 (s, 4C10a-phen), 138.05 (s, 4C1–9–phenyl), 137.17 (s, C7-phen), 129.62 (s, C4–9–phenyl), 129.03 (s, C3, C5–9–phenyl), 127.32 (s, C2, C6–9–phenyl), 126.54 (s, C5-phen), 122.28 (s, C3-phen), 122.12 (s, C6-phen), 120.85 (s, 4C4a-phen, 4C6a-phen), 119.19 (s, C8-phen), 38.39 (s, CH3–N). Rf TLC 0.32 (neutral Al2O3/DCM), 0.45 (silica, ethyl acetate). m.p. 183.5–184.5 °C. Anal. calcd. %, C, 79.70; H, 4.93; N, 9.78; O, 5.59, found %, C, 79.76; H, 4.84; N, 9.80; O, 5.66.
  • 2-chloro-9-phenyl-1,10-phenanthroline (6)
Crystals 15 00883 i005
In a round-bottom flask, equipped with a reflux condenser with a bubbler, we suspended 1-methyl-9-phenyl-1,10-phenanthrolin-2(1H)-one (5) (0.953 g, 3.328 mmol) and POCl3 (8.225 g, 53.65 mmol, 5 mL). The mixture was refluxed with stirring for 9.5 h. The excess POCl3 was removed under reduced pressure, and the resulting dark oil was cooled to room temperature. To the flask, we added 10 mL water and 25% aqueous NH3 to pH = 9. The crude product was extracted with CHCl3 (8 × 25 mL), and the combined organic layers were dried with Na2SO4. The solution was filtered, and the solvent was evaporated under reduced pressure, leaving dark viscous oil (1.128 g), which was purified by flash column chromatography (20 g silica, gradient elution with hexanes/ethyl acetate). The yield was 0.894 g (92%) pale-yellow crystals.
1H NMR (500 MHz, CDCl3) δ 8.37 (dt, J = 8.1, 0.9 Hz, 2H, H2, H6–9–phenyl), 8.29 (d, J = 8.4 Hz, 1H, H7-phen), 8.18 (d, J = 8.4 Hz, 1H, H4-phen), 8.12 (d, J = 8.4 Hz, 1H, H8-phen), 7.81 (d, J = 8.7 Hz, 1H, H5-phen), 7.74 (d, J = 8.7 Hz, 1H, H6-phen), 7.61 (d, J = 8.3 Hz, 1H, H3-phen), 7.58–7.53 (m, 2H, H3, H5–9–phenyl), 7.48 (tt, J = 3.1, 1.6 Hz, 1H, H4–9–phenyl). 13C NMR (126 MHz, CDCl3) δ 157.62 (s, C9-phen), 151.47 (s, C2-phen), 146.28 (s, 4C10a-phen), 144.95 (s, 4C10b-phen), 139.21 (s, 4C1–9–phenyl), 138.75 (s, C4-phen), 136.90 (s, C7-phen), 129.64 (s, 4C4–9–phenyl), 128.85 (s, 2C, 4C3, 4C5–9–phenyl), 127.91 (s, 2C, 4C2, 4C6–9–phenyl), 127.68 (s, 2C, 4C4a, 4C6a-phen), 126.78 (s, C5-phen), 125.40 (s, C6-phen), 124.22 (s, C3-phen), 120.77 (s, C8-phen). Rf TLC 0.64 (silica, hexanes–ethyl acetate =1:1). m.p. 143.0–144.0 °C.
  • 2-(2,6-diisopropylphenoxy)-9-phenyl-1,10-phenanthroline (1)
Crystals 15 00883 i006
In a round-bottom Schlenk flask, 2-chloro-9-phenyl-1,10-phenanthroline (6) (0.300 g, 1.032 mmol), 2,6-diisopropylphenol (0.308 g, 1.728 mmol), anhydrous K2CO3 (0.428 g, 3.097 mmol) and N-methyl-2-pyrrolidone (NMP) (4.8 mL) were mixed. The vessel was purged with argon and stirred at 160 °C for 22 h. The solvent was removed under reduced pressure, and the solid residue was dissolved in 70 mL dichloromethane. The thus-obtained solution was transferred to a separatory funnel, and it was washed with clean water (3 × 20 mL). After drying with anhydrous Na2SO4, the solvent was removed under reduced pressure, leaving a brown solid (0.545 g). The crude product was purified by flash column chromatography (15 g silica, hexanes–cyclohexane–ethyl acetate = 20:20:1). The yield was 0.0.325 g (73%) pale-yellow crystals.
1H NMR (500 MHz, CDCl3) δ 8.23 (d, J = 7.4 Hz, 2H, H2, H6–9–phenyl), 8.15 (d, J = 8.4 Hz, 1H, H7-phen), 8.07 (d, J = 8.7 Hz, 1H, H4-phen), 7.99 (d, J = 8.4 Hz, 1H, H8-phen), 7.63 (d, J = 8.7 Hz, 1H, H5-phen), 7.58 (d, J = 8.6 Hz, 1H, H6-phen), 7.43 (t, J = 7.5 Hz, 2H, H3, H5–9–phenyl), 7.37 (t, J = 7.2 Hz, 1H, H4–9–phenyl), 7.27 (dd, J = 8.5, 6.6 Hz, 1H, H4-2-(2,6-diisopropylphenoxy)), 7.22 (dd, J = 23.2, 16.1 Hz, 2H, H3, H5-2-(2,6-diisopropylphenoxy)), 6.93 (d, J = 8.6 Hz, 1H, H3-phen), 3.13 (hept, 2H, CH-iPr), 1.07 (d, J = 6.9 Hz, 12H, CH3-iPr). 13C NMR (126 MHz, CDCl3) δ 163.09 (s, C2-phen), 156.10 (s, 4C1-2,6-diisopropylphenoxy), 147.99 (s, 4C10b-phen), 145.47 (s, C9-phen), 145.13 (s, 4C10a-phen), 141.80 (s, 2C, 4C2,4C6-2,6-diisopropylphenoxy), 139.60 (s, C4-phen), 139.22 (s, 4C1–phenyl), 136.53 (s, C7-phen), 129.31 (s, C4–phenyl), 128.62 (s, C3, C5–phenyl), 128.02 (s, 4C6a-phen), 127.68 (s, C2, C6–phenyl), 125.97 (s, C4-phen), 125.61 (s, C5-phen), 125.39 (s, 4C4a-phen), 124.29 (s, C3, C5-2,6-diisopropylphenoxy), 123.93 (s, C6-phen), 119.51 (s, C8-phen), 110.66 (s, C3-phen), 27.16 (s, CH-iPr), 23.57 (s, CH3-iPr). Rf TLC 0.75 (silica, hexanes: ethyl acetate = 3:1). m.p. 199.7–201.4 °C. Anal. calcd. %, C, 81.17; H, 7.57; N, 5.26; O, 6.01, found %, C, 81.22; H, 7.53; N, 5.30; O, 5.98.

3. Results and Discussion

3.1. Crystal Structure

Crystals suitable for single-crystal diffraction from both compounds were obtained by the slow evaporation of acetonitrile solutions. The experimental details of the single-crystal diffraction measurements. as well as the corresponding CCDC deposition numbers, are summarized in Table 1. These data can be obtained free of charge via https://www.ccdc.cam.ac.uk/structures/ (accessed on 8 July 2025) (or from the Cambridge Crystallographic Data Centre, 12, Union Road, Cambridge CB2 1EZ, UK; fax: +44-1223-336033).
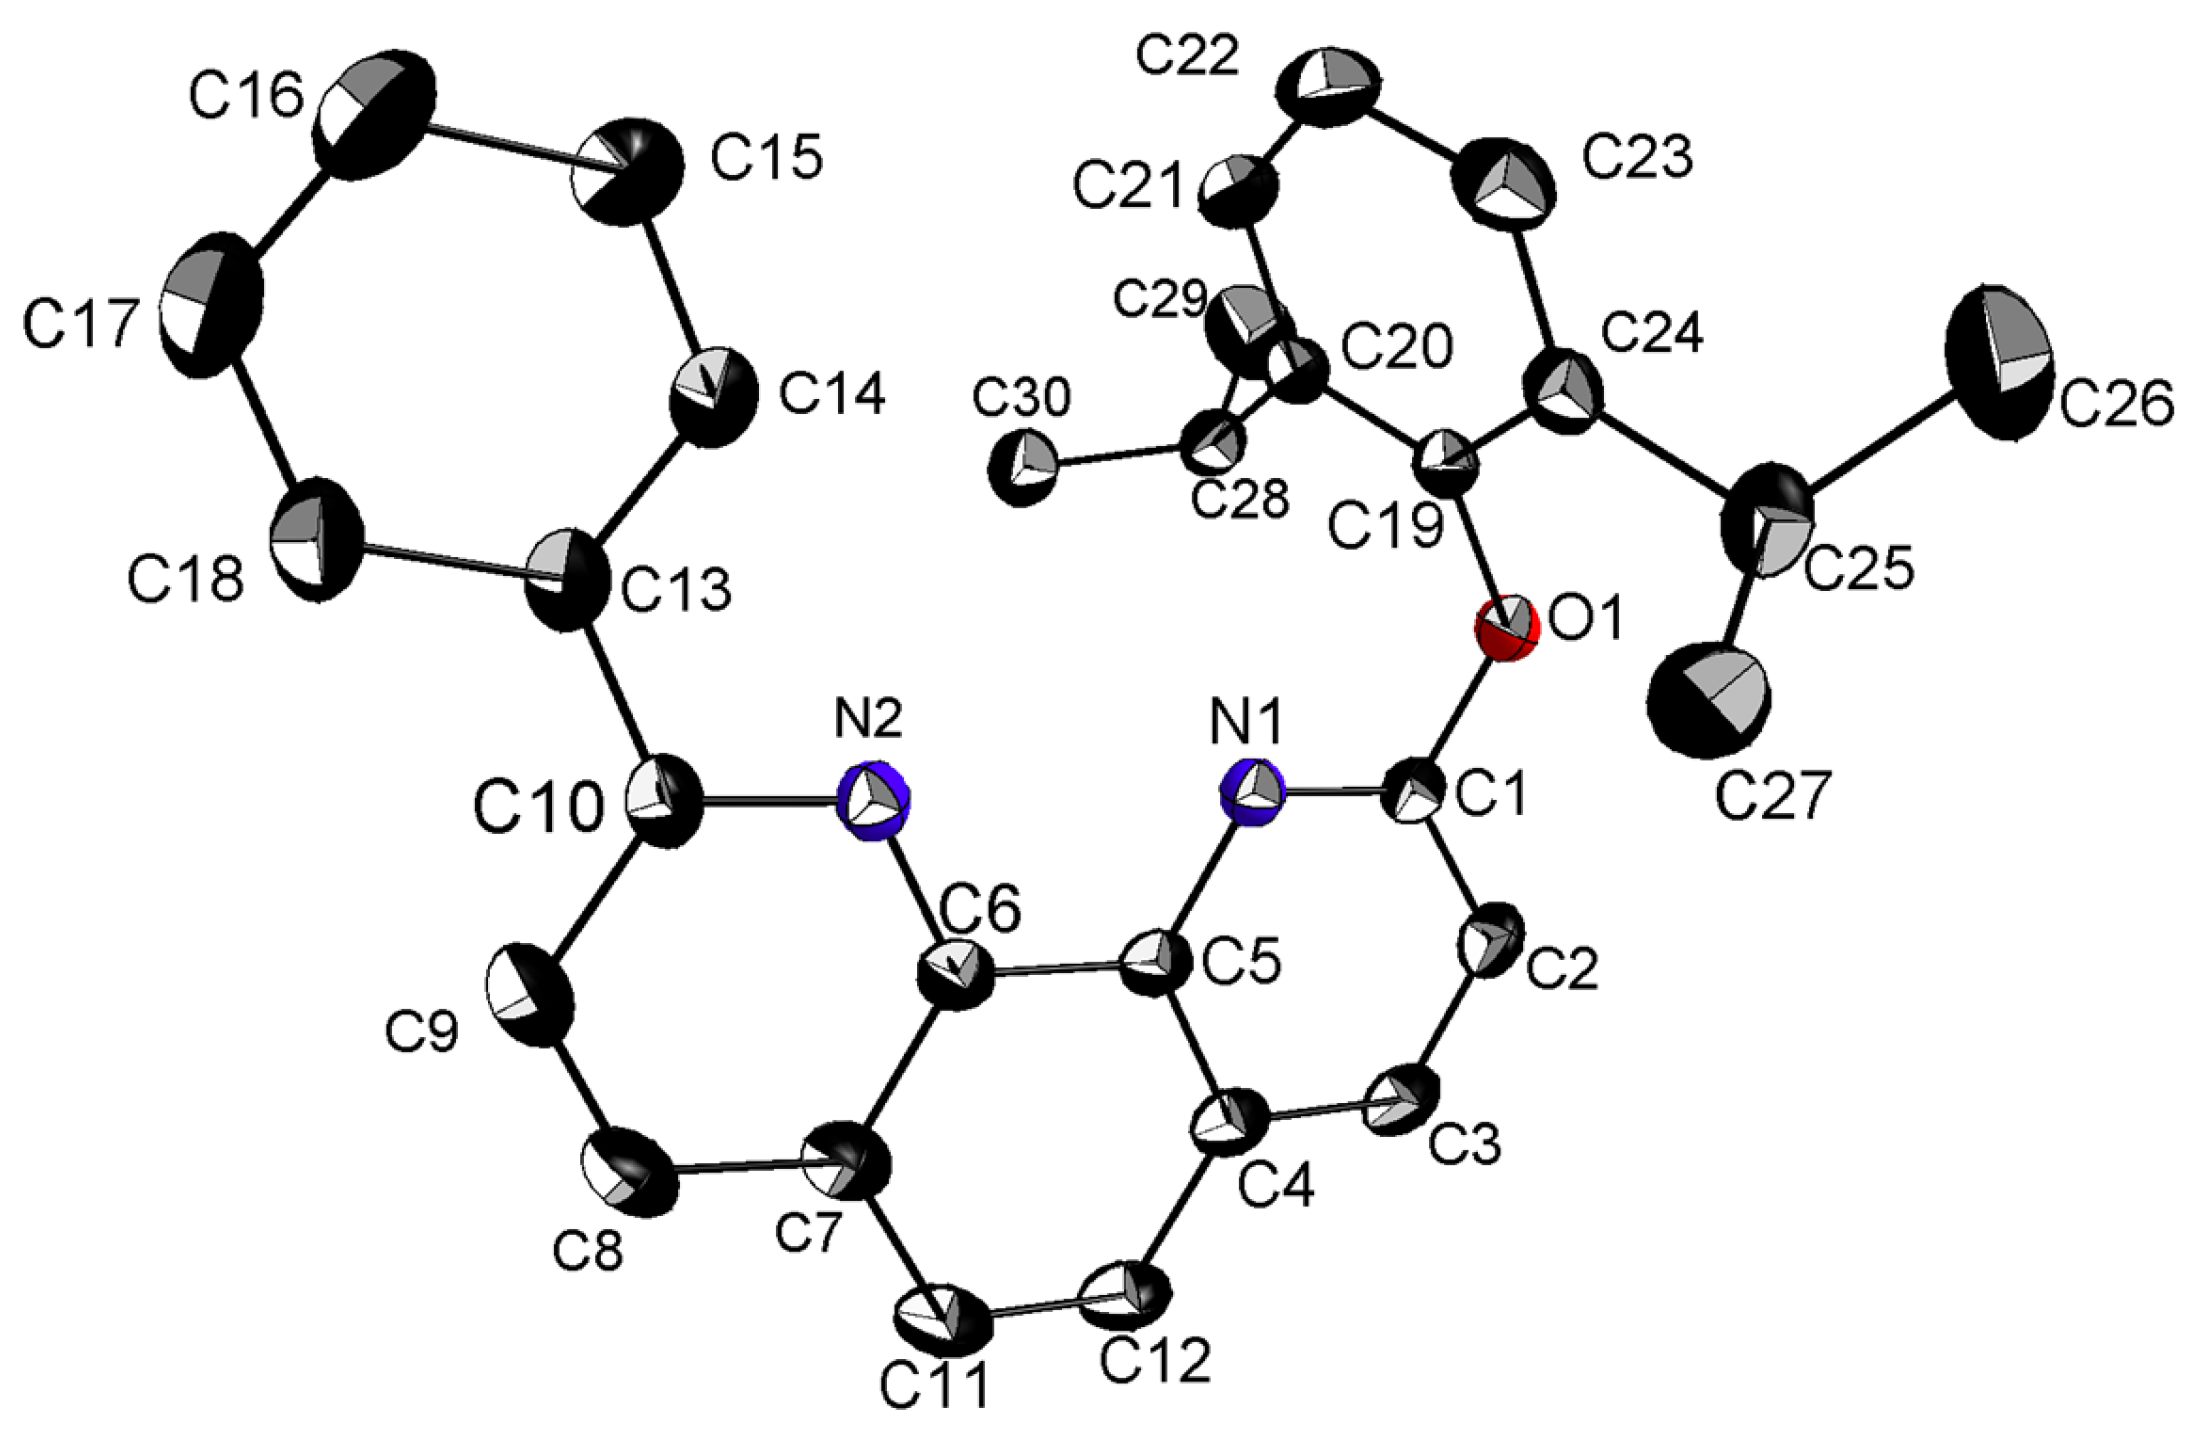
Compound 1 crystallizes in the triclinic P 1 ¯ space group with the asymmetric unit containing one molecule of the 2-(2,6-diisopropylphenoxy)-9-phenyl-1,10-phenanthroline (Figure 1) with two molecules in the unit cell (Figure S13). All chemical bonds are within the expected range. The 1,10-phenanthroline system, 2,6-diisopropylphenoxy- and the phenyl rings are independently planar but are not planar to each other. The torsion angle C9–C10–C13–C18 (between the 1,10-phenanthroline and the phenyl rings) is −2.722(239)°, while the angle between the 1,10-phenanthroline and the 2,6-diisopropylphenoxy (C2–C1–O1–C19) is −171.573(123)°.
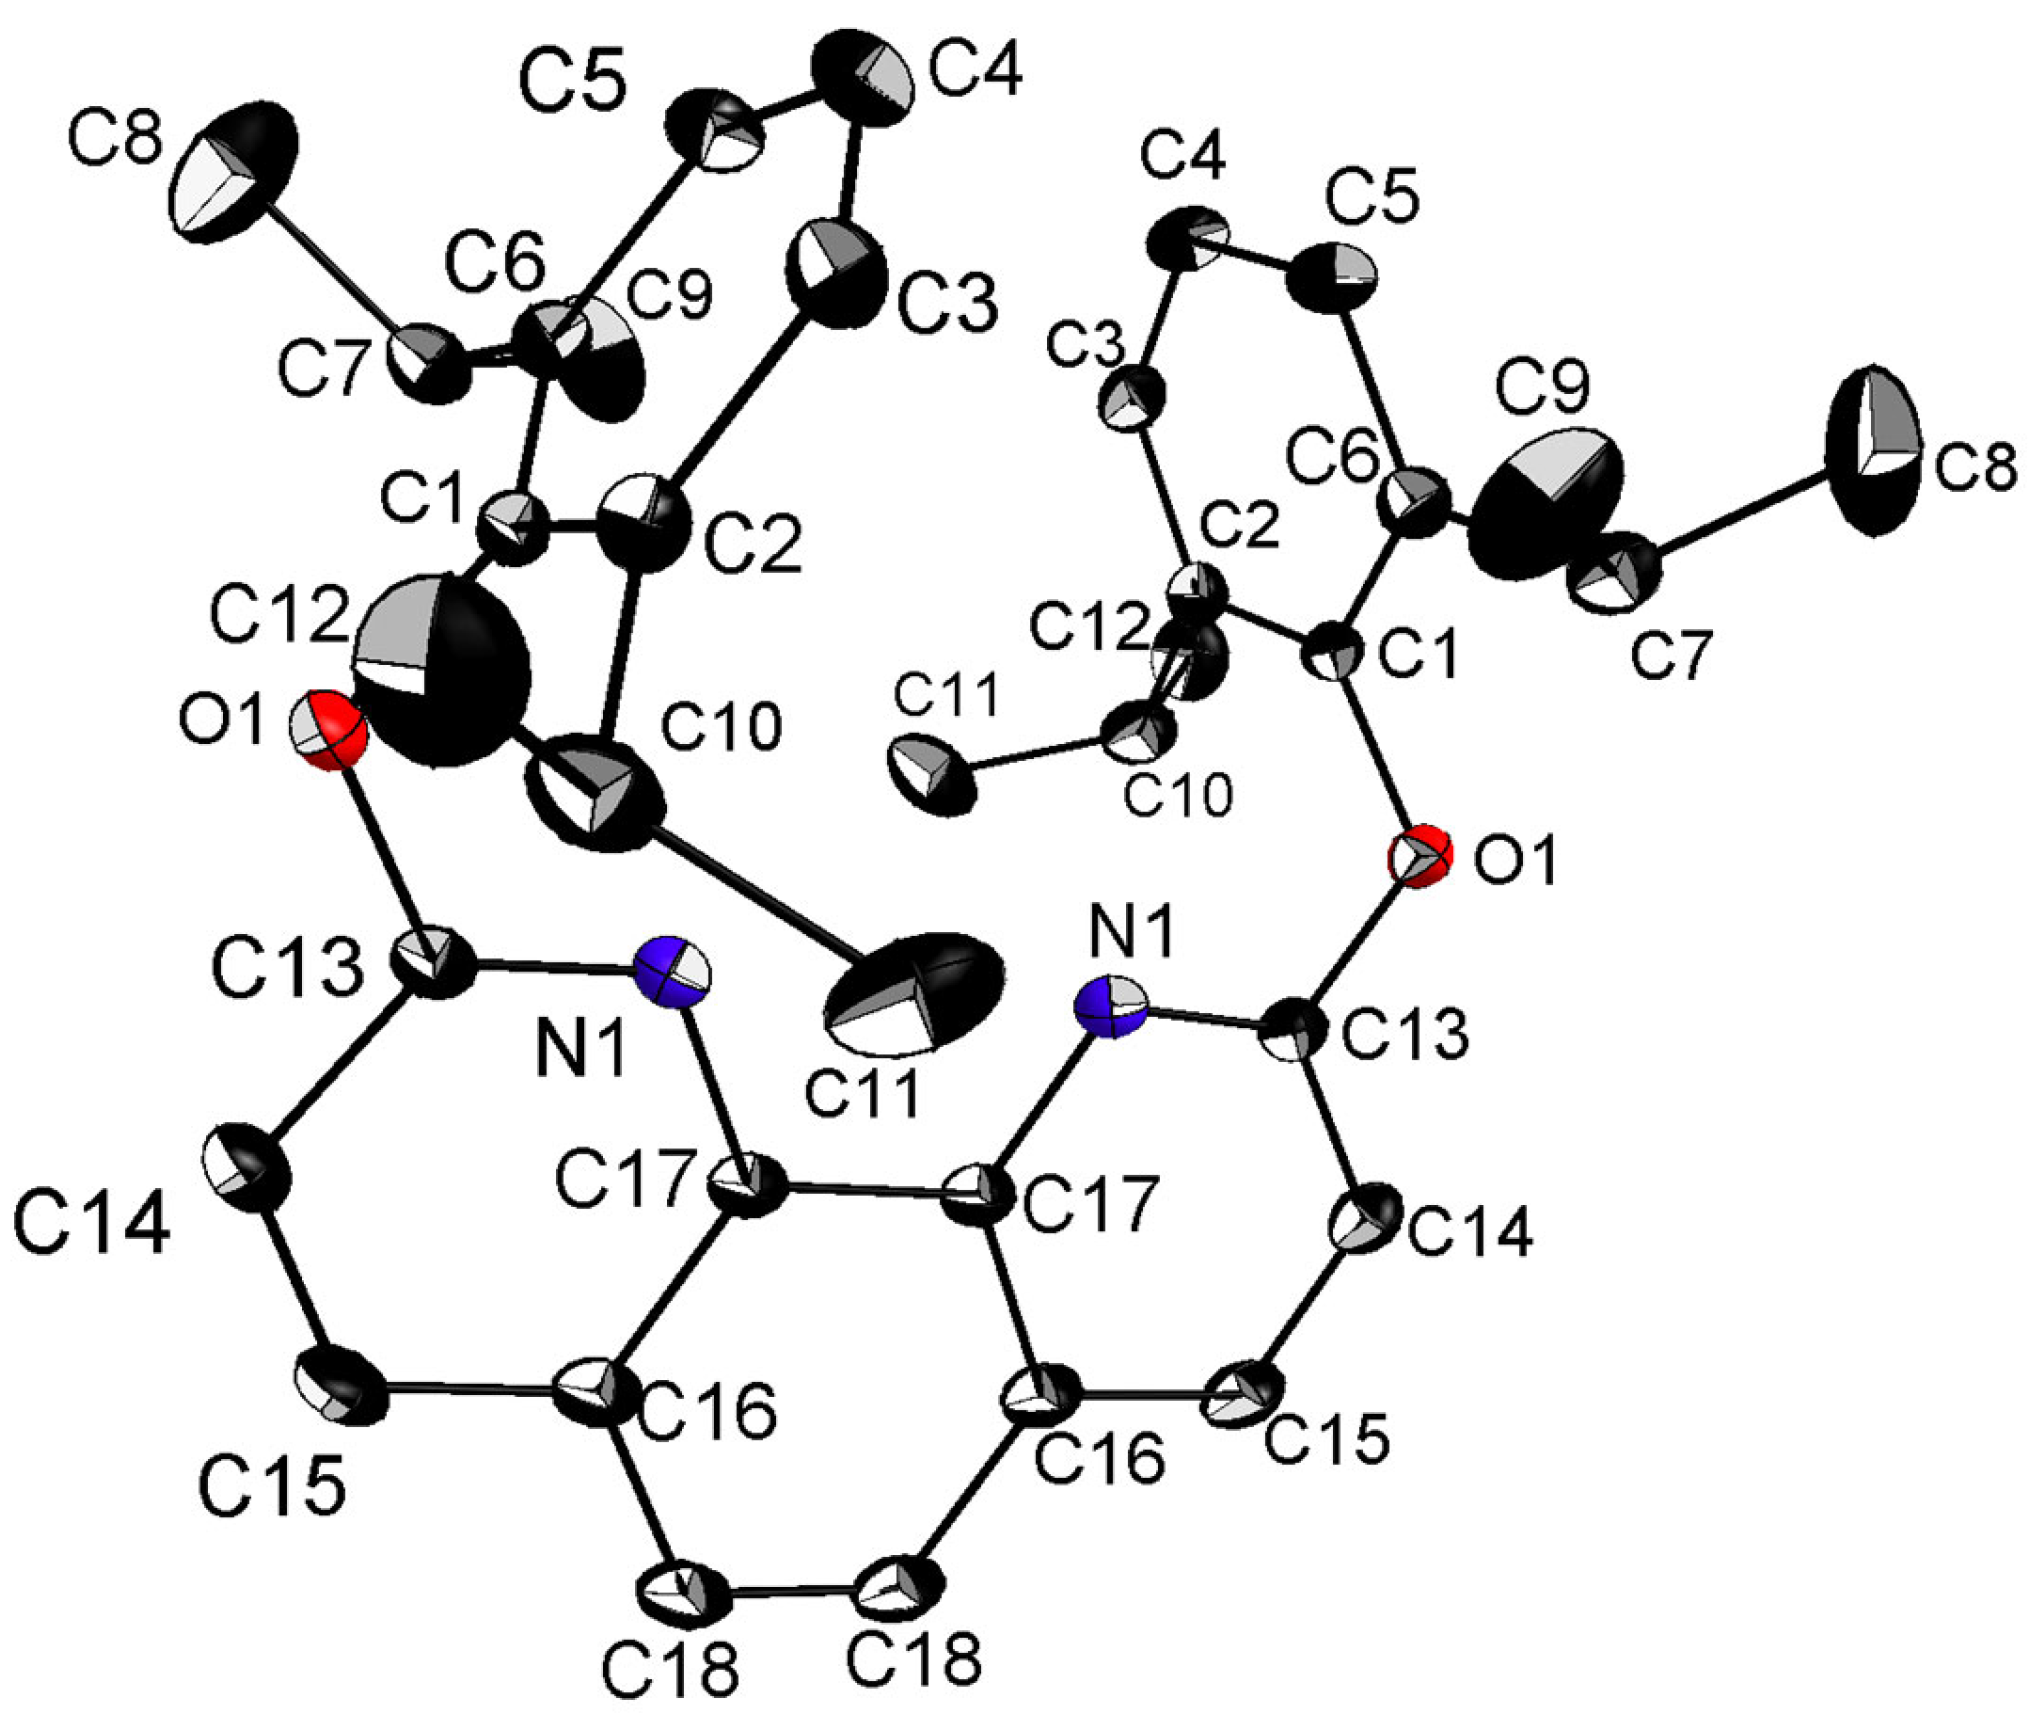
Compound 2, despite being a larger molecule (Figure 2), crystallizes in a higher space group, namely, the monoclinic C2/c. The asymmetric unit consists of half a molecule, and the whole molecule is generated by two-fold axis rotation symmetry going through the C17–C18 ring of the 1,10-phenanthroline entity. The unit cell contains four 2,9-bis(2,6-diisopropylphenoxy)-1,10-phenanthroline molecules (crystal packing is shown in Figure S13). The two 2,6-diisopropylphenoxy moieties are folded through the oxygen atom (C1–O1–C13 angle of 117.74(8)°) in a coronal-like manner. The presence of the additional isopropyl substituents on the phenoxy ring leads to significant rotation of the 2,6-diisopropylphenoxy moiety due to sterically hindering, which leads to more symmetric molecules. The difference in the molecular symmetry can significantly alter the electronic properties of both molecules despite not having a strong electron donor or acceptor substituents, which has already been observed for other organic molecules [28].

3.2. Hirshfield Surface Analysis

The quantification of the intermolecular interactions was achieved by generating the Hirshfeld surface and the two-dimensional finger plots using CrystalExplorer software (version 25.09) [29].
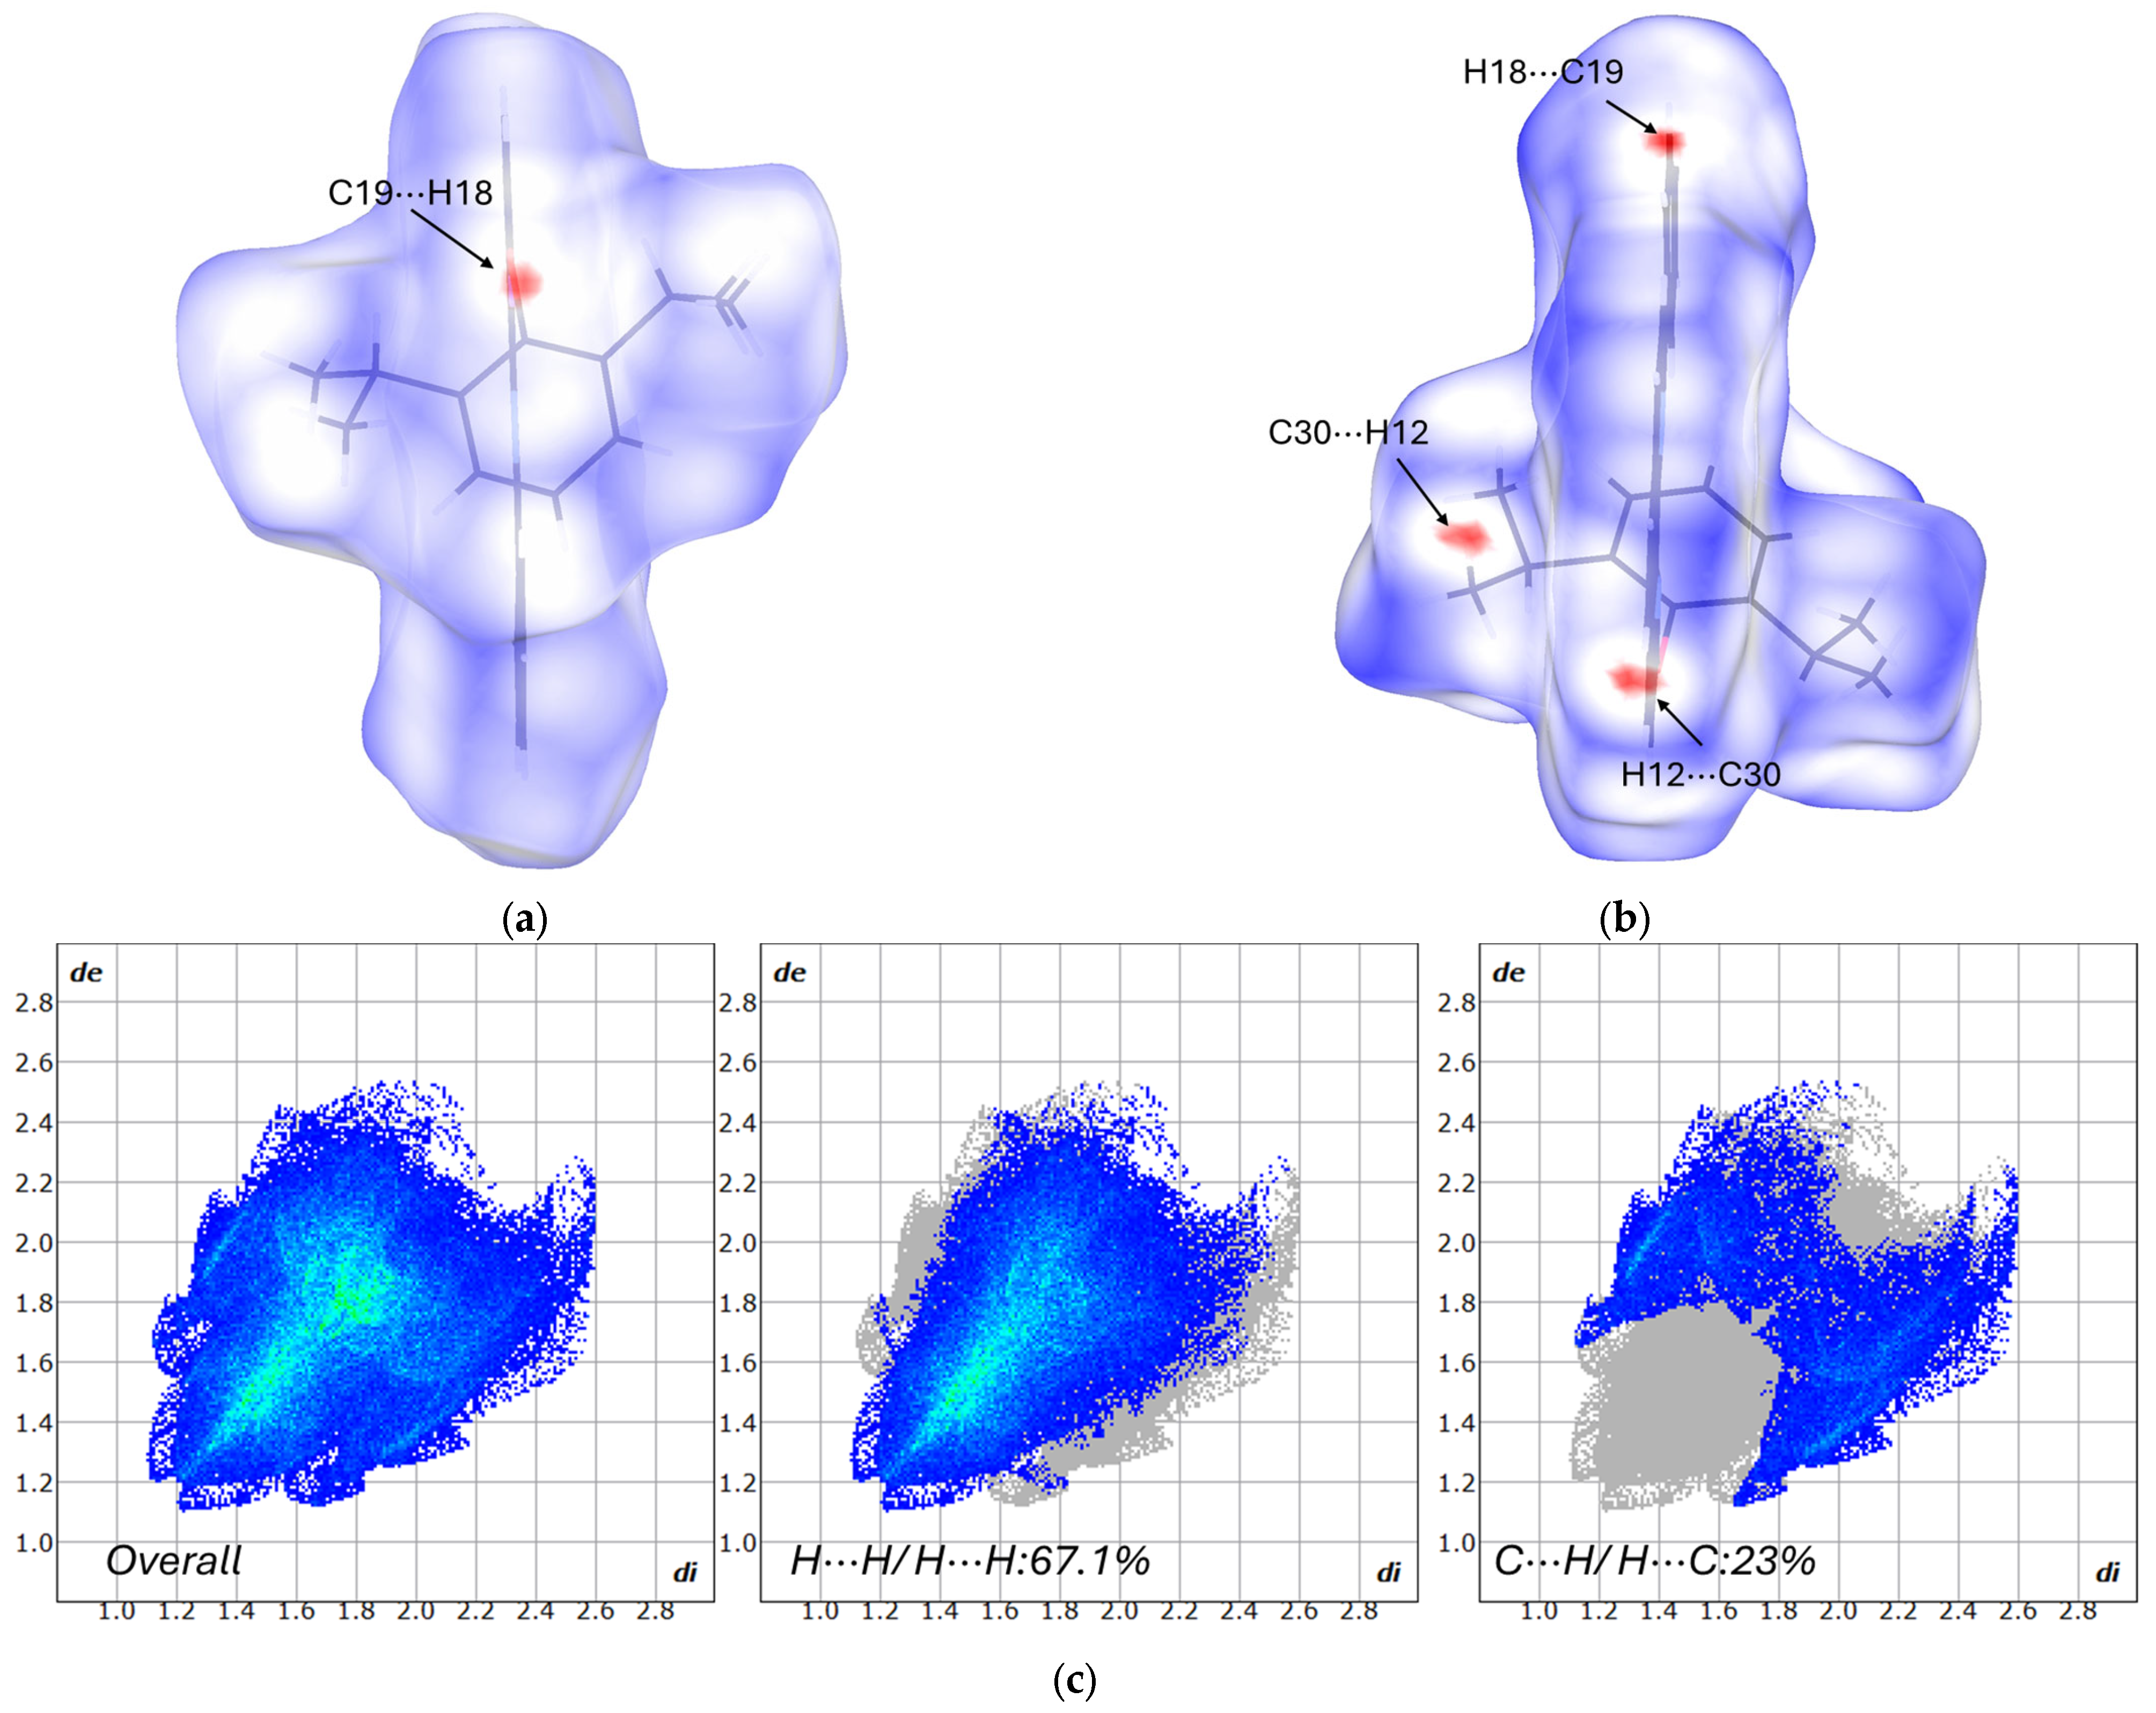
The Hirshfeld surface mapped over dnorm in the range −0.0823 to 1.4205 a.u. and the two-dimensional finger plots of compound 1 are shown in Figure 3. The red spots indicate contacts shorter than the vdW radius, the blue shows interactions longer than the vdW radius, and the white spots are approximately equal to the vdW radius distance. The most significant contribution to packing behavior in (1) comes from H⋯H interactions, at 67.1%, followed by the C⋯H interactions, with 23%. The third most common interaction is C⋯C, which contributes 5.5%, while N⋯H and O⋯H contribute 2% and 2.2%, respectively.
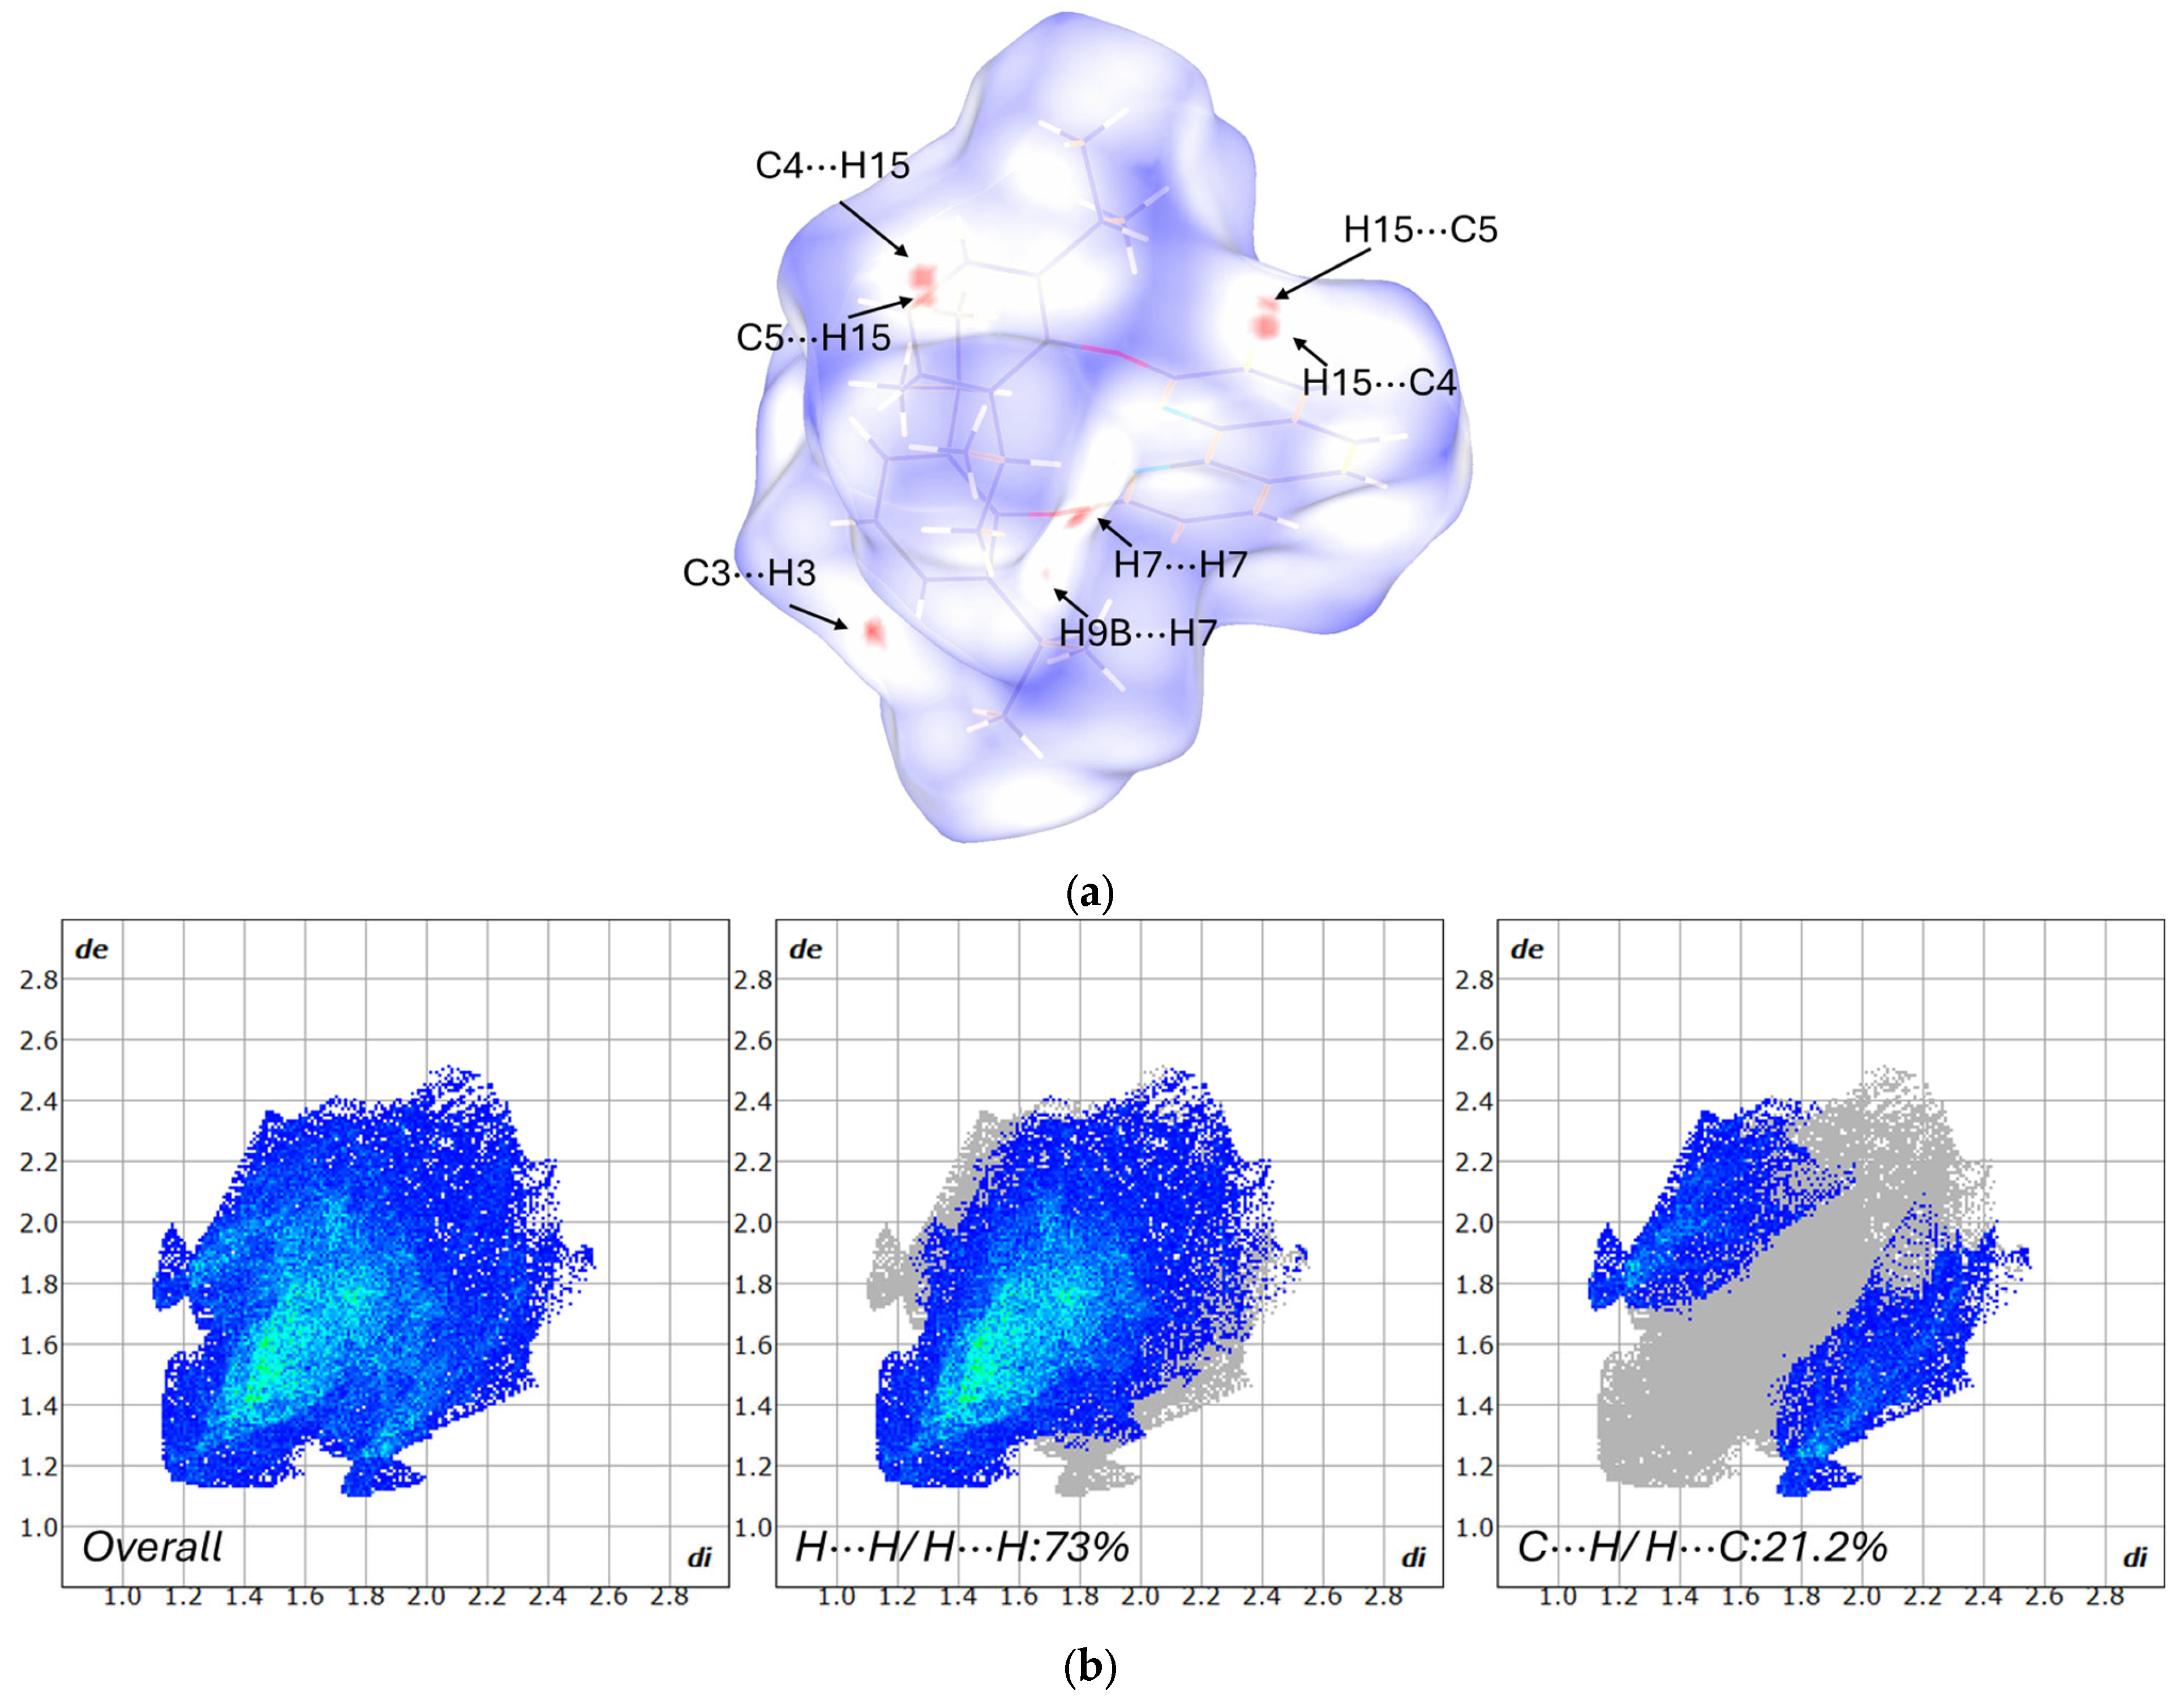
The Hirshfeld surface mapped over dnorm in the range of −0.0633 to 1.6332 a.u. and the two-dimensional finger plots of compound 2 are shown in Figure 4. The analysis shows that the H⋯H interactions in molecule (2) make a higher contribution to the packing of the crystals and represent 73% of total intermolecular interactions, followed by C⋯H interactions, with 21.2%. It is worth nothing that in 2, we did not observe any C⋯C or N⋯H interactions, while the percentage of O⋯H interactions was almost two times higher than that observed in 1 (4.6% in compound 2 compared to 2.2% in compound 1).
For both compounds, the crystal packing is due to the presence of weak van der Waals interactions, which keep the adjacent molecules together. The dominance of C⋯H and H⋯H in the two-dimensional finger plots shows that the molecules are densely packed. These types of interactions are common in organic molecules with high hydrogen content and a lack of acceptors for classical hydrogen bonds [30]. The regions in the Hirshfeld surface with interactions closer than the van der Waals radii (red spots on the Hirshfeld surface) could be due to the London dispersion interactions that are known to enable short H⋯H interactions in hydrocarbons, which additionally stabilizes the crystal structure of the materials [31].

3.3. Structural Characterization by FTIR

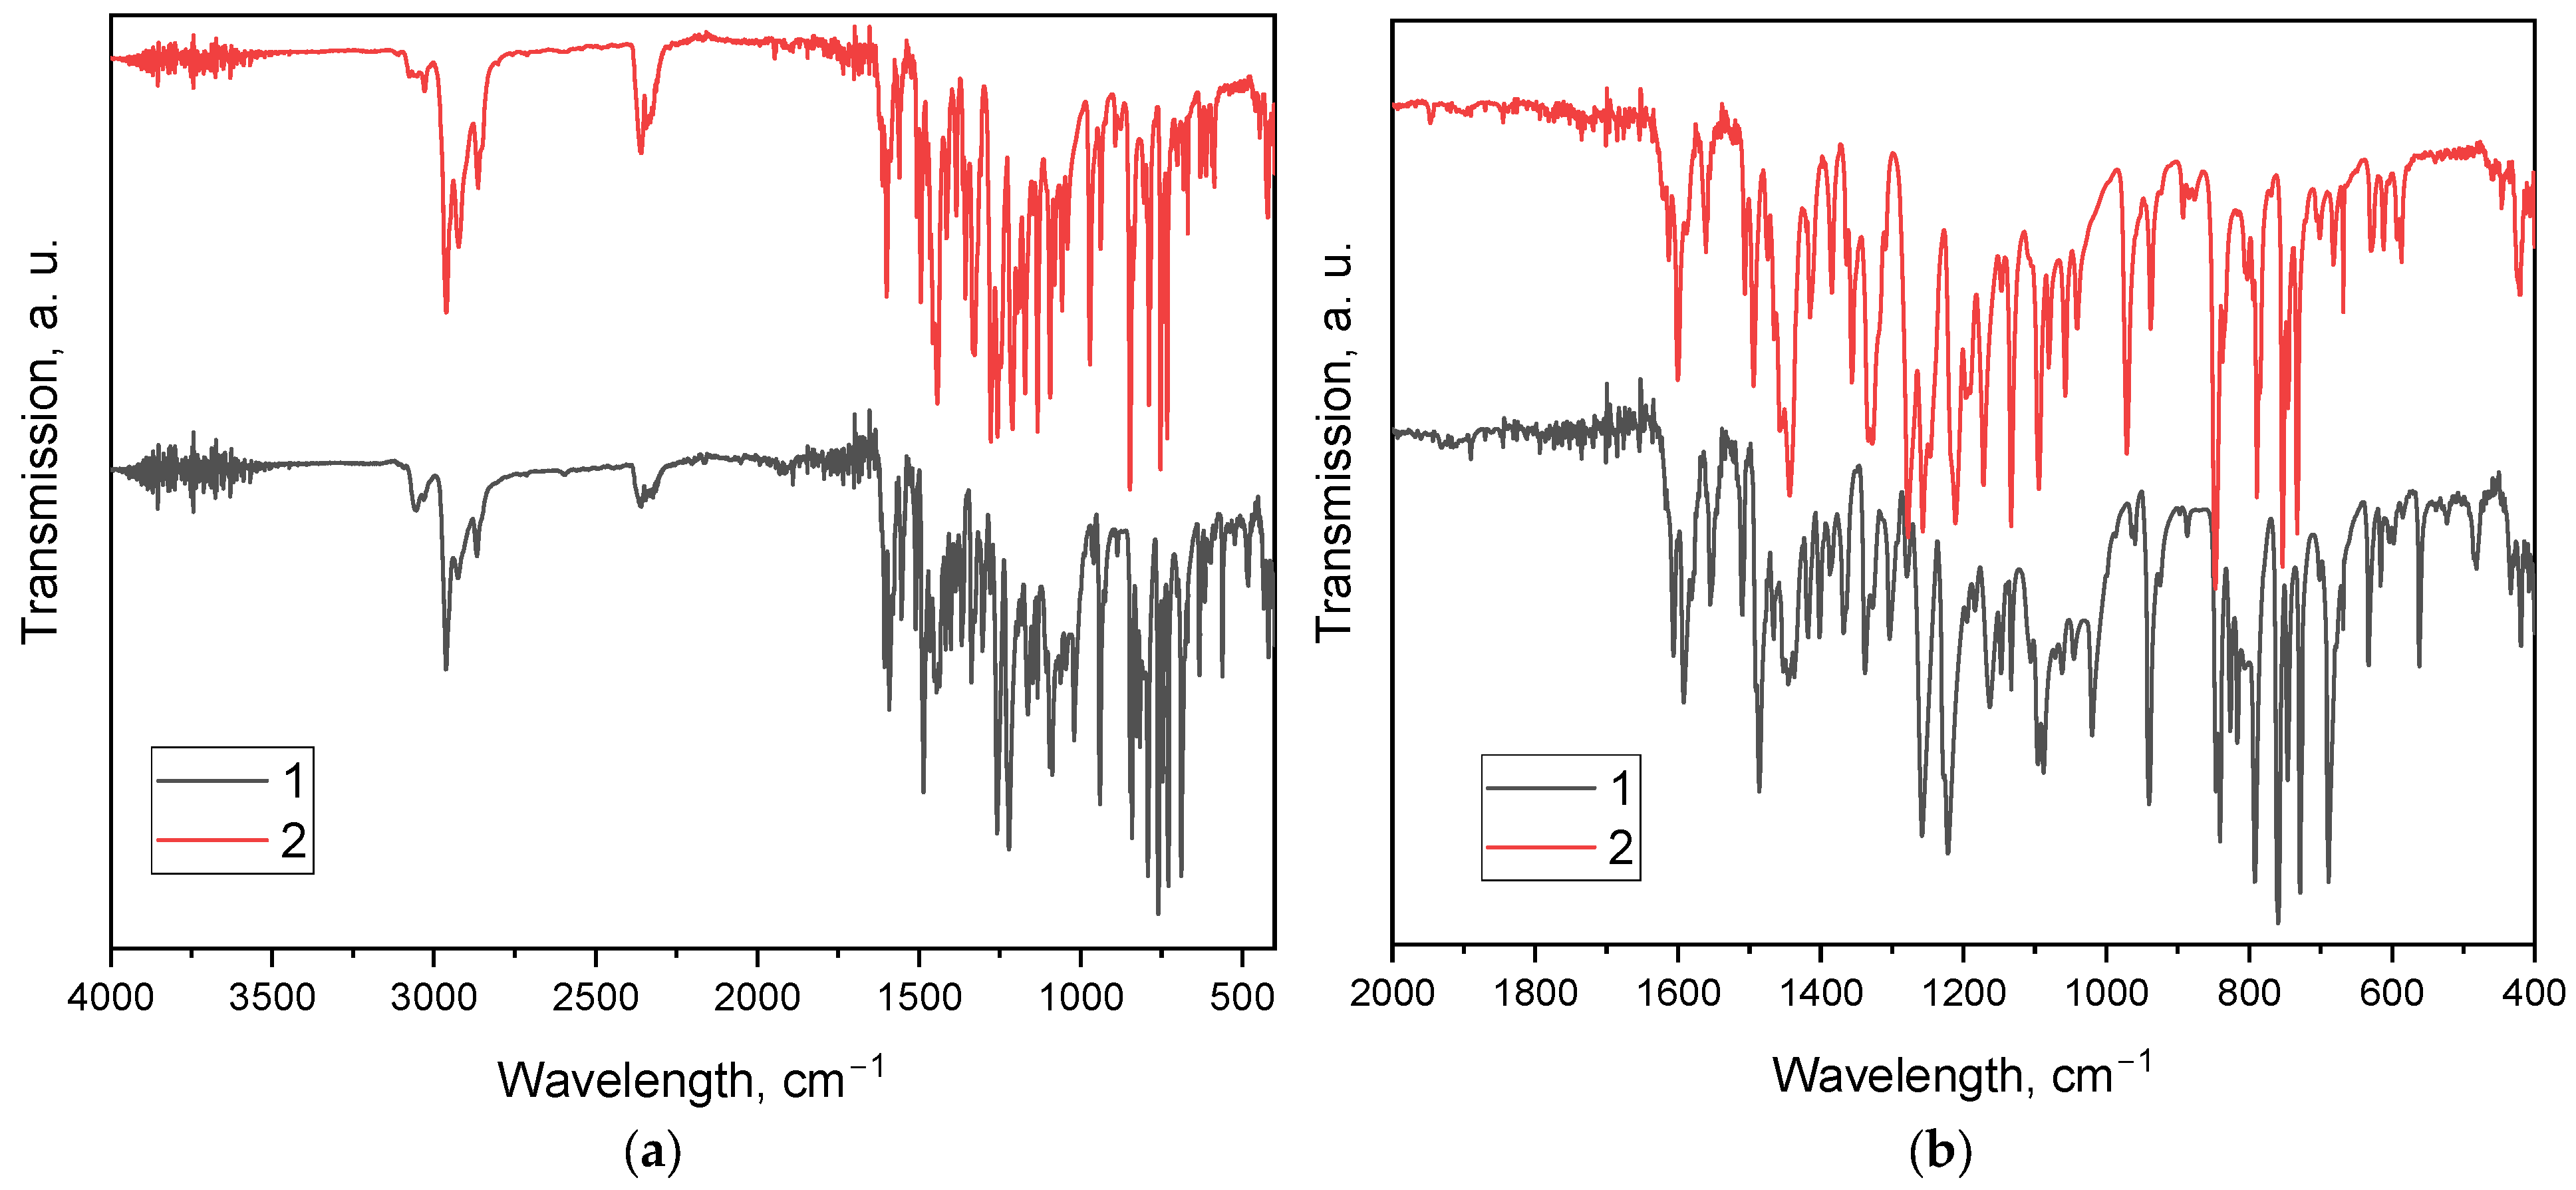
The IR spectra of compounds 1 and 2 (Figure 5) display the typical absorptions of phenanthroline derivatives bearing bulky isopropylphenoxy substituents. The most important IR band assignments are summarized in Table 2. Both ligands show strong C=N and C=C stretching bands of the aromatic framework around 1600 and 1500 cm−1, together with the aliphatic C–H stretches of the iPr groups at 2960 and 2870 cm−1 and their bending modes at 1460 and 1380 cm−1. The C–O–C region provides the clearest distinction: 1 shows a more intense band at ≈1250 cm−1, while in 2, the absorption near 1180 cm−1 dominates, in line with the presence of one versus two phenoxy groups. Additional differences are observed in the relative intensity of the aromatic C–H stretching near 3050 cm−1 and in slight shifts in the ring and out-of-plane C–H deformations (1510 → 1494 cm−1; 746 → 753 cm−1). These features are consistent with the structural variations between the mono- and bis-phenoxy phenanthroline ligands.

3.4. Electronic Properties

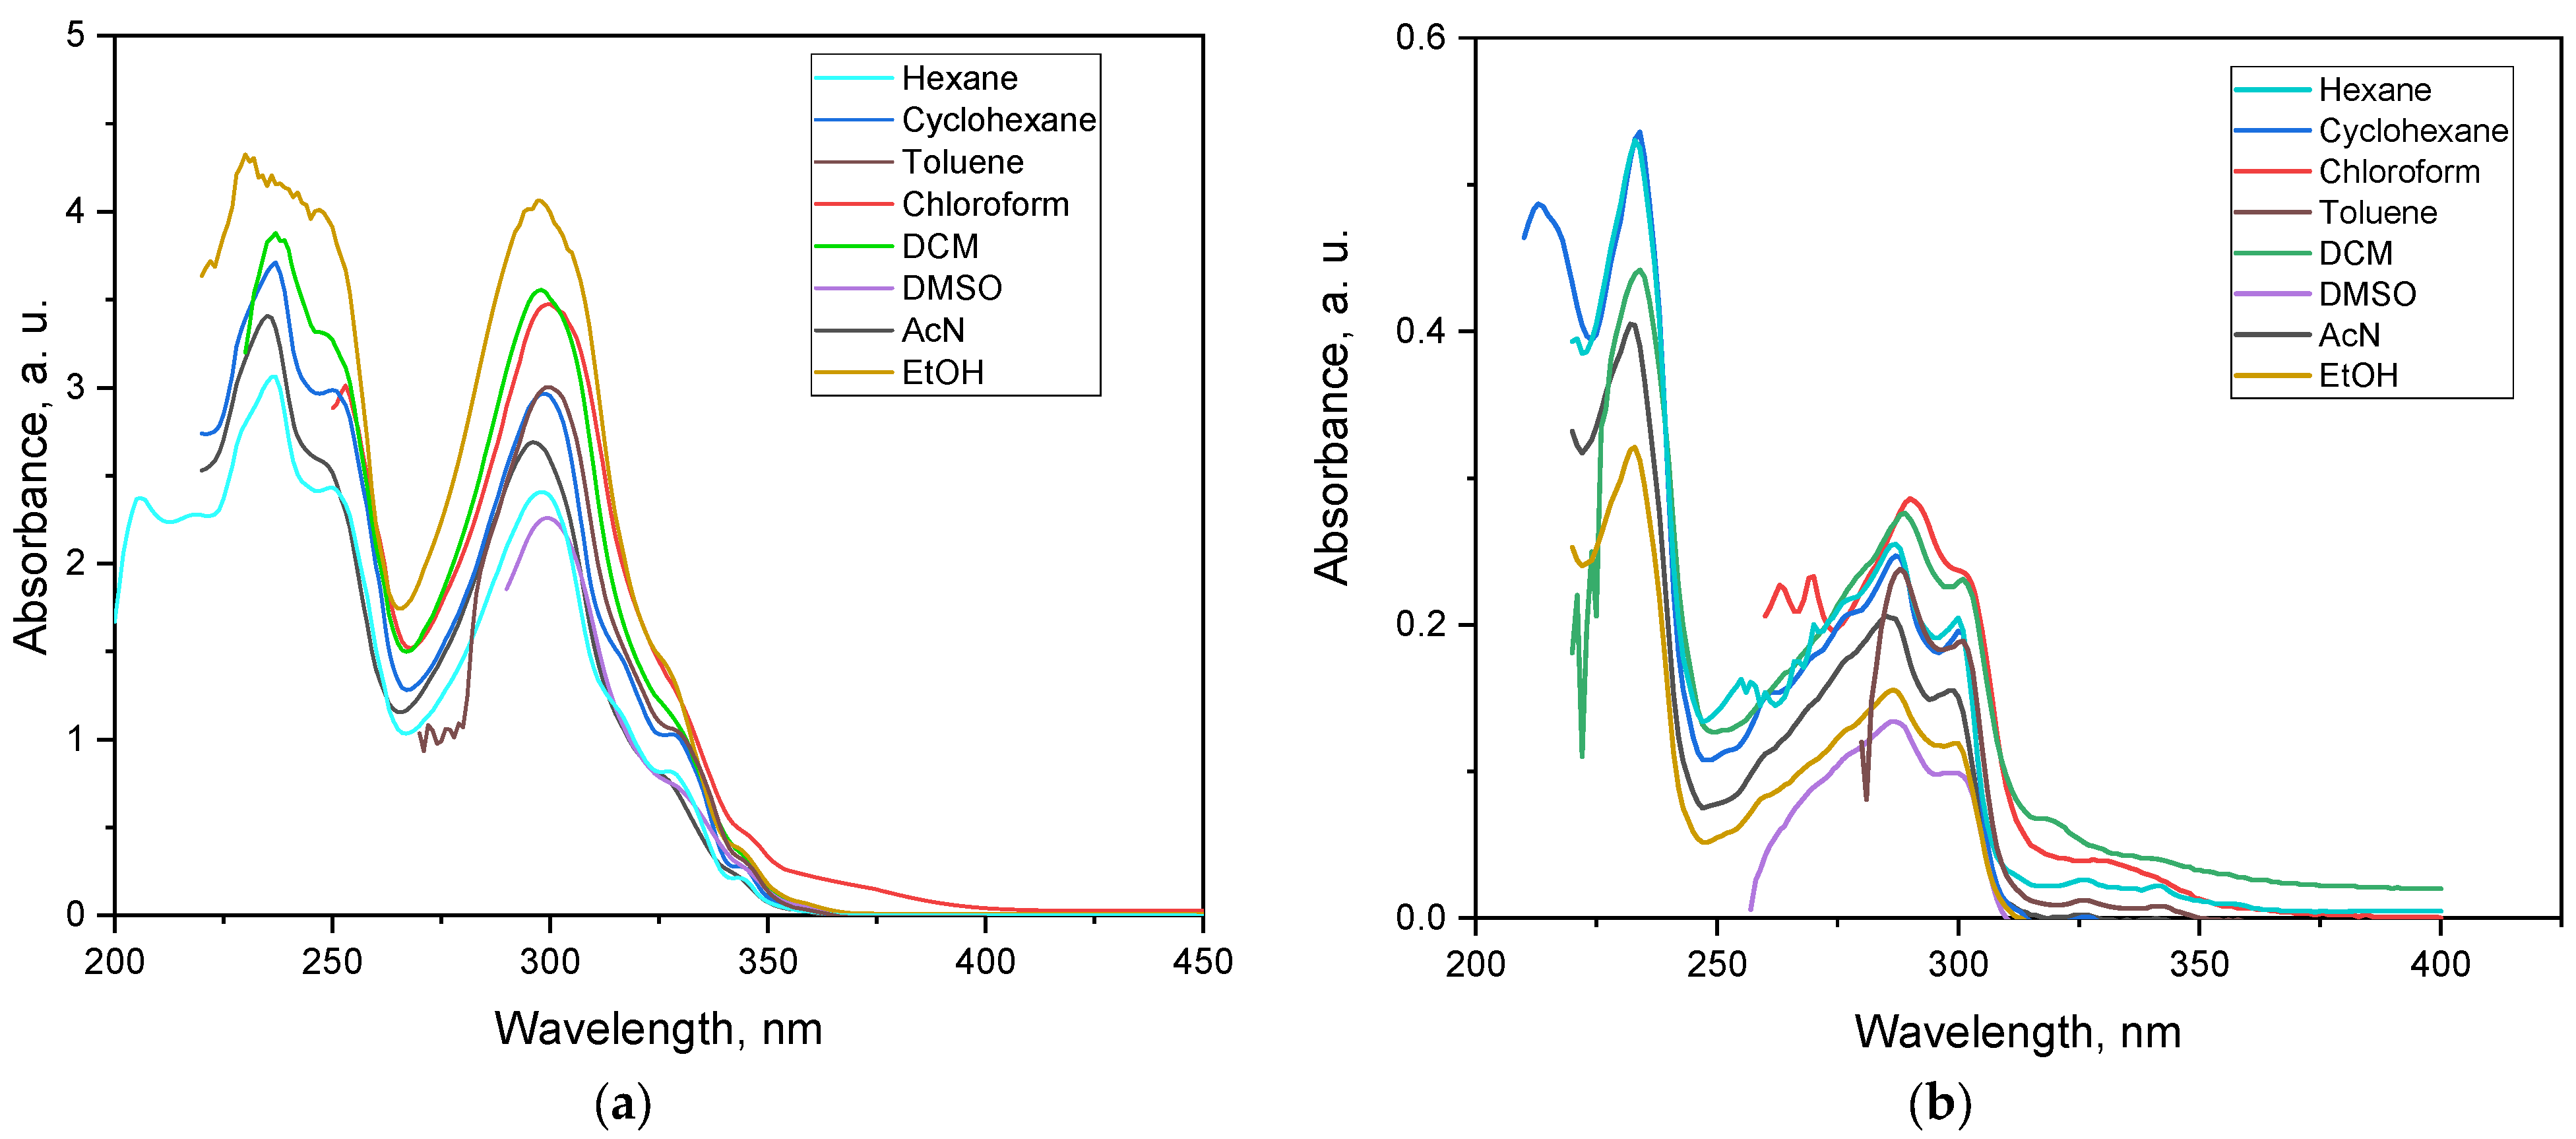
The UV–Vis absorption spectra of 1 and 2 in different solvents (Figure 6) display two main regions: an intense band in the high-energy range (230–237 nm, Table 3) and a lower-energy band around 286–300 nm (Table 4), which can be attributed to electronic transitions involving the extended conjugation between the phenanthroline core and the aryl(phenoxy) substituents. This band has a pronounced intramolecular charge-transfer (ICT) character, especially in compound 1. The short-wavelength absorption band (230–237 nm) corresponds to a localized π–π* transition and shows only weak solvatochromism. The observed variations in molar absorptivity (ε) reflect the influence of solute–solvent interactions: for compound 1, the highest value is observed in ethanol (ε = 4.3 × 10⁴ L·mol−1·cm−1), while for compound 2, the maximum appears in cyclohexane (ε = 3.6 × 10⁴ L·mol−1·cm−1). This behavior indicates that the band energy is barely affected by solvent polarity, whereas its intensity is modulated by specific solute–solvent interactions, which are most favorable for 1 in ethanol and for 2 in cyclohexane. Overall, the asymmetric substitution in 1 leads to stronger transitions in polar—especially protic—solvents (ethanol), whereas the symmetric substitution in 2 is more effective in nonpolar environments (e.g., cyclohexane). In DMSO, intermediate behavior is observed.
The long-wavelength band reveals clearer differences between the two compounds. For 1, the absorption maximum is found at 296–300 nm, while for 2, it is consistently blue-shifted to 286–290 nm. The bathochromic shift in 1 (Figure 6a) reflects the effect of the single phenoxy substituent, which enables more effective conjugation and charge delocalization. In contrast, the two phenoxy groups in 2 (Figure 6b) act more symmetrically, which reduces delocalization and diminishes the oscillator strength. The solvent dependence of ε is particularly informative: 1 shows strong absorption in all solvents, with ε values between 3.1 × 10⁴ and 4.1 × 10⁴ L·mol−1·cm−1, reaching its maximum in ethanol. In comparison, 2 is markedly weaker, ranging from 1.7 × 10⁴ in nonpolar solvents to only 0.9 × 10⁴ L·mol−1·cm−1 in DMSO.
Two conclusions can be drawn from these results. First, 1 not only absorbs at longer wavelengths but also maintains consistently higher molar absorptivity across solvents, which makes it the stronger chromophore. Second, 2 is much more sensitive to solvent polarity, with polar media significantly reducing ε, most likely due to enhanced stabilization of non-radiative decay pathways or stronger solute–solvent interactions. The results reveal that substitution symmetry defines the optical response of these phenanthroline derivatives. The single phenoxy group in 1 promotes extended conjugation and stronger absorption, whereas the symmetric bis-substitution in 2 reduces intensity and enhances solvent sensitivity. These contrasting patterns point to notable differences in their fluorescence properties, discussed in the following section.

3.5. Fluorescence Properties

3.5.1. Excitation Spectra

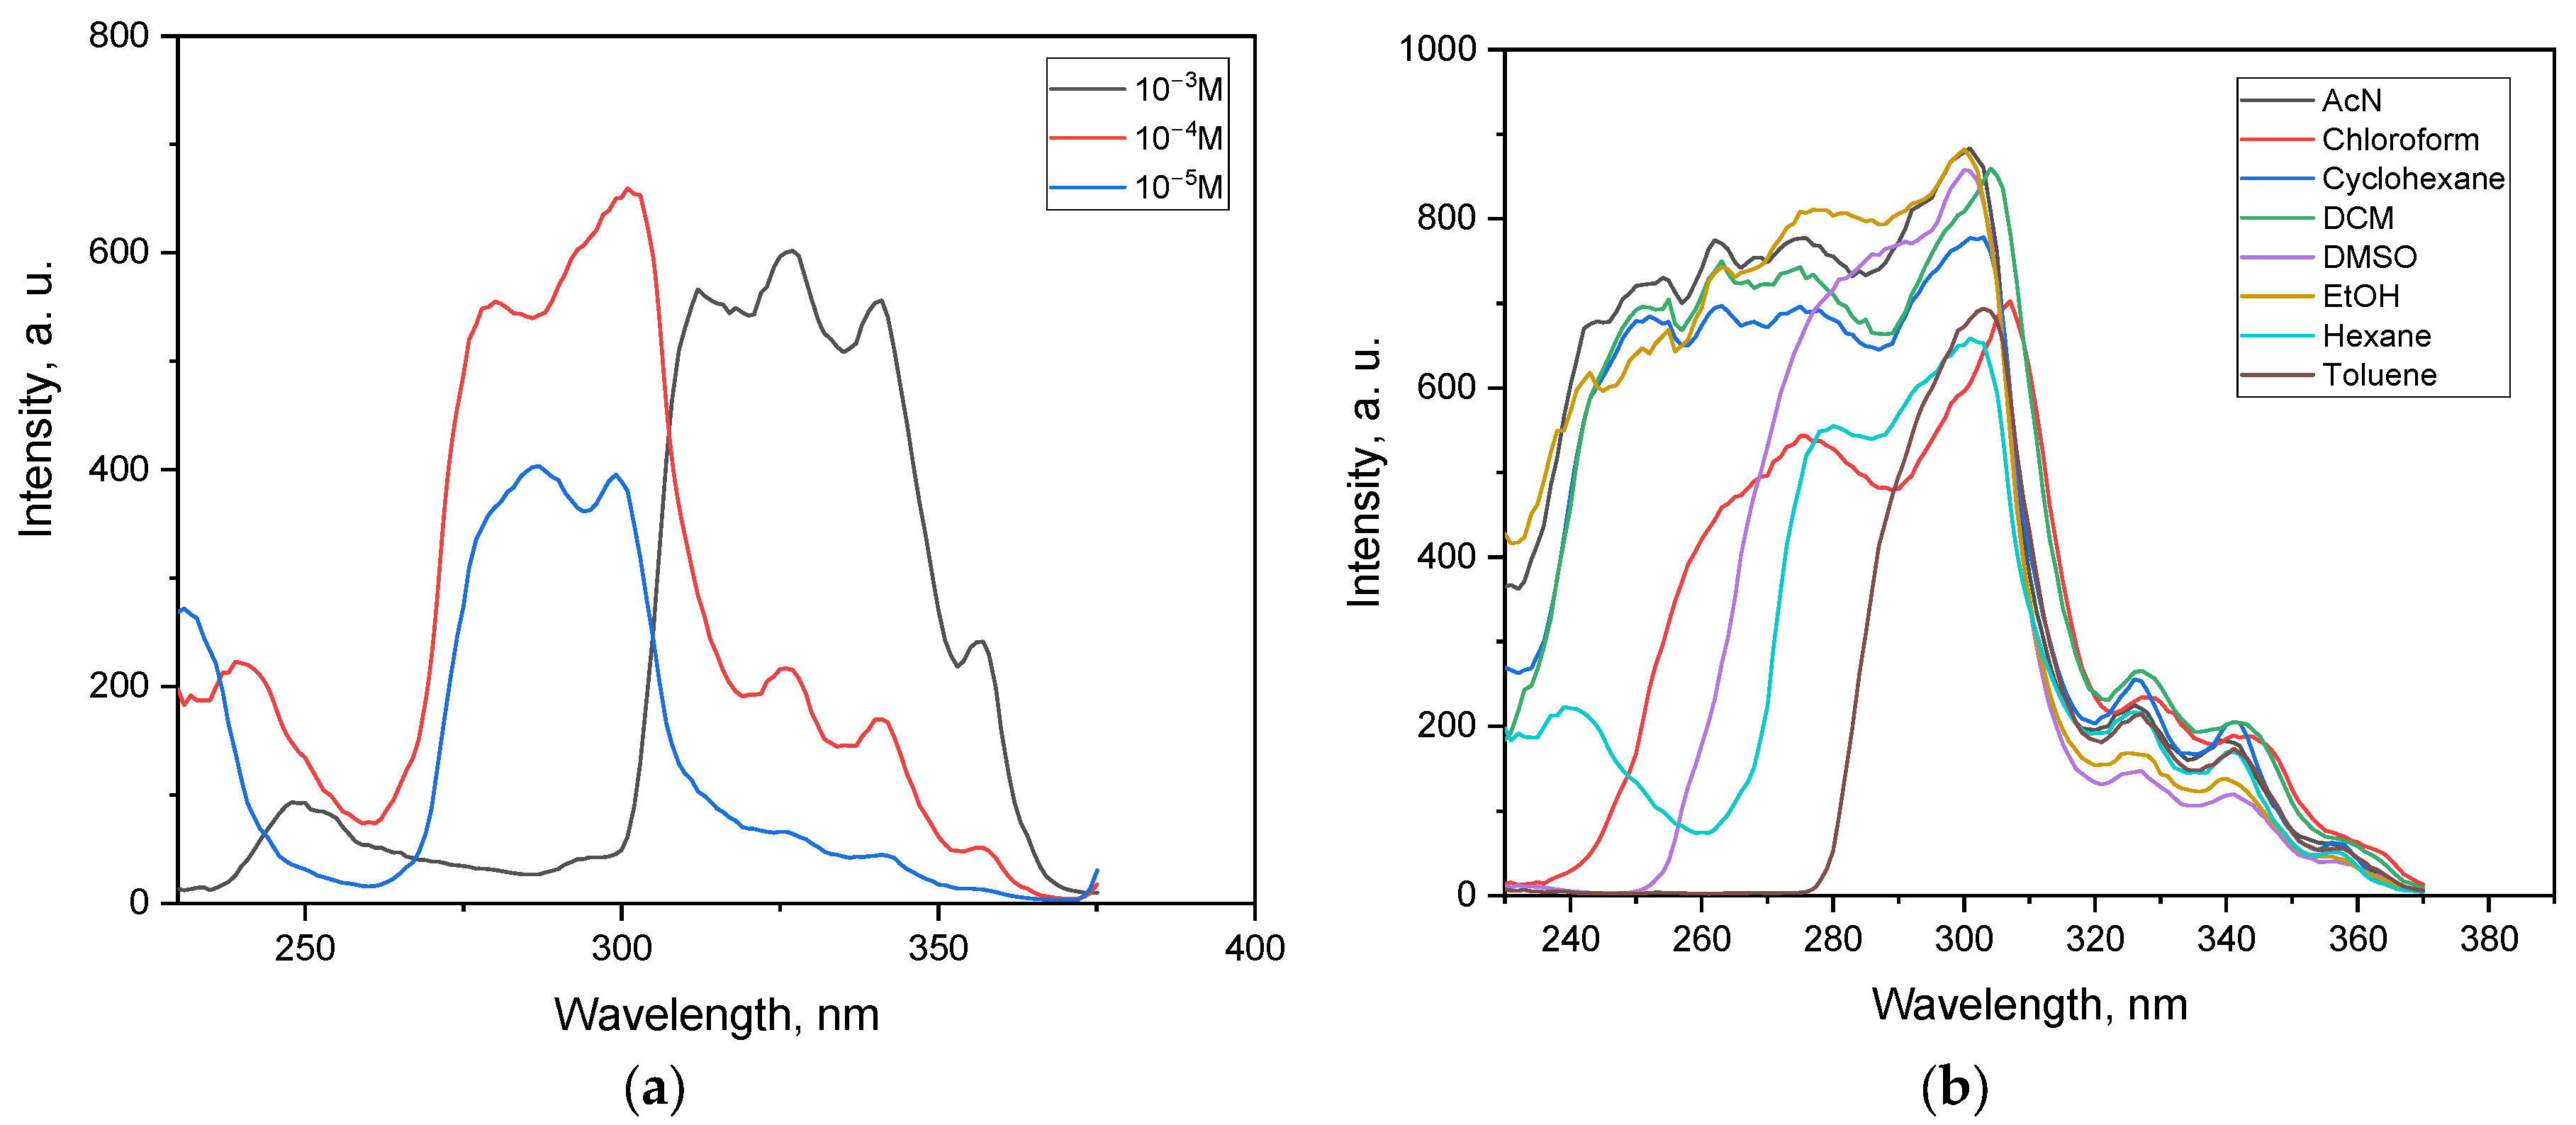
In hexane, the excitation spectra of 1 shows a clear concentration dependence (Figure 7a). At 10−3 M, the profile is strongly distorted, with a narrow long-wavelength maximum at 350–355 nm and marked attenuation of the high-energy region (240–280 nm). This behavior arises from inner-filter and reabsorption effects rather than from intrinsic electronic transitions.
At 10−4 M, the spectrum recovers its characteristic two-band shape, with a broad maximum at 318–325 nm and a secondary feature in the 260–275 nm region. The principal excitation band at 318–325 nm coincides with the longest-wavelength-absorption feature observed in the UV–Vis spectra at the same concentration (Figure 6a, Table 4), confirming that this transition efficiently populates the emissive S1 state detected at 380 nm. This concentration therefore provides the best compromise between band shape and intensity and can be considered representative of the monomeric excitation of 1. Hexane was selected for this concentration-dependent excitation study because it is a representative nonpolar solvent with minimal background absorption, which makes it suitable for revealing inner-filter and reabsorption effects on high-energy bands.
At 10−5 M, the long-wavelength maximum shifts hypsochromically to 300–305 nm, the short-wavelength band becomes relatively more prominent, and the tail above 330–340 nm essentially disappears. This evolution highlights the concentration-dependent distortions caused by the inner-filter effect and confirms that the genuine monomeric excitation is best reflected at 10−4 M.
The excitation spectra of 1 in various solvents (Figure 7b) display pronounced solvatochromic effects. The main excitation band is centered between 300 and 330 nm, with a secondary feature in the 260–280 nm region. Both the intensity and the position of the maxima vary depending on solvent polarity and hydrogen-bonding ability. Both the intensity and the position of the emission maxima vary depending on solvent polarity, with the strongest solvatochromic effects observed in ethanol, the only solvent in our set capable of significant hydrogen-bonding interactions. The strongest signals are observed in protic ethanol and polar aprotic acetonitrile, while nonpolar solvents such as hexane and cyclohexane give weaker responses. In chloroform and DMSO, the spectra are broader and partially split, indicative of overlapping electronic transitions and enhanced solute–solvent interactions, consistent with partial ICT character.
Importantly, the longest-wavelength excitation maxima coincide with the corresponding absorption bands observed in the UV–Vis spectra at 10−4 M (Figure 6a, Table 4), confirming that these transitions efficiently populate the emissive S1 state (λem = 380 nm). Overall, the data confirm that the asymmetric substitution in 1 leads to pronounced solvent sensitivity of the excitation process. This behavior parallels the solvatochromism seen in the absorption spectra and further supports the assignment of an ICT contribution to the lowest-energy transition.
In hexane, the excitation spectra of 2 display a distinct concentration dependence (Figure 8a). At 10−3 M, the profile is distorted into a broad long-wavelength envelope (310–350 nm) due to strong inner-filter/self-absorption effects, accompanied by attenuation of the UV region. At 10−4 M, a well-resolved two-band pattern emerges, with a dominant maximum at 286–290 nm and a secondary feature at 245–260 nm. Further dilution to 10−5 M enhances the relative contribution of the high-energy band and produces a slight hypsochromic shift in the main maximum, consistent with recovery of the monomeric transition and suppression of reabsorption. The overall behavior contrasts with 1, as 2 lacks a pronounced bathochromic contribution, in agreement with its symmetric bis(phenoxy) substitution. Importantly, the excitation profile at 10−4 M closely parallels the absorption spectrum (Figure 6b), confirming that the 286–290 nm band governs access to the emissive S1 state.
The excitation spectra of 2 in various solvents (Figure 8b) closely mirror the corresponding absorption spectra (Figure 6b). The principal maximum at 286–290 nm coincides with the lowest-energy absorption band, while the secondary UV feature (245–260 nm) corresponds to the high-energy π–π* transition. In nonpolar solvents (hexane, cyclohexane, toluene), the spectra are well structured, whereas in polar solvents (EtOH, AcN, DMSO), the bands are attenuated and broadened, reflecting reduced molar absorptivity and stronger solute–solvent interactions. Chloroform and DCM show intermediate behavior. Overall, 2 exhibits efficient S0 → S1 excitation via the 286–290 nm band, but its intensity is markedly suppressed in polar media, in sharp contrast to 1, which retains a stronger, bathochromically shifted excitation profile.
By comparing the excitation and absorption results, it becomes clear that the two compounds follow different electronic patterns. Compound 1 exhibits a bathochromically shifted and more intense long-wavelength band, which is further enhanced in polar solvents, whereas 2 shows a hypsochromically shifted maximum with reduced intensity and stronger attenuation in polar media. These contrasting behaviors reflect the asymmetric versus symmetric substitution and set the basis for the differences observed in their fluorescence properties.

3.5.2. Emission Spectra

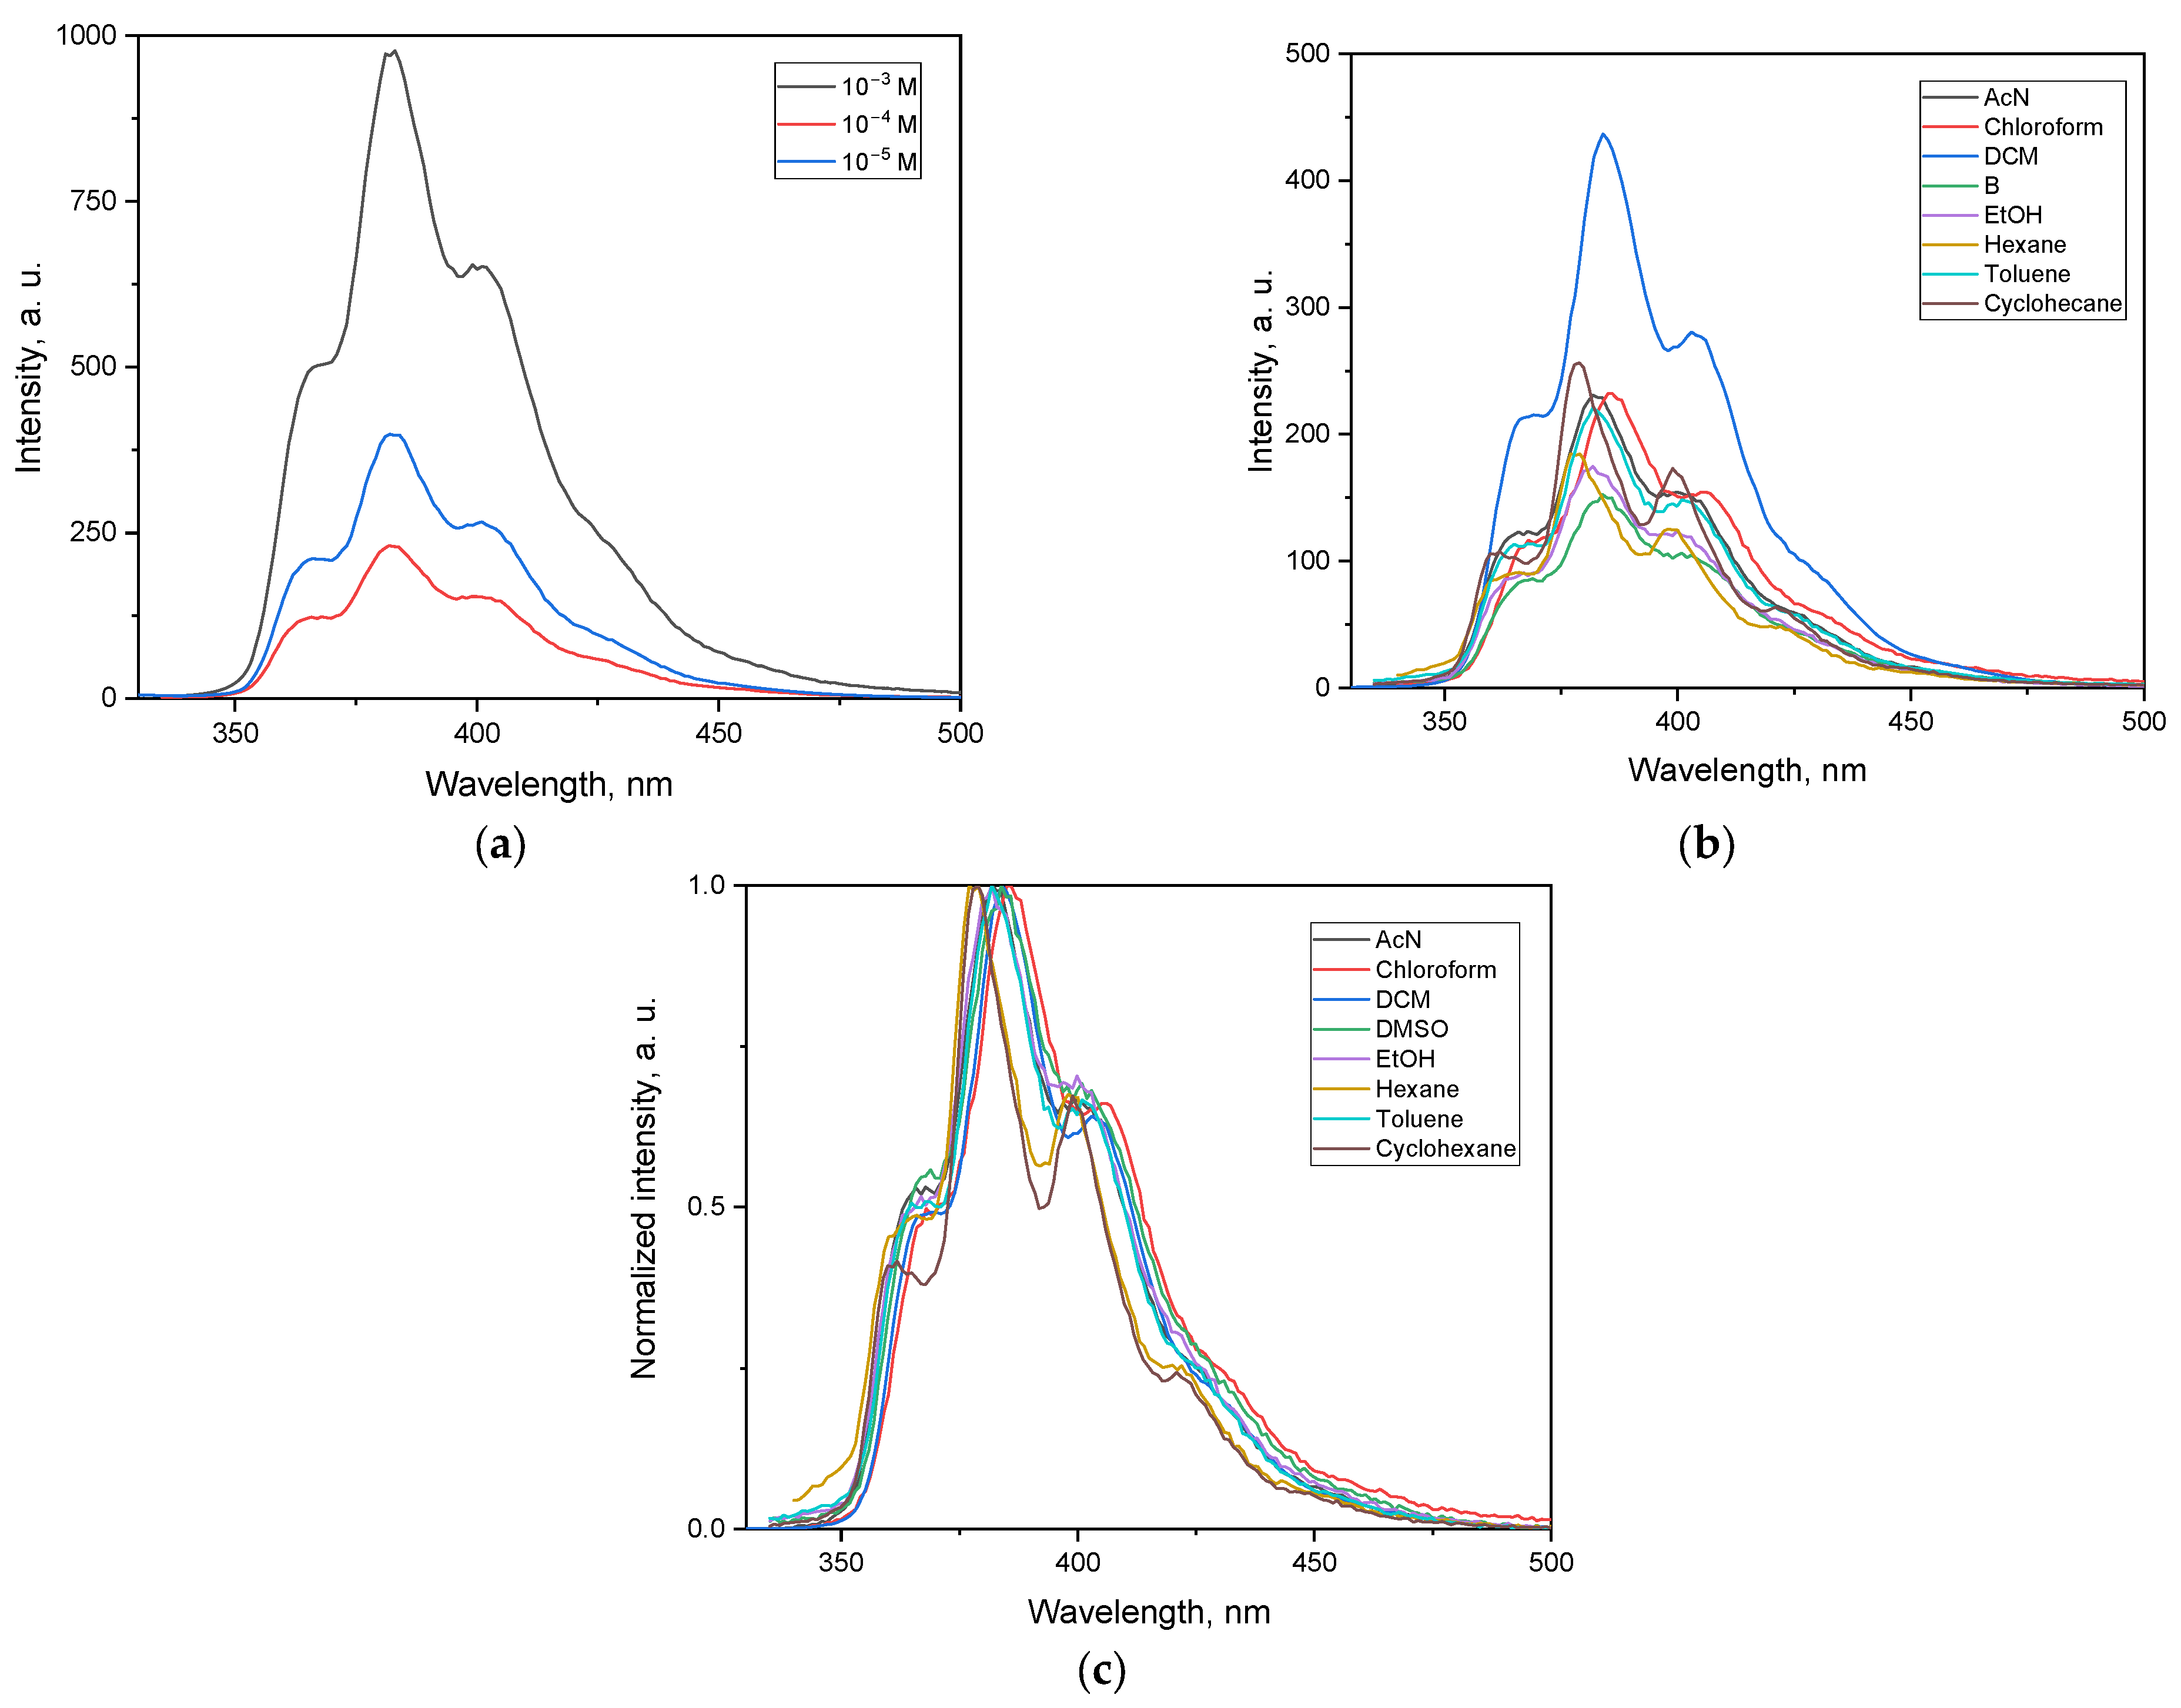
In acetonitrile, the emission spectra of 1 exhibit systematic concentration-dependent changes (Figure 9). Acetonitrile was chosen for the emission study due to the high solubility of both compounds in this polar medium and the strong, reliable fluorescence signals it provides, which enable accurate observation of concentration effects without aggregation artifacts. At 10−3 M, the spectrum is dominated by a strong, relatively sharp maximum at 380–385 nm, accompanied by a less structured shoulder extending to ~420 nm. This profile reflects significant inner-filter effects and the possible onset of aggregation, which artificially enhance the short-wavelength component. At 10−4 M, the emission becomes more balanced, with the 385–390 nm maximum decreasing in relative intensity and the shoulder at 420–430 nm becoming more pronounced, indicating recovery of the intrinsic monomeric emission. At 10−5 M, the long-wavelength tail further develops, and the spectrum appears broader and red-shifted, consistent with minimized reabsorption and the cleanest representation of the S1 → S0 fluorescence.
The progression (compressed, blue-weighted emission at high concentration → broadened, red-shifted band on dilution) supports the assignment of inner-filter and self-absorption artifacts at 10−3 M, while the 10−5 M trace reflects the genuine photophysics of 1 in polar aprotic media. This trend parallels the excitation data (Figure 7a), where high concentration suppressed the UV band, whereas the diluted spectrum revealed the expected two-band profile.
The emission spectra of 1 display clear solvent-dependent variations. In terms of absolute intensity (Figure 9b), polar solvents such as ethanol and DMSO produce the strongest fluorescence, whereas nonpolar solvents (hexane, cyclohexane, toluene) yield weaker responses with comparatively sharper profiles. Acetonitrile, chloroform, and DCM give intermediate intensities, with the latter also showing a broader band consistent with partial stabilization of an ICT-type excited state. The emission maxima undergo only modest solvatochromic shifts, spanning ca. 380–390 nm in nonpolar media and extending to ~395–400 nm in polar solvents. The normalized spectra (Figure 9c) confirm that the spectral shape remains largely conserved across solvents, with only slight broadening in highly polar environments. These results indicate that the unsymmetric substitution in 1 not only enhances fluorescence efficiency in polar solvents but also imparts subtle bathochromic shifts, consistent with the absorption and excitation behavior and supporting the involvement of a charge-transfer component in the emissive state.
The emission of 2 (Figure 10a) shows a clear concentration dependence. At 10−3 M, the spectrum is dominated by a strong, relatively narrow band near 380–385 nm with a suppressed long-wavelength tail, typical of primary/secondary inner-filter and reabsorption effects at high absorbance. Upon dilution (10−4–10−5 M), the profile broadens and the red wing (≈410–500 nm) gains relative intensity, revealing the intrinsic monomeric fluorescence. The non-linear change in intensity with concentration reflects the competing influence of absorption at the excitation wavelength and reabsorption across the emission window. Using λ_ex = 325 nm on the red edge of the lowest-energy absorption band of 2 minimizes reabsorption and yields the most representative emission shape for comparison with 1.
The emission spectra of 2 display marked solvent-dependent changes (Figure 10b). In nonpolar solvents such as hexane, cyclohexane and toluene, the fluorescence bands are relatively sharp but of lower intensity, with maxima at ca. 385–390 nm. In contrast, polar solvents (EtOH, AcN, DMSO) produce stronger and somewhat broadened signals, with the maxima shifted slightly to longer wavelengths (395–400 nm). Chloroform and DCM give intermediate responses, with broader profiles consistent with enhanced solute–solvent interactions. Normalization of the spectra (Figure 10c) shows that, despite these intensity differences, the emission band shape and position remain largely conserved, with only modest solvatochromic displacements.
In addition to steady-state fluorescence, time-resolved measurements were performed. The fluorescence lifetimes fall in the nanosecond range (Table S1, Supporting Information). Compound 1 shows values of 2–3 ns depending on the solvent, while compound 2 consistently gives longer lifetimes of 4–5 ns. These data agree with the literature reports for related phenanthroline derivatives in organic solvents (2–5 ns) [5,32,33]. The shorter τ values of compound 1 suggest a stronger contribution of non-radiative processes, whereas the longer τ values of compound 2 indicate a more stable excited state, consistent with its symmetric substitution.
The fluorescence response of both compounds depends on the solvent. The emission maxima shift with polarity, with the most pronounced effect in ethanol, the only solvent in the series capable of strong hydrogen bonding. Compound 1 is characterized by weaker emission and faster decay, while compound 2 shows stronger emission and slower decay. This comparison highlights how differences in substitution pattern affect the excited-state behavior of phenanthroline derivatives.

4. Conclusions

The synthesis, crystal structures and optical properties of two novel 1,10-phenanthroline derivatives containing 2,6-diisopropylphenoxy substituents are presented. The modified synthetic route afforded high yields of 73% for 2-(2,6-diisopropylphenoxy)-9-phenyl-1,10-phenanthroline (1) and 87% for 2,9-bis(2,6-diisopropylphenoxy)-1,10-phenanthroline (2). Needle-like crystals obtained by the slow evaporation of acetonitrile solutions were characterized by single-crystal X-ray diffraction, which revealed significantly different crystal structures. Compound 1 crystallizes in the triclinic space group, whereas the bulkier compound 2 crystallizes in the monoclinic space group. Despite these differences, both molecules show similar packing, dominated by H⋯H and C⋯H contacts, with no classical hydrogen bonds observed.
The optical studies revealed marked solvatochromic effects that strongly depend on the substitution pattern. Fluorescence measurements show that the symmetric derivative 2 exhibits more efficient and solvent-independent emission, while the asymmetric derivative 1 is more sensitive to solvent polarity, consistent with its stronger ICT character. The small bathochromic shifts observed for 2 in polar solvents indicate a modest ICT contribution, less pronounced than in 1, in line with the absorption and excitation data.

Supplementary Materials

The following supporting information can be downloaded at: https://www.mdpi.com/article/10.3390/cryst15100883/s1, Figure S1: 1H-NMR spectrum of compound (3)-9-chloro-1-methyl-1,10-phenanthrolin-2(1H)-one; Figure S2: 13C-NMR spectrum of compound (3)-9-chloro-1-methyl-1,10-phenanthrolin-2(1H)-one; Figure S3: 1H-NMR spectrum of compound (4)-2,9-dichloro-1,10-phenanthroline; Figure S4: 13C-NMR spectrum of compound (4)-2,9-dichloro-1,10-phenanthroline; Figure S5: 1H-NMR spectrum of compound (2)-2,9-bis(2,6-diisopropylphenoxy)-1,10-phenanthroline; Figure S6: 13C-NMR spectrum of compound (2)-2,9-bis(2,6-diisopropylphenoxy)-1,10-phenanthroline; Figure S7: 1H-NMR spectrum of compound (5)-1-methyl-9-phenyl-1,10-phenanthrolin-2(1H)-one; Figure S8: 13C-NMR spectrum of compound (5)-1-methyl-9-phenyl-1,10-phenanthrolin-2(1H)-one; Figure S9: 1H-NMR spectrum of compound (6)-2-chloro-9-phenyl-1,10-phenanthroline; Figure S10: 13C-NMR spectrum of compound (6)-2-chloro-9-phenyl-1,10-phenanthroline; Figure S11: 1H-NMR spectrum of compound (1): 2-(2,6-diisopropylphenoxy)-9-phenyl-1,10-phenanthroline; Figure S12: 13C-NMR spectrum of compound (1): 2-(2,6-diisopropylphenoxy)-9-phenyl-1,10-phenanthroline; Figure S13: Crystal packing of (a) compound 1 and (b) compound 2; Table S1: Lifetimes (τ) of compound 1 and 2 in different solvents (c = 1 × 10⁻⁴ M, λex = 330 nm for L31 and 325 nm for L32; λem ≈ 380–385 nm in all solvents).

Author Contributions

Conceptualization, M.T., J.Z. and R.L.; methodology, J.Z., M.T. and R.L.; validation, M.T.; formal analysis, J.Z., R.L., M.T., B.M. and M.K.; investigation, J.Z., R.L., M.T., B.M. and M.K.; resources, J.Z.; data curation, J.Z., M.T. and R.L.; writing—original draft preparation M.T.; writing—review and editing, J.Z., M.T. and R.L.; visualization, M.T.; project administration, J.Z. All authors have read and agreed to the published version of the manuscript.

Funding

The financial support from the BG Fund for Scientific Investigations (project no. KP-06-N39/2019), as well as from the Fund for Scientific Investigation of Sofia University “St. Kliment Ohridski” (Project № 80-10-71/2025), is greatly appreciated.

Data Availability Statement

The original contributions presented in this study are included in the article and Supplementary Materials. Further inquiries can be directed to the corresponding authors.

Acknowledgments

Single-crystal instrumentation and technical assistance for this work were provided by the Service Center X-ray Diffraction, with financial support from Saarland University and German Science Foundation (project number INST 256/506-1).

Conflicts of Interest

The authors declare no conflicts of interest.

References

  1. Alreja, P.; Kaur, N. Recent Advances in 1,10-Phenanthroline Ligands for Chemosensing of Cations and Anions. RSC Adv. 2016, 6, 23169–23217. [Google Scholar] [CrossRef]
  2. Rillema, D.P.; Cruz, A.J.; Tasset, B.J.; Moore, C.; Siam, K.; Huang, W. Structural Properties of Platinum(II) Biphenyl Complexes Containing 1,10-Phenanthroline Derivatives. J. Mol. Struct. 2013, 1041, 82–91. [Google Scholar] [CrossRef]
  3. Bonaccorso, C.; Cesaretti, A.; Elisei, F.; Mencaroni, L.; Spalletti, A.; Fortuna, C.G. New Styryl Phenanthroline Derivatives as Model D−π−A−π−D Materials for Non-Linear Optics. ChemPhysChem 2018, 19, 1917–1929. [Google Scholar] [CrossRef] [PubMed]
  4. Muñoz, J.; Peñaloza, F.; Guajardo, K.; Arce, R.; Pizarro, N.; Vega, A. Synthesis, electronic and photophysical properties of 3,8-diaromatic-1,10-phenanthroline molecules. J. Chil. Chem. Soc. 2024, 69, 6188–6194. [Google Scholar] [CrossRef]
  5. Nycz, J.E.; Kolińska, J.; Karaush-Karmazin, N.; Chen, T.; Książek, M.; Kusz, J. New Tools in Heavy Metal Detection: Synthesis, Spectroscopic, and Quantum Chemical Characterization of Selected Water-Soluble Styryl Derivatives of Quinoline and 1,10-Phenanthroline. Molecules 2025, 30, 2659. [Google Scholar] [CrossRef]
  6. Wildervanck, M.J.; Hecht, R.; Nowak-Król, A. Synthesis and Strong Solvatochromism of Push-Pull Thienylthiazole Boron Complexes. Molecules 2022, 27, 5510. [Google Scholar] [CrossRef]
  7. Kushwaha, A.K.; Kumar, Y.; Kumar, S.; Singh, R.S. Competitive ICT in Asymmetric D−A Scaffolds Showing Visible Solvatochromism, Temperature-Induced Emission Enhancement and AIE Based Acidochromism. J. Lumin. 2022, 250, 119072. [Google Scholar] [CrossRef]
  8. Begantsova, Y.E.; Baranov, E.V.; Chesnokov, S.A. 4-(1H-Imidazo [4,5-f][1,10]Phenanthrolin-2-Yl)Benzaldehyde as a Probe in Pure Solvents: Solvatochromism, Electric Dipole Moment and PH Influence. Spectrochim. Acta A Mol. Biomol. Spectrosc. 2022, 280, 121480. [Google Scholar] [CrossRef]
  9. Zheng, Z.; Zhang, Q.; Yu, Z.; Yang, M.; Zhou, H.; Wu, J.; Tian, Y. Four New Two-Photon Absorbing Imidazo [4,5-f]1,10-Phenanthroline Dye Derivatives with Different Dipole Moment Orientation Based on Different Groups: Synthesis, Optical Characterization and Bioimaging. J. Mater. Chem. C 2013, 1, 822–830. [Google Scholar] [CrossRef]
  10. Liu, X.; Shen, B.; Zuo, R.; Hong, S.; Xiao, Y. 1,10-Phenanthroline-Based Hexacatenar LCs with Complex Self-Assembly, Photophysical and Binding Selectivity Behaviors. J. Mol. Liq. 2021, 340, 116892. [Google Scholar] [CrossRef]
  11. Aldeen, A.W.; Chen, Z.; Disher, I.A.; Yan, K.; Zhu, Y. Study of Initial β-Zr Formation in β-Quenched N36 Zirconium Alloy Using Dynamic and Metallographic Methods. Crystals 2022, 12, 1535. [Google Scholar] [CrossRef]
  12. Bin, Z.; Shi, D.; Su, R.; Han, W.; Zhang, D.; Duan, L. Hydrogen Bond Modulation in 1,10-Phenanthroline Derivatives for Versatile Electron Transport Materials with High Thermal Stability, Large Electron Mobility and Excellent n-Doping Ability. Sci. Bull. 2020, 65, 153–160. [Google Scholar] [CrossRef]
  13. Liu, J.; Gao, W.; Kityk, I.V.; Liu, X.; Zhen, Z. Optimization of Polycyclic Electron-Donors Based on Julolidinyl Structure in Push–Pull Chromophores for Second Order NLO Effects. Dye. Pigment. 2015, 122, 74–84. [Google Scholar] [CrossRef]
  14. He, G.S.; Tan, L.-S.; Zheng, Q.; Prasad, P.N. Multiphoton Absorbing Materials: Molecular Designs, Characterizations, and Applications. Chem. Rev. 2008, 108, 1245–1330. [Google Scholar] [CrossRef] [PubMed]
  15. Beckmann, S.; Etzbach, K.-H.; Krämer, P.; Lukaszuk, K.; Matschiner, R.; Schmidt, A.J.; Schuhmacher, P.; Sens, R.; Seybold, G.; Wortmann, R.; et al. Electrooptical Chromophores for Nonlinear Optical and Photorefractive Applications. Adv. Mater. 1999, 11, 536–541. [Google Scholar] [CrossRef]
  16. Sheldrick, G.M. SHELXT-Integrated Space-Group and Crystal-Structure Determination. Acta Crystallogr. A 2015, 71, 3–8. [Google Scholar] [CrossRef]
  17. Sheldrick, G.M. Crystal Structure Refinement with SHELXL. Acta Crystallogr. C Struct. Chem. 2015, 71, 3–8. [Google Scholar] [CrossRef]
  18. Hübschle, C.B.; Sheldrick, G.M.; Dittrich, B. ShelXle: A Qt Graphical User Interface for SHELXL. J. Appl. Crystallogr. 2011, 44, 1281–1284. [Google Scholar] [CrossRef]
  19. Krapcho, A.P.; Lanza, J.B. Improved synthesis of 2-chloro- and 2, 9-dichloro-1, 10-phenanthrolines. Org. Prep. Proced. Int. 2007, 39, 603–608. [Google Scholar] [CrossRef]
  20. Romanova, J.; Lyapchev, R.; Kolarski, M.; Tsvetkov, M.; Elenkova, D.; Morgenstern, B.; Zaharieva, J. Molecular Design of Luminescent Complexes of Eu(III): What Can We Learn from the Ligands. Molecules 2023, 28, 4113. [Google Scholar] [CrossRef]
  21. Tsvetkov, M.; Elenkova, D.; Kolarski, M.; Lyapchev, R.; Morgenstern, B.; Videva, V.; Zaharieva, J.; Milanova, M. Synthesis, Crystal Structure and Luminescence Properties of Two Novel Tb(III) Complexes with 1,10-Phenanthroline Derivatives as Ligands. J. Mol. Struct. 2024, 1314, 138768. [Google Scholar] [CrossRef]
  22. Brandl, T.; Kerzig, C.; Le Pleux, L.; Prescimone, A.; Wenger, O.S.; Mayor, M. Improved Photostability of a CuI Complex by Macrocyclization of the Phenanthroline Ligands. Chem. –A Eur. J. 2020, 26, 3119–3128. [Google Scholar] [CrossRef] [PubMed]
  23. Cen, S.; Li, S.; Zhao, Y.; Zhao, M.; Zhang, Z. Catalytic Asymmetric Synthesis of Unnatural Axially Chiral Biaryl Δ-Amino Acid Derivatives via a Chiral Phenanthroline-Potassium Catalyst-Enabled Dynamic Kinetic Resolution. Angew. Chem. Int. Ed. 2024, 63, e202407920. [Google Scholar] [CrossRef] [PubMed]
  24. Reck, L.M.; Haberhauer, G.; Lüning, U. Enantiopure Chiral Concave 1,10-Phenanthrolines. Eur. J. Org. Chem. 2016, 2016, 1119–1131. [Google Scholar] [CrossRef]
  25. Huang, Q.; Su, Y.-X.; Sun, W.; Hu, M.-Y.; Wang, W.-N.; Zhu, S.-F. Iron-Catalyzed Vinylzincation of Terminal Alkynes. J. Am. Chem. Soc. 2022, 144, 515–526. [Google Scholar] [CrossRef]
  26. Yen, F.W.; Chang, C.H.; Teng, C.M.; Lin, I.F. The Phenanthroline-Based Compound and Use Thereof 2016. US Patent No. 9698357, 4 July 2017. [Google Scholar]
  27. Krause, L.; Herbst-Irmer, R.; Sheldrick, G.M.; Stalke, D. Comparison of Silver and Molybdenum Microfocus X-Ray Sources for Single-Crystal Structure Determination. J. Appl. Crystallogr. 2015, 48, 3–10. [Google Scholar] [CrossRef]
  28. Fiedor, L.; Heriyanto; Fiedor, J.; Pilch, M. Effects of Molecular Symmetry on the Electronic Transitions in Carotenoids. J. Phys. Chem. Lett. 2016, 7, 1821–1829. [Google Scholar] [CrossRef]
  29. Spackman, P.R.; Turner, M.J.; McKinnon, J.J.; Wolff, S.K.; Grimwood, D.J.; Jayatilaka, D.; Spackman, M.A. CrystalExplorer: A Program for Hirshfeld Surface Analysis, Visualization and Quantitative Analysis of Molecular Crystals. J. Appl. Crystallogr. 2021, 54, 1006–1011. [Google Scholar] [CrossRef]
  30. Geetha, D.V.; Harisha, A.S.; Karthik, V.; Chandana, S.N.; Kavitha, H.D.; Lakshminarayana, B.N.; Sridhar, M.A. X-Ray Structural Analysis, Quantum Chemical Computations, Molecular Docking, and Molecular Dynamics Simulations of Diethyl 5′-Amino-3,3-Dibromo-2,6-Dicyano1,2,3,4-Tetrahydro-[1,1.3,1-Terphenyl] 2,4-Dicarboxylate. J. Mol. Struct. 2026, 1351, 144142. [Google Scholar] [CrossRef]
  31. Rösel, S.; Quanz, H.; Logemann, C.; Becker, J.; Mossou, E.; Cañadillas-Delgado, L.; Caldeweyher, E.; Grimme, S.; Schreiner, P.R. London Dispersion Enables the Shortest Intermolecular Hydrocarbon H⋯H Contact. J. Am. Chem. Soc. 2017, 139, 7428–7431. [Google Scholar] [CrossRef]
  32. Zaharieva, J.; Videva, V.; Kolarski, M.; Lyapchev, R.; Morgenstern, B.; Tsvetkov, M. A Para-Substituted 2-Phenoxy-1,10-Phenanthroline Ligand for Lanthanide Sensitization: Asymmetric Coordination and Enhanced Emission from Eu3+, Tb3+, Sm3+ and Dy3+ Complexes. Molecules 2025, 30, 3548. [Google Scholar] [CrossRef]
  33. Mazumdar, P.; Das, D.; Sahoo, G.P.; Salgado-Morán, G.; Misra, A. Aggregation Induced Emission Enhancement from Bathophenanthroline Microstructures and Its Potential Use as Sensor of Mercury Ions in Water. Phys. Chem. Chem. Phys. 2014, 16, 6283. [Google Scholar] [CrossRef]
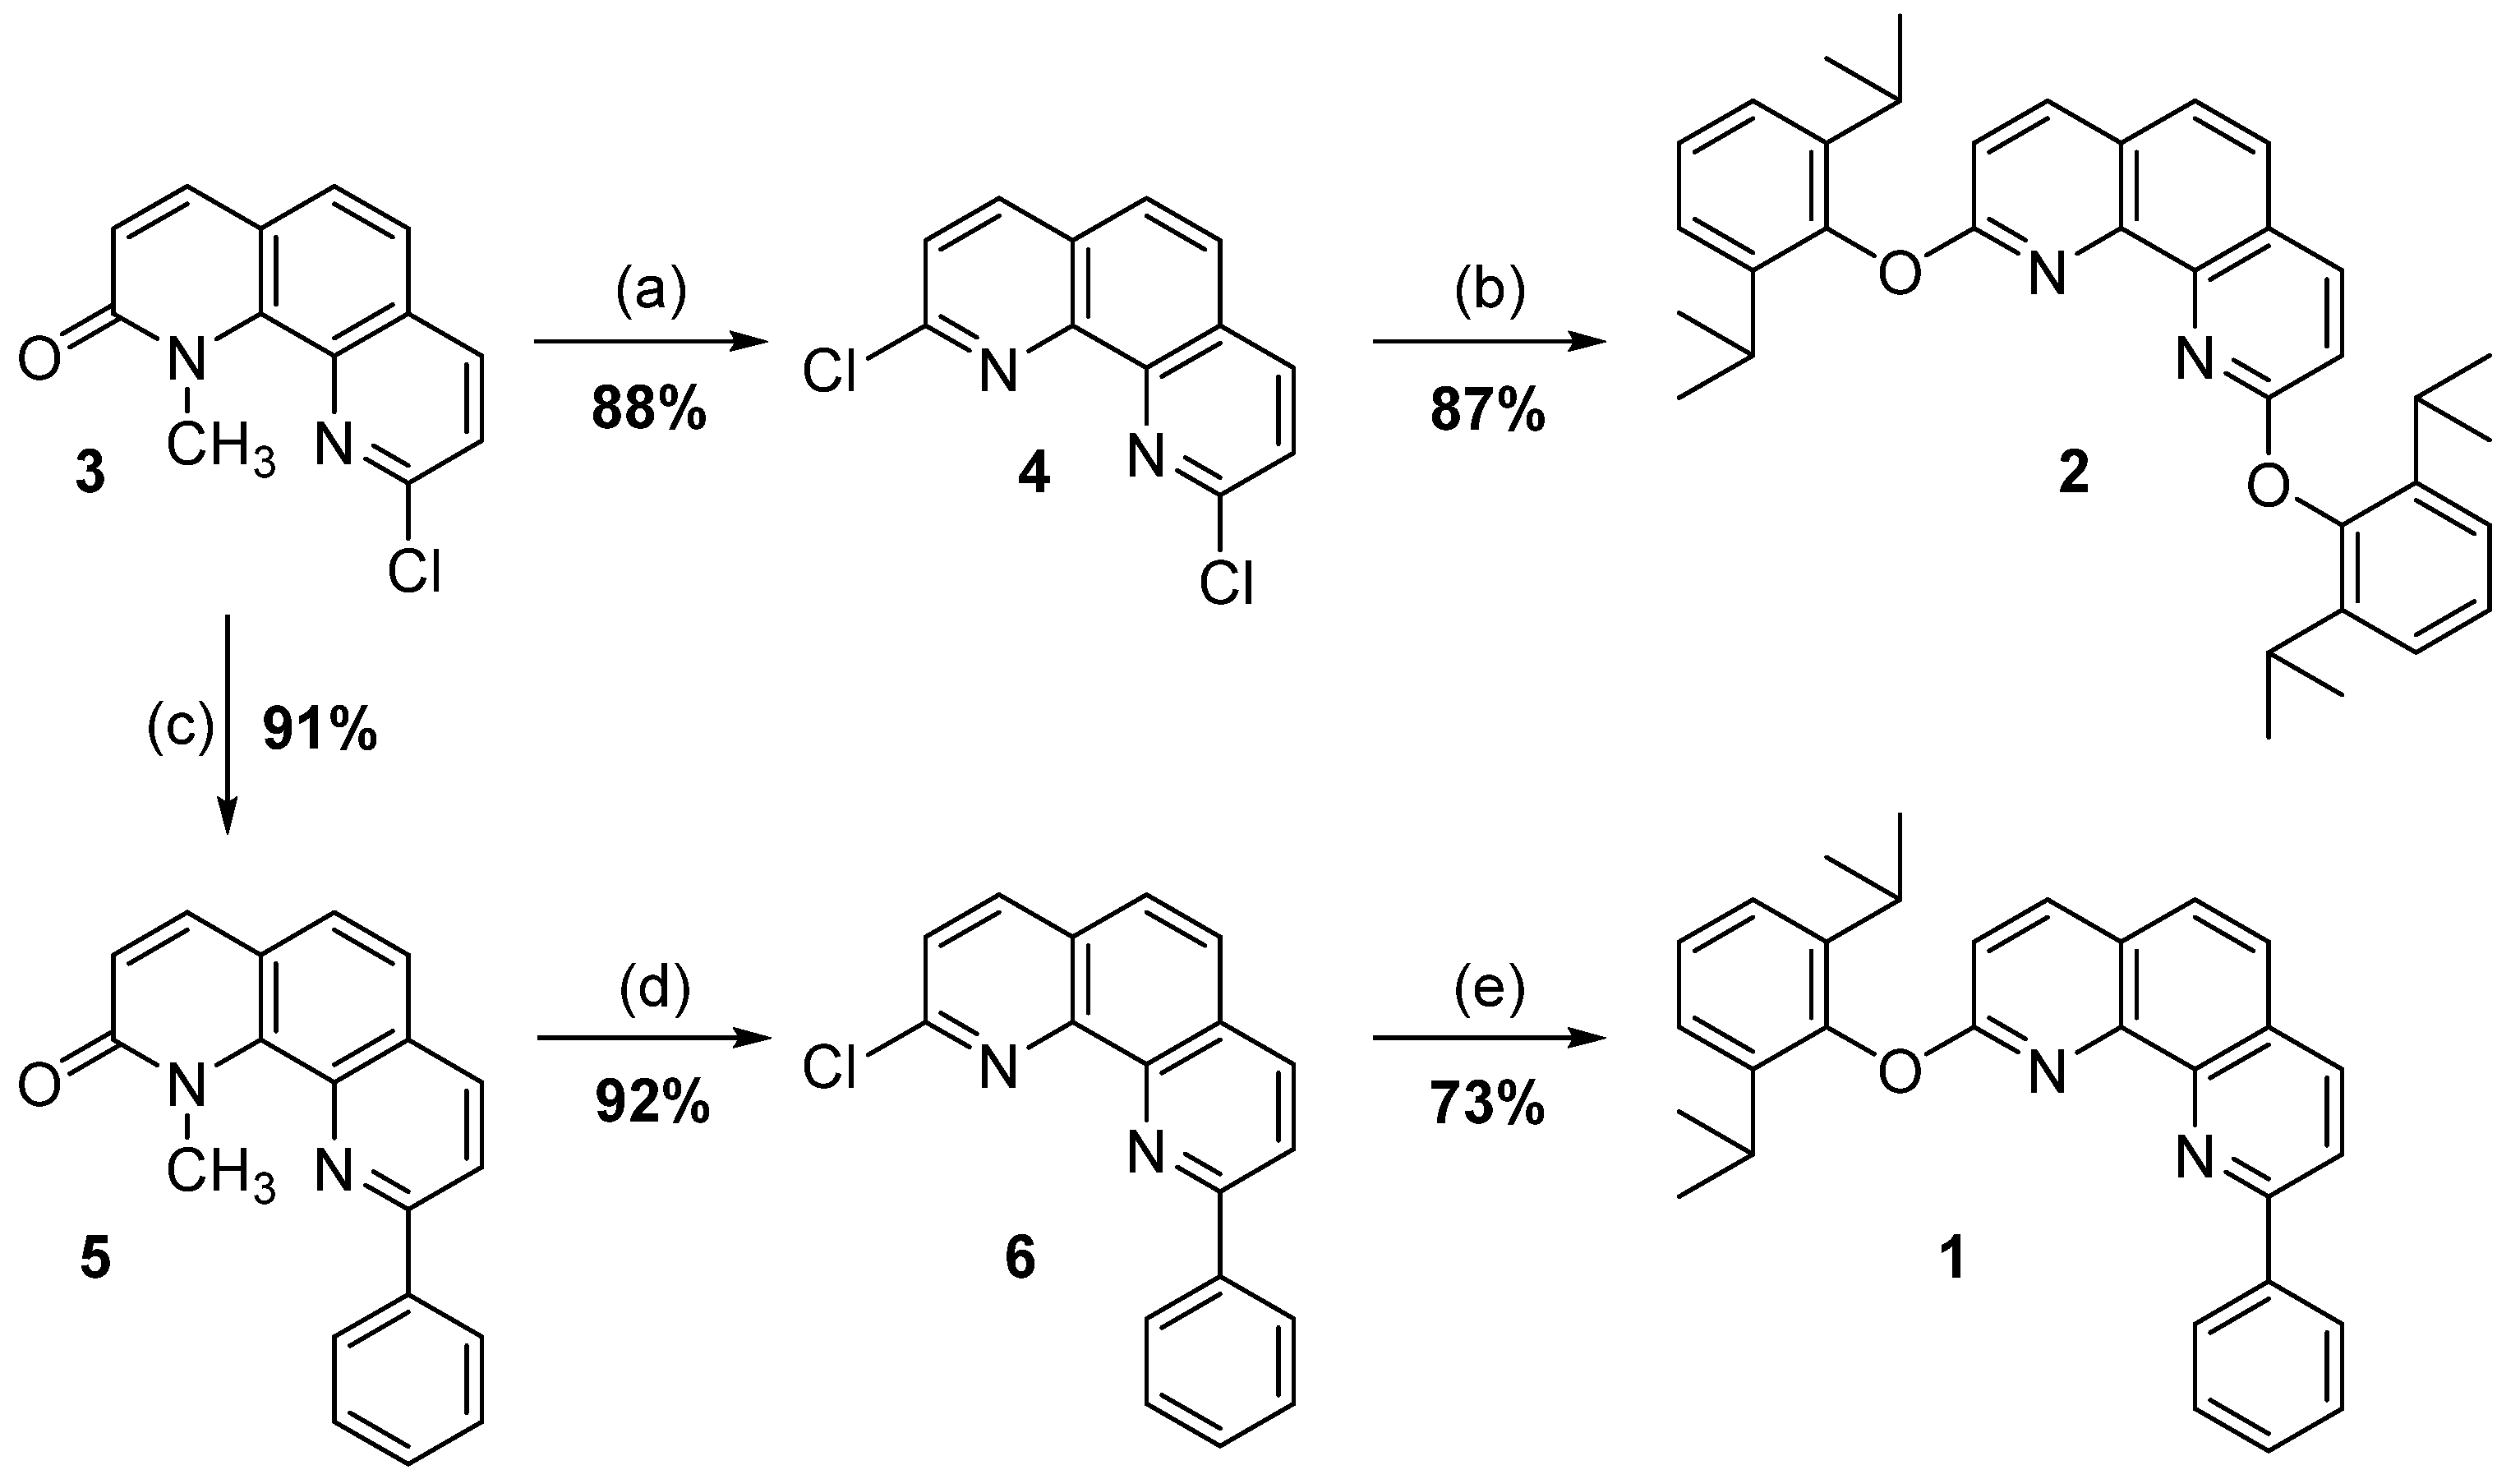
Scheme 1. Synthesis of 2,9-bis(2,6-diisopropylphenoxy)-1,10-phenanthroline (2) and 2-(2,6-diisopropylphenoxy)-9-phenyl-1,10-phenanthroline (1): (a) POCl3, reflux, 8 h; (b) 2,6-diisopropylphenol, K2CO3, NMP, inert atmosphere, 160 °C, 24 h; (c) PhB(OH)2, Na2CO3·10H2O, PdCl2(PPh3)2, H2O, EtOH, toluene, inert atmosphere, 80 °C, 18 h; (d) POCl3, reflux, 9.5 h; (e) 2,6-diisopropylphenol, K2CO3, NMP, inert atmosphere, 160 °C, 22 h.
Crystals 15 00883 sch001
Figure 1. The molecular structure with atom labeling of compound 1. Displacement ellipsoids are drawn at the 50% probability level, and the H-atoms are omitted for clarity.
Crystals 15 00883 g001
Figure 2. The molecular structure with atom labeling of compound 2. Displacement ellipsoids are drawn at the 50% probability level, and the H-atoms are omitted for clarity.
Crystals 15 00883 g002
Figure 3. Hirshfeld surface of compound 1 mapped over dnorm: (a) first view, (b) second view, and (c) the two-dimensional finger plots for the asymmetric unit of interactions greater than 10%.
Crystals 15 00883 g003
Figure 4. (a) Hirshfeld surface of compound 2 mapped over dnorm and (b) two-dimensional finger plots for the asymmetric unit of interactions greater than 10%.
Crystals 15 00883 g004
Figure 5. FTIR spectra of the title compounds (a) in the 4000–400 cm−1 and (b) selected region 2000–400 cm−1.
Crystals 15 00883 g005
Figure 6. UV–Vis absorption spectra of (a) 1 and (b) 2 recorded in different solvents (c = 1 × 10⁻⁴ M).
Crystals 15 00883 g006
Figure 7. Excitation spectra of 1 in (a) hexane at 10−3, 10−4 and 10−5 M (λem = 380 nm) and (b) in different solvents (10−4, λem = 380 nm).
Crystals 15 00883 g007
Figure 8. Excitation spectra of 2 in (a) hexane at 10−3, 10−4 and 10−5 M (λem = 380 nm) and (b) in different solvents (10−4, λem = 380 nm).
Crystals 15 00883 g008
Figure 9. Emission spectra of 1 (λ_ex = 330 nm) in (a) acetonitrile and in different solvents, shown as raw (b) and normalized (c) intensity profiles (c = 1 × 10⁻⁴ M).
Crystals 15 00883 g009
Figure 10. Emission spectra of 2 (λ_ex = 325 nm) in (a) acetonitrile and in different solvents, shown as raw (b) and normalized (c) intensity profiles (c = 1 × 10⁻⁴ M).
Crystals 15 00883 g010
Table 1. Crystal structure and refinement data of the obtained molecules.
Compound 1Compound 2
CCDC numbers24863092486310
Crystal data
Empirical formulaC30H28N2OC36H40N2O2
Molecular weight, (g/mol)432.54921.17
Crystal system, space groupTriclinic, P 1 ¯ Monoclinic, C2/c
Temperature (K)143(2)143(2)
a, b, c (Å)7.7988(3),
10.0248(4),
16.6885(7)
17.9825(4),
11.8411(3),
15.5954(6)
α, β, γ (°)73.3110(10),
77.2500(10),
72.8410(10)
90.0,
115.3900(10),
90.0
V, (Å3)1180.89(8)3000.02(16)
Z24
Radiation typeMo KαMo Kα
μ, (mm−1)0.0740.072
Crystal size (mm)0.200 × 0.180 × 0.0800.200 × 0.200 × 0.080
Data collection
DiffractometerBruker D8 VentureBruker D8 Venture
Absorption correctionMulti-scan,
SADABS [27]
Multi-scan,
SADABS [27]
Tmin, Tmax0.6944, 0.74550.7224. 0.7455
No. of measured, independent and observed [I > 2σ(I)] reflections32,237, 4364, 366331,989, 3319, 2889
Rint0.03060.0356
Refinement
R[F2 > 2σ(F2)], wR(F2), S0.0427, 0.1013, 1.0610.0396, 0.1010, 1.014
No. of reflections43643319
No. of restrains00
No. of parameters302185
H-atom treatmentH-atom parameters constrainedH-atom parameters constrained
Δρmax, Δρmin (e Å−3)0.187, −0.2030.241, −0.245
Table 2. Selected IR absorption bands and assignments for 1 and 2.
Wavenumber (cm−1)AssignmentCompound 1Compound 2
≈3050Aromatic C–H stretching√ (strong)√ (weak)
≈2960Aliphatic C–H (iPr, asym)√ (strong)√ (strong)
≈2870Aliphatic C–H (iPr, sym)√ (strong)√ (strong)
≈1600C=C/C=N aromatic ring stretching√ (strong)√ (strong)
≈1500C=C ring stretching/phenanthroline√ (strong)√ (strong)
≈1460C–H bending (iPr, CH3)√ (strong)√ (medium)
≈1380C–H bending (iPr, CH(CH3)2)√ (strong)√ (strong)
≈1250, ≈1180, ≈1080C–O–C (aryl–O stretching)√ (strong, medium, strong)√ (weak, strong, strong)
≈880, ≈690Aromatic C–H out-of-plane bending√ (medium, strong)√ (medium, strong)
≈750Aromatic C–H out-of-plane bending (1,2-disubst.)√ (strong)√ (strong)
Table 3. Short-wavelength UV–Vis absorption maxima (230–260 nm) of 1 and 2 (c = 1 × 10⁻⁴ M, l = 1 cm) in solvents ordered by polarity (ET(30))1. Reported are λmax, absorbance (A), and molar absorptivity (ε).
SolventCompound 1Compound 2
λmax (nm)Aε
(L·mol−1·cm−1)
λmax (nm)Aε
(L·mol−1·cm−1)
Hexane236.03.06130,610233.03.25332,530
Cyclohexane237.03.71237,120233.03.55135,510
DCM237.03.87838,780235.03.08730,870
AcN235.03.40934,090232.03.15331,530
Ethanol230.04.32543,250233.02.36423,640
Solvents are ordered according to Reichardt’s ET(30) parameter (in kcal·mol−1), which reflects solvent polarity based on the solvatochromic shift in a pyridinium N-phenoxide betaine dye.
Table 4. Long-wavelength UV–Vis absorption maxima (280–320 nm) of 1 and 2 (c = 1 × 10⁻⁴ M, l = 1 cm) in solvents ordered by polarity (ET(30)). Reported are λmax, absorbance (A), and molar absorptivity (ε).
SolventCompound 1Compound 2
λmax (nm)Aε
(L·mol−1·cm−1)
λmax (nm)Aε
(L·mol−1·cm−1)
Hexane298.02.40624,060287.01.66416,640
Cyclohexane298.02.96629,660287.01.80518,050
Toluene299.02.25030,030288.01.68016,800
Chloroform300.03.47434,740290.02.21022,100
DCM298.03.55735,570288.01.96719,670
DMSO299.02.25822,580287.00.9099090
AcN296.02.68926,890285.01.68316,830
Ethanol297.04.06340,630286.01.19211,920
Disclaimer/Publisher’s Note: The statements, opinions and data contained in all publications are solely those of the individual author(s) and contributor(s) and not of MDPI and/or the editor(s). MDPI and/or the editor(s) disclaim responsibility for any injury to people or property resulting from any ideas, methods, instructions or products referred to in the content.