Abstract
The control of crystal form in chiral active pharmaceutical ingredients (APIs) is a critical challenge in pharmaceutical development, as differences in solid-state structure can significantly influence physical properties and manufacturing performance. Troglitazone, a molecule with two chiral centers, exists as four stereoisomers (RR, SS, RS, SR) that crystallize as two enantiomeric pairs: RR/SS and RS/SR. This study aims to elucidate the relationship between solution-state molecular interactions and crystallization behavior of these diastereomeric pairs. Antisolvent crystallization experiments were conducted for both mixed solutions containing all four isomers and solutions of individual pairs. Crystallization kinetics were monitored by HPLC, and the resulting solids were characterized by PXRD, DSC, TG, and microscopic observation. Nucleation induction times were determined over a range of supersaturation levels. To probe intermolecular interactions in solution, NOESY and targeted NOE NMR experiments were performed, and the results were compared with crystallographic data. The RS/SR crystals(H-form) consistently exhibited shorter induction times and faster crystallization rates than the RR/SS crystals (L-form), even under conditions where RR/SS solutions were more supersaturated. In mixed solutions, H-form crystallized preferentially, with L-form either remaining in solution or being incorporated into H-form crystals as a solid solution. NOESY and NOE analyses revealed intermolecular proximities between protons that are distant in the molecular structure, indicating the presence of ordered aggregates in solution. These aggregates were more structurally compatible with the H-form than with the L-form crystal lattice, as supported by crystallographic distance analysis. The results demonstrate that differences in nucleation kinetics between troglitazone diastereomers are closely linked to solution-state molecular arrangements. Understanding these relationships provides a molecular-level basis for the rational design of selective crystallization processes for chiral APIs.
1. Introduction
The physicochemical properties of active pharmaceutical ingredients (APIs) are widely recognized to strongly depend on their solid-state forms. Although an API has a single molecular structure, it can exist in multiple solid forms, including crystalline polymorphs, hydrates, solvates, and amorphous states. Differences between these phases significantly impact formulation performance [1,2,3]. For example, certain polymorphs may exhibit higher solubility compared to others, while another polymorph might possess a more stable crystal structure, making it suitable for long-term storage. These variations in solid-state properties profoundly influence the behavior of pharmaceuticals during manufacturing, distribution, and administration.
The diversity in solid-state forms is a critical factor in formulation design, quality assurance, and regulatory compliance. International guidelines, such as ICH Q6A, emphasize the need for detailed characterization of solid-state properties, including polymorphic information for APIs. Moreover, controlling the crystal form is essential to ensure reproducibility in pharmaceutical processes and facilitate successful scale-up [4,5,6]. Consequently, accurately understanding the crystallization behavior of APIs and developing technologies to selectively obtain the desired crystal forms are fundamental and strategic challenges in pharmaceutical research and development.
In the case of chiral compounds, APIs can exist as enantiomers or diastereomers. Each of these isomers may form distinct solid-state structures. Since these isomers not only exhibit differences in physicochemical properties but also in biological activity and metabolic behavior, precise control and separation are essential. Over the past few decades, advancements in chromatographic methods and asymmetric synthesis have significantly enhanced enantiomer separation. Furthermore, chiral crystallization, a method leveraging the solid state for separation, remains an effective approach as well [7,8,9,10,11,12,13,14].
The crystallization of diastereomers, as well as enantiomers, is particularly emphasized in industrial crystallization, as it takes advantage of differences in properties such as solubility and crystallization kinetics to achieve separation. Recently, technologies applicable to chiral separation have advanced, including attrition-enhanced deracemization [15], selective crystallization using temperature cycling [16], and co-crystallization to induce selectivity [17]. However, each of these methods has specific limitations. For instance, some approaches require a rapid racemization reaction in solution, while others rely on the selection of suitable coformers.
In recent years, it has been reported that molecular interactions in solution significantly influence the selectivity of solid-state formation. This highlights the importance of a precise understanding of solution structures, as well as thermodynamic and kinetic factors, as a key to achieving selective crystallization. Consequently, research on chiral crystallization targeting diastereomeric systems presents a sophisticated challenge that demands the integration of extensive knowledge, spanning from fundamental principles to applied methodologies.
In this study, troglitazone, an antidiabetic drug with two chiral carbons, was selected as a model compound. Troglitazone has four stereoisomers: RR, SS, RS, and SR. According to the study by Kobayashi et al. [18], troglitazone can exist in various solid-state forms, including hydrates, solvates, anhydrous forms, and even mixed crystals of diastereomers. Under crystallization conditions using poor solvents, crystals composed of RR/SS and RS/SR were observed to precipitate. The crystals derived from RR/SS were identified as low-melting hydrates (L-form), while those derived from RS/SR were identified as a high-melting anhydrous form (H-form) [19]. These findings suggest that differences in molecular structure and hydration state are reflected in the thermal properties and crystal stability of the compounds, making troglitazone a valuable model system for the comparative study of isomers.
Given that these isomers exhibit significant differences in crystallization behavior, melting points, and solubility, they are well-suited for research on separation and crystallization techniques that exploit the physical property differences between diastereomers [20,21].
Previous studies on troglitazone have yielded significant findings, including crystallographic analysis of individual isomers, evaluations of physical properties such as melting points and solubility, and investigations into the thermal behavior of mixed crystals. However, a comprehensive understanding of intermolecular interactions in solution and their effects on the rates of crystal nucleation, growth, and morphological selectivity remains elusive.
In recent years, the analysis of solution structures using NMR techniques, particularly NOE, has facilitated the observation of intermolecular distances and spatial configurations. These analyses have demonstrated the potential of solution-state structures to predict crystallization behavior. From the NOESY spectra, it becomes possible to evaluate the affinities and aggregation tendencies between specific isomers, as well as the differences in their interactions with molecules.
This study aims to elucidate the relationship between solution structures and crystallization behavior by measuring and comparing the induction times of nucleation and NOESY spectra of the racemic forms of troglitazone’s RS/SR and RR/SS solutions. In particular, by elucidating how differences in induction times are associated with the spatial configurations of the molecules, this study seeks to deepen our understanding of crystallization mechanisms.
The results of this study have the potential to not only provide guidance for the rational control of crystal form selection in pharmaceutical manufacturing processes but also contribute to the development of novel approaches for controlling the crystallization behavior of chiral compounds at the molecular level.
2. Materials and Methods
2.1. Materials
The model compound troglitazone used in this study was provided by Daiichi Sankyo Co., Ltd. (Figure 1). The four diastereomers of troglitazone (RR, SS, RS, and SR) were used without further purification. Acetone and other analytical-grade reagents were purchased from Fujifilm Wako Pure Chemical Corporation (Osaka, Japan) and used in crystallization experiments and NMR measurements. Purified water was obtained from a Millipore system. For NMR spectroscopy, deuterated solvents acetone-d6 and deuterium oxide (D2O) were obtained from Cambridge Isotope Laboratories and used as received.
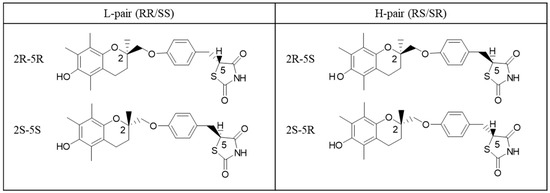
Figure 1.
Structural formulas of troglitazone stereoisomers (L-pair: RR/SS; H-pair: RS/SR).
2.2. Crystallization Experiments
To compare crystallization behavior, antisolvent crystallization experiments were conducted using an acetone–water system. The four diastereomers of troglitazone (RR, SS, RS, SR) were mixed in an equimolar ratio (1:1:1:1).
Each crystallization experiment was performed on a 50 mL scale. Troglitazone diastereomers (3.2 g in total) were completely dissolved in 35 mL of acetone, followed by the addition of 15 mL of water at a constant rate of 60 mL/min under continuous stirring 250 rpm. Crystallization was carried out at a controlled temperature of 25.0 ± 0.1 °C.
2.3. Measurement of Troglitazone Concentration
To analyze the crystallization process, the concentration of troglitazone in solution was measured during crystallization. Samples were collected at regular intervals and filtered through a membrane filter (0.2 µm, Toyo Roshi Kaisha, Ltd., Tokyo, Japan). The filtrate was then diluted to an appropriate concentration and analyzed using high-performance liquid chromatography (HPLC) with an Agilent 1100 system (Agilent Technologies, Santa Clara, CA, USA). The detection wavelength was set at 285 nm.
The concentration of each enantiomer was determined using a CHIRALCEL OJ-RH column (4.6 mm i.d. × 150 mm, Daicel Corporation, Osaka, Japan) with a mobile phase consisting of methanol and acetic acid (1000:1, v/v), as previously reported [19]. The column temperature was maintained at 25 °C, and the flow rate was set at 0.5 mL/min. Based on the concentration profiles obtained under these conditions, the crystallization rate, nucleation induction period, and crystal growth progress of each isomer were evaluated.
2.4. Nucleation Induction Time Measurement
The induction time for antisolvent crystallization at various levels of supersaturation was measured. A schematic diagram of the apparatus used for induction time measurement is shown in Figure 2. A glass cell containing the solution was placed in the apparatus, which allowed precise temperature control. The temperature was maintained within ±0.1 °C using a Peltier element and continuously monitored.
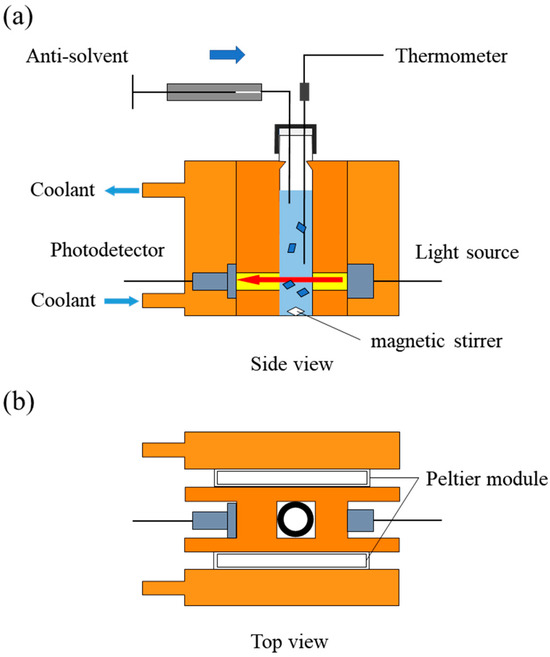
Figure 2.
Schematic diagrams of the apparatus for detecting the nucleation induction period. (a) Side view; (b) Top view. The solution temperature is precisely controlled by a Peltier element, stirred with a magnetic stirrer, and monitored for both temperature and turbidity. The antisolvent is injected using a syringe pump to induce nucleation.
To detect solution turbidity, a light source and a photodetector were positioned on opposite sides of the apparatus. A digital amplifier (Optex FA Co., Ltd., Kyoto, Japan) was used in conjunction with the light source and photodetector. Light was introduced into the cell via a fiber-optic probe, and the transmitted light intensity was recorded. The system’s turbidity sensitivity was verified using a formazin suspension, confirming the ability to detect turbidity as low as 0.1 ppm.
For induction time measurement, a fixed amount of troglitazone crystals was dissolved in acetone and filtered through a membrane filter. The solution was transferred into a 2 mL glass cell, which was then placed in the apparatus and equilibrated at 25 °C for at least 90 s. Antisolvent crystallization was initiated by adding water to the system while maintaining the temperature at 25 °C. The solution was stirred using a magnetic stirrer. Nucleation was detected by monitoring the decrease in transmitted light intensity. The induction time was defined as the time interval between the completion of antisolvent addition and the onset of light intensity reduction.
2.5. Analysis of Solution Structure by NMR
Nuclear magnetic resonance (NMR) spectroscopy was employed to investigate the intermolecular interactions of troglitazone in supersaturated solutions. Measurements were conducted using a Varian 500 MHz NMR spectrometer (Varian Inc., Palo Alto, CA, USA) equipped with a 5 mm dual broadband probe (1H–19F/15N–31P). The temperature was maintained at 25 °C. In addition to one-dimensional 1H NMR, two-dimensional NOESY (Nuclear Overhauser Effect Spectroscopy) and NOE experiments targeting specific functional groups were performed to assess both intra- and intermolecular proton interactions. Data acquisition and analysis were carried out using Varian VnmrJ 2.1B software, which provided spectral phase and baseline correction as well as peak identification. The acetone/water ratio of the analyzed solutions ranged from 0.1 to 0.3 (v/v).
2.6. XRD Measurements
The obtained crystals were characterized by powder X-ray diffraction, and the resulting diffraction patterns were compared with previously reported crystal structures of H-form and L-form. Measurements were conducted using MiniFlex (Rigaku, Japan) with Cu-Kα radiation (λ = 1.5406 Å). Samples were mounted on a flat glass substrate. The diffracted X-ray intensity was recorded over a 2θ range of 3° to 40° using a one-dimensional detector.
2.7. Microscopic Observation of Crystal Appearance
An BX51 upright microscope (Olympus Optical Co., Ltd., Tokyo, Japan) was used for polarized optical microscopy. Objective lenses with 10× and 40× magnification were used for observation, and images were captured using a Canon digital camera (EOS Kiss Digital X, Canon. Inc., Tokyo, Japan).
A VE-8800 scanning electron microscope (Keyence Corp., Osaka, Japan) was employed for microstructural observation. Measurements were performed in high-vacuum mode, with the accelerating voltage set between 0.5 and 20 kV.
2.8. Thermal Analysis (DSC and TG)
Thermal analyses were performed using differential scanning calorimetry (DSC) and thermogravimetric analysis (TG), both conducted with instruments manufactured by Rigaku Corporation. Approximately 10 mg of each sample was placed in an open aluminum pan and heated from room temperature to 220 °C at a constant rate of 10 °C/min. Both DSC and TG measurements were carried out under a dry nitrogen atmosphere with a flow rate of 50 mL/min. The thermal behavior and mass changes of the samples were simultaneously monitored. The resulting data were processed using Rigaku’s proprietary analysis software to quantitatively evaluate the thermal properties.
3. Results and Discussion
3.1. Morphology and XRD Patterns of RR/SS and RS/SR Crystals
After separating troglitazone into its four isomers, acetone solutions containing only the RR/SS or the RS/SR were prepared. Water was then added to each solution as an anti-solvent to induce crystallization. The resulting crystals were observed by optical microscopy and SEM, and their structures were identified by XRD.
As shown in Figure 3a–d, the crystals obtained from the RR/SS or the RS/SR solutions of troglitazone were both plate-like; however, their shapes and surface textures differed noticeably. The crystals in Figure 3a,b, crystallized from pure RR/SS solution, exhibited a rectangular morphology with a large difference between the lengths of the long and short sides, resulting in a high aspect ratio (long side/short side). In contrast, the crystals in Figure 3c,d, crystallized from pure RS/SR solution, displayed nearly equal length and width, with aspect ratios close to 1, forming numerous plate-like crystals of an almost square shape.
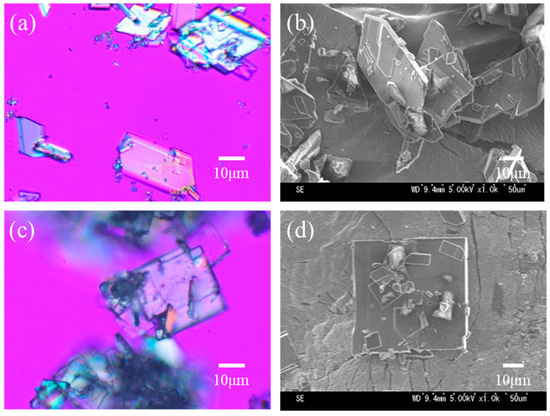
Figure 3.
Optical and SEM images of crystals from RR/SS (a,b) and RS/SR (c,d) solutions.
XRD analysis revealed a characteristic diffraction peak at 2θ = 8.7°, 10.4°, 10.9° for the RR/SS and at 2θ = 9.3°, 13.2°, 17.8° for the RS/SR in Figure 4. These peaks matched the XRD patterns of crystals reported in previous studies [18,19]. Therefore, hereafter, crystals composed of RR/SS are referred to as L-form, and those composed of RS/SR as H-form.
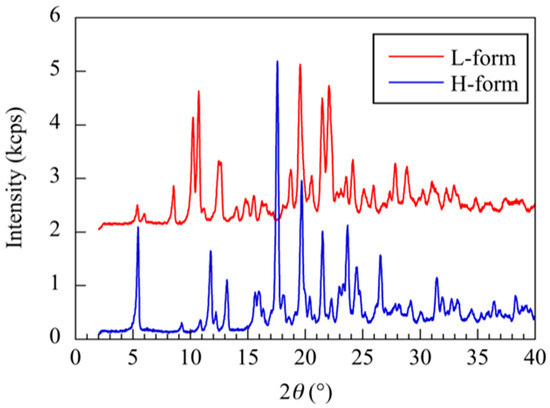
Figure 4.
XRD profiles of troglitazone crystals from RR/SS and RS/SR solutions.
3.2. Crystallization Behavior from a Mixed Solution of Troglitazone’s Four Isomers
An acetone solution containing a mixture of troglitazone’s four isomers (RR, SS, RS, SR) at a concentration of 16 mg/mL each was prepared. This corresponds to an initial concentration of 32 mg/mL for the RR/SS and 32 mg/mL for the RS/SR. Antisolvent crystallization was then performed by adding water. Figure 5 shows the change in concentration over time during crystallization, starting from the moment of water addition. Triangles indicate the RR/SS, and circles indicate the RS/SR. Approximately 30 min after the addition of water, the concentrations began to decrease, indicating that nucleation from the supersaturated solution had occurred. In particular, the concentration of the RS/SR decreased rapidly within about 200 min after antisolvent addition. At the same time, the concentration of the RR/SS also decreased. The decrease in both concentrations, with the RS/SR showing a more pronounced drop, suggests that the crystals of both pairs precipitated simultaneously, but with different nucleation and growth rates.
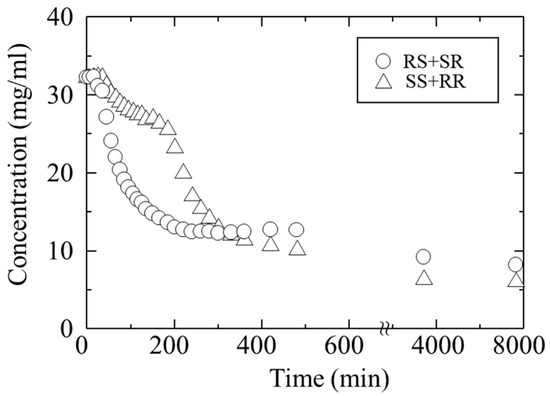
Figure 5.
Changes in the concentration of troglitazone during crystallization from a solution containing all four isomers. The concentrations of RR/SS and RS/SR were plotted separately.
The crystals precipitated after about 200 min were collected. To determine the composition of RR/SS and RS/SR in the obtained crystals, the crystals were dissolved and analyzed by HPLC, revealing an L:H ratio of 16.4:83.6. Figure 6a shows the XRD pattern of the obtained crystals. The pattern was identical to that of the H-form even though a conglomerate of H-form and L-form crystals was expected. Although the solution concentration of the RR/SS also decreased during crystallization, no XRD peaks attributable to the L-form were observed. This suggests that RR/SS molecules may have either remained in the mother liquor or been incorporated into H-form crystals in an amorphous state or solid solution state. TG analysis of the crystals showed no weight loss due to solvent release, indicating that any incorporated RR/SS molecules were present without solvent.
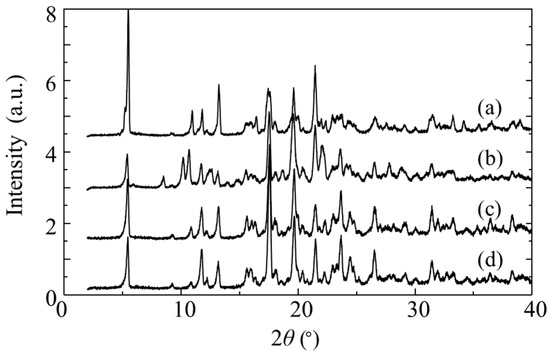
Figure 6.
XRD patterns of troglitazone crystals: (a) after 200 min crystallization from a four-isomer solution; (b) after 6 days from the same solution; (c) recrystallized from (a); (d) recrystallized from (c).
DSC measurements were also performed. The pure H-form has a heat of fusion of 126 J/g at its melting point [19]. If the L-form were incorporated into the H-form crystals in an amorphous state at the measured composition, the expected heat of fusion would be approximately 105 J/g. However, the obtained crystals exhibited a heat of fusion of 116 J/g, which is higher than this expected value. This indicates that the RR/SS is not present in the crystals as an amorphous inclusion. Instead, the results suggest that the obtained material appears to be a solid solution composed of both RS/SR and RR/SS.
After 200 min, the decrease in RS/SR concentration approached a steady state, while the RR/SS concentration began to decrease rapidly. XRD analysis of the final crystals obtained at this stage revealed a mixture of L-form and H-form phases (Figure 6b). This indicates that the nucleation and growth of L-form began after 200 min, suggesting that the onset of L-form crystallization was delayed compared to that of H-form. The two-stage change in RR/SS concentration can be explained by their incorporation into H-form and their crystallization.
The resulting crystals were dissolved in acetone and subjected to antisolvent crystallization once more. The L:H ratio of the obtained crystals was 7.4:92.6, indicating an increased proportion of the RS/SR. Repeating the same crystallization procedure yielded crystals with an L:H ratio of 0.3:99.7. Remarkably, despite this substantial change in isomer ratio, no diffraction peaks attributable to L-form crystals were detected in the PXRD patterns; all patterns were consistent with the H-form (Figure 6c,d). These results suggest that the RS/SR isomers are stably arranged within the crystal lattice, with a small amount of the RR/SS isomer incorporated as a solid solution.
3.3. Crystallization from Pure RS/SR or RR/SS Solutions
Because the crystallization behavior of troglitazone solutions containing all four isomers was complex, we investigated the crystallization of RS/SR and RR/SS solutions separately. Figure 7 shows the time course of concentration changes when each diastereomer pair (RS/SR and RR/SS) was crystallized individually (their solids correspond to H-form and L-form). The initial concentration of each isomer was 16 mg/mL, corresponding to 32 mg/mL for each pair.
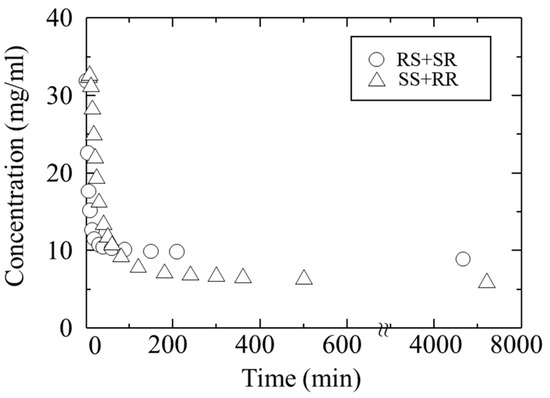
Figure 7.
Changes in the concentration of troglitazone during crystallization from the RR/SS solution and the RS/SR solution.
Upon addition of the antisolvent, the concentration decreased immediately. For the RS/SR solution, the decrease began approximately 2 min after antisolvent addition, and crystallization proceeded rapidly thereafter. In contrast, the RR/SS solution exhibited slower nucleation, with the concentration beginning to decrease about 10 min later. These results highlight two notable differences compared with the crystallization from the mixed solution of all four isomers: the overall crystallization rate was significantly faster, and a distinct difference in the rate of decrease between RS/SR and RR/SS was observed.
As crystallization progressed in both systems, the concentrations gradually approached steady values, eventually reaching constant levels corresponding to their respective solubilities.
3.4. Measurement of Induction Time for the Onset of Crystallization
Crystallization from solutions of RS/SR or RR/SS proceeded faster than from mixed solutions containing all four isomers. To quantitatively evaluate the induction time required for the onset of crystallization of RS/SR and RR/SS, experiments were conducted under various conditions. Solutions with different saturation ratios (S = C/Cs) were prepared by adjusting the solvent composition and initial concentration. The induction period—defined as the time from the generation of supersaturation to the appearance of detectable crystal precipitation—was measured.
For quantitative comparison, the induction times were plotted against to the supersaturation ratios in Figure 8. The induction time decreased with increasing saturation ratio for both isomers. However, at the same saturation ratio, L-form exhibited a substantially longer induction time than H-form. Nucleation of H-form occurred relatively early, indicating a short induction time and a greater tendency for rapid crystallization onset. In contrast, the induction time for L-form was roughly ten times longer, resulting in a pronounced delay in nucleation.
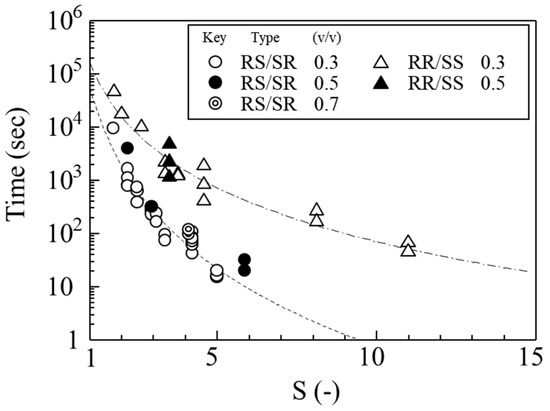
Figure 8.
Effect of supersaturation on the induction time for nucleation. Circles indicate induction times from RS/SR solutions, and triangles indicate induction times from RR/SS solutions. Experiments were performed at various solvent ratios (water/(acetone + water)).
During antisolvent crystallization, the solubility of L-form was approximately 20% lower than that of H-form. This means that, at the same concentration, the saturation ratio of L-form was about 20% higher, placing it in a more supersaturated state. Nevertheless, because the nucleation induction time of L-form was about ten times longer, it crystallized markedly more slowly even under high supersaturation. The time-dependent concentration changes shown in Figure 5 suggest that this behavior reflects differences in the ease of forming precursor structures in solution and the sensitivity of each isomer’s nucleation process to crystallization conditions.
3.5. Evaluation of Intermolecular Interactions Using NOESY Spectra
The markedly different nucleation induction times observed for L-form and H-form are thought to arise from differences in their intermolecular interactions in solution. To examine these interactions, NMR measurements were conducted. Figure 9a shows the protons assigned from the downfield side according to the structure of the troglitazone molecule. Figure 9b shows the corresponding NOESY spectrum, with proton numbers matching those in Figure 9a. Protons H12 and H13 were not detected due to hydrogen exchange with the deuterated solvent.
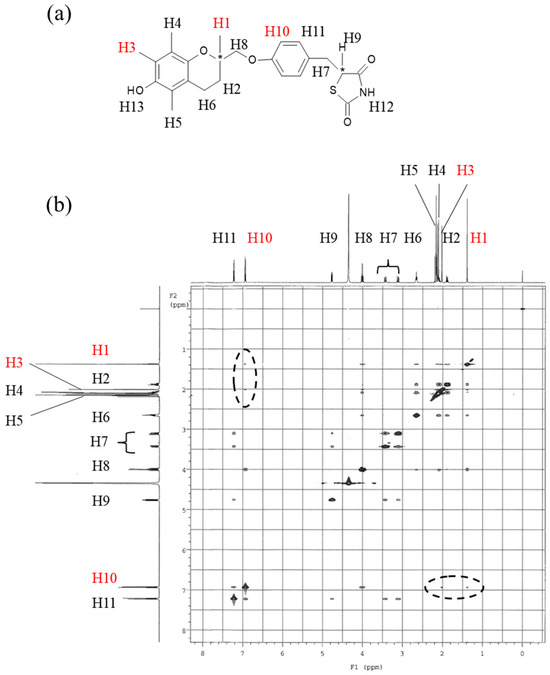
Figure 9.
NOESY spectrum of the RR/SS solution. RR/SS crystals were dissolved in acetone-d6. (a) Structural formula of troglitazone with hydrogen atoms numbered according to the 1D NMR spectrum from the upfield region. Asterisks (*) indicate the presence of chiral carbon centers. (b) NOESY spectrum of the solution. The dotted circle highlights the NOESY cross-peaks of interest.
In the NOESY spectrum, multiple cross-peaks were observed between protons H1 and H11, indicating close intramolecular spatial proximity. Clear NOEs were also detected between protons H1 and H10, and between protons H3 and H10. In the molecular structure, these protons are positioned far apart, making it unlikely for such NOESY correlations to arise from typical intramolecular distances. The strong cross-peaks observed between these protons therefore suggest that they are in close spatial proximity due to intermolecular interactions in solution.
To investigate further, we measured the NOE (Nuclear Overhauser Effect) intensities between H1–H10 and H3–H10 of the troglitazone molecule under different saturation ratios and solvent compositions. For NOE measurements, saturation irradiation was applied to the H10 proton (chemical shift 6.896 ppm). Figure 10a,b show the saturation ratio (S) on the horizontal axis and NOE intensity on the vertical axis, with results obtained for RS/SR and RR/SS at solvent composition of water/(acetone + water) = 0.0, 0.1, 0.2, and 0.3, respectively.
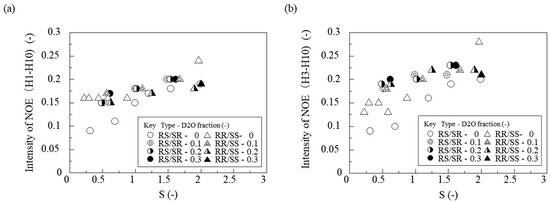
Figure 10.
Effects of supersaturation on the NOE intensity. To control the supersaturation, D2O was added to the troglitazone/acetone solution. (a) NOE intensity between H1 and H10; (b) between H3 and H10.
For both RR/SS and RS/SR, the NOE signals between H1 and H10 and between H3 and H10 became stronger as the saturation ratio increased. Because NOE intensity depends on concentration, the observed NOE signals are due to intermolecular proximity. This indicates that for both RR/SS and RS/SR troglitazone, higher saturation leads to more molecules showing close intermolecular contact between H1 and H10 as well as H3 and H10, and possibly to stronger intermolecular interactions. Furthermore, regardless of solvent composition, higher supersaturation increased the number of molecules that interact closely with each other.
NOE signals were observed between H1 and H10, even though these protons are far apart in a single molecule. This suggests that in solution the molecules take on specific orientations that bring these protons close together. In other words, the data imply the formation of aggregate structures in which these interproton distances are shortened, potentially serving as crystallization precursors.
Therefore, structural information obtained in solution by NOESY and NOE spectroscopy provides important insight for predicting crystallization behavior and elucidating intermolecular interactions.
3.6. Comparison Between the Crystal Structure and the Solution Structure
The crystal structures of both H-form and L-form have been determined, and their crystallographic data have been reported [18]. We compared these crystal structure data with the NOESY and NOE results, focusing on the interproton distances corresponding to the observed correlations (Figure 11a,b). In the H-form crystal structure, the interproton distance between H1 and H10 (between SR and RS molecules) was 2.304 Å, and that between H3 and H10 (between SR and RS molecules) was 2.384 Å. These distances are short, even among closely spaced intermolecular hydrogen atoms. In contrast, in the L-form crystal structure, the interproton distance between H1 and H10 was 3.334 Å (between RR and SS molecules), and that between H3 and H10 was 3.626 Å (between RR and RR molecules), both longer than in the H-form crystal structure.
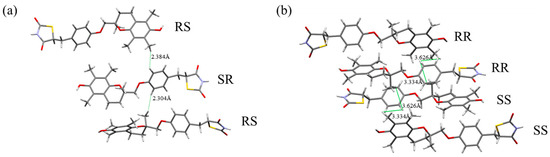
Figure 11.
Steric relationships between molecules in the crystal. The distances between hydrogen atoms (H1–H10, H3–H10) detectable by NOE are shown. (a) H-form (RS/SR); (b) L-form (RR/SS).
Thus, the interproton distances between H1–H10 and H3–H10, where NOEs were detected, are shorter in the H-form crystal structure. This suggests that the intermolecular interactions in solution before crystallization resemble those in the H-form crystal structure rather than those in the L-form crystal structure. Previous studies have shown that conformational preferences in solution can be reflected in crystal packing, thereby influencing nucleation and polymorphism [22]. The present findings might reflect this solution–crystal structure relationship. The fact that nucleation of the H-form proceeds about ten times faster than that of the L-form may possibly be explained by a structural similarity between the solution state and the crystalline state. The short distances between hydrogen atoms in the crystal structure strongly support a correlation between the arrangement of molecules in solution and in the crystal lattice.
4. Conclusions
In this study, we investigated the crystallization behavior of the four diastereomers of troglitazone (RR, SS, RS, SR), focusing on the two enantiomeric pairs, RR/SS and RS/SR. Crystallization experiments from mixed- and single-pair solutions revealed pronounced differences in nucleation induction times, crystallization rates, and final crystal compositions. In mixed solutions, the H-form nucleated and crystallized earlier, with RR/SS either incorporating into H-form crystals or nucleating at a later stage. Repeated recrystallization enriched the RS/SR fraction, and PXRD patterns consistently matched the H-form, indicating that RR/SS can be incorporated into H-form crystals as a solid solution.
Induction time measurements under varying supersaturation demonstrated that L-form nucleation was roughly ten times slower than that of H-form, despite L-form’s lower solubility and higher supersaturation under identical concentrations. This kinetic difference is attributed to variations in molecular association behavior in solution. NOESY and NOE analyses revealed intermolecular proximities between protons that are spatially distant in the molecular structure, implying the formation of aggregate structures in solution that may act as crystallization precursors. Both RR/SS and RS/SR showed increased intermolecular proximity with higher supersaturation, but the shorter induction time of H-form suggests that its solution aggregates are more structurally compatible with its crystalline arrangement.
Comparison of the solution-state NOE correlations with crystallographic data confirmed that the interproton distances observed in solution are closer to those in the H-form crystal structure than in the L-form crystal structure. Shorter intermolecular H···H distances in the H-form crystal lattice likely facilitate a more direct structural transition from solution aggregates to the crystalline state, explaining its faster nucleation.
Overall, this study demonstrates that differences in crystallization kinetics between troglitazone diastereomers are closely related to their solution-state structures and intermolecular interactions. These findings highlight the importance of characterizing solution structures to predict and control crystallization behavior, offering a molecular-level basis for designing selective crystallization processes in chiral pharmaceutical compounds.
Author Contributions
Conceptualization, S.M., K.I., M.A. and H.O.; methodology, S.M., K.I. and H.O.; investigation, S.M.; formal analysis, S.M.; writing—original draft preparation, S.M.; writing—review and editing, S.M. and K.I.; visualization, S.M.; supervision, K.I. and H.O. All authors have read and agreed to the published version of the manuscript.
Funding
This research received no external funding.
Data Availability Statement
The original contributions presented in this study are included in the article. Further inquiries can be directed to the corresponding author.
Acknowledgments
The authors thank Daiichi Sankyo Co., Ltd. for providing troglitazone samples.
Conflicts of Interest
Author S.M. is an employee of Daiichi Sankyo. H.O. is an employee of Kansai Chemical Engineering. The other authors declare no conflicts of interest.
References
- Bernstein, J. Polymorphism in Molecular Crystals; Oxford University Press: Oxford, UK, 2002; pp. 1–425. [Google Scholar]
- Hilfiker, R. (Ed.) Polymorphism in the Pharmaceutical Industry; Wiley-VCH: Weinheim, Germany, 2006; pp. 1–558. [Google Scholar]
- Gao, P. Amorphous pharmaceutical solids: Characterization, stabilization, and development of marketable formulations of poorly soluble drugs with improved oral absorption. Mol. Pharm. 2008, 5, 903–904. [Google Scholar] [CrossRef] [PubMed]
- International Council for Harmonisation (ICH). Q6A: Specifications—Test Procedures and Acceptance Criteria for New Drug Substances and New Drug Products: Chemical Substances; ICH: Geneva, Switzerland, 1999. [Google Scholar]
- U.S. Food and Drug Administration (FDA). Guidance for Industry: ANDAs—Pharmaceutical Solid Polymorphism, Chemistry, Manufacturing, and Controls Information; FDA: Silver Spring, MD, USA, 2007. [Google Scholar]
- Burcham, C.L.; Rogerson, T.; Kopcha, W.P.; Schaber, S.D.; Skomorowski, A.C.; Sammarco, T.S.; Kishnani, S.S.; Hart, A.; Li, Y.; Sun, D.; et al. Pharmaceutical digital design: From chemical structure through crystal polymorph to conceptual crystallization process. Cryst. Growth Des. 2024, 24, 5417–5438. [Google Scholar] [CrossRef]
- Nguyen, L.A.; He, H.; Pham-Huy, C. Chiral drugs: An overview. Int. J. Biomed. Sci. 2006, 2, 85–100. [Google Scholar] [CrossRef] [PubMed]
- Ciriani, M.; Oliveira, R.; Afonso, C.A.M. Semi-continuous and continuous processes for enantiomeric separation. Green Chem. 2022, 24, 4328–4362. [Google Scholar] [CrossRef]
- Sui, J.; Zhao, W.; Li, W.; Zhang, Y.; Jiang, Z. Strategies for chiral separation: From racemate to enantiomer. Chem. Sci. 2023, 14, 6117–6138. [Google Scholar] [CrossRef] [PubMed]
- Bosits, M.H.; Pavkov-Keller, T.; Lendl, B.; Seidel-Morgenstern, A.; Schwagerus, S.; Vetter, T. Design of diastereomeric salt resolution via multicomponent system characterization: A case study with hydrate formation. CrystEngComm 2023, 25, 1234–1248. [Google Scholar] [CrossRef]
- Putman, J.I.; Armstrong, D.W. Recent advances in the field of chiral crystallization. Chirality 2022, 34, 1338–1354. [Google Scholar] [CrossRef] [PubMed]
- Teng, Y.; Gu, C.; Chen, Z.; Jiang, H.; Xiong, Y.; Liu, D.; Xiao, D. Advances and applications of chiral resolution in pharmaceutical field. Chirality 2022, 34, 1094–1119. [Google Scholar] [CrossRef] [PubMed]
- Orehek, J.; Teslic, D.; Likozar, B. Continuous crystallization processes in pharmaceutical manufacturing: A review. Org. Process Res. Dev. 2020, 25, 16–42. [Google Scholar] [CrossRef]
- Al-Sulaimi, S.; Kushwah, R.; Abdullah Alsibani, M.; El Jery, A.; Aldrdery, M.; Ashraf, G.A. Emerging developments in separation techniques and analysis of chiral pharmaceuticals. Molecules 2023, 28, 6175. [Google Scholar] [CrossRef] [PubMed]
- Noorduin, W.L.; Kaptein, B.; Meekes, H.; Blackmond, D.G.; Kellogg, R.M.; Vlieg, E. The driving mechanism behind attrition-enhanced deracemization. Angew. Chem. Int. Ed. 2010, 49, 8435–8438. [Google Scholar] [CrossRef] [PubMed]
- Intaraboonrod, K.; Lerdwiriyanupap, T.; Hoquante, M.; Coquerel, G.; Flood, A.E. Temperature cycle induced deracemization. Mendeleev Commun. 2020, 30, 395–405. [Google Scholar] [CrossRef]
- Springuel, G.; Leyssens, T. Innovative chiral resolution using enantiospecific co-crystallization in solution. Cryst. Growth Des. 2012, 12, 3374–3378. [Google Scholar] [CrossRef]
- Kobayashi, Y.; Ito, S.; Itai, S.; Yamamoto, K. Physicochemical properties and crystal structure of troglitazone polymorphs. Chem. Pharm. Bull. 2003, 51, 807–814. [Google Scholar] [CrossRef] [PubMed]
- Suzuki, N.; Kasahara, K.; Hasegawa, H.; Kawasaki, T. Physical property of troglitazone, an equal mixture of four stereoisomers. Int. J. Pharm. 2002, 248, 71–80. [Google Scholar] [CrossRef]
- Faigl, F.; Fogassy, E.; Nógrádi, M.; Pálovics, E.; Schindler, J. Separation of non-racemic mixtures of enantiomers: An essential part of optical resolution. Org. Biomol. Chem. 2010, 8, 947–959. [Google Scholar] [CrossRef]
- Furuyama, N.; Hasegawa, S.; Yada, S.; Hamaura, T.; Wakiyama, N.; Yonemochi, E.; Terada, K.; Buckton, G. Do amorphous troglitazones prepared from two diastereomer-pairs have the same molecular mobility and crystallization rate at the surface? Chem. Pharm. Bull. 2011, 59, 1452–1457. [Google Scholar] [CrossRef] [PubMed][Green Version]
- Maruyama, S.; Ooshima, H. Crystallization behavior of taltirelin polymorphs in a mixture of water and methanol. J. Cryst. Growth 2000, 212, 239–245. [Google Scholar] [CrossRef]


Disclaimer/Publisher’s Note: The statements, opinions and data contained in all publications are solely those of the individual author(s) and contributor(s) and not of MDPI and/or the editor(s). MDPI and/or the editor(s) disclaim responsibility for any injury to people or property resulting from any ideas, methods, instructions or products referred to in the content. |
© 2025 by the authors. Licensee MDPI, Basel, Switzerland. This article is an open access article distributed under the terms and conditions of the Creative Commons Attribution (CC BY) license (https://creativecommons.org/licenses/by/4.0/).