Abstract
Improving the isotropic magnetic properties of FeSi electrical steels has traditionally focused on enhancing their crystallographic texture and microstructural morphology. Strengthening the cube texture within a ferritic matrix of optimal grain size is known to reduce core losses and increase magnetic induction. However, conventional cold rolling followed by annealing remains insufficient to optimise the magnetic performance of thin FeSi strips fully. This study explores an alternative approach based on grain boundary migration driven by temperature gradients combined with deformation gradients, either across the sheet thickness or between neighbouring grains, in thin, weakly deformed non-oriented (NO) electrical steel sheets. The concept relies on deformation-induced grain growth supported by rapid heat transport to promote the preferential formation of coarse grains with favourable orientations. Experimental material consisted of vacuum-degassed FeSi steel with low silicon content. Controlled deformation was introduced by temper rolling at room temperature with 2–40% thickness reductions, followed by rapid recrystallisation annealing at 950 °C. Microstructure, texture, and residual strain distributions were analysed using inverse pole figure (IPF) maps, kernel average misorientation (KAM) maps, and orientation distribution function (ODF) sections derived from electron backscattered diffraction (EBSD) data. This combined thermomechanical treatment produced coarse-grained microstructures with an enhanced cube texture component, reducing coercivity from 162 A/m to 65 A/m. These results demonstrate that temper rolling combined with dynamic annealing can surpass the limitations of conventional processing routes for NO FeSi steels.
1. Introduction
Electrical steels are FeSi alloys containing between approximately 0.5 and 6.5 wt% silicon. As soft magnetic materials, they are widely used as core components in various electromagnetic applications for the generation, distribution, and utilisation of electrical energy. FeSi steels are polycrystalline materials and possess a ferritic crystalline structure with cubic symmetry [1,2,3]. The magnetic behaviour, as well as the plastic deformation distribution in body-centred cubic (BCC) single crystals, varies considerably depending on the orientation of magnetisation or the direction of applied external stress relative to the crystal axes. This well-known phenomenon, referred to as anisotropy, describes the directional dependence of material properties [4,5].
Due to the characteristics of the BCC crystal lattice, ferritic electrical steels are classified into grain-oriented (GO) and non-oriented (NO) grades, depending on their crystallographic texture and intended application. GO steels have exceptional microstructures composed of more than centimetre-sized grains, with their crystal lattices in so-called Goss orientation {110}<001>. This orientation results in low power losses and high permeability along the rolling direction, making GO steels the material of choice for high-efficiency transformers [6].
In contrast, NO silicon steels exhibit nearly identical magnetic properties in all plane directions and are primarily used as core materials for stators and rotors in rotating electrical machinery such as motors and generators. Consequently, the energy conversion efficiency of such machines is strongly influenced by the magnetic properties of the core material, which, in turn, depend on its microstructure and crystallographic texture [7]. Isotropic magnetic properties in FeSi steels can be achieved through the development of a so-called “rotated cube” texture, defined by the {100}<0vw> crystallographic orientation [8].
In recent decades, there has been a growing global emphasis on environmentally friendly and renewable energy sources, particularly those related to the efficient production and safe use of electricity. In this context, non-oriented silicon steels have gained considerable importance in the energy and electrical engineering industries due to their excellent magnetic properties, adequate mechanical strength, and widespread availability, owing to the abundance of Fe and Si in the Earth’s crust [9,10].
As electrical steel sheets are extensively used in electric motors and generators, their necessary property requirements include high magnetic saturation, sufficient mechanical strength, excellent magnetic isotropy, low power loss, high magnetic permeability, and relatively low manufacturing cost. For NO steels, the key factors influencing final magnetic performance are the grain morphology of the microstructural matrix, crystallographic texture, sheet thickness, and silicon content in solid solution. The optimal NO steel would have a grain size of approximately 150–250 μm, a cubic crystallographic texture {100}<0vw>, as small as possible sheet thickness, and a maximised silicon content [11,12,13,14,15]. However, achieving this exact combination remains unfeasible with current FeSi steel manufacturing technologies.
Commercially available electrical steels offer a wide range of magnetic and mechanical properties to meet diverse industrial needs. Steels with superior magnetic performance typically contain 3.0–3.5 wt.% silicon, have sheet thicknesses between 0.5 mm and 0.3 mm, and possess optimised microstructure and texture to ensure magnetic isotropy. Increasing the silicon content above 3.5 wt.% significantly strengthens the material through solid solution hardening but also causes significant embrittlement during final cold rolling [16,17,18]. Therefore, one of the perspectives and scientifically grounded routes for improving the final properties of industrially produced NO steels, without altering their chemical composition or reducing sheet thickness, is to increase the average grain size of the microstructural matrix and enhance the intensity of the “rotated” cube texture {100}<0vw>.
Much of the literature [19,20,21,22,23,24] on FeSi steel development focuses on improving microstructural and textural characteristics in combination with optimal alloying strategies, including the addition of Si, Al, and Mn, which also influence mechanical properties. From a mechanical standpoint, critical parameters include tensile strength, yield strength, and fatigue strength in both the rolling directions (RD) and transverse directions (TD). Previous studies [25,26,27,28] have shown that various combinations of deformation processing, annealing regimes, and decarburization treatments under different atmospheres can promote the formation of coarse-grained or columnar microstructures with desirable crystallographic textures in thin isotropic FeSi steel sheets.
A literature review in this research area [29,30,31] has shown that many scientific studies have focused on the development of microstructure and texture in NO steels in the cold-rolled state, followed by final annealing. In general, grain growth is associated with the processes of primary and secondary recrystallisation. The conditions for these phenomena are directed by the degree of deformation introduced during cold rolling and by subsequent heat treatment parameters, including target temperature, holding time, and heating rate.
Sidor et al. [32] demonstrated that columnar grain growth can be achieved through a diffusion-controlled process during decarburization annealing of thin strips of cold-rolled NO electrical steels with a carbon content of approximately 0.03 wt.%. Their results showed that, with an appropriate combination of annealing temperature, heat treatment time, and heating rate, a microstructural matrix consisting of columnar grains growing in a controlled manner from the sheet surface toward its centre can be obtained.
Subsequently, Gutiérrez Castañeda et al. [33] reported the selective growth of columnar grains in hot-rolled low-silicon steels under the combined influence of the strain-induced grain boundary migration (SIGM) mechanism and a diffusion-controlled phase transformation process. In their study, a fully coarse-grained columnar microstructure was achieved at relatively low temperature (approximately 850 °C) within 3 h.
Kwon et al. [34] indicated that a high temperature gradient in a pure hydrogen atmosphere can generate a substantial strain energy difference across grain boundaries during the γ–α phase transformation, promoting the formation of {100}-textured columnar grains. Similar observations have been reported in numerous other works over the past several decades [35,36,37]. Based on these studies, it can be concluded that selective grain growth with columnar structures occurs during the γ–α phase transformation in silicon steels containing more than 0.01 wt.% carbon. This allows diffusion-controlled grain growth from the sheet surface toward its centre within the temperature range of approximately 700–900 °C.
Our earlier studies [38,39,40,41] focused on the mechanism of strain-induced selective grain growth in relation to the accumulated deformation introduced by temper rolling. In non-oriented silicon steels subjected to soft cold rolling (2–6% thickness reduction), a matrix of columnar or coarsened grains containing randomly distributed grains with a pronounced rotated cube crystallographic orientation was achieved only at very high heating rates. The results further showed that annealing temperatures above 900 °C were required. Under such dynamic heat-treatment conditions, the resulting microstructure and texture significantly improved magnetic properties, namely core losses and coercivity. This approach not only enhanced the magnetic performance of NO steels but also reduced production costs for end users.
In contrast, previous studies [42,43,44] have explored unconventional cold rolling schemes, such as varying rolling angles relative to the rolling direction, followed by conventional low heating-rate annealing. By comparison, our proposed method employs conventional temper rolling after primary recrystallisation, followed by an unconventional second annealing step under dynamic heating conditions, i.e., at exceptionally high heating rates. Supporting evidence from other works [45,46,47] has shown that rapid annealing can substantially increase average grain size and markedly improve the crystallographic texture of electrical steels after hot and/or cold rolling.
This study examines the fundamental principles of strain-induced selective growth of ferrite grains in low-silicon isotropic electrical steels, which have a final microstructure originally intended by the manufacturer for use as core materials in electrical devices. The aim is to demonstrate the possibility of improving the magnetic properties of sheets in their final state solely by enhancing their microstructural and textural parameters, without significantly increasing production costs through additional thermomechanical processing. Our approach is based on exploiting non-equilibrium physical processes associated with the formation of mechanical stress gradients and local temperature variations within different regions of the crystal lattice in a polycrystalline microstructural matrix. Such states in thin electrical steel sheets are achieved through cold rolling followed by short-term heat treatment with extremely high heating rates. This process enables the improvement of the size and morphology of the microstructural grains while simultaneously increasing the fraction of grains with a cubic crystallographic lattice plane {011} lying in the plane of the sheet.
2. Materials and Methods
This study was conducted using experimental samples prepared from thin, non-oriented electrical steel sheets in the fully finished state of M530-50A grade, in accordance with EN 10106 [48]. The initial thickness of the investigated strips was 0.5 mm, which was gradually reduced depending on the degree of applied external deformation during temper rolling. The experimental steel was produced under industrial conditions using the vacuum-degassed method, with the following chemical composition (wt.%): Fe = 98.21%, C = 0.005%, Si = 1.23%, Mn = 0.18%, P = 0.050%, Al = 0.23%, and other elements ~0.095%. As evident, the selected steel belongs to the category of low-silicon non-oriented steels.
For the experimental procedures, the supplied steel sheets were cut into strips with dimensions of 200 × 20 × 0.50 mm, as shown in Figure 1. The longest dimension of these rectangular samples was aligned parallel to the rolling direction (RD) of the sheet plane.
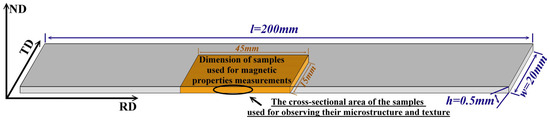
Figure 1.
Dimensions of experimental samples used in this scientific work for thermo-mechanical treatment, EBSD analysis and magnetic measurements.
Subsequently, plastic deformation was introduced into the prepared samples through a cold rolling process at room temperature. The rolling was performed using a Durston DRM C130 rolling mill. The strips were rolled with thickness reductions of 2%, 4%, 6%, 8%, 10%, and 40%.
Short-duration dynamic heat treatments were subsequently applied to each sample to investigate grain growth phenomena in fully finished non-oriented (NO) silicon steel, with particular focus on the combined effects of strain-induced grain boundary migration and heat flow. For microstructural, textural, and magnetic analyses, the samples were heat-treated in a Nabertherm RS 120/1000/13 electric resistance furnace (Nabertherm GmbH, Lilienthal, Germany) under laboratory conditions. The annealing of the experimental samples was carried out by heating them to target temperatures of 850 °C, 900 °C, and 950 °C within 10 min in a dry hydrogen atmosphere. Heat treatment was performed in a laboratory tube furnace equipped with a ceramic tube (130 mm in diameter and 1500 mm in length). The furnace was programmed to produce a central heating zone approximately 300 mm long, where the target temperatures were maintained. The end regions of the tube, including the sample insertion area, remained at room temperature while maintaining the same hydrogen atmosphere as in the heating zone. This temperature distribution allowed rapid insertion of samples directly into the heated zone. A thermocouple was attached to the surface of each sample to continuously record its temperature from insertion into the heating zone until reaching the target temperature (850 °C, 900 °C, or 950 °C), using a KIMO TM210 device (Kimo Electronic Pvt. Ltd., Mumbai, India). Based on these measurements, the heating rate was calculated to be approximately 20 ± 1 °C/s. After completion of the heat treatment, the samples were moved to the cooler end of the tube and allowed to cool to room temperature in the same annealing atmosphere at a rate of approximately 5 ± 0.5 °C/s.
Microstructural evolution across the cross-section of samples subjected to the selected thermomechanical conditions was examined using an OLYMPUS GX71 light optical microscope (LOM) (OLYMPUS Europa Holding GmbH, Hamburg, Germany). The average grain size of the resulting microstructures was determined using the open-source metallographic analysis software ImageJ version 1.54p.
Crystallographic texture and local mechanical stresses in the BCC lattice were characterized by Electron Backscattered Diffraction. Local mechanical stresses in the cross-section of cold-rolled samples were evaluated using Kernel Average Misorientation maps, derived from EBSD data, which represent the strain accumulated in the crystal lattice. Crystallographic texture before and after thermomechanical treatment was analyzed using Inverse Pole Figure maps and Orientation Distribution Functions at Euler angle φ2 = 45°. EBSD measurements were performed on the cross-sections of the samples (Figure 1) using a JEOL JSM 7000F FEG scanning electron microscope (SEM) (Jeol Ltd., Tokyo, Japan) equipped with a Nordlys-I EBSD detector (HKL Technology A/S, Hobro, Denmark). Data processing was carried out using the CHANNEL 5 software package (HKL, Service Pack 7).
The metallographic preparation of samples was carried out in two steps: grinding and polishing. Grinding was performed under wet conditions using silicon carbide abrasive papers with grit sizes of 500, 800, 1200, and 2400. Subsequent polishing was conducted on a cloth substrate using a 1 μm diamond suspension. After polishing, samples prepared for optical microscopy were etched with 5% nital (a solution of nitric acid in ethanol) to expose the microstructure. Samples prepared for EBSD analysis were additionally treated with a 0.25 μm colloidal silica suspension following polishing.
Magnetic measurements were performed to evaluate the influence of processing conditions on the resulting microstructure and texture. Rectangular specimens (45 mm × 15 mm) were prepared by electrical discharge machining using a spark erosion machine (EIR-EMO 2N, Emotek s.r.o., Nové Mesto nad Váhom, Slovakia) from cold-rolled strips cut along the rolling direction (RD) (Figure 1). Magnetic properties under and alternating current (AC) magnetic fields were measured using a Brockhaus MPG 100D magnetic measurement system (Dr. Brockhaus Messtechnik GmbH & Co. KG, Lüdenscheid, Germany). AC hysteresis loop measurements were performed at 50 Hz.
3. Results and Discussion
3.1. Microstructure and Texture of the Fully Finished Initial State
It is well known that FeSi alloys with a single-phase ferritic structure exhibit grain size as a key factor influencing both watt losses and crystallographic texture, thereby affecting the directional isotropy of magnetic properties in the sheet plane. EBSD analysis provides a powerful means of characterising both the morphology of the microstructural matrix and the spatial orientation of the crystal lattice in individual grains. In this study, grain size and crystallographic orientation were evaluated on cross-sections of the sheet plane parallel to the RD, as illustrated in Figure 1. A coloured IPF map of the microstructural matrix for the fully finished initial samples is shown in Figure 2a. The primary recrystallised microstructure consists of grains of varying shapes and sizes, ranging from 15 µm to 120 µm, randomly distributed across the cross-section. Image analysis determined the average grain size to be approximately 32 ± 3 µm. The crystallographic planes are represented by three colours in the IPF map, red for {100} planes, green for {101} planes, and blue for {111} planes, as indicated by the legend in the upper right corner of the IPF map. From the data in Figure 2a, these three colours appear to be uniformly distributed among the observed grains.
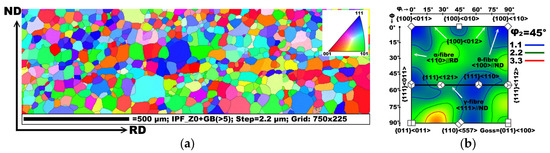
Figure 2.
The initial microstructure and crystallographic texture of the experimental samples in their final, fully finished state as received from the industrial production line: (a) IPF map, (b) ODF section.
More detailed information on the crystallographic texture is provided by the Orientation Distribution Function section at Euler angle φ2 = 45°. The ODF describes the volume fraction of grains associated with specific crystallographic orientations in a polycrystalline specimen. The coloured ODF section in Figure 2b highlights the α-, γ-, and θ-fibres corresponding to the principal texture components of the investigated FeSi steel in the fully finished state. The initial microstructure exhibits a pronounced rotated cube texture component {111}<012>, along with orientations near the Goss texture {011}<100> and components lying mainly between the γ- and θ-fibres. Additionally, a strong peak is observed for a component between {011}<011> and {110}<557>, which results from rotation of the {011} plane of the Goss texture within the sheet plane. Overall, the fully finished state is characterised by fine grains and a relatively high intensity of a broad spectrum of crystallographic components.
3.2. Evolution of Microstructure of Heat Treated Samples
The evolution of the microstructure in the experimental samples, subjected to varying rolling reductions followed by annealing at three different temperatures, is presented in Figure 3. Metallographic cross-sections were examined using light optical microscopy, with the longitudinal section oriented parallel to the rolling direction. The results show that the samples exhibit a ferritic microstructure with grain size and morphology strongly dependent on the applied processing conditions. The variation in the average grain size with deformation and annealing temperature is shown graphically in Figure 4.
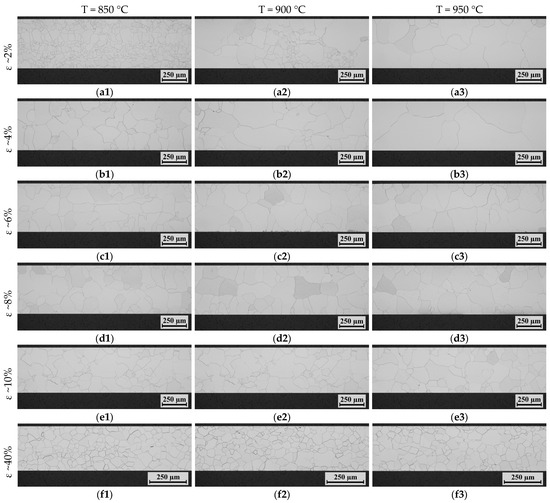
Figure 3.
Microstructural variations in individual experimental samples subjected to thickness reductions of 2%, 4%, 6%, 8%, 10%, and 40%, followed by subsequent annealing under dynamic conditions at 850 °C, 900 °C, and 950 °C. The letters under the microstructures (a, b, c, d, e, and f) correspond to the applied deformation levels of 2%, 4%, 6%, 8%, 10%, and 40%, respectively. The numbers following these letters (1, 2, and 3) indicate the annealing temperatures of 850 °C, 900 °C, and 950 °C, respectively.
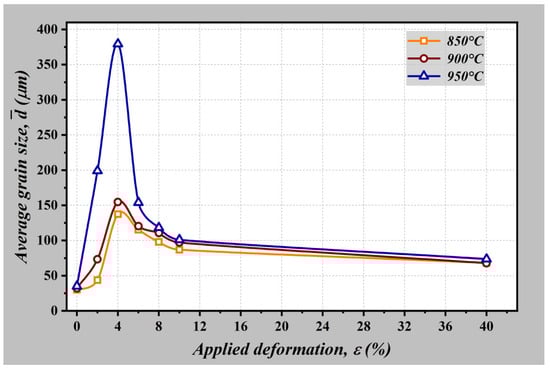
Figure 4.
Evolution of the average grain size of the investigated steel as a function of applied deformation and annealing temperature.
For samples with a temper rolling reduction of ~2%, microstructural changes were highly sensitive to annealing temperature. At 850 °C (Figure 3a1), the microstructure closely resembled that of the initial sample (Figure 2a), with an average grain size of 43.5 ± 3.6 µm, indicating only minor growth. Annealing at 900 °C (Figure 3a2) produced an inhomogeneous grain size distribution (average 73.3 ± 5.2 µm), with two distinct regions: coarse grains of 150–250 µm occupying over 50% of the cross-section, and smaller primary recrystallized grains scattered between them. At 950 °C (Figure 3a3), a nearly homogeneous coarse-grained microstructure formed, with grains of similar size and shape uniformly distributed across the section. Image analysis gave an average grain size of 199 ± 10 µm. These observations show that even minimal deformation can strongly influence microstructural evolution during higher-temperature annealing, with increasing temperature developing coarser, more uniform grains, desirable for soft magnetic FeSi alloys.
The microstructures of samples subjected to 4% deformation and annealed at the three selected temperatures are shown in Figure 3b1–b3. All exhibit secondary recrystallized microstructures with approximately uniform grain distribution morphology across the cross-section, but with notable differences in average grain size. The smallest grains (137.4 ± 7 µm) were obtained after annealing at 850 °C, while the largest (379.3 ± 15 µm) formed at 950 °C. The sample annealed at 900 °C (Figure 3b2) showed an average grain size of 154.6 ± 5 µm, only slightly larger than at 850 °C; however, several grains exceeded the mean size by several times, indicating mild inhomogeneity in the secondary recrystallization process. The 950 °C sample (Figure 3b3) displayed exceptionally large grains, many with a columnar morphology, suggesting that their growth during dynamic recrystallization annealing likely initiated at the sheet surface.
The optical analysis results for samples subjected to 6% temper rolling deformation followed by heat treatment are presented in Figure 3c1–c3. Morphological analysis of these microstructures reveals no significant differences among them. The observed light-optical microstructures generally display a uniform grain distribution without notable variations in grain size. At first glance, it is evident that increasing the annealing temperature leads to a slight increase in the average grain size—a trend also reflected in the graph shown in Figure 4. Image analysis confirms that the average grain sizes for the samples (ε~6%) annealed at 850 °C, 900 °C, and 950 °C are approximately 115.2 ± 6 µm, 120.4 ± 7 µm, and 153.9 ± 11 µm, respectively.
The effect of dynamic annealing on the microstructure of samples with 8% temper rolling deformation is shown in Figure 3d1–d3. In all cases, annealing at 850 °C, 900 °C, and 950 °C, the grain size and shape distributions remain similar. Image analysis determined average grain sizes of 97.8 ± 6 µm, 110.5 ± 7 µm, and 118.2 ± 11 µm, respectively, indicating that increasing the annealing temperature has only a limited effect on grain growth at this deformation level. Comparable behaviour was observed in samples subjected to a 10% thickness reduction (Figure 3e1–e3), where annealing temperature had a negligible influence on grain size, which ranged from approximately 86 µm to 100 µm (Figure 4).
The smallest average grain size, approximately 70 ± 5 µm, was recorded in samples deformed by 40% (Figure 3f1–f3). After annealing at 850 °C, 900 °C, and 950 °C, these samples exhibited pronounced homogeneity, with fine, equiaxed grains uniformly distributed throughout the sheet cross-section.
The evolution of average grain size as a function of deformation and annealing temperature is summarised in Figure 4. The results clearly demonstrate that small deformations (the optimal deformation in our work is 4%) combined with high-temperature dynamic annealing can produce exceptionally large grains, significantly exceeding those of the initial industrial microstructure. In contrast, higher deformation levels (≥8%) suppress grain growth, yielding finer and more uniform microstructures, regardless of the annealing temperature. This confirms that the proposed unconventional processing route, temper rolling with small deformation followed by rapid dynamic annealing, can be effectively tuned to achieve targeted grain sizes and morphologies in fully finished electrical steel, which is additionally heat-treated by electrical equipment manufacturers after cutting segments for rotors and stators.
3.3. Analysis of Cold-Rolled Deformed States
This part of the scientific work was related to the analysis of plastic mechanical strains generated through the cross-section of sheet thickness during the temper rolling processes. In the case of primary recrystallization, the strain-induced boundary migration plays a key role in the occurrence of coarse-grained microstructures with a desirable crystallographic orientation [27]. Because of this reason, it is very important to know how the mechanical strain is distributed within the observed microstructural matrix subjected to external mechanical deformation. It is well known that in the last decades, the EBSD method began to be widely used for the detection of plastic strains in metallic materials with polycrystalline structures in the scientific practice. As dislocation is created in the material structure under mechanical work, the residual strain is manifest as local degradation in lattice structures by weak deviation in their orientation [49]. EBSD measurements enable the acquisition of extensive crystallographic data from individual points within the scanned area and allow for the generation of Kernel Average Misorientation maps on the background of the investigated microstructure. These maps are constructed by estimating the average misorientation angle of the crystal lattice between neighbouring pairs of points on the measurement grid, thereby providing insights into the distribution of local plastic strain and dislocation density within the material.
One-to-one EBSD measurements were performed to characterise the distribution of mechanical strains associated with applied plastic deformations, which contribute to the most effective abnormal selective grain growth during subsequent heat treatment. The KAM maps illustrating (comparing) the distribution of residual strains across the cross-section of experimental samples subjected to varying degrees of deformation are presented in Figure 5. The microstructural matrices of the deformed samples, corresponding to deformation levels ranging from 2% to 40%, are displayed on the left side of the figure. The rainbow-colored regions within the analysed microstructures reflect the intensity of local misorientation angles, which are indicative of dislocation density. On the right side of the figure, the corresponding frequency distributions of misorientation angles are shown, using a colour palette ranging from blue to red along the KAM value axis. These graphical representations are consistent with the colour schemes used in the respective KAM maps. In this context, the light blue regions indicate areas of the crystal lattice with minimal distortion, while red regions correspond to zones with the highest levels of local misorientation (about 5°), representing regions of elevated plastic strain and dislocation density.
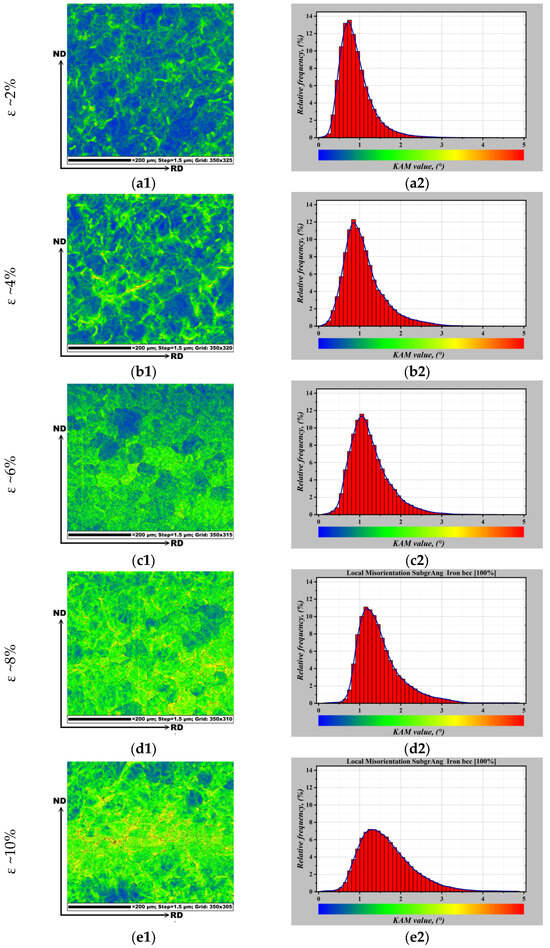
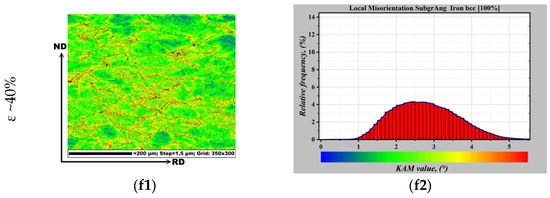
Figure 5.
KAM maps of experimental samples subjected to thickness reductions of 2%, 4%, 6%, 8%, 10%, and 40%. The corresponding legends (graphs on the (right)) indicate local misorientation angles ranging from 0° to 5°, represented by a rainbow colour scale. Regions with warmer colours correspond to areas of higher local deformation. The letters under the microstructures (a, b, c, d, e, and f) correspond to the applied deformation levels of 2%, 4%, 6%, 8%, 10%, and 40%, respectively. The numbers following these letters (1 and 2) denote the type of data presented: the KAM map (1) or the KAM map legend (2).
The distribution of local misorientation angles across the thickness of samples subjected to approximately 2% deformation is presented in Figure 5a1,a2. The coloured KAM map (Figure 5a1) depicts the fully recrystallized matrix of the experimental steel, showing slight variations in colour corresponding to regions of crystal lattice distortion. The EBSD data were processed to generate a graph of the relative frequency of local misorientation as a function of misorientation angle, shown in Figure 5a2. The results indicate that, for the 2% deformed sample, misorientation angles range from 0° to 2.5°, with the most frequent angle being approximately 0.8°. This low level of misorientation reflects minimal plastic strain within the crystal lattice. The coloured KAM maps reveal that these strain-related misorientations are predominantly located near grain boundaries, where the angles reach approximately 2–2.5°. In contrast, the interior regions of the grains show either no misorientation or only weak misorientations ranging from 0.5° to 1.5°. A comparison of Figure 5a1,a2 confirms that lattice distortions caused by rolling are unevenly distributed throughout the microstructure, being primarily concentrated at grain boundaries.
The EBSD data presented in the form of a KAM map for the sample subjected to 4% temper rolling reduction are shown in Figure 5b1,b2. Compared to the 2% deformed sample, the distribution of local misorientation angles exhibits notable differences. The graph in Figure 5b2 shows that misorientation angles extend up to approximately 3°, with the highest relative frequency observed at around 0.9°. The KAM map indicates that plastic strain is still predominantly concentrated near the grain boundaries. Remarkably, a pronounced colour gradient is observed within some grains, ranging from light blue to light yellow. This gradient likely corresponds to a decreasing dislocation density from the grain boundary toward the grain centre. Additionally, a small number of grain boundaries show colour transitions from yellow to light red, corresponding to local misorientation angles of approximately 3.5–4.0°. From a microstructural perspective, the misorientation distribution reveals a non-uniform morphology. Overall, the EBSD analysis of the 4% deformed sample suggests that the increased deformation results in more pronounced local mechanical strain within the crystal lattice, particularly at grain boundaries, with an observable gradient of strain extending into the grain interiors.
The microstructure exhibiting local mechanical strains, obtained after temper rolling the experimental sample with a 6% thickness reduction, along with the corresponding distribution of local misorientation angle intensity, is shown in Figure 5c1,c2, respectively. The KAM map clearly reveals an inhomogeneous distribution of local plastic strains throughout the sample thickness. Certain grains exhibit higher local misorientation values than others. However, the colour distribution within individual strained grains appears relatively uniform, without significant gradients. The observed range of misorientation angles extends from approximately 0.2° to 3.4°. Compared to previous results, the peak of the relative frequency curve is shifted to a higher value, with a maximum at approximately 1.1°, as shown in Figure 5c2. These results suggest that in the 6% deformed sample, although the intra-grain strain gradient is less distinct, there is a noticeable increase in the overall intensity of local misorientation. This implies an accumulation of stored deformation energy in the microstructure as a result of the rolling process.
The behaviour of misorientation angles in the experimental sample subjected to 8% thickness reduction by temper rolling is illustrated in Figure 5d1,d2. The EBSD data clearly indicate that increasing the degree of deformation results in higher intensities of local misorientation at greater angles. The KAM curve is shifted to the right, with most values falling within the range of 0.5° to 3.5°, and a maximum frequency occurring at approximately 1.2°. The most informative insight is provided by the coloured KAM map in Figure 5d1. It shows that increased local misorientation angles are visually represented by a greater number of regions coloured in orange and light red, primarily located near grain boundaries and unevenly distributed throughout the microstructure. Significantly, the microstructure contains grains exhibiting a pronounced gradient of local misorientation, which generally increases toward the grain boundaries.
The EBSD analysis of the sample subjected to a 10% deformation is presented in Figure 5e1,e2. The results show that the misorientation angles increase up to approximately 4°, with the lowest visible value around 0.4°, as seen in Figure 5e2. This suggests that greater deformation develops the range of misorientation angles, indicating an increase in stored energy within the crystal lattice. The KAM map in Figure 5e1 presents that this increase in local lattice distortion is most pronounced in the central part of the microstructure, particularly near grain boundaries. In this deformation state, gradients of misorientation are detectable not only within individual grains but also across the thickness of the sample. The map further demonstrates that the highest misorientation intensities are concentrated predominantly in the middle region of the microstructure.
The microstructure of the rolled samples subjected to 40% deformation is presented in Figure 5f1,f2. The coloured KAM map clearly shows that the metallographic structure is characterised by elongated grains aligned along the rolling direction. The EBSD data indicate that such a high level of deformation significantly modifies the original grain morphology within the primary microstructural matrix. The observed grain elongation suggests that the crystal lattice has undergone extensive strain due to intense shear stresses. This deformation is visualised by the colouration on the KAM map, which reflects the values of local misorientation angles. The KAM graph in Figure 5f2 shows that local misorientation angles range from 1° to 5°, with the peak intensity occurring around 2.5°. The processed data reveal a relatively high frequency of misorientation angles between 4° and 5°, which are predominantly located along the boundaries of the elongated grains (orange and red areas). This indicates that, under 40% plastic deformation, dislocations are primarily generated and stored near grain boundaries. As a result, the subsequent heat treatment of this sample most likely led to a recovery process, manifested as primary recrystallization, rather than secondary recrystallization, which was observed in samples deformed by 2–10%. This interpretation is further supported by the differences in microstructural states illustrated in Figure 5.
The EBSD-based KAM analysis demonstrates a clear correlation between temper rolling deformation and the evolution of local plastic strains in FeSi steel. At low deformation levels (2–4%), misorientation angles are small and primarily concentrated at grain boundaries, indicating limited strain accumulation and minimal lattice distortion. As deformation increases (6–10%), both the magnitude and distribution of misorientations grow, reflecting higher dislocation density and more pronounced strain gradients extending into grain interiors. At extreme deformation (40%), extensive grain elongation and elevated misorientation values highlight significant strain localisation near boundaries as well as throughout the thickness of the sample, suggesting that dislocation storage and lattice distortion are maximised.
These observations indicate that temper rolling not only increases the overall stored deformation energy but also alters the heterogeneity of strain distribution, which is a critical factor governing subsequent recrystallization behaviour. In particular, low to moderate deformations favour abnormal selective grain growth during secondary recrystallization, whereas high deformation promotes recovery and primary recrystallization due to excessive strain accumulation and grain elongation. Overall, the presented analysis provides valuable insights into the distribution and intensity of local plastic strains induced by temper rolling over a wide range of applied deformations in FeSi steel samples. The KAM maps, together with the corresponding misorientation frequency distributions, clearly demonstrate how increasing deformation influences dislocation density, strain localisation, and grain boundary behaviour, factors that play a decisive role in recrystallization mechanisms and the resulting microstructural characteristics
3.4. Analysis of Texture Components of Heat-Treated Samples
In industrial production, the isotropic magnetic properties of non-oriented FeSi steels are ideally ensured by the formation of a completely random crystallographic texture. However, the directional nature of hot and cold rolling processes inevitably introduces a certain degree of crystallographic anisotropy, whether intended or not. A fully random texture may not even be optimal for rotating electrical machines such as motors or generators. What is essential is that the material exhibits good and uniform magnetic properties when magnetised in any in-plane direction of the steel sheet. Optimal magnetic performance is typically achieved by minimising the presence of <111> crystallographic orientations in the sheet plane and enhancing the intensity of <100> orientations. Although achieving both simultaneously is technically challenging, it is nevertheless possible to significantly improve the magnetic properties of NO FeSi steels through precise control over the processing steps.
EBSD data, presented in the form of IPF maps and ODF sections, are shown in Figure 6. These colour-coded maps allow for a fast and accurate visualisation of the crystallographic texture of the analysed samples.
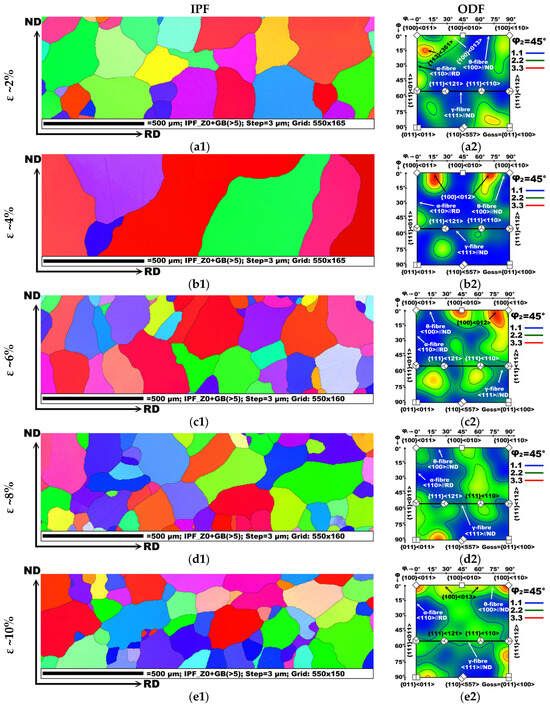
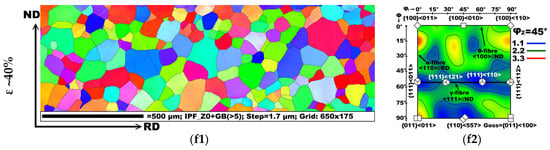
Figure 6.
The IPF maps and ODF sections illustrate the crystallographic grain orientations of the investigated experimental samples, providing complementary information on both the orientation of individual grains and the overall texture development within the material. The letters under the colored microstructures (a, b, c, d, e, and f) correspond to the applied deformation levels of 2%, 4%, 6%, 8%, 10%, and 40%, respectively. The numbers following these letters (1 and 2) denote the type of data presented: the IPF map (1) or the ODF section (2).
From a representation standpoint, IPF maps are particularly useful for polycrystalline materials, as they provide information on the morphology of the microstructural matrix, including grain size and crystallographic orientation across the scanned surface. Each coloured grain in the IPF map corresponds to a specific crystallographic direction straight with a defined reference direction—typically the rolling direction in textured FeSi steels. This orientation-specific colouring facilitates quick interpretation and understanding of the material’s preferred orientation (texture) in the observation plane. It is important to note that, in IPF maps, three primary colours are most significant: red, green, and blue, which correspond to the {100}, {110}, and {111} crystallographic planes, respectively.
The orientation distribution function is a two-dimensional function specified by at least three Euler angles which provides a quantitative method for evaluating the crystallographic texture of polycrystalline materials. It describes the statistical distribution of grain orientations within the sample. In ODF representations, each orientation is expressed as the volume fraction (or percentage) of grains that adopt a specific crystallographic alignment. In other words, the ODF enables the precise assessment of the intensity of particular crystallographic orientations, complementing the qualitative information provided by the coloured IPF maps.
The evolution of crystallographic texture in selected experimental microstructural states, obtained from temper-rolled samples heat-treated at 950 °C, is presented in Figure 6. The processed EBSD data indicate that the applied dynamic thermal processing of slightly rolled FeSi steels influences not only the development of the microstructural matrix but also promotes selective grain growth, particularly enhancing the intensity of desirable crystallographic components such as the cubic {100}<001> and Goss {110}<001> orientations.
The crystallographic texture of the samples subjected to 2% deformation followed by heat treatment is presented in Figure 6a1. The IPF map reveals that the material exhibits a relatively coarse-grained microstructure, with the predominant crystallographic directions <100> and <110> aligned parallel to the sheet rolling direction, indicated by different shades of red and green. In terms of the intensity of specific crystallographic orientations within the observed microstructural matrix, additional insight is provided by the ODF sections, which show increased intensities of the α- and θ-fibre components (see Figure 6a2). The highest intensity is associated with the {113}<361> component, corresponding to a slightly rotated cube orientation at Φ = 15°. Another notable intensity maximums are related to the {100}<013> cube component and indistinctness Goss orientation.
The IPF-coloured map illustrating the main crystallographic components identified in the samples subjected to 4% cold rolling followed by heat treatment is shown in Figure 6b1. The results indicate that most of the coarsened grains appear in red or reddish shades, signifying crystallographic orientations close to the rotated cube texture. A more detailed analysis based on the θ-fibre section of the ODF (Figure 6b2) reveals that these grains exhibit a rotated cube texture, with the <013> family of directions aligned parallel to the RD. In other words, the crystallographic lattice of these grains lies within the {100} plane and is rotated by approximately 15° with respect to the cold rolling direction of the examined sample.
The evolution of texture in the samples subjected to 6% cold rolling and subsequently heat-treated under dynamic conditions at 950 °C is presented in Figure 6c1,c2. The IPF map (Figure 6c1) shows that the coarser components of the microstructural matrix are predominantly associated with rotated cube and deviated Goss orientations. In contrast, finer constituents (grains) mainly display the undesirable deformed texture, represented by the γ-fibre in the ODF section. The two-dimensional ODF representation in Figure 6c2 further indicates that many of the texture components of the microstructure are rotated by several degrees from the cube orientation {100}<110>. Additionally, in this microstructure, a distinctly visible region of high texture intensity corresponds to a double-oriented cube component {100}<110>, located central part of the θ-fibre. Also, features associated with the deformed texture, along with their characteristic orientations, are concentrated near the γ-fibre.
Figure 6d1,d2,e1,e2 show the crystallographic textures of the samples subjected to 8% and 10% cold rolling, respectively. The IPF maps (Figure 6d1,e1) confirm earlier observations, indicating that both samples exhibit a homogeneous microstructural matrix without distinctly pronounced texture components. This is further supported by the ODF sections (Figure 6d2,e2). As evident from these results, the samples do not display a dominant texture component but rather exhibit a balanced distribution of crystallographic planes and directions. These are situated near or between the principal textural components associated with the θ-, γ-, and α-fibres, as illustrated in the coloured ODF sections.
Analyses of EBSD data for the samples subjected to a maximum cold rolling reduction of approximately 40% followed by heat treatment, are presented in Figure 6f1,f2. The IPF map presents a fine-grained microstructure dominated by grains with {100} and {110} crystallographic planes, corresponding to the strong {100}<0vw> and {110}<0vw> components, respectively. The microstructure is predominantly shaded in red and green, which represent the Goss orientation and the θ-fibre, as confirmed by the coloured ODF section in Figure 6f2.
Overall, the evolution of crystallographic texture with increasing deformation reveals a clear the principles of formation of crystallographic grain orientation in the process of secondary recrystallization in the investigated FeSi samples. At lower deformation levels (2–4%), the texture is dominated by rotated cube or Goss components. This behaviour of resulting texture can be attributed to the fact that, during primary recrystallization, a slight plastic strain gradient between adjacent grains or inside of grain (see Figure 5a1,a2,b1,b2, combined with a pronounced temperature gradient across the sheet thickness, promotes the preferential growth of grains with crystallographic orientations located near the θ-fibre in the primary recrystallized state. However, with increasing cold rolling degree to 6%, more numerous textural components develop with the coexistence of cubic, deviation Goss and deformed crystallographic components. Considering the results obtained for these samples from EBSD data in the form of KAM maps (see Figure 5c1,c2), it is evident that with applied deformation starting from 6%, the morphology of the occurrence of local mechanical stresses in the crystal lattice changes. Comparison of the results shown in KAM maps for samples with 2–4% deformation and samples with 6% deformation indicates that with increasing deformation above 4%, the weak gradients of plastic mechanical stresses are replaced by a gradient that is more pronounced throughout the thickness of the sheet than between individual structures of the observed microstructural matrix. Such a distribution of dislocation densities in the deformed crystal lattice during secondary recrystallization at extremely high heating rates provides more grains of the primary recrystallized matrix with the accumulated deformation energy necessary to activate the motion of their boundaries. As a result, the sample with 6% deformation has a finer-grained microstructure with a larger number of different crystallographic components than in samples with lower applied deformation. With further deformation (8–10%), the texture becomes more dispersed and homogenised, reflecting a balance between deformation and recrystallization mechanisms. At the highest deformation level (40%), the resulting microstructure is characterised by a fine-grained morphology, with an average grain diameter of approximately 70 μm. As shown in Figure 6f2, a broad spectrum of crystallographic orientations is present within the observed microstructure, without a dominant or preferential textural component. Taking into account the results of metallographic analysis (Figure 3f1,f2) and the detection of local mechanical stresses within the primarily recrystallized matrix of the 40% deformed sample, it can be assumed that deformation levels exceeding 10% do not promote the selective growth of ferrite grains with preferred cube or Goss orientations.
Based on the presented findings, it can be concluded that the mechanism of selective strain-induced boundary migration of ferrite grains is effectively activated only when the cold rolling reduction does not exceed 10%. This effect occurs in combination with subsequent rapid heating, which generates a significant temperature gradient between the surface and core of the heat-treated thin FeSi steel sheets.
3.5. Analysis of Magnetic Properties of Experimental Samples
Among the wide range of steel materials produced today, electrical silicon steels are particularly distinguished by their electromagnetic properties, as they are used primarily for transmitting induced magnetic fields in the cores of electrical devices. Accordingly, the design of microstructural, textural, and substructural parameters, as well as the chemical composition, must ultimately have a positive influence on their final magnetic properties. These properties are most commonly evaluated by measuring coercivity or power losses. In this context, our research focused on improving the microstructural and textural characteristics of the investigated steels in the “fully finished” state, with the expectation that the measured magnetic parameters of the processed samples would correspond to the results presented and discussed in the preceding chapters.
The evolution of microstructural, substructural, and textural characteristics in the investigated steel states has a direct impact on their final magnetic properties, namely coercivity and power losses. Magnetic measurements were performed on all experimental samples in an AC magnetic field at a frequency of 50 Hz. The dependence of coercivity on the material state of the experimental samples is presented in Figure 7. The resulting curves show that coercivity varies with both annealing temperature and applied deformation, indicating that the samples differ not only in microstructure, texture, and the intensity of crystal lattice disruption caused by rolling, but also in their corresponding magnetic properties.
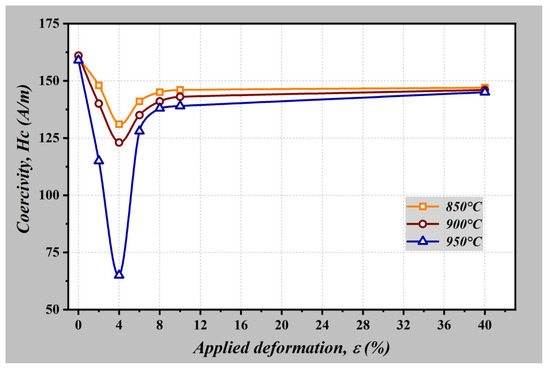
Figure 7.
Measurement of the coercivity of the investigated steel as a function of applied deformation and annealing temperature.
The initial coercivity of the as-delivered samples is approximately 162 A/m. The graph illustrates that, among the measured samples, those corresponding to the final state of the M530-50A grade exhibit the highest coercivity and, consequently, the greatest power losses, compared with other material states in which selective development of the microstructural matrix with larger grains and a preferred crystallographic texture was applied. The minimum coercivity of approximately 65 A/m was achieved in a sample subjected to mild smooth rolling (~4% thickness reduction) followed by dynamic annealing at 950 °C. These results indicate that, for this FeSi steel grade, combining ~4% deformation with subsequent heat treatment at 950 °C under an extremely high heating rate can reduce coercivity by more than a factor of two relative to the as-delivered state. The measured coercivity values for this condition correspond closely with the microstructure and texture analyses performed on the same sample.
It is also noteworthy that samples rolled at above or below 4% deformation exhibited a positive improvement in their magnetic properties compared to the as-delivered sheets. Clearly, increasing the average grain size or enhancing the textural parameters of the microstructural matrix has a beneficial effect on reducing magnetic losses in electrical steels. To a certain extent, the coercivity measurements presented in Figure 7 can be considered a linear reflection of the average grain size values shown in Figure 4.
In conclusion, it can be stated that the results of this study demonstrate a clear relationship between temper rolling deformation, heat treatment, microstructural evolution, texture development, and the magnetic properties of FeSi steels. EBSD analysis revealed that increasing rolling reductions progressively enhances local plastic strain and dislocation density, particularly near grain boundaries, as indicated by KAM maps. At low deformation levels (2–4%), strains are localised primarily at grain boundaries, with minimal intra-grain gradients, which are nevertheless sufficient to promote significant selective grain growth via the strain-induced grain boundary migration mechanism during secondary recrystallization. Conversely, higher deformations (8–40%) induce pronounced lattice distortions and strain gradients extending into grain interiors, accompanied by significant grain elongation along the rolling direction. It is evident that at higher deformation levels, not only does the intensity of mechanical stresses within the crystal lattice increase, but their overall occurrence throughout the deformed structure also becomes more widespread. Consequently, the deformation gradient between different regions of the microstructural matrix, particularly between adjacent grains, becomes less pronounced. During subsequent heat treatment, this reduced gradient allows a much larger number of grains to grow simultaneously compared to lower deformation levels (below 4%), where selective growth is more prevalent. As these grains compete and inhibit one another’s growth, the resulting microstructure becomes more or less homogeneous, accompanied by a reduction in the average grain diameter.
These microstructural changes directly influence recrystallization behaviour and the development of preferred crystallographic textures, which in turn affect magnetic performance. Coercivity measurements show that moderate rolling reductions combined with dynamic annealing (e.g., 4% deformation at 950 °C) lead to a substantial decrease in coercivity and power losses, consistent with the formation of coarser, more uniform grains with favourable orientations. Conversely, higher deformations, while increasing stored strain energy, promote fine-grain structures and heterogeneous distributions of their crystallographic orientations, resulting in comparatively higher coercivity. Overall, the findings highlight that precise control of mechanical deformation and subsequent heat treatment enables optimisation of microstructure and texture, thereby minimising coercivity and enhancing the electromagnetic performance of fully finished FeSi steels. This establishes a direct link between mechanical processing, internal lattice strains, and functional magnetic properties.
4. Conclusions
This work demonstrates that the microstructural and textural state of low-silicon non-oriented electrical steel can be effectively tailored by combining small to moderate cold rolling deformation with short-time, high-rate dynamic annealing. The main findings can be summarised as follows:
- Low temper rolling deformations (2–4%) generated localised plastic strains predominantly at grain boundaries, with minimal intra-grain gradients. This strain distribution promoted secondary recrystallization through the strain-induced grain boundary migration mechanism, resulting in selective abnormal grain growth with favourable crystallographic orientation.
- Increasing deformation beyond 6% led to a more homogeneous distribution of local misorientations throughout the microstructure, accompanied by a reduction in the deformation gradient between grains. During annealing, this promoted competitive grain growth, ultimately producing a more uniform grain size distribution and limiting the development of large, abnormally grown grains.
- The optimised conditions (around 4% deformation and annealing at 950 °C) yielded a texture with a higher proportion of {100}<0vw> cube-oriented grains, known to enhance magnetic performance in electrical steels.
- Magnetic measurements revealed a strong correlation between microstructural and textural optimization and the improvement of coercivity. The lowest coercivity (~65 A/m) was achieved for samples subjected to ~4% deformation, followed by dynamic annealing at 950 °C, representing a reduction by more than half compared to the as-delivered condition (162 A/m). This improvement directly reflects the beneficial effect of enlarged average grain size and optimized texture on reducing magnetic losses.
Overall, these results confirm that carefully balancing deformation and dynamic annealing parameters enables targeted control over grain size and texture evolution, offering manufacturers an efficient method to improve core properties in electrical devices.
Author Contributions
Conceptualization, I.P. and F.K. (František Kováč); methodology, I.P., M.M. and L.F.; software, M.M.; F.K. (František Kromka) validation, I.P., V.P. and L.F.; formal analysis, I.P., V.P. and M.P.; investigation, I.P., M.M. and L.F.; resources, I.P. and M.M.; data curation, I.P., M.P. and V.P.; writing—original draft preparation, I.P. and L.F.; writing—review and editing, I.P. and L.F.; visualization, I.P. and F.K. (František Kromka); supervision, I.P.; project administration, I.P.; funding acquisition, I.P. All authors have read and agreed to the published version of the manuscript.
Funding
This work was carried out within the research project Funded by the EU NextGenerationEU through the Recovery and Resilience Plan for Slovakia under the project No. 09I03-03-V04-00314.
Data Availability Statement
Data are contained within the article. The raw data of individual measurements and analyses will be made available by the authors on request.
Conflicts of Interest
The authors declare no conflicts of interest.
Abbreviations
The following abbreviations are used in this manuscript:
| SIGM | Strain-induced grain boundary migration |
| EBSD | Electron backscattered diffraction |
| KAM | Kernel Average Misorientation |
| IPF | Inverse Pole Figure |
| ODF | Orientation Distribution Functions |
| SEM | Scanning electron microscope |
| AC | Alternating current |
| LOM | Light optical microscope |
| BCC | Body-Centred Cubic |
| GO | Grain-oriented |
| NO | Non-oriented |
References
- Langraf, F.J.G. Nonoriented electrical steel sheets. JOM 2012, 64, 764–771. [Google Scholar] [CrossRef]
- Wan, Y.; Zhao, Q.Q.; Wu, Y.C.; Zhang, L.Q.; Xia, Y.J.; Wen, Y.H.; Chen, L.J. Effect of Si content on the formation of {100} orientation in 0.27% Al non-oriented electrical steel during cell-to-dendrite transition process. J. Mater. Eng. Perform. 2020, 29, 3030–3039. [Google Scholar] [CrossRef]
- Steiner Petrovič, D. Non-oriented electrical steel sheets. Mater. Technol. 2010, 44, 317–325. [Google Scholar]
- Moses, M.; Anderson, P.; Jenkins, K.; Stanbury, H. Electrical steels: Fundamentals and Basic Concepts; The institution of Engineering and Technology: Stevenage, UK, 2019; pp. 1–517. [Google Scholar]
- Paltanea, G.; Manescu, V.; Antoniac, A.; Nemoianu, I.V.; Gavrila, H. Mechanical and Magnetic Properties Variation in Non-Oriented Electrical Steels with Different Cutting Technology: A Review. Materials 2024, 17, 1345. [Google Scholar] [CrossRef]
- Backes, C.; Smaga, M.; Beck, T. Mechanical and functional fatigue of non-oriented and grain-oriented electrical steels. International. J. Fatiguerm 2024, 186, 108410. [Google Scholar]
- Leuning, N.; Steentjes, S.; Hameyer, K. Effect of grain size and magnetic texture on iron-loss components in NO electrical steel at different frequencies. J. Magn. Magn. Mater. 2019, 469, 373–382. [Google Scholar] [CrossRef]
- Kestens, L.A.I.; Pirgazi, H. Texture formation in metal alloys with cubic crystal structures. Mater. Sci. Technol. 2016, 32, 1303–1315. [Google Scholar] [CrossRef]
- Leuning, N.; Jaeger, M.; Schauerte, B.; Stöcker, A.; Kawalla, R.; Wei, X.; Hirt, G.; Heller, M.; Korte-Kerzel, S.; Böhm, L.; et al. Material design for low-loss non-oriented electrical steel for energy efficient drives. Materials 2021, 14, 6588. [Google Scholar] [CrossRef]
- You, D.; Park, H. Developmental trajectories in electrical steel technology using patent information. Sustainability 2018, 10, 2728. [Google Scholar] [CrossRef]
- Liu, H.T.; Schneider, J.; Li, H.L.; Sun, Y.; Gao, F.; Lu, H.H.; Song, H.Y.; Li, L.; Geng, D.Q.; Liu, Z.Y.; et al. Fabrication of high permeability non-oriented electrical steels by increasing <0 0 1> recrystallization texture using compacted strip casting processes. J. Magn. Magn. Mater. 2015, 374, 577–586. [Google Scholar]
- Senda, K.; Uesaka, M.; Yoshizaki, S.; Oda, Y. Electrical steels and their evaluation for automobile motors. World Electr. Veh. J. 2019, 10, 31. [Google Scholar] [CrossRef]
- Hilinski, E. Recent developments in semiprocessed cold rolled magnetic lamination steel. J. Magn. Magn. Mater. 2006, 304, 172–177. [Google Scholar] [CrossRef]
- Schneider, J.; Guangqiang, L.; Franke, A.; Zhou, B. Evolution of microstructure at hot band annealing of ferritic FeSi steels. J. Magn. Magn. Mater. 2017, 424, 26–32. [Google Scholar] [CrossRef]
- Ivo, R.F.; Rodrigues, D.A.; Bezerra, G.M.; Freitas, F.N.C.; Abreu, H.F.; Filho, P.R. Non-grain oriented electrical steel photomicrograph classification using transfer learning. J. Mater. Res. Technol. 2020, 9, 8580–8591. [Google Scholar] [CrossRef]
- Sistanina, M.; Raninger, P.; Kreuzer, H.; Prevedel, P.; Antretter, T. Designing deformation texture in non-oriented electrical steel for enhanced magnetic properties. Int. J. Mech. Sci. 2025, 290, 110090. [Google Scholar] [CrossRef]
- Tanaka, Y.; Takaki, S.; Tsuchiyama, T.; Uemori, R. Effect of grain size on the yield stress of coild worked iron. ISIJ Int. 2018, 58, 1927–1933. [Google Scholar] [CrossRef]
- Zhang, B.; Liang, Y.; Wen, S.; Wang, S.; Shi, X.; Ye, F.; Lin, J. High-strength low-iron-loss silicon steels fabricated by cold rolling. J. Magn. Magn. Mater. 2019, 474, 51–55. [Google Scholar] [CrossRef]
- Hou, D.; Fang, F.; Wang, Y.; Zhang, Y.; Zhang, X.; Misra, R.D.K.; Yuan, G. Nanoprecipitation behavior and resultant mechanical and magnetic properties in Fe–Si–Ni–Al–Mn high strength non-oriented silicon steel. Mater. Sci. Eng. 2021, 819, 141529. [Google Scholar] [CrossRef]
- Guo, F.; Niu, Y.; Fu, B.; Qiao, J.; Qiu, S. Influence Mechanisms of Trace Rare-Earth Ce on Texture Development of Non-Oriented Silicon Steel. Materials 2025, 18, 3493. [Google Scholar] [CrossRef]
- Hernández Navarro, F.; Gutiérrez Castañeda, E.; Salazar Muñoz, V.E.; Bedolla Jacuinde, A.; Deaquino Lara, R.; Salinas Rodríguez, A.; Zambrano Robledo, P. Influence of chemical composition and processing conditions on the microstructure and magnetic properties of low-carbon Si-Al-Sb electrical steel sheets. J. Magn. Magn. Mater. 2023, 569, 170431. [Google Scholar] [CrossRef]
- Choi, H.; Hong, J.; Kim, J.K.; Koo, Y.M. Effect of Al content on magnetic domains of {1 0 0} grains in electrical steels. J. Magn. Magn. Mater. 2018, 466, 112–118. [Google Scholar] [CrossRef]
- Yuan, J.; Yuan, W.; Dai, S.; Fang, F.; Wang, Y.; Zhang, Y.; Zhang, X.; Yuan, G.; Wang, G. Effect of annealing time on microstructure and properties of high-strength non-oriented silicon steel with Nb addition. J. Mater. Res. Technol. 2025, 36, 3756–3772. [Google Scholar] [CrossRef]
- Ren, Q.; Hu, Z.; Cheng, L.; Zhang, L. Effect of rare earth elements on magnetic properties of non-oriented electrical steels. J. Magn. Magn. Mater. 2022, 560, 169624. [Google Scholar] [CrossRef]
- Elgamli, E.; Anayi, F. Advancements in Electrical Steels: A Comprehensive Review of Microstructure, Loss Analysis, Magnetic Properties, Alloying Elements, and the Influence of Coatings. Appl. Sci. 2023, 13, 10283. [Google Scholar] [CrossRef]
- Calivillo, N.; Soria, J.; Salinas, A.; Gutierrez, E.J.; Reyes, I.A.; Carrillo, F.R. Influence of Thickness and Chemical Composition of Hot-Rolled Bands on the Final Microstructure and Magnetic Properties of Non-Oriented Electrical Steel Sheets Subjected to Two Different Decarburizing Atmospheres. Metals 2017, 7, 229. [Google Scholar] [CrossRef]
- Jafari, M.; Jamshidian, M.; Ziaei-Rad, S.; Raabe, D.; Roters, F. Constitutive modeling of strain induced grain boundary migration via coupling crystal plasticity and phase-field methods. Int. J. Plast. 2017, 99, 19–42. [Google Scholar] [CrossRef]
- Mehdi, M.; He, Y.; Hilinski, E.J.; Edrisy, A. Effect of skin pass rolling reduction rate on the texture evolution of a non-oriented electrical steel after inclined cold rolling. J. Magn. Magn. Mater. 2017, 429, 148–160. [Google Scholar] [CrossRef]
- Zhang, J.; Sun, F.; Liu, R.; Zhang, C.; Wang, S.; Wu, G.; Mao, X. Excellent magnetic properties obtained in planar flow casting Fe-6.5 %Si steel via low strain cold-rolling and annealing. Mater. Des. 2024, 244, 113205. [Google Scholar] [CrossRef]
- Na, J.; Ko, H.; Koo, Y.; Park, S. Ultra-thin Fe–Si alloy sheet with excellent high frequency magnetic properties fabricated by partial decarburization combined with multi-stage cold rolling. Scr. Mater. 2023, 224, 115145. [Google Scholar] [CrossRef]
- Neundlinger, L.; Kreuzer, H.; Lichtenberger, H.; Hebesberger, T.; Sommitsch, C. Influence of intermediate annealing temperature on the microstructure and texture of double stage cold rolled non-grain oriented electrical steel. J. Magn. Magn. Mater. 2023, 585, 1711083. [Google Scholar] [CrossRef]
- Sidor, Y.; Kovac, F.; Kvackaj, T. Grain growth phenomena and heat transport in non-oriented electrical steels. Acta Mater. 2007, 55, 1711–1722. [Google Scholar] [CrossRef]
- Gutiérrez Castañedaa, E.J.; Palafox Cantúb, C.N.; Torres Castillob, A.A.; Salinas Rodríguezc, A.; Deaquino Larac, R.; Botello Riondac, F.; Márquez Torresc, F.; García Guillermo, S. Columnar grain growth during annealing prior to cold rolling of nonoriented electrical steels. Mater. Sci. Eng. B 2019, 243, 8–18. [Google Scholar] [CrossRef]
- Kwon, S.B.; Ahn, Y.K.; Jeong, Y.K.; Kim, T.Y.; Park, J.T.; Han, H.N.; Hwang, N.M. Evolution of cube-on-face texture in Fe-1%Si steel induced by physical contact during the phase transformation from γ to α. Mater. Charact. 2020, 165, 110380. [Google Scholar] [CrossRef]
- Xie, L.; He, M.; Sun, L.; Wang, J.; Lu, Y.; Yao, C. Columnar grain growth in non-oriented electrical steels via plastic deformation of an initial columnar-grained solidification microstructure. Mater. Lett. 2020, 258, 126797. [Google Scholar] [CrossRef]
- Kim, K.M.; Kim, H.K.; Park, J.Y.; Lee, J.S.; Kim, S.G.; Kim, N.J.; Lee, B.J. {100} texture evolution in bcc Fe sheets—Computational design and experiments. Acta Mater. 2016, 106, 106–116. [Google Scholar] [CrossRef]
- Xie, L.; Yang, P.; Xia, D.; Mao, W. Microstructure and texture evolution in a non-oriented electrical steel during γ-α transformation under various atmosphere conditions. J. Magn. Magn. Mater. 2015, 374, 655–662. [Google Scholar] [CrossRef]
- Kovac, F.; Stoyka, V.; Petryshynets, I. Strain induced grain growth in non-oriented electrical steels. J. Magn. Magn. Mater. 2008, 320, e627–e630. [Google Scholar] [CrossRef]
- Petryshynets, I.; Kovac, F.; Marcin, J.; Skorvanek, I. Magnetic properties of temper rolled NO FeSi steels with enhanced rotation texture. IEEE Trans. Magn. 2013, 49, 4303–4306. [Google Scholar] [CrossRef]
- Petryshynets, I.; Kovac, F.; Marcin, J.; Skorvanek, I. Improved processing technique for preparation of non-oriented electrical steels with low coercivity. Acta Phys. Pol. A 2014, 126, 182–183. [Google Scholar] [CrossRef]
- Petryshynets, I.; Kováč, F.; Falat, L.; Puchý, V.; Šebek, M. Magnetic losses evolution of ferric Fe-Si steel subjected to temper rolling at elevated temperature. Acta Phys. Pol. A 2018, 133, 1065–1068. [Google Scholar] [CrossRef]
- Sidor, J.J.; Verbeken, K.; Gomes, E.; Schneider, J.; Calvillo, P.R.; Kestens, L.A.I. Through process texture evolution and magnetic properties of high Si non-oriented electrical steels. Mater. Charact. 2012, 71, 49–57. [Google Scholar] [CrossRef]
- Mun, H.; Heo, H.; Koo, Y.M. Gube+Goss textured electrical steels. Metall. Mater. Trans. A 2018, 49, 1465–1469. [Google Scholar] [CrossRef]
- He, Y.; Hilinski, E.J. Texture and magnetic properties of non-oriented electrical steels processed by an unconventional cold rolling scheme. J. Magn. Magn. Mater. 2016, 405, 337–352. [Google Scholar] [CrossRef]
- Petryshynets, I.; Kováč, F.; Füzer, j.; Falat, L.; Puchý, V.; Kollár, P. Evolution of power losses in bending rolled fully finished no electrical steel treated under unconventional annealing conditions. Materials 2019, 12, 2200. [Google Scholar] [CrossRef] [PubMed]
- Petryshynets, I.; Kováč, F.; Branislav, P.; Falat, L.; Puchý, V. Improving the magnetic properties of non-oriented elec-trical steels by secondary recrystallization using dynamic heating conditions. Materials 2019, 12, 1914. [Google Scholar] [CrossRef]
- Fang, F.; Xu, Y.-B.; Zhang, Y.-X.; Wang, Y.; Lu, X.; Misra, R.D.K.; Wang, G.-D. Evolution of recrystallization microstructure and texture during rapid annealing in strip-cast non-oriented electrical steels. J. Magn. Magn. Mater. 2015, 381, 433–439. [Google Scholar] [CrossRef]
- EN 10106; Cold rolled non-oriented electrical steel strip and sheet delivered in the fully processed state. CEN-CENELEC Management Centre: Brussels, Belgium, 2015.
- Diligent, S.; Gautier, E.; Lemoine, X.; Berveiller, M. Lattice orientation dependence of the stored energy during cold-rolling of polycrystalline steels. Acta Mater. 2001, 49, 4079–4088. [Google Scholar] [CrossRef]
Disclaimer/Publisher’s Note: The statements, opinions and data contained in all publications are solely those of the individual author(s) and contributor(s) and not of MDPI and/or the editor(s). MDPI and/or the editor(s) disclaim responsibility for any injury to people or property resulting from any ideas, methods, instructions or products referred to in the content. |
© 2025 by the authors. Licensee MDPI, Basel, Switzerland. This article is an open access article distributed under the terms and conditions of the Creative Commons Attribution (CC BY) license (https://creativecommons.org/licenses/by/4.0/).