Abstract
Properties of surface anchoring depend on the absorbed exposure energy and various potential interactions associated with liquid crystal and azo dye layers. In this study, we investigate a model of dispersion, steric and photoinduced interactions with the goal of providing a qualitative and quantitative description of orientationally ordered hard uniaxial liquid crystals and azo dye molecules. By using the Onsager theory, we estimated the effect of excluded volume. Typical repulsive potentials between liquid crystal and azo dye molecules are displayed graphically. The presence of statistical dispersion in molecular alignment of liquid crystals leads to potential wells in dipole–dipole interactions. Our mean field theory investigation of dipole–dipole interactions shows that the anchoring free energy is governed by the net interaction energy associated with the averaged dipole moments of liquid crystal and azo dye molecules, photoaligned surface dipole moments, and local charge densities. We also use the Fokker–Planck equation to show that rotational diffusion is described by the effective mean field potential, which includes photoinduced and van der Waals interactions. Our findings underscore the potential of mean field theory for intermolecular couplings in photoaligned surfaces, opening up new pathways of molecular design for a broad range of parameters.
1. Introduction
Photoinduced alignment of liquid crystals (LCs) has been studied for decades [1,2]. Due to the light-induced rotational diffusion of dye molecules [3], the surface alignment of LC molecules, and the long-range ordering of LC mesophases, there exist many applications of photoalignment based on multi-domain structures [4,5,6]. Of all of the azo dye compounds encountered so far, sulphonic dye (SD1) has the ‘best’ properties for photoalignment [7]. Photoalignment is also a perfect effect for investigation of self-organized systems for experimental verification of theories [8,9]. The fundamental idea of the rotational diffusion model is the interaction potential between linearly polarized light and azo dye molecules, plus intermolecular van der Waals coupling, which acts as the thermodynamic average. Construction of a mathematical model that accounts for all possible interactions with statistical variations is rather complex, but we know that surface alignment of LCs and its stability depends on the shape of the surface anchoring potential [10,11]. Earlier measurements of photo-induced phase retardation have confirmed the model of rotational diffusion in the absence of LCs [3], but the interaction potential must also depend on long-range dipole–dipole coupling and short-range steric interactions. This defect in theory has been fairly noted in a number of studies, e.g., [12,13]. It now appears that the rotational diffusion mechanism should be extended to shape-changing molecules dissolved in biaxial LCs [14].
There exist a number of factors that affect alignment of LCs on azo dye layer. On one hand, chemical structure of LCs, e.g., homeotropic, planar alignment and pretilt angle of LCs depends on the length of the alkyl chain connecting the chalcone and polyimide main chains [15,16]. On the other hand, the chemical structure of azo dye determines the direction of its dipole moment. Combinations of various alignment methods also affect LC alignment [17,18].
The aim of our article is to describe energetically favored configurations of hard uniaxial LC and azo dye (AD) molecules by using interaction potentials and mean field theory. Currently known studies on rotational diffusion either do not consider dipole–dipole coupling and/or short-range steric interactions [3,19,20] or they rely on ad hoc linear vector differential equations describing surface alignment [21]. In order to make up for the missing estimations, we examine the impact of the mentioned couplings on the interaction potential.
Our approach is based on consideration of a LC cell which is sandwiched between photosensitive azo dye and photostable alignment layers. Typical values of intermolecular interaction energies range from 0.01–0.1 eV, and their nature is rather broad [22]. Referring to this range of energies, we apply interaction potentials for quantitative analysis of steric effects and dipole–dipole coupling between LC and AD molecules. Examination of steric effects reveals the role of AD molecular anisotropy and its contribution to the total interaction potential. By using the Onsager theory, we demonstrate that steric interactions between AD molecules are negligibly small. We also refer to the mean field Fokker–Planck equation to relate it to the rotational diffusion model and angular momentum operator. Our theoretical and computational results have a number of interesting consequences. For example, we explicitly show that the anchoring energy mainly depends on the mutual orientation of LC and AD dipole moments. We believe that our results are unbiased and consistent across a number of AD compounds with various geometrical and electrical properties.
2. Interaction Potential
Liquid crystal molecules are anchored to azo dye layer due to a number of interactions: light-induced rotational diffusion induces changes to dipole–dipole interactions between nematic LC and AD molecules and steric interactions. Formal representation of the corresponding potential has the following form:
where represents the photoinduced interaction potential between dye molecules and plane-polarized light. This term depends on the intensity of the irradiation light and the angle Θ between the absorption oscillator and the polarization plane. At this point, it is necessary to specify that the orientations of long molecular axes and dipole moments do not coincide with each other. This complication can hardly be avoided; therefore, our model is described by numerous input parameters. Expression (1) can also be supplemented by photothermal effects, but it can be avoided by polymer stabilization of the azo dye film [23].
Rotational dynamics of light-sensitive molecules is described by the Smoluchowski equation or the Fokker–Planck equation [3,24]. Van der Waals interaction between uniaxial molecules with the thermodynamic mean molecular distribution is described by the term, which also follows from the Fokker–Planck equation. Attractive electrostatic dipole–dipole (dd) interaction is accounted for by the term. Repulsive steric interactions between LC and dye molecules are described by the Gay–Berne potential (GB), represented by the (ν,u,r) term [22,25], where unit vectors ν and u describe the orientations of LC and AD molecules, and r is the intermolecular vector. In the proceeding sections, we will consider the contribution of each term into the interaction potential U (Equation (1)).
2.1. Dispersion Interactions
Attractive long-range van der Waals and dipole–dipole interactions mediate anchoring effects. A well-known form of dipole–dipole interaction is the following:
where represents a unit intermolecular vector between the centers of LC and AD molecules. Recall that LC molecules are aligned parallel to the azo dye molecules within the illuminated region [26]. This also means that dipole moments and surface LC molecules favor antiparallel alignment, tending to minimize the net dipole moment. It is convenient to define dipole moments by using unit vectors, i.e., . Typical values of the pretilt angle are about [27]. Then one can readily see that the expression for is simplified, and the interaction potential reads as follows:
where (1/m) is the absorption coefficient, is the relaxation time of AD, is the volume of the AD molecule, and (J) is a phenomenological constant. Equation (3) reveals that the lowest interaction energy between permanent molecular dipoles depends on dipole moments and separation distance r [28,29]. As a result, dipole–dipole interactions for a perturbed molecular system must depend on the macroscopic polarization of LC and AD. This observation will be the subject of our further investigation.
A classic example that has been the subject of numerous studies is 4-cyano-4′-pentylbiphenyl (5CB) with the dipole moment D, which is applied from tail to cyano group [30]. The typical dipole moment of an AD molecule is D [31,32]. Then one can easily show that attractive dipole–dipole interactions range from Å. In an idealized case, vector should be directed along the ITO-coated surface, i.e., belong to the xy-plane. One can assume that the orientation of LC dipole moments exhibits statistical dispersion along the alignment axis. This brings us to an important point of investigation of potential coupling between two groups of dipole moments.
Dipole–dipole interaction potential exhibits opposite signs depending on the mutual alignment of the two dipoles, described by polar and azimuthal angles (see Figure 1a).
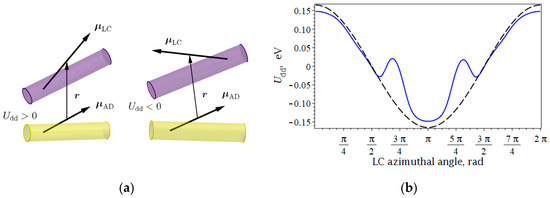
Figure 1.
(a) Various configurations of dipole moments, providing repulsive and attractive interactions; (b) potential energy of pairwise dipole–dipole coupling versus for normally distributed LC alignment (solid curve) and perfect alignment of LC molecules (dashed curve).
In order to perform calculations for estimation of the term, we represented expression (2) for LC and AD molecules on a 9 to 1 basis. Azimuthal angle was defined in terms of the Gaussian distribution as well as perfectly aligned LC molecules. Then the potential energy of the system was minimized under rigid-body constraints. As we expected, the calculated potential has repulsive and cohesive energies, and it is sensitive to the LC alignment quality, i.e., statistical distribution of . Analysis of Figure 1b shows that antiparallel alignment of dipole moments minimizes the potential, but its behavior depends on how the LC azimuthal angle is defined. The existence of imperfect alignment of LC dipole moments leads to a potential well during the monotonous increase of angle .
Consider the range when the anchoring effect is reduced through the potential well. The existence of statistical dispersion in means that the total dipole moment of LC molecules possesses both parallel and perpendicular orientation components of polarization with the dominating longitudinal component.
Continuous rotation of the dominating component results in the rapid decay of the cohesive effect due to the presence of dipole moments, which are aligned in such a way as to increase the interaction energy. These molecules have a value of greater than its mathematical expectation. With the increase of the mathematical expectation , molecules from another ‘tail’ of the Gaussian curve have a net dipole moment that minimizes dipole–dipole coupling. As a result, we observe the potential well. When all LC dipole moments that are accounted for in the distribution form angles with AD dipole moments without oppositely directed components, the potential continues its monotonous increase to the amplitude value. Our calculations also show that the existence of the angular dispersion of LC dipole moments is also responsible for the decay of the amplitude value of due to the presence of multidirectional components of .
To gain a better understanding of the net dipole–dipole interactions, consider a mean field approximation of expression (2), which reads as follows:
where is the number density, D is the distance between long molecular axes, and represent one-particle orientational distribution functions, and H is the Heaviside step function, which vanishes if AD and LC molecules penetrate each other; otherwise, it is equal to 1. In view of the molecular–statistical point of view, the integral over R in Equation (4) exhibits anomalous behavior in its volume integral due to the long-range nature of the potential. On one hand, the integral of the dipole–dipole potential over all orientations of the unit intermolecular vector R is equal to zero, as expected, in an isotropic matter:
On the other hand, the integral over is logarithmically divergent at large intermolecular distances r. This means that the volume integral of the dipole–dipole potential is ill defined; i.e., the value of the integral depends on the system size, the shape of the sample, and boundary conditions [33]. However, the mean field approximation can be obtained by using Ewald’s summation technique, which separates the short-range and long-range contributions of the dipole–dipole potential (2) and establishes the relationship that accounts for the electric field in the system [34]. As for the potential energy , it must have a finite value, being electrically neutral.
Let us note that by combining Equations (2) and (4), we obtain average dipole moments: and , where the mean quantities and are independent of the molecular size. Furthermore, , where is the macroscopic polarization. Then Expression (4), with the transformations of the mean field theory, represents the contribution to the anchoring energy, which depends on dipole moments and the shape of the sample:
where the macroscopic electric field inside the pattern is related to cylindrically symmetric dipole–dipole tensor , i.e., . This means that the weighted average in the term (5) contributes to the bulk electric field within the sample. The first term in Expression (5) contributes the anchoring free energy and is governed by the net interaction energy between LCs and the dipole moments of azo dye molecules and charge densities. The torques induced by interaction between the electric field of the exposure light and dipole moments provide two-dimensional control over its orientation.
2.2. Steric Interactions
With the particles of axial symmetry, the contribution of intermolecular steric interactions is well described by the GB potential and given as follows:
where A is the range parameter, given by and is the strength parameter; is the anisotropy parameter. Let these vectors be defined as follows: and ; the critical radius is defined as follows: , where . Here indicates the shape anisotropy parameter given by the ratio between the minor and major axes; i.e., . Let us remark that Model (6) suggests that the molecules are identical, which slightly contradicts the molecular lengths of azo dye and LC. Meanwhile, we will continue to use this model for estimation of azo dye–LC repulsive effects.
Surface arrangement of LCs and AD is driven by aromatic stacking interactions. Due to steric repulsions, adjacent molecular rods are expected to align in a random fashion. It is reasonable to consider the following types steric of interactions: AD-AD, LC-AD, and LC-LC and estimate the excluded volume effects between two molecules.
Let long molecular axes of azo dye and nematic LC molecules be represented as long cylinders; i.e., , where is the length and is the diameter. We note that steric coupling and dipole–dipole interaction are described by different principal axes defining long molecular axes , and dipole moment , which increases the complexity of our study. By adopting the Onsager theory [35,36], we can estimate the excluded volumes for steric interactions:
One can estimate the typical values of AD molecular length and diameter as 35 Å and 5 Å, respectively. Accordingly, LC molecular length and diameter are 20 Å and 5 Å. This enables us to calculate the excluded volumes for perpendicular alignment: nm3, nm3, and nm3 (see Figure 2a). Here we can see that a relatively large length of an AD molecule leads to considerable values of the excluded volume. On the other hand, a low concentration (%) of AD molecules dissolved in N,N-Dimethylformamide will not have any effect on the excluded volume. In order to support our assumption, one can easily compare the total volume of a 1 nm-thick layer per 1 cm2 ( m3) and the excluded volume of AD molecules in this bulk. Let the densities of N,N-dimethylformamide solution and SD1 be identical kg/m3; the molar mass of SD1 is known: 0.6865 kg/mol. Then this volume contains molecules, which produce an excluded volume of m3. Therefore, steric interactions in the system of AD molecules do not have any significant effect. Meanwhile, the excluded volume effect in steric interactions between LC-AD molecules must play a dominant role because steric and dipole–dipole interactions between LC and AD molecules contribute to surface anchoring energy [22].
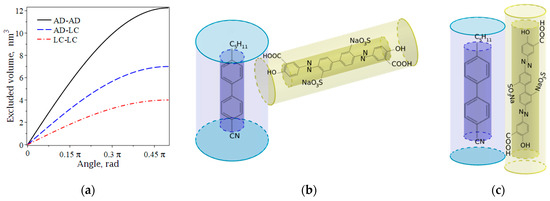
Figure 2.
(a) Excluded volume versus principal axes, defining long molecular axes; illustration of the excluded volume effects for uniaxial molecules of LC and AD: (b) perpendicular and (c) parallel alignment. Chemical formulas in cylinder-shaped molecules represent azo dyes SD1m and SD1, respectively. Half-transparent cylinders denote the excluded volume.
In order to show the feasibility of various configurations between and vectors that provide the continuous dependence depicted in Figure 2a, consider NaO3S groups in the benzene rings. Simulations in Vega ZZ show that the position of the NaO3S group results in the changes in electron density, the spatial arrangement of atoms, and the direction of the net dipole moment with respect to the long molecular axis. An isomer of SD1 with the modified position of NaO3S group (SD1m) possesses a dipole moment aligned perpendicular to its principal axis. Figure 2b shows the perpendicular arrangement of azo dye SD1m and nematic LC 5CB. The dipole moment of the well-known SD1 is applied along the molecular axis and results in the planar alignment of the LCs (see Figure 2c). Figure 2 also illustrates that perpendicular orientation of the rods results in a greater excluded volume (the area bounded by the shadowed surfaces) than parallel alignment (see Equation (7)).
By careful selection of the governing parameters in Equation (6), one can show that planar alignment () with cluster formation is favored at the surface. A major explanation of this behavior is hydrogen bonding. In particular, surface coating with azo dye molecules (SD1) induces hydrogen bonds between OHH, OHS and NHO groups [37]. Hydrogen bonding between main chain structures of interacting molecules results in the formation of clusters. The characteristic time for H-bond formation/dissociation is about s, which is much smaller than the thermodynamic relaxation time of SD1 () [3].
In order to obtain SD1-LC molecular system, two molecules were packed by using molecular visualization software PyMol 3.1.0. Then the two molecules were saved as a single file. Initial molecular system of many SD1-LC pairs was randomly generated by using Julia 1.11.2—platform runner for Packmol—software for initial molecular dynamics simulation [38]. Then we used the CHARMM force field, implemented in Vega ZZ 3.2.3.28, where hydrogen bonding is included implicitly in the electrostatic and van der Waals interactions. Our molecular simulation of the initial alignment shows that the azo dye molecules initially form clusters with the preferred alignment direction (see Figure 3). Further changes in molecular alignment are possible by photodissociation of hydrogen bonds. Then hydrogen bonds are formed again.
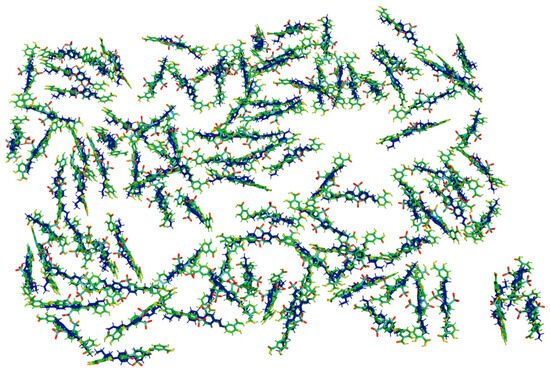
Figure 3.
Simulation of 5CB (blue molecules) alignment along long molecular axis of SD1 (green molecules) on the substrate plane; surface size: 150 Å 150 Å.
If the separation between molecular centers increases, it approaches to the critical radius , when steric interactions become vanishingly small (see Figure 4). We also note that angle does not produce any contribution to steric interactions.
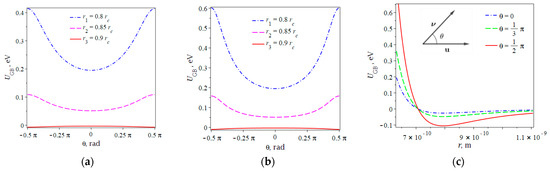
Figure 4.
Repulsive effect of steric interaction for various distances between molecular centers of AD and LC for (a) and (b) ; (c) Gay−Berne potential versus separation distance between molecular centers of azo dye and LC for various angles .
Investigation of the role of the anisotropy parameter on steric effects reveals an increase in potential for the perpendicular alignment of azo dye and LC molecules (see Figure 4b). Further assessment of the potential (6) versus separation distance r for various pretilt angles is depicted in Figure 4b. The separation distance that produces a repulsive potential of 0.01–0.1 eV represents a special interest because it corresponds to the typical intermolecular bonds that stabilize LC molecules on the surface. Note that we do not minimize the GB potential with respect to the intermolecular vector because there exist a number of other interactions. We only aim to make an assessment of the values of interaction energies.
Our assumption here is that the molecular anisotropy parameter is identical for AD and LC molecules, which might seem unrealistic, but it provides bold estimations of steric interactions for a number of compounds with various ratios between minor and major axes.
2.3. Photoinduced Potential
In order to reveal the nature of photoinduced interaction, let us refer to the Fokker–Planck equation. A key assumption taken in the diffusion models is that the angular distribution function of rod-like AD molecules must satisfy the rotational free energy:
where represents the rotational diffusion tensor and is the angular momentum operator that can be expressed in terms of the Euler angles parametrization, i.e., differential operators have the form: . These simplified identities assume that the angular momentum operator is independent of the third Euler angle. Note that the momentum operator in (8) is expressed in terms of polar and azimuthal angles: , where . This substitution will lead to the replacement of spatial translations to rotations in the space of Euler angles. Since the effective free energy functional is the sum of the effective internal energy and the Boltzmann entropy, i.e., , then the free energy term in Equation (8) can be written in a new form:
Therefore, rotational diffusion is governed by the effective mean field potential . If out of plane reorientations are suppressed, then the mean field potential is equal to the photoinduced interaction and van der Waals interactions; i.e., [22]. For rod-like SD1 molecules (see Figure 2) with cylindrical symmetry, only the angle between the absorption oscillator and direction of the polarization plane matters. The selection rules of the absorption process dictate that the transition probability is proportional to . As a result, rotational diffusion leads to an appearance of photoinduced dichroism and birefringence [3,39].
Let us estimate the term . Typical values of dye molecular length and diameter constitute 35 Å and 5 Å, respectively. Then the molecular volume can be calculated as follows: nm3. Referring to the rotational diffusion model, let , m−1 and s; therefore eV; i.e., photoinduced interaction potential is comparable to intermolecular interaction energies.
3. Discussion
We have found that dipole–dipole coupling potential between LC and AD molecules is sensitive to the angular distribution of dipole moments. The proposed model calculates the depth of the potential well in the net dipole–dipole interactions. Our theoretical calculations favor the presence of a potential well of eV to rotate a molecule of azo dye when LC and AD dipole moments are perpendicular to each other. This observation is consistent with the saturated dependence of the azimuthal anchoring energy of LC [26]. It is clear that the positive values of the term correspond to the repulsive effect; meanwhile, the cohesive effect between LC and AD molecules is also due to the impact of attractive van der Waals forces. This result can be treated as generalized, since we only considered dipole moments, not chemical structures.
Expressions for dipole–dipole and steric interactions (2) and (6) enable us to estimate these energies versus the direction of dipole moments and intermolecular distance. According to Onsager theory, these interactions must be supplemented by the effect of steric exclusion, described by Equation (7). However, the contribution of the dipole–dipole potential (2) to the free energy is ill defined and is not evaluated in a straightforward way.
The dipole moment vector in AD molecule does not always coincide with its long molecular axis u (see Figure 1). In particular, the dihedral angle between ring planes is about 12°. This means that the total dipole moment has a number of projections, and LC molecules can be aligned to any energetically preferable position. In other words, central alignment as depicted in Figure 2 represents one of a number of possible configurations.
According to our qualitative estimations shown in Figure 1b and Figure 4, the attractive contribution of van der Waals and dipole–dipole interactions is superior to the repulsive effect of LC-AD steric interactions, promoting planar alignment of LCs. Our further observation concerns Expressions (5) and (8). Light exposure induces rotational diffusion, which increases surface dipole moments and and anchoring energy. The anchoring energy achieves saturation when the dipole moments of AD and LC molecules have head-to-tail alignment. This is consistent with the saturated dependence of the azimuthal anchoring energy of nematic LCs [26].
4. Conclusions
In this article, we estimated the contribution of potential couplings during the rotational diffusion of azo dyes. Dipole–dipole interactions constitute the dominant factor of planar alignment of NLCs. Therefore, the investigation of the potential energy of pairwise dipole–dipole couplings versus the twist angle generalizes our results for other types of nematic LCs.
Development of mathematical formalism in dispersion interactions suggests that the interaction potential is equal to the photoinduced interaction and van der Waals interactions. The contribution of short-range steric interactions between azo dye molecules is negligibly small due to their low concentration. Investigation of steric and dipole–dipole interactions between AD and LC molecules can give indirect information to chemists and experimentalists regarding how to control attractive and repulsive forces.
Although our work is theoretical, it provides a currently unavailable framework for the analysis of potential interactions between photosensitive azo dye coatings and liquid crystals.
Author Contributions
Conceptualization: A.K. and V.C.; software and writing—original draft preparation: A.K. and A.P.; figures and editing: A.P. All authors have read and agreed to the published version of the manuscript.
Funding
The contribution of A. Kudreyko was supported by the Bashkir State Medical University Strategic Academic Leadership Program (PRIORITY-2030).
Data Availability Statement
All data are contained within the article.
Conflicts of Interest
The authors declare no conflict of interest.
References
- Ichimura, K.; Suzuki, Y.; Seki, T.; Hosoki, A.; Aoki, K. Reversible change in alignment mode of nematic liquid crystals regulated photochemically by command surfaces modified with an azobenzene monolayer. Langmuir 1988, 4, 1214–1216. [Google Scholar] [CrossRef]
- Ichimura, K. Photoalignment of Liquid-Crystal Systems. Chem. Rev. 2000, 100, 1847–1874. [Google Scholar] [CrossRef] [PubMed]
- Chigrinov, V.; Pikin, S.; Verevochnikov, A.; Kozenkov, V.; Khazimullin, M.; Ho, J.; Huang, D.D.; Kwok, H.-S. Diffusion model of photoaligning in azo-dye layers. Phys. Rev. E 2004, 69, 061713. [Google Scholar] [CrossRef] [PubMed]
- Nasrollahi, A.; Rella, A.K.; Kumar, V.; Kang, S.-W. Stepwise Progression of Dye-Induced In Situ Photoalignment and Subsequent Stabilization for Noncontact Alignment of Liquid Crystals. ACS Appl. Mater. Interfaces 2024, 16, 24052–24062. [Google Scholar] [CrossRef]
- Quiroga, J.A.; Canga, I.; Alonso, J.; Crespo, D. Reversible Photoalignment of Liquid Crystals: A Path toward the Creation of Rewritable Lenses. Sci. Rep. 2020, 10, 1–9. [Google Scholar] [CrossRef]
- Pan, J.-T.; Zhu, B.-H.; Ma, L.-L.; Chen, W.; Zhang, G.-Y.; Tang, J.; Liu, Y.; Wei, Y.; Zhang, C.; Zhu, Z.-H.; et al. Nonlinear geometric phase coded ferroelectric nematic fluids for nonlinear soft-matter photonics. Nat. Commun. 2024, 15, 8732. [Google Scholar] [CrossRef]
- Folwill, Y.; Zeitouny, Z.; Lall, J.; Zappe, H. A practical guide to versatile photoalignment of azobenzenes. Liq. Cryst. 2021, 48, 862–872. [Google Scholar] [CrossRef]
- Li, C.-Y.; Liu, S.-J.; Wu, H.-J.; Jiang, J.-Q.; Zhao, B.; Rosales-Guzmán, C.; Zhu, Z.-H.; Chen, P.; Lu, Y.-Q. Modal interface for structured light via liquid-crystal planar optics. Phys. Rev. Appl. 2024, 21, 034021. [Google Scholar] [CrossRef]
- Nys, I.; Ropač, P.; Berteloot, B.; Ravnik, M.; Neyts, K. Highly dispersive liquid crystal diffraction gratings with continuously varying periodicity. J. Mol. Liq. 2023, 383, 122062. [Google Scholar] [CrossRef]
- Ferrarini, A.; Moro, G.; Nordio, P.; Luckhurst, G. A shape model for molecular ordering in nematics. Mol. Phys. 1992, 77, 1–15. [Google Scholar] [CrossRef]
- Dadivanyan, A.K.; Pashinina, Y.M.; Chausov, D.N.; Belyaev, V.V.; Solomatin, A.S. Mesogen Molecules Orientation on Crystal Surfaces. Mol. Cryst. Liq. Cryst. 2011, 545, 159–1383. [Google Scholar] [CrossRef]
- Tavarone, R.; Charbonneau, P.; Stark, H. Kinetic Monte Carlo simulations for birefringence relaxation of photo-switchable molecules on a surface. J. Chem. Phys. 2016, 144, 104703. [Google Scholar] [CrossRef] [PubMed]
- Geng, Y.; Yao, L. Effect of azimuthal anchoring energy on rewriting speed of optical rewritable e-paper. Liq. Cryst. 2021, 48, 915–921. [Google Scholar] [CrossRef]
- de Souza, R.F.; Zannoni, C. Rotational diffusion of shape-switching particles dissolved in biaxial liquid crystals. Liq. Cryst. 2023, 51, 919–935. [Google Scholar] [CrossRef]
- Jung, K.H.; Hyun, S.-Y.; Song, D.-M.; Shin, D.-M. The characteristics of polyimide photoalignment layer with chalcone derivatives produced by linear polarized UV light. Opt. Mater. 2003, 21, 663–666. [Google Scholar] [CrossRef]
- Song, D.-M.; Jung, K.-H.; Moon, J.-H.; Shin, D.-M. Photochemistry of chalcone and the application of chalcone-derivatives in photo-alignment layer of liquid crystal display. Opt. Mater. 2003, 21, 667–671. [Google Scholar] [CrossRef]
- Dogra, A.R.; Sharma, V.; Malik, P.; Kumar, P. In-situ homeotropic alignment of dye doped liquid crystal molecules on multilayered self assembled nanoparticles in confined cells for next generation display devices. Opt. Mater. 2024, 154, 115731. [Google Scholar] [CrossRef]
- Ho, J.Y.L.; Chigrinov, V.G.; Kwok, H.S. Variable liquid crystal pretilt angles generated by photoalignment of a mixed polyimide alignment layer. Appl. Phys. Lett. 2007, 90, 2748345. [Google Scholar] [CrossRef]
- Almasri, R.M.; Lim, S.S.; Lovell, N.H.; Ladouceur, F.; Al Abed, A. Alignment assessment of anisotropic liquid crystals through an automated image processing algorithm. J. Mol. Liq. 2024, 408, 125243. [Google Scholar] [CrossRef]
- Ma, H.; Wereley, S.T.; Linnes, J.C.; Kinzer-Ursem, T.L. Computational fluid dynamics method for determining the rotational diffusion coefficient of cells. Phys. Fluids 2024, 36, 0193862. [Google Scholar] [CrossRef]
- Berteloot, B.; Nys, I.; Liu, S.; Neyts, K. Two-Dimensional Liquid-Crystal Photoalignment by Multiple Illumination Steps. ACS Appl. Opt. Mater. 2023, 2, 1295–1302. [Google Scholar] [CrossRef]
- Blinov, L.M. Structure and Properties of Liquid Crystals; Springer Science & Business Media: Berlin/Heidelberg, Germany, 2010; Volume 123. [Google Scholar]
- Guo, Q.; Srivastava, A.; Chigrinov, V.; Kwok, H. Polymer and azo-dye composite: A photo-alignment layer for liquid crystals. Liq. Cryst. 2014, 41, 1465–1472. [Google Scholar] [CrossRef]
- Kiselev, A.D.; Chigrinov, V.G.; Kwok, H.-S. Kinetics of photoinduced ordering in azo-dye films: Two-state and diffusion models. Phys. Rev. E 2009, 80, 011706. [Google Scholar] [CrossRef] [PubMed]
- Gay, J.G.; Berne, B.J. Modification of the overlap potential to mimic a linear site–site potential. J. Chem. Phys. 1981, 74, 3316–3319. [Google Scholar] [CrossRef]
- Chigrinov, V.G.; Kozenkov, V.M.; Kwok, H.-S. Photoalignment of Liquid Crystalline Materials: Physics and Applications; John Wiley & Sons: Hoboken, NJ, USA, 2008; Volume 17. [Google Scholar]
- Ishihara, S.; Mizusaki, M. Alignment control technology of liquid crystal molecules. J. Soc. Inf. Disp. 2020, 28, 44–74. [Google Scholar] [CrossRef]
- Osipov, M. Dipole-dipole interactions and the origin of ferroelectric ordering in polar nematics. Liq. Cryst. 2024, 1–7. [Google Scholar] [CrossRef]
- Dunmur, D.; Palffy-Muhoray, P. A mean field theory of dipole-dipole correlation in nematic liquid crystals. Mol. Phys. 1992, 76, 1015–1023. [Google Scholar] [CrossRef]
- Thoms, E.; Yu, L.; Richert, R. From very low to high fields: The dielectric behavior of the liquid crystal 5CB. J. Mol. Liq. 2022, 368, 120664. [Google Scholar] [CrossRef]
- Agwamba, E.C.; Udoikono, A.D.; Louis, H.; Udoh, E.U.; Benjamin, I.; Igbalagh, A.T.; Edet, H.O.; Ejiofor, E.U.; Ushaka, U.B. Synthesis, characterization, DFT studies, and molecular modeling of azo dye derivatives as potential candidate for trypanosomiasis treatment. Chem. Phys. Impact 2022, 4, 100076. [Google Scholar] [CrossRef]
- Muravsky, A.; Murauski, A.; Kukhta, I.N. Photoinduced hole dipoles’ mechanism of liquid crystal photoalignment. Appl. Opt. 2020, 59, 5102–5107. [Google Scholar] [CrossRef]
- Groh, B.; Dietrich, S. Long-ranged orientational order in dipolar fluids. Phys. Rev. Lett. 1994, 72, 2422–2425. [Google Scholar] [CrossRef] [PubMed]
- Wells, B.A.; Chaffee, A.L. Ewald summation for molecular simulations. J. Chem. Theory Comput. 2015, 11, 3684–3695. [Google Scholar] [CrossRef] [PubMed]
- Onsager, L. The effects of shape on the interaction of colloidal particles. Ann. N. Y. Acad. Sci. 1949, 51, 627–659. [Google Scholar] [CrossRef]
- Zannoni, C. Liquid Crystals and Their Computer Simulations; Cambridge University Press: Cambridge, UK, 2022. [Google Scholar]
- O’Neill, M.; Kelly, S.M. Photoinduced surface alignment for liquid crystal displays. J. Phys. D Appl. Phys. 2000, 33, R67–R84. [Google Scholar] [CrossRef]
- Martínez, L.; Andrade, R.; Birgin, E.G.; Martínez, J.M. Packmol: A package for building initial configurations for molecular dynamics simulations. J. Comput. Chem. 2009, 30, 2157–2164. [Google Scholar] [CrossRef]
- Boychuk, A.; Shibaev, V.; Cigl, M.; Pomeisl, K.; Hamplová, V.; Pociecha, D.; Bubnov, A.; Bobrovsky, A. Photo-orientation Processes in Liquid Crystalline Polymethacrylates with Side Azobenzene Groups Having Lateral Methyl Substituents. Macromolecules 2021, 54, 10499–10509. [Google Scholar] [CrossRef]
Disclaimer/Publisher’s Note: The statements, opinions and data contained in all publications are solely those of the individual author(s) and contributor(s) and not of MDPI and/or the editor(s). MDPI and/or the editor(s) disclaim responsibility for any injury to people or property resulting from any ideas, methods, instructions or products referred to in the content. |
© 2024 by the authors. Licensee MDPI, Basel, Switzerland. This article is an open access article distributed under the terms and conditions of the Creative Commons Attribution (CC BY) license (https://creativecommons.org/licenses/by/4.0/).