Article

Crystal Growth and Spectroscopy of Yb2+-Doped CsI Single Crystal

by
Dmitriy Sofich
1,*,
Alexandra Myasnikova
1,
Alexander Bogdanov
1,
Viktorija Pankratova
2,
Vladimir Pankratov
2,
Ekaterina Kaneva
1 and
Roman Shendrik
1
1
Vinogradov Institute of Geochemistry, Irkutsk 664033, Russia
2
Institute of Solid State Physics, University of Latvia, 8 Kengaraga Iela, LV-1063 Riga, Latvia
*
Author to whom correspondence should be addressed.
Crystals 2024, 14(6), 500; https://doi.org/10.3390/cryst14060500
Submission received: 9 May 2024 / Revised: 18 May 2024 / Accepted: 23 May 2024 / Published: 24 May 2024
(This article belongs to the Special Issue Crystals for Radiation Detectors, UV Filters and Lasers)

Abstract

:
The single crystals of CsI-Yb2+ were grown, and their spectroscopic studies were conducted. The observed luminescence in CsI-Yb2+ is due to 5d–4f transitions in Yb2+ ions. Using time-resolved spectroscopy, spin-allowed and spin-forbidden radiative transitions of ytterbium ions at room temperature were found. The excitation spectra of Yb2+ luminescence bands were obtained in the range of 3–45 eV. The mechanism of charge compensation of Yb2+ ions in a CsI crystal was also studied, the spectrum of the thermally stimulated depolarization current was measured, and the activation energies of the two observed peaks were calculated. These peaks belong to impurity–vacancy complexes in two different positions. The charge compensation of Yb2+ occurs via cation vacancies in the nearest-neighbor and next-nearest-neighbor positions.The Yb2+ ions are promising dopants for CsI scintillators and X-ray phosphors in combination with SiPM photodetectors.

1. Introduction

Scintillators based on CsI have been known for quite a long time [1]. The most popular impurities for doping CsI crystals are Tl [2,3], Na [4,5], and Eu2+ [6,7,8]. The radiation defects in Tl-doped scintillators were studied in [9,10,11]. Despite the fact that halide scintillators are emerging with greater efficiency than CsI, such as SrI2-Eu [12,13,14], LaBr3-Ce [15,16], BaBrI-Eu [17,18,19], and BaBrCl-Eu [20], it does not lose its position on the market and remains one of the most popular scintillators at present. This is due to its relatively low price, as well as low hygroscopicity [21]. Currently, research is being conducted to increase the light output of CsI-Tl crystals using digital signal processing methods [22], modifying growth techniques [23], using photonic crystals [24], as well as co-doping with various cations [25]. Pure CsI crystals cooled to a temperature of 77 K exhibit high light output [26,27]. With increasing temperature, the decay of exciton excitations begins to occur non-radiatively, so CsI is doped with various impurities. The most studied process is the transfer of excitations to Tl+ luminescence centers [3,10,28,29]. Promising impurities for halide scintillators are divalent lanthanides, in particular, CsI-Eu2+. However, the processes of energy transfer in these crystals have been studied in much less detail. However, effective energy transfer from a self-trapped exciton to Eu2+ is noted [7].
Other divalent lanthanides have begun to be used as activators for scintillation halide crystals. For example, there are Yb2+ [30,31,32,33,34,35] and Sm2+ [36,37]. Energy of the 4f–5d transition in divalent Yb is slightly lower than in the Eu2+ ions. Therefore, the luminescence of Yb2+ is shifted to a longer wavelength region. Therefore, Yb2+ could be considered as an activator for a scintillation application. The divalent Yb and the alkali-earth halide materials, such as SrCl2+ and SrCl2−xBrx, demonstrated a high light yield up to 71,000 photons per MeV [33,35]. However, alkali halide scintillators (NaI, CsI) doped with Yb2+ have not been investigated yet. Previously, the optical properties of Yb2+ in crystals with the NaCl structure were widely studied [38,39]. The work [40] notes that the intensity of X-ray luminescence increases under irradiation in NaCl-Yb2+ crystals. The diffuse absorption and excitation spectra of the rapid melted NaI-Yb2+ were investigated in [41]. The two luminescence bands related to spin-allowed and spin-forbidden transitions at 427 and 464 nm were found. The bands were broadened due to charge compensation defects, but the origin of these defects was unclear.
Studies of CsI-Yb2+ crystals have not been previously carried out. Only some works [42,43] note that the addition of Yb to the charge when growing CsI-Tl crystals leads to a decrease in afterglow and an improvement in scintillation properties. A confirmation that Yb2+ is present in the crystal structure was not obtained in these works; in particular, spectra were not given where absorption bands characteristic of the 4f–5d transitions would appear. However, we can expect promising scintillation parameters from the CsI-Yb2+ single crystals based on previous studies of the Yb2+-doped alkali halide crystals [40,41]. In this work, the 4f–5d transitions in Yb2+ in single crystals of CsI are studied using optical absorption, luminescence, and thermally stimulated depolarization techniques. The prospects for doping CsI crystals with Yb2+ ions for use as scintillators are also being assessed.

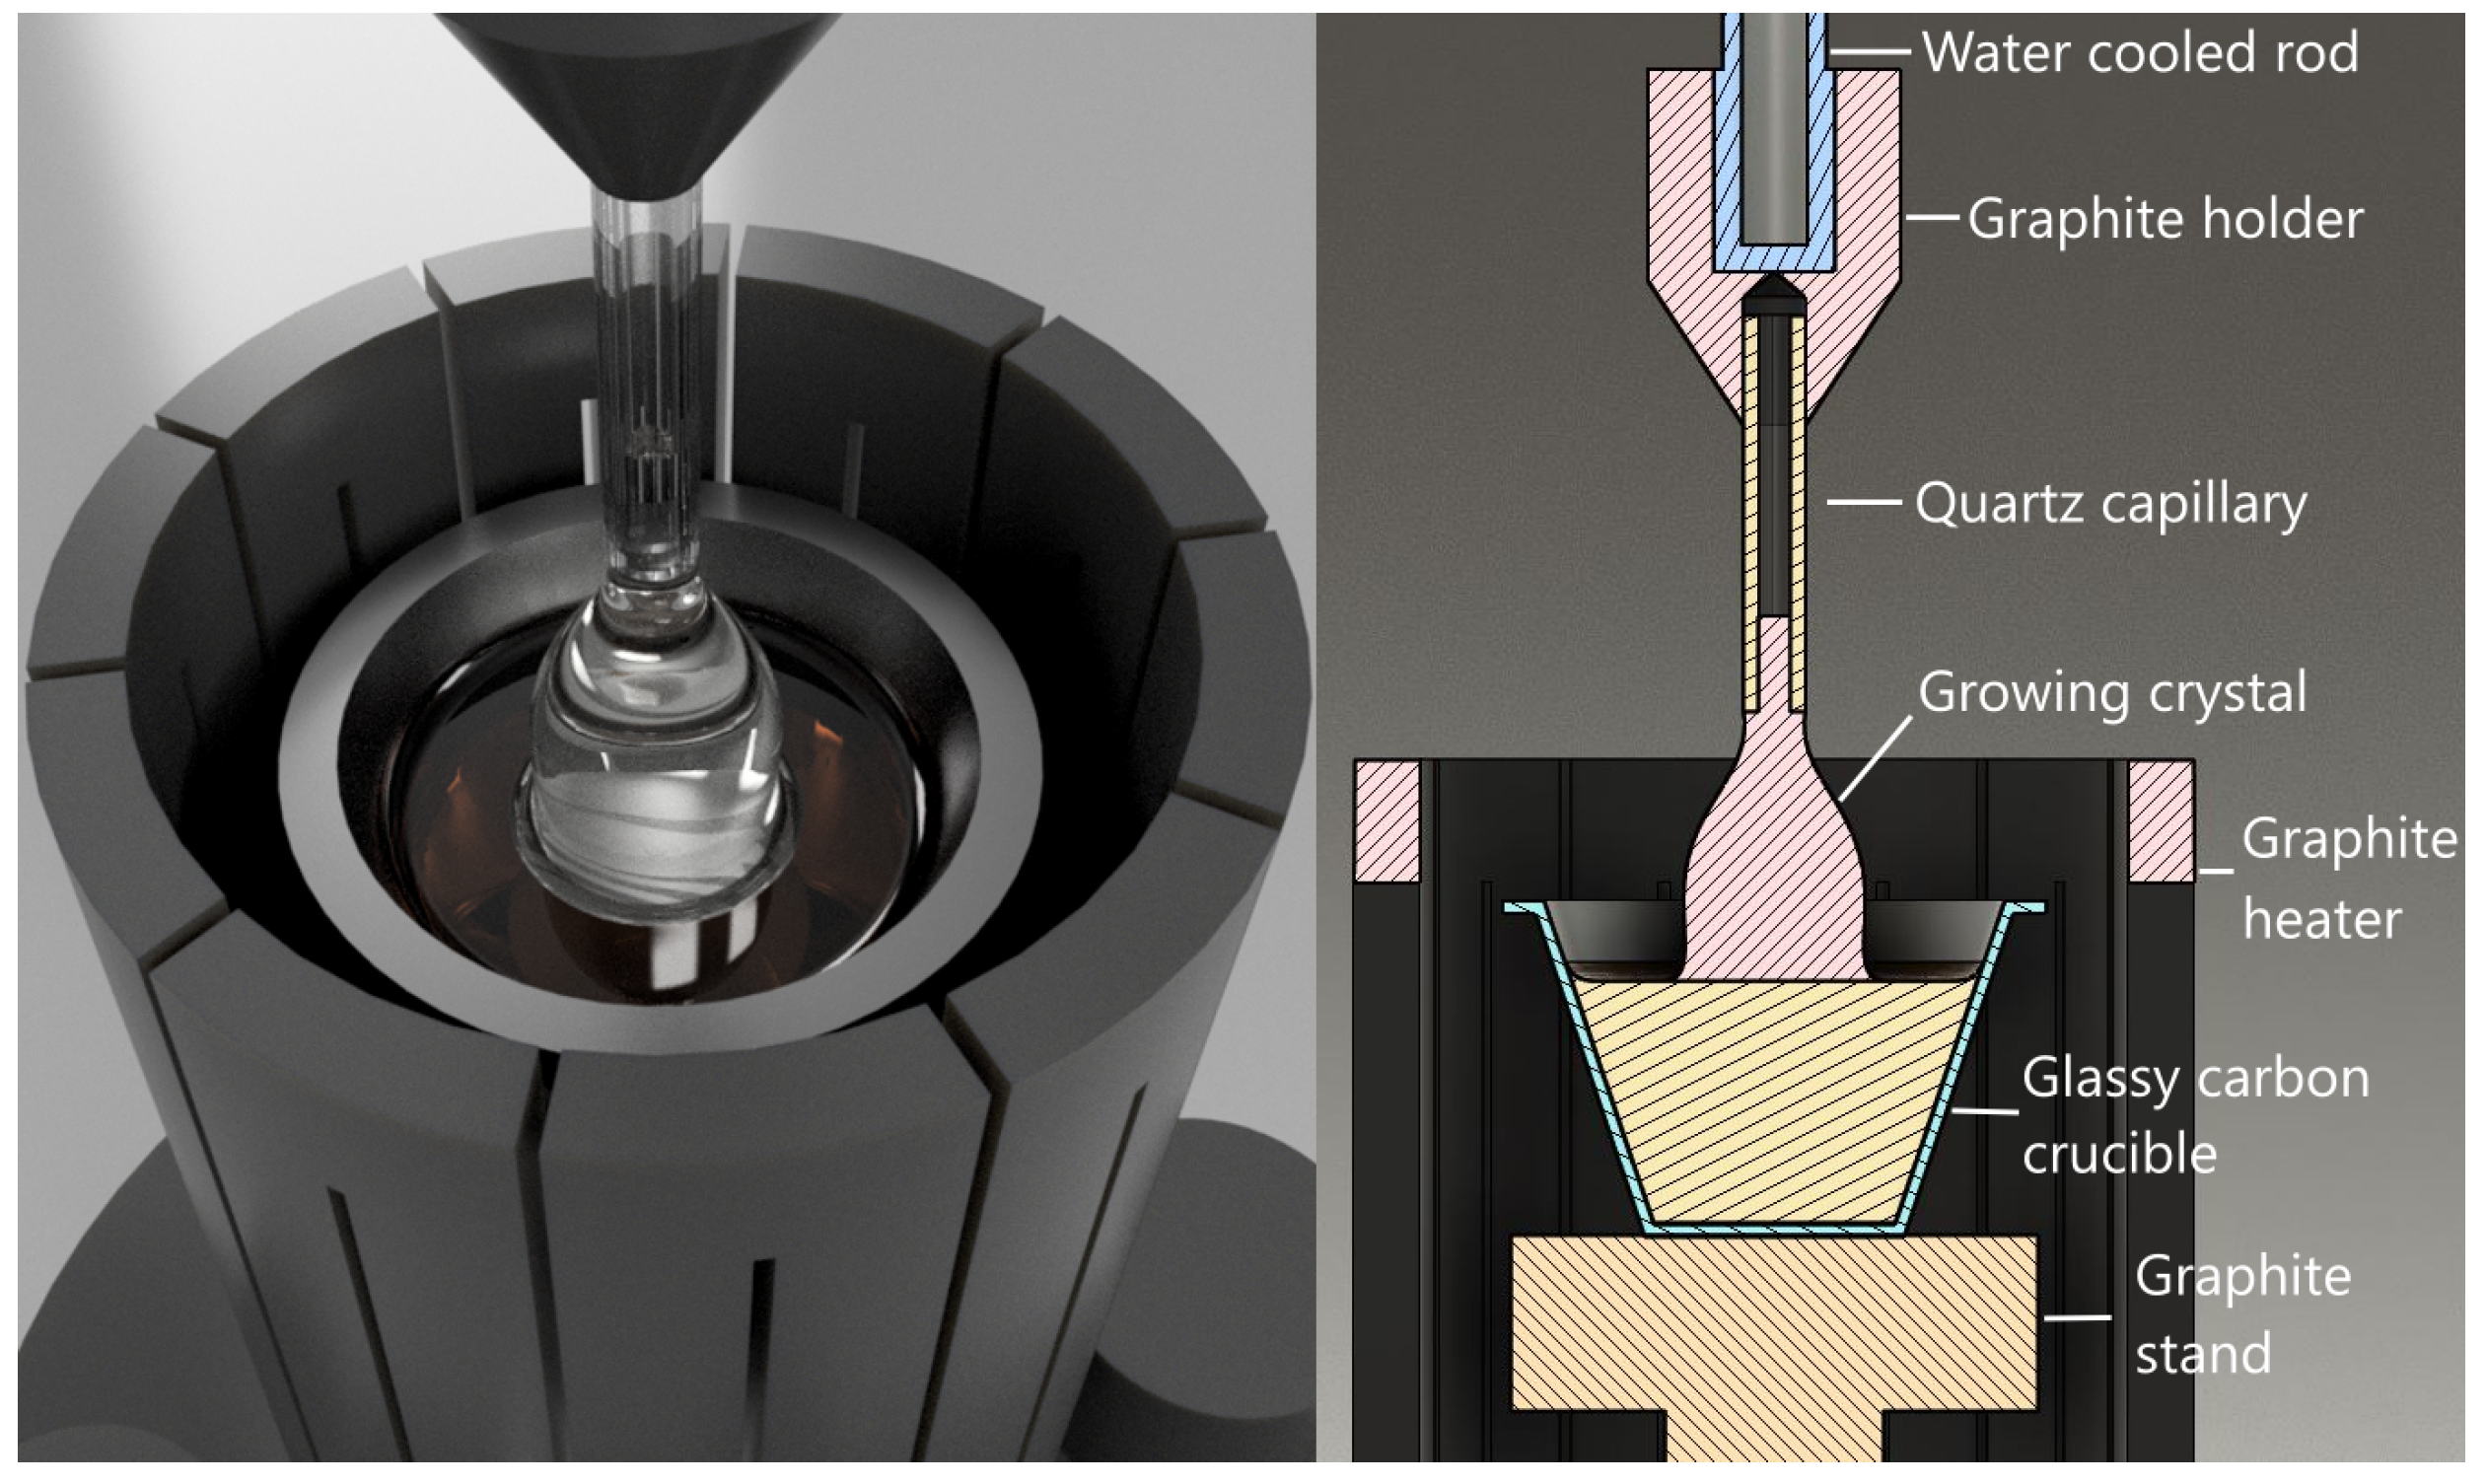
2. Materials and Methods

CsI:Yb2+ single crystals were grown from the melt using the Czochralski method within a specialized single crystal growth facility. The growth unit consists of a spherical water-cooled chamber constructed from stainless steel. The crystal pulling rod is cooled by thermostatically controlled water and driven by two stepper motors, enabling rotation and pulling of the crystal. A graphite adapter with a quartz capillary is installed at the end of the pulling rod. The furnace is equipped with a cylindrical heater and heat-insulating screens made of pyrolytic graphite. The temperature is controlled using a K-type thermocouple attached to the bottom of the crucible (Figure 1).
Granulated CsI produced by Lanhit (Moscow) was used as the material for crystal growth. The purity of this material was 99.998% (for metal impurities). YbI2 powder with a purity of 99.99% (Lanhit) was used as an activator. We used 160 g of CsI and 3 g of YbI2, so the concentration of ytterbium was approximately 1 mol.%. The material was placed into a carbon glassy crucible in the furnace, then the crucible was heated under the vacuum to eliminate adsorbed oxygen and moisture for five hours at a temperature of 500 °C. By the final stage of drying, the residual vapor pressure in the furnace was less than 0.01 Pa. Molten cesium iodide exhibits rapid evaporation in a vacuum; therefore, after drying, high-purity Ar gas was slowly introduced into the furnace until a pressure of 110 kPa was attained. We consider this inert gas pressure to be optimal for our furnace because cesium iodide evaporates slowly enough to grow the crystal and does not create strong convection that spoils the thermal field of the heater. The dried material was melted and overheated to 710 °C for 1 h to ensure homogenization. The temperature was then lowered to 645 °C, corresponding to 625 °C at the surface of the melt. The growth of a single crystal was started by seeding onto a quartz capillary; the melt formed a meniscus inside the capillary where the single crystal growth process began. The coefficient of thermal expansion of cesium iodide is greater than that of quartz, so after seeding, it is necessary to first grow a thin part of the crystal (crystal neck) at a slightly higher temperature to avoid cracking during the growth of the main body of the crystal. The crystal growth rate was 1 mm/hour; the rotation speed was 1.2 rpm. The grown crystal was raised above the melt and annealed at the growth temperature for 12 h, then the temperature was decreased at a rate of 5 °C per hour to 500 °C. Finally, the crystal was gradually cooled to room temperature over the next 30 h.
The concentration of Yb2+ in the raw material is much higher than in the bulk. The estimated concentration of Yb2+ in the studied single crystals is about 10−3 mol.%. The difference in Yb2+ concentration between the melt and crystal could be due to a low Yb2+ impurity distribution coefficient. In some alkali halides, the divalent impurities could have low values of the impurity distribution coefficient [44]. Another factor that influences the Yb2+ concentration in the bulk is the contamination by uncontrollable water molecules during crystal growth, which leads to the formation of oxyiodides.
The CsI:Yb2+ crystal was grown at a rate of 1 mm per hour with a constant rotation of 1.2 revolutions per minute. The growth process lasted 42 h, following which the crystal underwent annealing in a chamber for 30 h, during which the temperature gradually decreased to eliminate internal stresses.
The samples were cut in 2 and 10 mm thick plates and polished for optical experiments. Optical absorption spectra of polished 10 mm CsI-Yb plates were measured using a Lambda 950 spectrophotometer (Perkin-Elmer, NY, USA) at room temperature. The spectral slit width was set to 2 nm. The limit of spectral resolution of the spectrophotometer was 0.2 nm [45]. However, the absorption bands of CsI-Yb2+ are much broader than the limit of resolution.
The luminescence spectra were registered by an LS-55 spectrofluorimeter (Perkin-Elmer, NY, USA) and a spectrometer based on SDL-1 and MDR-2 grating monochromators (LOMO, Saint-Petersburg, Russia) equipped with a grating of 1200 and 600 lines per mm. A Hamamatsu H6780-04 photomultiplier module was used as a photodetector. The slits widths in the luminescence measurements were about 4 nm. The time-resolved luminescence spectra and long time decay curves in the 0–3 ms time window were measured using an LS-55 spectrofluorimeter. The short-time luminescence decay under nitrogen-laser excitation ( λ = 337 nm, 8 ns pulse duration) was recorded using a Hamamatsu H6780-04 photomodule and Rigol 1202Z oscilloscope (Beijing, China).
Ionic thermocurrent was measured using a picoampermeter A2-4 (MNIPI, Minsk, Belarus). Measurements were conducted in a vacuum with a Pt electrode and heating rate as 20 K min−1. The sample (about 14 mm in diameter and about 1.6 mm thick) was attached to the cryostat with a spring-loaded platinum electrode; the polarization of the dipoles was carried out at room temperature with a voltage of 1.4 kV for 2–3 min and then cooled to 90 K. Then, the electrodes were connected to a picoammeter, and the current was recorded during the heating process.
The luminescence experiments under VUV excitations were carried out using synchrotron radiation from a 1.5 GeV storage ring of the MAX IV synchrotron facility (Lund, Sweden). The luminescence experiments under synchrotron radiation excitations are a powerful tool for the study of scintillators [46,47]. The experiments were performed at the photoluminescence end station of FinEstBeAMS beamline. The parameters of the beamline and the experimental setup are given in [48,49,50,51]. The spectral resolution of the excitation spectra measurements were about 3 meV [48,52].

Theoretical Calculations

Geometry optimization for CsI-Yb2+ crystals was performed using density functional theory (DFT) within the VASP software package [53] and on the “Akademik V.M. Matrosov” computing cluster [54]. A 3 × 3 × 3 supercell with 216 atoms was constructed, with one Yb2+> ion replacing a lattice cation. Atomic positions and crystal symmetry were obtained from the ICSD database [55]. The PBEsol exchange–correlation functional and a G-centered grid of 8 k-points in the irreducible Brillouin zone were used for the gradient approximation geometry optimization, while preserving the cell shape and volume. Convergence was determined if the difference in total energies between iterations did not exceed 10−6 eV. The plane wave expansion energy cutoff was set as 500 eV.
Optical absorption spectra were calculated using the Orca software package [56]. A cluster consisting of an Yb2+ ion, 12 cesium ions, and 14 iodine ions was extracted from the optimized supercell. This quantum cluster was surrounded by several hundred cesium ions described by SDD pseudopotentials and several thousand point charges. The def2-TZVP pseudopotential was used for quantum domain calculations [57]. The TD-DFT (time dependent DFT) approach was employed for calculating optical transitions.
In the first step, the geometries of the lattice with an Yb2+ ion and a charge-compensating vacancy in the nearest or distant environment were calculated. In the case of a nearby vacancy, the absence of a cation resulted in significant displacements of ions surrounding the ytterbium ion. The maximum displacement of iodine ions was found to be 0.72 Å, which corresponds to 18% of the Cs-I distance in a defect-free crystal. The absence of one cation also led to a displacement of Cs ions, with a maximum displacement of 0.62 Å (15% of the Cs-I distance). Consequently, the defect caused a local reduction in symmetry. On the other hand, when the vacancy was situated far from the ytterbium ion (at the supercell boundary), the local environment retained octahedral symmetry. The maximum displacement of iodine ions towards the Yb2+ ion was 0.69 Å (17%), while the displacements of Cs ions were negligible.

3. Results

The resulting single crystal measures 14 by 40 mm and exhibits no luminescence under 395 nm excitation. However, it displays intense blue luminescence when excited by a 395 nm UV diode (see Figure 2). The CsI-Yb2+ crystal exhibits luminescence in the blue-green spectral range when excited at 3.40 and 4.55 eV. At 290 K, the luminescence is characterized by two bands centered at 2.60 and 2.80 eV (Figure 3, curve 2). The X-ray luminescence outputs of the CsI:Yb2+ samples are estimated by comparison with CaF2:Eu2+ (21,000 photons/MeV). The largest light output is about 40,000 photons/MeV. The concentration of Yb2+ ions in the studied CsI is relatively low (10−3 mol%). Increasing the Yb2+ concentration up to one order of magnitude should increase light output [33].
The higher energy band decays exponentially with a time constant of approximately 69 ns (Figure 3, curve 3), while the lower energy band at 2.60 eV contains two exponential components with decay time constants of 280 and 500 µs (Figure 3, curve 4). The decay time curves are given in Figure 4. As the crystal cools, the intensity of the higher energy band at 2.80 eV decreases, while the intensity of the 2.60 eV band increases and slightly shifts to a lower energy region (Figure 3, curve 1). At lower temperatures, a new luminescence band centered at 3.60 eV appears under excitation at 5.90 eV (Figure 3, curve 5).
The absorption spectrum of CsI-Yb2+ reveals four bands at 3.05, 3.4, 3.9, and 4.55 eV (Figure 5a, dashed curve). The excitation spectrum, measured at 2.60 and 2.80 eV, shows six bands at 3.05, 3.40, 3.90, 4.55, 5.20, and 5.60 eV. Additionally, there are weak, sharper, structured bands observed near 5.90 eV (Figure 5a, black curve).
The excitation spectrum of the self-trapped exciton luminescence is presented in Figure 5a, (blue curve). It shows a peak at 5.9 eV and a sharp dip structure in the range between 5.75 eV and 6.3 eV. The dips in the spectrum are located at 5.83, 5.93, 6.00, and 6.25 eV (Figure 5b).
The comparison of experimental and calculated absorption spectra is given in Figure 6. The black vertical lines show the 4f14–4f135d1 transitions in the Yb2+ ion compensated by the cation vacancy in the next-nearest-neighbor position (nnn), while the red vertical lines show the 4f14-4f135d1 transitions in the Yb2+ ion when the cation vacancy is located in the nearest-neighbor (nn) position.
The excitation spectra, monitored at 2.60 eV and 3.60 eV, in the higher energy range of 7–45 eV are depicted in Figure 7. It is evident from the spectra that there is an increase in intensity at energies exceeding 12.00 eV.
The polarized CsI crystals doped with Yb2+ ions, cooled to 80 K, display prominent peaks in the thermally stimulated depolarization current at 190 and 205 K (Figure 8) in contrast to nominally pure CsI. The intensity of these peaks is observed to rise with an increase in the concentration of Yb2+ ions.

4. Discussion

Due to the closed 4f shell in Yb2+-doped materials, only broad luminescence bands attributed to transitions from the excited 4f135d1 state to the ground 4f14 state are observed. Generally, the 5d–4f emission of Yb2+ ions exhibits two bands due to the half-filled 4f shell. These bands correspond to a spin-forbidden high-spin transition, where excitation occurs with a reversal of spin, and a spin-allowed low-spin transition. The high-spin excited states have lower energy than the low-spin transitions, following Hund’s rules. Therefore, the observed luminescence band at 2.60 eV corresponds to the high-spin 5d-4f transition in Yb2+ ions. This transition is spin-forbidden, and the decay time constant of this luminescence lies in the hundreds of microseconds. The two components (280 and 500 μ s, Figure 4) in the luminescence decay are attributed to two Yb2+ different centers with a different charge compensation. The higher energy band at 2.80 eV is attributed to the low-spin 5d–4f transition. These transitions are spin-allowed, and their decay time is much shorter. In CsI-Yb2+, the decay time constant is about 69 ns.
Yb2+-doped alkali halides and alkali earth halides have been extensively studied [58]. Both spin-forbidden and spin-allowed emissions are observed in NaCl-Yb2+ and SrI2:Yb2+ [38]. The kinetic of luminescence was calculated for NaCl-Yb in [59]. Optical absorption spectra associated with Yb2+ in KI, NaI, KBr, NaBr, KCl, NaCl, and KF were obtained at both room and liquid nitrogen temperatures. In NaCl [38] and KCl and NaBr [60], nine groups of lines attributed to 4f14–4f135d1 transitions were identified. The excited 4f135d1 configuration of Yb2+ decomposes into a total of 58 levels under an octahedral crystal field, with 20 free-ion levels associated with it [61]. The theoretical analysis of the absorption spectra for the Oh point group was performed in [38], while an increase in absorption bands was observed for the C2v point group in the case of cation vacancy charge compensation [62]. The position of absorption bands was found to strongly depend on the strength of the crystal-field parameter B in different types of charge compensation scenarios. The lowest 4f–5d transition in a CsI-Yb2+ crystal has an energy of about 3.05 eV that is lower than in NaI-Yb2+, where it is about 3.18 eV [41]; in NaCl, the first 4f–5d Yb2+ band is about 3.26 eV [59].
The ab initio calculation without spin-orbital coupling predicts four groups of levels corresponding to 4f13(2F7/2)5d1(T2g). However, the inclusion of spin-orbital coupling leads to the appearance of a higher energy transition attributed to 4f13(2F5/2)5d1(T2 g ).
The ab initio calculation shows that the lowest energy bands in the absorption spectra correspond to transitions from 4f14 to triply degenerate 5d1 (T2g) states, but higher energy transitions are attributed to transitions to doubly degenerate 5d1 Eg states (Figure 6) in the nnn configuration when the cation vacancy is located in the next-nearest-neighbor position. The position of the 4f–5d absorption bands for the divalent Yb ion compensated by a cation vacancy in the nearest-neighbor (nn) configuration have higher energy and greater intensity. The comparison of the observed and measured absorption spectra shows the contributions from both Yb2+ centers. All the calculated bands in the absorption spectra in the range of 3–5 eV correspond to intracenter 4f–5d transitions. Transitions from the 4f level to the cation vacancy are not found in the calculation. Therefore, the cation vacancies do not participate in the observed electronic transitions. The differences between absorption spectra of Yb2+ compensated with the cation vacancy in nn and nnn positions are related to different point groups of Yb2+ ions.
The Yb2+ ions replace Cs+ ions in the material, necessitating charge compensation. This compensation can occur through the presence of interstitial iodine ions or cation vacancies in nearest-neighbor (nn) and next-nearest-neighbor (nnn) positions. The experimental absorption and excitation spectra are in good agreement with the calculated Yb2+ centers compensated by cation vacancies in the nn and nnn configuration.
The Yb2+-iodine vacancy and Yb2+-cation vacancy combinations form electrical dipoles. As a result, they can be polarized at low temperatures and subsequently depolarized during heating. This phenomenon gives rise to a thermally stimulated depolarization (TSD) curve. The TSD curve exhibits two closely located peaks at 195 and 205 K, which can be well-described by a first-order kinetic equation for thermally stimulated processes [63] (Equation (1)).
I T L = n 0 s exp E t k T exp s β T 0 T exp E t k θ d θ ,
The activation energies are 0.514 eV and 0.558 eV. The frequency factor, s = 5 THz, corresponds to the phonon modes present in CsI. The different types of dipoles have different activation energies. The observed peaks are attributed to Yb2+-cation vacancy dipoles, also known as I–V complexes. The lower energy peak is related to the reorientation of nearest-neighbor (nn) dipoles, while the peaks at 205 K correspond to the reorientation of next-nearest-neighbor (nnn) dipoles.
Similar thermally stimulated depolarization (TSD) phenomena have been observed in NaCl-type crystals doped with divalent cations within the temperature range of 190–230 K. The observed peaks in these crystals are also attributed to I–V complexes [64,65] in nn and nnn positions. In NaCl, the nn peak is located at 210 K, while the nnn peak is located at 230 K.
The presence of I–V centers in the TSD curve confirms that the charge compensation for Yb2+ occurs through cation vacancies. The intensity of TSD peaks attributed to I–V complexes in nn coordination is higher, indicating that the charge compensation mainly occurs through nearest-neighbor cation vacancies. The luminescence band at 3.60 eV is excited at approximately 5.80–6.00 eV and exhibits a sharp structure. The dips at 5.83, 5.93, 6.00, and 6.25 eV correspond to the n1 and n2 levels of the Γ (3/2, 1/2) exciton [37,66]. The observed structure is consistent with theoretical calculations and the experimental absorption spectrum of thin films of CsI [67]. The luminescence band at 3.60 eV corresponds to luminescence from off-center self-trapped excitons (STE) in CsI [68]. This band coincides with the wavelength range of the 4f–5d absorption of Yb2+ ions, indicating the possibility of exciton energy transfer to Yb2+ ions. This is supported by the presence of similar bands in the excitation spectrum of Yb2+ within the exciton excitation region. Similar energy transfer mechanisms have been observed in other effective halide scintillators, such as CsI-Tl [69] and CsI-Eu [3], BaBrI-Eu [19], BaBrI-Ce [70], and BaBrCl-Eu [71].
The excitation spectrum in the vacuum ultraviolet (VUV) region demonstrates the multiplication of electronic excitations. Although not as pronounced as in STE, increasing the concentration of Yb2+ up to 0.3–1 mol.% is expected to enhance the multiplications due to an increase in exciton energy transfer deposition.
The Yb2+ luminescence region coincides with the peak sensitivity of SiPM (Silicon Photomultiplier) detectors. Therefore, Yb2+ ions are promising dopants for CsI scintillators and X-ray phosphors when combined with SiPM photodetectors.

5. Conclusions

The first-time CsI-doped Yb2+ single crystal was given. The charge compensation of Yb2+ occurs in the nearest-neighbor and next-nearest-neighbor cation vacancies. The luminescence attributed to 5d–4f spin-allowed and spin-forbidden transitions was observed at 300 K. In the cooled-down samples, only spin-forbidden luminescence was detected. The excitation and absorption spectra of CsI-Yb2+ crystals demonstrate strong bands attributed to the 4f–5d transition in the energy range between 2.70–5.70 eV. The luminescence of Yb2+ is also excited in the excitonic range and demonstrates multiplication of electronic excitation in the range of 10–45 eV. That allows us to expect the promising scintillation properties of Yb2+ in CsI.

Author Contributions

Conceptualization, D.S. and R.S.; methodology, D.S., R.S., V.P. (Vladimir Pankratov), V.P. (Viktorija Pankratova) and A.M.; software, A.B.; validation, D.S., E.K. and V.P. (Vladimir Pankratov); formal analysis, V.P. (Viktorija Pankratova); investigation, D.S., R.S., A.M., V.P. (Vladimir Pankratov), V.P. (Viktorija Pankratova) and E.K.; resources, D.S.; data curation, A.M.; writing—original draft preparation, D.S. and R.S.; writing—review and editing, V.P. (Vladimir Pankratov); visualization, D.S. and R.S.; supervision, D.S.; project administration, D.S. and V.P. (Vladimir Pankratov); funding acquisition, D.S. All authors have read and agreed to the published version of the manuscript.

Funding

This work (crystal growth, spectroscopy, and measurements of thermally stimulated depolarization) was funded by the Russian Science Foundation (project No. 23-72-01097).

Data Availability Statement

The data presented in this study are available on request from the corresponding author due to privacy.

Acknowledgments

The authors are grateful to Kirill Chernenko for helping with the measurements at the MAX IV synchrotron facility. The geometry optimization was supported by the Russian academy of Science basic program (0284-2021-0004).The work of Vladimir Pankratov is supported by the LZP grant (2022/1-0611), while Viktorija Pankratova acknowledges the LZP grant (2023/1-0453). The Institute of Solid State Physics, University of Latvia as the Center of Excellence has received funding from the European Union’s Horizon 2020 Framework Programme H2020-WIDESPREAD-01-2016-2017-TeamingPhase2 under grant agreement No. 739508, project CAMART2. We acknowledge the MAX IV Laboratory for time on the FinEstBeAMS Beamline under Proposal 20211074. Research conducted at MAX IV, a Swedish national user facility, is supported by the Swedish Research council under contract 2018-07152, the Swedish Governmental Agency for Innovation Systems under contract 2018-04969, and Formas under contract 2019-02496.

Conflicts of Interest

The authors declare no conflicts of interest.

Abbreviations

The following abbreviations are used in this manuscript:
VUVVacuum ultraviolet
VASPThe Vienna Ab initio Simulation Package
SiPMSilicon photomultiplier
STESelf-trapped exciton

References

  1. Van Sciver, W.; Hofstadter, R. Scintillations in Thallium-Activated CaI2 and CsI. Phys. Rev. 1951, 84, 1062–1063. [Google Scholar] [CrossRef]
  2. Aitken, D.W.; Beron, B.L.; Yenicay, G.; Zulliger, H.R. The Fluorescent Response of NaI(Tl), CsI(Tl), CsI(Na) and CaF2(Eu) to X-Rays and Low Energy Gamma Rays. IEEE Trans. Nucl. Sci. 1967, 14, 468–477. [Google Scholar] [CrossRef]
  3. Yakovlev, V.; Trefilova, L.; Meleshko, A.; Alekseev, V.; Kosinov, N. Charge transfer processes in CsI:Tl using near-UV light. J. Lumin. 2014, 155, 79–83. [Google Scholar] [CrossRef]
  4. Imanaka, K.; Kayal, A.H.; Mezger, A.C.; Rossel, J. Self-Trapped Exciton Luminescence after Tunnelling of Vk and Nao Centers in CsI:Na Crystals. Phys. Status Solidi (B) 1981, 108, 449–458. [Google Scholar] [CrossRef]
  5. Yakovlev, V.; Trefilova, L.; Meleshko, A.; Ganja, Y. Short-living absorption and emission of CsI(Na). J. Lumin. 2011, 131, 2579–2581. [Google Scholar] [CrossRef]
  6. Savel’ev, V.; Avdonin, V.; Dugarova, L.; Nedashkovskij, A.; Plachenov, B. Aggregation of Eu2+centers in alkali halide crystals doped with Eu (in Russian). Fiz. Tverd. Tela 1974, 16, 1090–1093. [Google Scholar]
  7. Yakovlev, V.; Trefilova, L.; Karnaukhova, A.; Ovcharenko, N. Energy transfer mechanism in CsI:Eu crystal. J. Lumin. 2014, 148, 274–276. [Google Scholar] [CrossRef]
  8. Gektin, A.; Shiran, N.; Belsky, A.; Vasyukov, S. Luminescence properties of CsI:Eu crystals. Opt. Mater. 2012, 34, 2017–2020. [Google Scholar] [CrossRef]
  9. Chernov, S.; Trinkler, L.; Popov, A. Photo- and thermo-stimulated luminescence of CsI—Tl crystal after UV light irradiation at 80 K. Radiat. Eff. Defects Solids 1998, 143, 345–355. [Google Scholar] [CrossRef]
  10. Popov, A.; Chemov, S.; Trinkler, L. Time-resolved luminescence of CsI-Tl crystals excited by pulsed electron beam. Nucl. Instrum. Methods Phys. Res. Sect. B Beam Interact. Mater. Atoms 1997, 122, 602–605. [Google Scholar] [CrossRef]
  11. Popov, A.; Balanzat, E. F centre production in CsI and CsI:Tl crystals under Kr ion irradiation at 15 K. Nucl. Instrum. Methods Phys. Res. Sect. B Beam Interact. Mater. Atoms 2000, 166–167, 545–549. [Google Scholar] [CrossRef]
  12. Shoji, Y.; Kurosawa, S.; Yokota, Y.; Hayasaka, S.; Kamada, K.; Yoshino, M.; Yamaji, A.; Chani, V.; Ohashi, Y.; Sakuragi, S.; et al. Growth and Scintillation Properties of Two-Inch-Diameter SrI2(Eu) Single Crystals. Cryst. Growth Des. 2018, 18, 3747–3752. [Google Scholar] [CrossRef]
  13. Galenin, E.; Sidletskiy, O.; Dujardin, C.; Gektin, A. Growth and Characterization of SrI2:Eu Crystals Fabricated by the Czochralski Method. IEEE Trans. Nucl. Sci. 2018, 65, 2174–2177. [Google Scholar] [CrossRef]
  14. Smerechuk, A.; Galenin, E.; Nesterkina, V.; Sidletskiy, O.; Dujardin, C. Growth and scintillation performances of SrI2:Eu with low activator concentration. J. Cryst. Growth 2019, 521, 41–45. [Google Scholar] [CrossRef]
  15. Van Loef, E.V.D.; Dorenbos, P.; van Eijk, C.W.E.; Krämer, K.; Güdel, H.U. High-energy-resolution scintillator: Ce3+ activated LaBr3. Appl. Phys. Lett. 2001, 79, 1573–1575. [Google Scholar] [CrossRef]
  16. Alekhin, M.S.; de Haas, J.T.M.; Khodyuk, I.V.; Krämer, K.W.; Menge, P.R.; Ouspenski, V.; Dorenbos, P. Improvement of γ-ray energy resolution of LaBr3:Ce3+ scintillation detectors by Sr2+ and Ca2+ co-doping. Appl. Phys. Lett. 2013, 102, 161915. [Google Scholar] [CrossRef]
  17. Bourret-Courchesne, E.D.; Bizarri, G.; Hanrahan, S.M.; Gundiah, G.; Yan, Z.; Derenzo, S.E. BaBrI:Eu2+, a new bright scintillator. Nucl. Instrum. Methods Phys. Res. Sect. A Accel. Spectrometers Detect. Assoc. Equip. 2010, 613, 95–97. [Google Scholar] [CrossRef]
  18. Shendrik, R.; Shalaev, A.A.; Myasnikova, A.S.; Bogdanov, A.; Kaneva, E.; Rusakov, A.; Vasilkovskyi, A. Optical and structural properties of Eu2+ doped BaBrI and BaClI crystals. J. Lumin. 2017, 192, 653–660. [Google Scholar] [CrossRef]
  19. Shalaev, A.A.; Shendrik, R.; Myasnikova, A.S.; Bogdanov, A.; Rusakov, A.; Vasilkovskyi, A. Luminescence of BaBrI and SrBrI single crystals doped with Eu2+. Opt. Mater. 2018, 79, 84–89. [Google Scholar] [CrossRef]
  20. Shalapska, T.; Moretti, F.; Bourret, E.; Bizarri, G. Effect of Au codoping on the scintillation properties of BaBrCl:Eu single crystals. J. Lumin. 2018, 202, 497–501. [Google Scholar] [CrossRef]
  21. Zhuravleva, M.; Stand, L.; Wei, H.; Hobbs, C.; Boatner, L.A.; Ramey, J.O.; Shah, K.; Burger, A.; Rowe, E.; Bhattacharya, P.; et al. Hygroscopicity evaluation of halide scintillators. In Proceedings of the 2013 IEEE Nuclear Science Symposium and Medical Imaging Conference (2013 NSS/MIC), Seoul, Republic of Korea, 27 October–2 November 2013; pp. 1–5. [Google Scholar] [CrossRef]
  22. Mianowska, Z.; Moszynski, M.; Brylew, K.; Chabera, M.; Dziedzic, A.; Gektin, A.V.; Krakowski, T.; Mianowski, S.; Syntfeld-Każuch, A.; Szczesniak, T.; et al. The light response of CsI:Tl crystal after interaction with gamma radiation study using analysis of single scintillation pulses and digital oscilloscope readout. Nucl. Instrum. Methods Phys. Res. Sect. A Accel. Spectrometers Detect. Assoc. Equip. 2022, 1031, 166600. [Google Scholar] [CrossRef]
  23. Wang, W.; Qi, H.; Liu, F.; Meng, H.; Cai, J.; Xu, S.; Jing, S.; Hong, F.; Zhu, Y.; Xu, H.; et al. Approaching the Theoretical Light Yield Limit in CsI (Tl) Scintillator Single Crystals by a Low-Temperature Solution Method. Cryst. Growth Des. 2020, 20, 3474–3481. [Google Scholar] [CrossRef]
  24. Ouyang, X.; Liu, B.; Xiang, X.; Chen, L.; Xu, M.; Song, X.; Ruan, J.; Liu, J.; Chen, C.; Zhu, Z.; et al. Enhanced light output of CsI(Na) scintillators by photonic crystals. Nucl. Instrum. Methods Phys. Res. Sect. A Accel. Spectrometers Detect. Assoc. Equip. 2020, 969, 164007. [Google Scholar] [CrossRef]
  25. Sisodiya, D.S.; Singh, S.G.; Chandrakumar, K.R.S.; Patra, G.D.; Ghosh, M.; Pitale, S.; Sen, S. Optimizing the Scintillation Kinetics of CsI Scintillator Single Crystals by Divalent Cation Doping: Insights from Electronic Structure Analysis and Luminescence Studies. J. Phys. Chem. 2024, 128, 197–209. [Google Scholar] [CrossRef]
  26. Ding, K.; Chernyak, D.; Liu, J. Light yield of cold undoped CsI crystal down to 13 keV and the application of such crystals in neutrino detection. Eur. Phys. J. C 2020, 80, 1146. [Google Scholar] [CrossRef]
  27. Mikhailik, V.B.; Kapustyanyk, V.; Tsybulskyi, V.; Rudyk, V.; Kraus, H. Luminescence and scintillation properties of CsI: A potential cryogenic scintillator. Phys. Status Solidi (B) 2015, 252, 804–810. [Google Scholar] [CrossRef]
  28. Williams, R.T.; Grim, J.Q.; Li, Q.; Ucer, K.B.; Moses, W.W. Excitation density, diffusion-drift, and proportionality in scintillators. Phys. Status Solidi (B) 2011, 248, 426–438. [Google Scholar] [CrossRef]
  29. Hamada, M.M.; Costa, F.E.; Shimizu, S.; Kubota, S. Radiation damage of CsI(Tl) scintillators: Blocking of energy transfer process of Vk centers to Tl+ activators. Nucl. Instrum. Methods Phys. Res. Sect. A Accel. Spectrometers Detect. Assoc. Equip. 2002, 486, 330–335. [Google Scholar] [CrossRef]
  30. Suta, M.; Wickleder, C. Spin Crossover of Yb2+ in CsCaX2 and CsSrX2 (X = Cl, Br, I) – A Guideline to Novel Halide-Based Scintillators. Adv. Funct. Mater. 2017, 27, 1602783. [Google Scholar] [CrossRef]
  31. Suta, M.; Wickleder, C. Synthesis, spectroscopic properties and applications of divalent lanthanides apart from Eu2+. J. Lumin. 2019, 210, 210–238. [Google Scholar] [CrossRef]
  32. Mizoi, K.; Arai, M.; Fujimoto, Y.; Nakauchi, D.; Koshimizu, M.; Yanagida, T.; Asai, K. Photoluminescence and scintillation properties of Yb2+-doped ACaCl3 (A = Cs, Rb, K) crystals. J. Lumin. 2020, 227, 117521. [Google Scholar] [CrossRef]
  33. Sekine, D.; Fujimoto, Y.; Koshimizu, M.; Nakauchi, D.; Yanagida, T.; Asai, K. Photoluminescence and scintillation properties of Yb2+-doped SrCl2 crystals. Jpn. J. Appl. Phys. 2020, 59, 012005. [Google Scholar] [CrossRef]
  34. Alekhin, M.S.; Biner, D.A.; Krämer, K.W.; Dorenbos, P. Optical and scintillation properties of SrI2: Yb2+. Opt. Mater. 2014, 37, 382–386. [Google Scholar] [CrossRef]
  35. Mizoi, K.; Arai, M.; Fujimoto, Y.; Nakauchi, D.; Koshimizu, M.; Yanagida, T.; Asai, K. Evaluation of photoluminescence and scintillation properties of Yb2+-doped SrCl2- xBrx crystals. J. Ceram. Soc. Jpn. 2021, 129, 406–414. [Google Scholar] [CrossRef]
  36. Wolszczak, W.; Krämer, K.W.; Dorenbos, P. Engineering near-infrared emitting scintillators with efficient Eu2+ → Sm2+ energy transfer. J. Lumin. 2020, 222, 117101. [Google Scholar] [CrossRef]
  37. Shalaev, A.; Shendrik, R.; Rusakov, A.; Bogdanov, A.; Pankratov, V.; Chernenko, K.; Myasnikova, A. Luminescence of divalent lanthanide doped BaBrI single crystal under synchrotron radiation excitations. Nucl. Instrum. Methods Phys. Res. Sect. B Beam Interact. Mater. Atoms 2020, 467, 17–20. [Google Scholar] [CrossRef]
  38. Tsuboi, T.; Witzke, H.; McClure, D.S. The 4f14→4f135d transition of Yb2+ ion in NaCl crystals. J. Lumin. 1981, 24–25, 305–308. [Google Scholar] [CrossRef]
  39. Rubio, O. Doubly-valent rare-earth ions in halide crystals. J. Phys. Chem. Solids 1991, 52, 101–174. [Google Scholar] [CrossRef]
  40. Fujimoto, Y.; Okada, G.; Sekine, D.; Yanagida, T.; Koshimizu, M.; Kawamoto, H.; Asai, K. Radiation induced change in the optical properties of NaCl:Yb crystal. Radiat. Meas. 2020, 133, 106274. [Google Scholar] [CrossRef]
  41. Hendriks, M.; van der Kolk, E. 4f→5d and anomalous emission in Yb2+ doped NaI, SrI2 and LaI3 powders prepared by rapid melting and quenching in vacuum. J. Lumin. 2019, 207, 231–235. [Google Scholar] [CrossRef]
  42. Wu, Y.; Ren, G.; Nikl, M.; Chen, X.; Ding, D.; Li, H.; Pan, S.; Yang, F. CsI:Tl+,Yb2+: Ultra-high light yield scintillator with reduced afterglow. CrystEngComm 2014, 16, 3312–3317. [Google Scholar] [CrossRef]
  43. Bartram, R.H.; Kappers, L.A.; Hamilton, D.S.; Brecher, C.; Ovechkina, E.E.; Miller, S.R.; Nagarkar, V.V. Multiple thermoluminescence glow peaks and afterglow suppression in CsI:Tl co-doped with Eu2+ or Yb2+. IOP Conf. Ser. Mater. Sci. Eng. 2015, 80, 012003. [Google Scholar] [CrossRef]
  44. Ikeya, M.; Itoh, N.; Suita, T. Distribution coefficients of various impurities in alkali halides. Jpn. J. Appl. Phys. 1968, 7, 837. [Google Scholar] [CrossRef]
  45. Shendrik, R.; Myasnikova, A.; Radzhabov, E.; Nepomnyashchikh, A. Spectroscopy of divalent rare earth ions in fluoride crystals. J. Lumin. 2016, 169, 635–640. [Google Scholar] [CrossRef]
  46. Pankratova, V.; Kozlova, A.P.; Buzanov, O.A.; Chernenko, K.; Shendrik, R.; Šarakovskis, A.; Pankratov, V. Time-resolved luminescence and excitation spectroscopy of co-doped Gd3Ga3Al2O12 scintillating crystals. Sci. Rep. 2020, 10, 20388. [Google Scholar] [CrossRef] [PubMed]
  47. Kozlova, A.P.; Kasimova, V.M.; Buzanov, O.A.; Chernenko, K.; Klementiev, K.; Pankratov, V. Luminescence and vacuum ultraviolet excitation spectroscopy of cerium doped Gd3Ga3Al2O12 single crystalline scintillators under synchrotron radiation excitations. Results Phys. 2020, 16, 103002. [Google Scholar] [CrossRef]
  48. Chernenko, K.; Kivimäki, A.; Pärna, R.; Wang, W.; Sankari, R.; Leandersson, M.; Tarawneh, H.; Pankratov, V.; Kook, M.; Kukk, E.; et al. Performance and characterization of the FinEstBeAMS beamline at the MAX IV Laboratory. J. Synchrotron Radiat. 2021, 28, 1620–1630. [Google Scholar] [CrossRef] [PubMed]
  49. Pärna, R.; Sankari, R.; Kukk, E.; Nõmmiste, E.; Valden, M.; Lastusaari, M.; Kooser, K.; Kokko, K.; Hirsimäki, M.; Urpelainen, S.; et al. FinEstBeaMS—A wide-range Finnish-Estonian Beamline for Materials Science at the 1.5 GeV storage ring at the MAX IV Laboratory. Nucl. Instrum. Methods Phys. Res. Sect. A Accel. Spectrometers Detect. Assoc. Equip. 2017, 859, 83–89. [Google Scholar] [CrossRef]
  50. Pankratov, V.; Kotlov, A. Luminescence spectroscopy under synchrotron radiation: From SUPERLUMI to FINESTLUMI. Nucl. Instrum. Methods Phys. Res. Sect. B Beam Interact. Mater. Atoms 2020, 474, 35–40. [Google Scholar] [CrossRef]
  51. Pankratov, V.; Pärna, R.; Kirm, M.; Nagirnyi, V.; Nõmmiste, E.; Omelkov, S.; Vielhauer, S.; Chernenko, K.; Reisberg, L.; Turunen, P.; et al. Progress in development of a new luminescence setup at the FinEstBeAMS beamline of the MAX IV laboratory. Radiat. Meas. 2019, 121, 91–98. [Google Scholar] [CrossRef]
  52. Radzhabov, E.; Shendrik, R.; Pankratov, V.; Chernenko, K. Fine structure of 4f–5d absorption spectra of MeF -Yb in the vacuum ultraviolet region under synchrotron excitation. Opt. Mater. 2023, 135, 113235. [Google Scholar] [CrossRef]
  53. Kresse, G.; Hafner, J. Ab initiomolecular dynamics for liquid metals. Phys. Rev. B 1993, 47, 558–561. [Google Scholar] [CrossRef] [PubMed]
  54. HPC-Cluster “Akademik, V.M.Matrosov”, Irkutsk Supercomputer Center of SB RAS. Available online: https://hpc.icc.ru/ (accessed on 30 April 2024).
  55. Inorganic Crystal Structure Database, ICSD Release 2024.1. Available online: https://icsd.products.fiz-karlsruhe.de/ (accessed on 25 April 2024).
  56. Neese, F. The ORCA program system. WIREs Comput. Mol. Sci. 2011, 2, 73–78. [Google Scholar] [CrossRef]
  57. Pritchard, B.P.; Altarawy, D.; Didier, B.; Gibson, T.D.; Windus, T.L. New Basis Set Exchange: An Open, Up-to-Date Resource for the Molecular Sciences Community. J. Chem. Inf. Model. 2019, 59, 4814–4820. [Google Scholar] [CrossRef] [PubMed]
  58. Suta, M.; Urland, W.; Daul, C.; Wickleder, C. Photoluminescence properties of Yb2+ ions doped in the perovskites CsCaX3 and CsSrX3 (X = Cl, Br, and I)—A comparative study. Phys. Chem. Chem. Phys. 2016, 18, 13196–13208. [Google Scholar] [CrossRef] [PubMed]
  59. Tsuboi, T.; McClure, D.S.; Wong, W.C. Luminescence kinetics of Yb2+ in NaCl. Phys. Rev. B 1993, 48, 62–67. [Google Scholar] [CrossRef] [PubMed]
  60. Bland, S.W.; Smith, M.J.A. 4f14 to 4f135d optical transitions of divalent ytterbium in the potassium and sodium halides. J. Phys. C Solid State Phys. 1985, 18, 1525. [Google Scholar] [CrossRef]
  61. Bryant, B.W. Spectra of Doubly and Triply Ionized Ytterbium, Yb III and Yb IV. JOSA 1965, 55, 771–779. [Google Scholar] [CrossRef]
  62. Duan, C.K.; Tanner, P.A. Simulation of 4f–5d transitions of Yb2+ in potassium and sodium halides. J. Phys. Condens. Matter 2008, 20, 215228. [Google Scholar] [CrossRef]
  63. Randall, J.T.; Wilkins, M.H.F.; Oliphant, M.L.E. Phosphorescence and electron traps—I. The study of trap distributions. Proc. R. Soc. Lond Ser. A. Math. Phys. Sci. 1997, 184, 365–389. [Google Scholar] [CrossRef]
  64. Capelletti, R. Thermally Stimulated Depolarization Studies of Ionic Solids. In Defects in Solids: Modern Techniques; Chadwick, A.V., Terenzi, M., Eds.; Springer: Boston, MA, USA, 1986; pp. 407–431. [Google Scholar] [CrossRef]
  65. Poźniak, J.; Poźniak, J.K. Thermally Stimulated Depolarization Currents in Me2+-Doped NaCl-Type Alkali Halide Crystals. Phys. Status Solidi (B) 1997, 200, 535–544. [Google Scholar] [CrossRef]
  66. Matsumoto, T.; Shirai, M.; Kan’no, K.-i. Time-Resolved Spectroscopic Study on the Type I Self-Trapped Excitons in Alkali Halide Crystals: II. Excitation Spectra and Relaxation Processes. J. Phys. Soc. Jpn. 1995, 64, 987–1001. [Google Scholar] [CrossRef]
  67. Onodera, Y. Energy Bands in CsI. J. Phys. Soc. Jpn. 1968, 25, 469–480. [Google Scholar] [CrossRef]
  68. Lu, X.; Li, Q.; Bizarri, G.A.; Yang, K.; Mayhugh, M.R.; Menge, P.R.; Williams, R.T. Coupled rate and transport equations modeling proportionality of light yield in high-energy electron tracks: CsI at 295 K and 100 K; CsI:Tl at 295 K. Phys. Rev. B 2015, 92, 115207. [Google Scholar] [CrossRef]
  69. Williams, R.T.; Ucer, K.B.; Grim, J.Q.; Lipke, K.C.; Trefilova, L.M.; Moses, W.W. Picosecond Studies of Transient Absorption Induced by BandGap Excitation of CsI and CsI:Tl at Room Temperature. IEEE Trans. Nucl. Sci. 2010, 57, 1187–1192. [Google Scholar] [CrossRef]
  70. Shendrik, R.Y.; Kovalev, I.I.; Rusakov, A.I.; Sokol’nikova, Y.V.; Shalaev, A.A. Luminescence of BaBrI Crystals Doped with Ce3+ Ions. Phys. Solid State 2019, 61, 830–834. [Google Scholar] [CrossRef]
  71. Li, P.; Gridin, S.; Ucer, K.B.; Williams, R.T.; Del Ben, M.; Canning, A.; Moretti, F.; Bourret, E. Picosecond Absorption Spectroscopy of Excited States in BaBrCl with and without Eu Dopant and Au Codopant. Phys. Rev. Appl. 2019, 12, 014035. [Google Scholar] [CrossRef]
Figure 1. Three-dimensional model and schematic view of the equipment for crystal growth.
Crystals 14 00500 g001
Figure 2. Luminescence of a CsI:Yb2+ crystal (right) compared to a pure CsI crystal (left) under 395 nm excitation.
Crystals 14 00500 g002
Figure 3. Luminescence spectra of the CsI-Yb2+ sample: (1) under 4.55 eV excitation at 10 K, (2) under 3.4 eV excitation at 290 K, (3) time-resolved luminescence in a long time window at 290 K under 3.40 eV excitation, (4) time-resolved luminescence in a short time window at 290 K under 3.40 eV excitation, and (5) self-trapped exciton (STE) luminescence at 10 K under 5.90 eV excitation.
Crystals 14 00500 g003
Figure 4. Luminescence decay curves under 3.40 eV excitation. The red solid curve is the fitting curve. In the inset of the figure is the short time luminescence under 3.67 eV excitation. τ 1 = 69 ns, τ 2 = 280 μ s, and τ 3 = 500 μ s.
Crystals 14 00500 g004
Figure 5. The absorption spectrum (dashed curve 1) and excitation spectra of CsI-Yb2+ monitored at 2.60 eV (black curve) and at 3.60 eV (blue curve) (a). The subfigure (b) presents an enlarged region of band-to-band transitions. The horizontal arrows point to the corresponding ordinate axis, the vertical arrows point to dips on the spectra.
Crystals 14 00500 g005
Figure 6. The absorption spectrum (solid curve) and calculated positions of 4f14–4f135d1 transitions in the Yb2+ ion with a cation vacancy in the nearest-neighbor (red lines) and the next-nearest-neighbor (black lines) positions.
Crystals 14 00500 g006
Figure 7. Excitation spectra monitored at 2.60 eV (black curve) and at 3.60 eV (red curve) in the energy region of 7–45 eV.
Crystals 14 00500 g007
Figure 8. Thermally stimulated depolarization current curve of CsI-Yb2+. Dots are the experimental values, solid curves were the calculated using Equation (1) with given on the figure parameters.
Crystals 14 00500 g008
Disclaimer/Publisher’s Note: The statements, opinions and data contained in all publications are solely those of the individual author(s) and contributor(s) and not of MDPI and/or the editor(s). MDPI and/or the editor(s) disclaim responsibility for any injury to people or property resulting from any ideas, methods, instructions or products referred to in the content.

