
Solid Forms and β-Cyclodextrin Complexation of Oxymetholone and Crystal Structure of Metribolone


Abstract
1. Introduction
2. Materials and Methods
2.1. Crystallization Experiments
- (i)
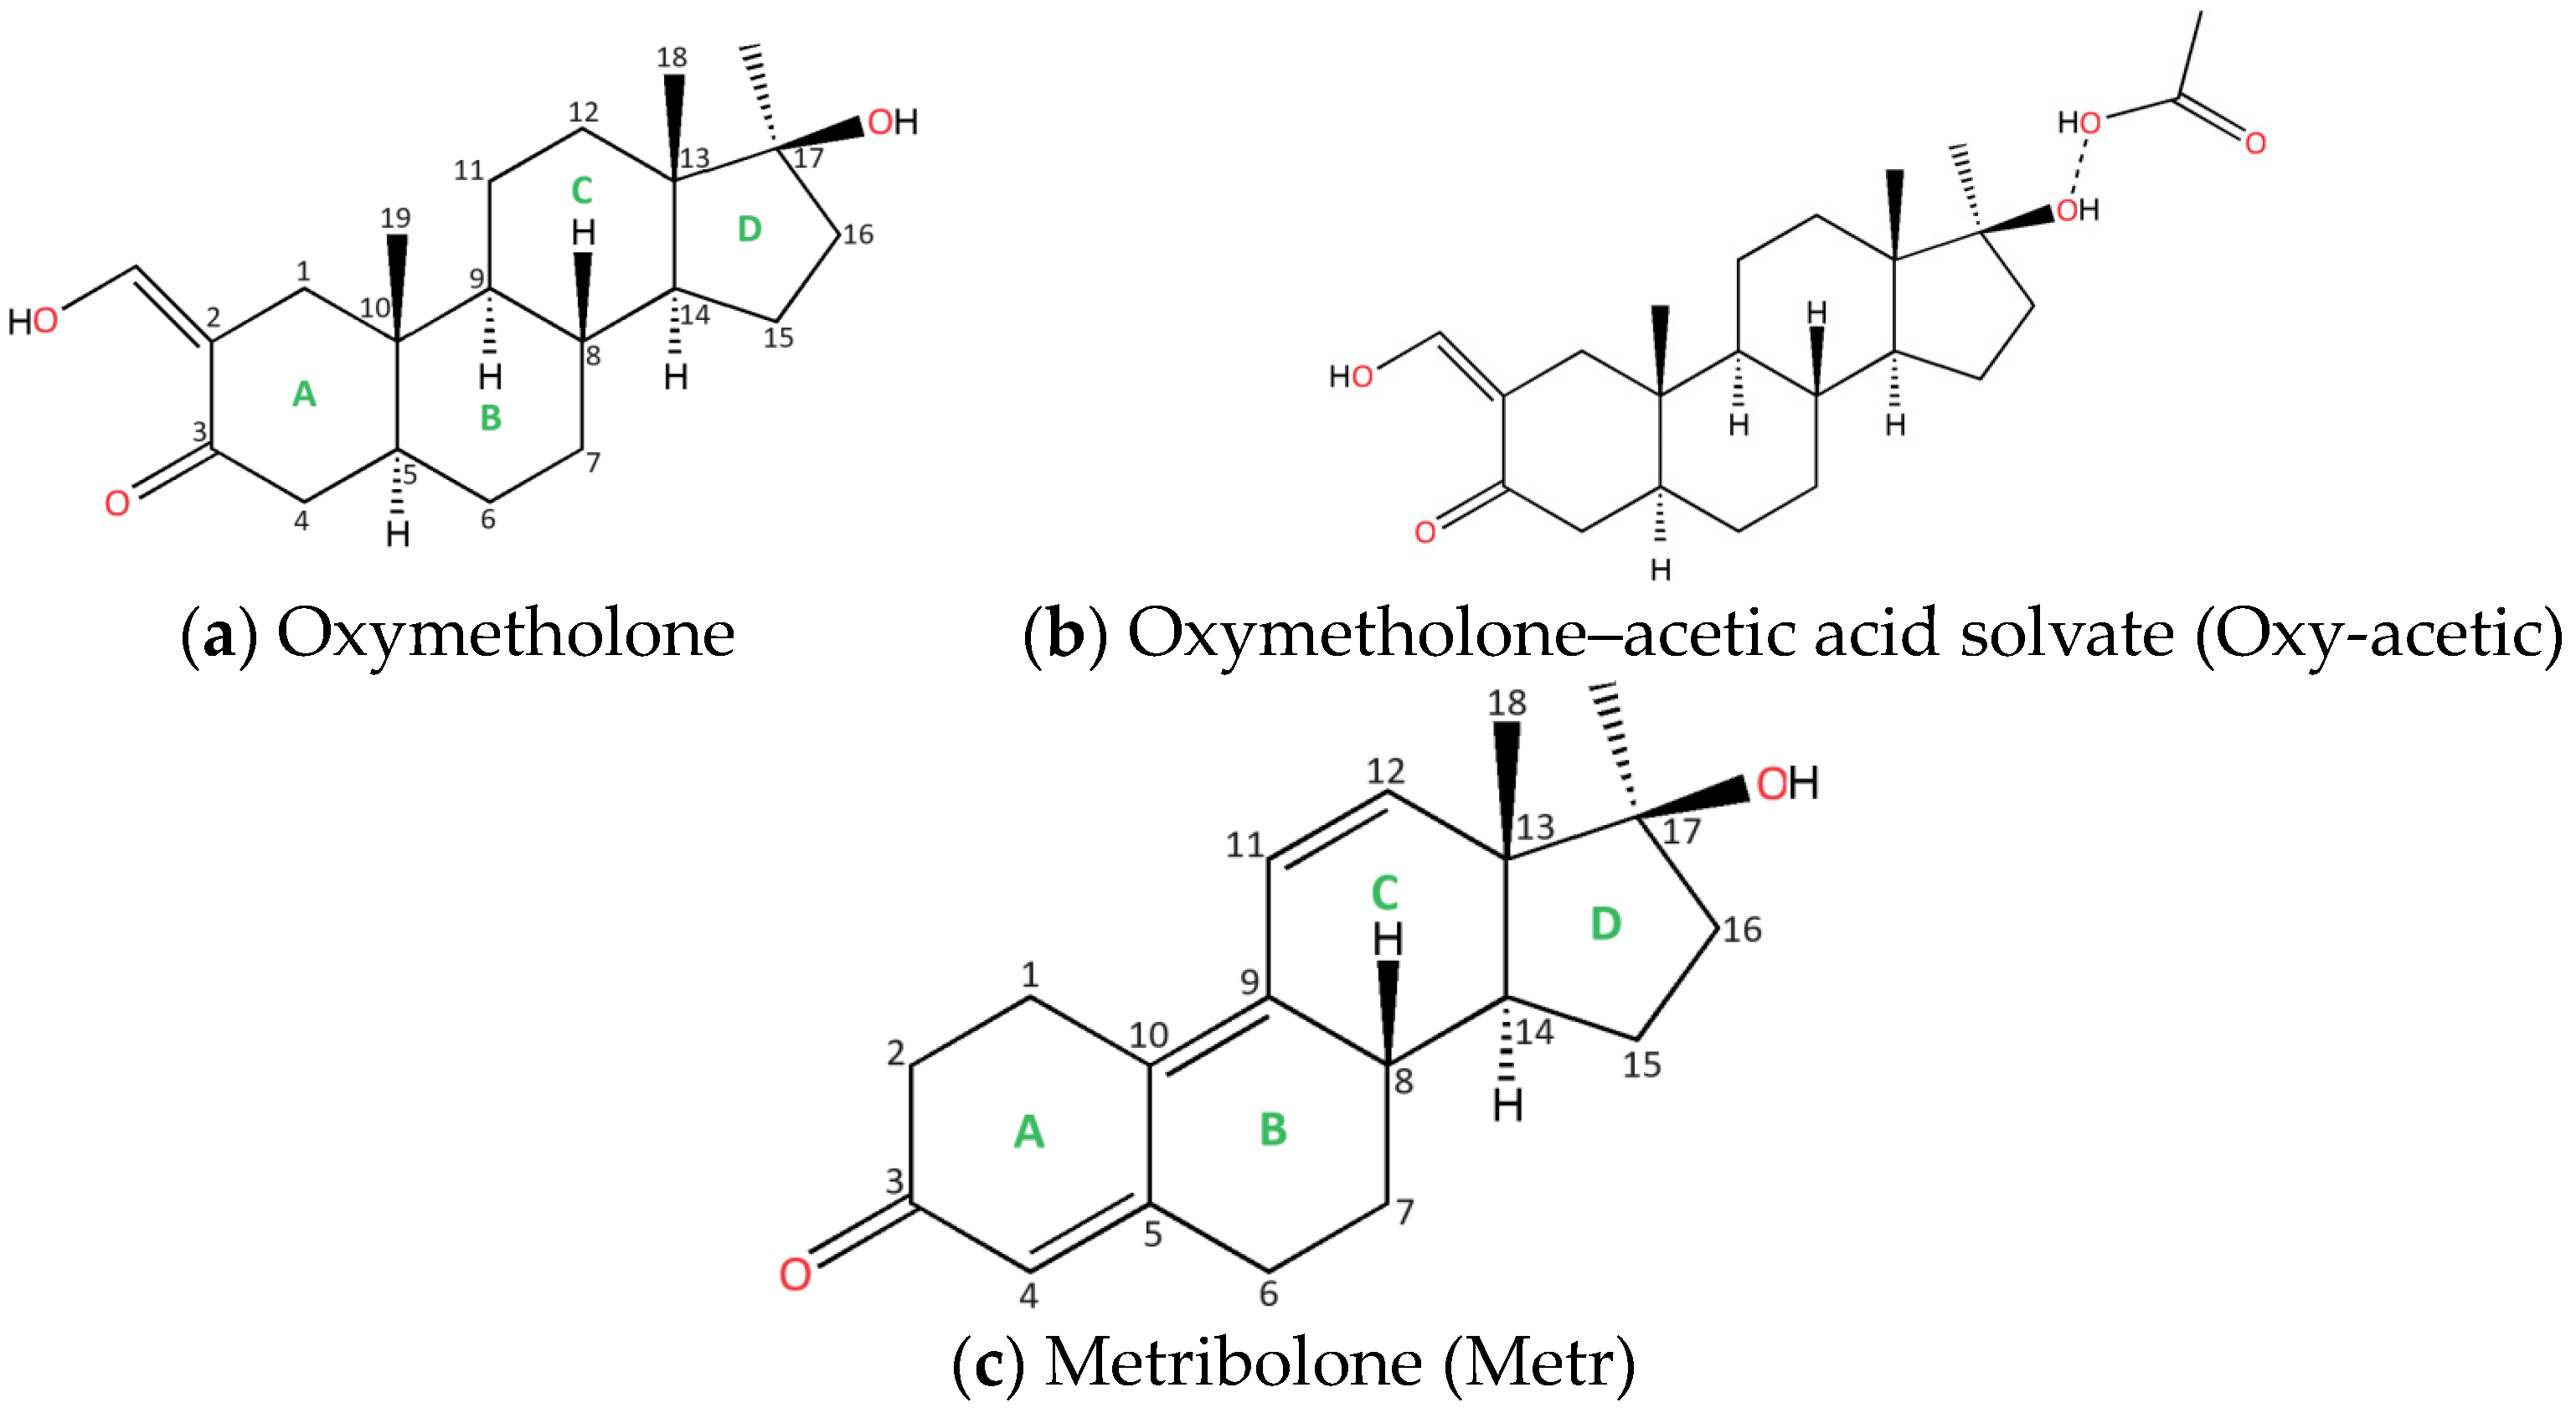
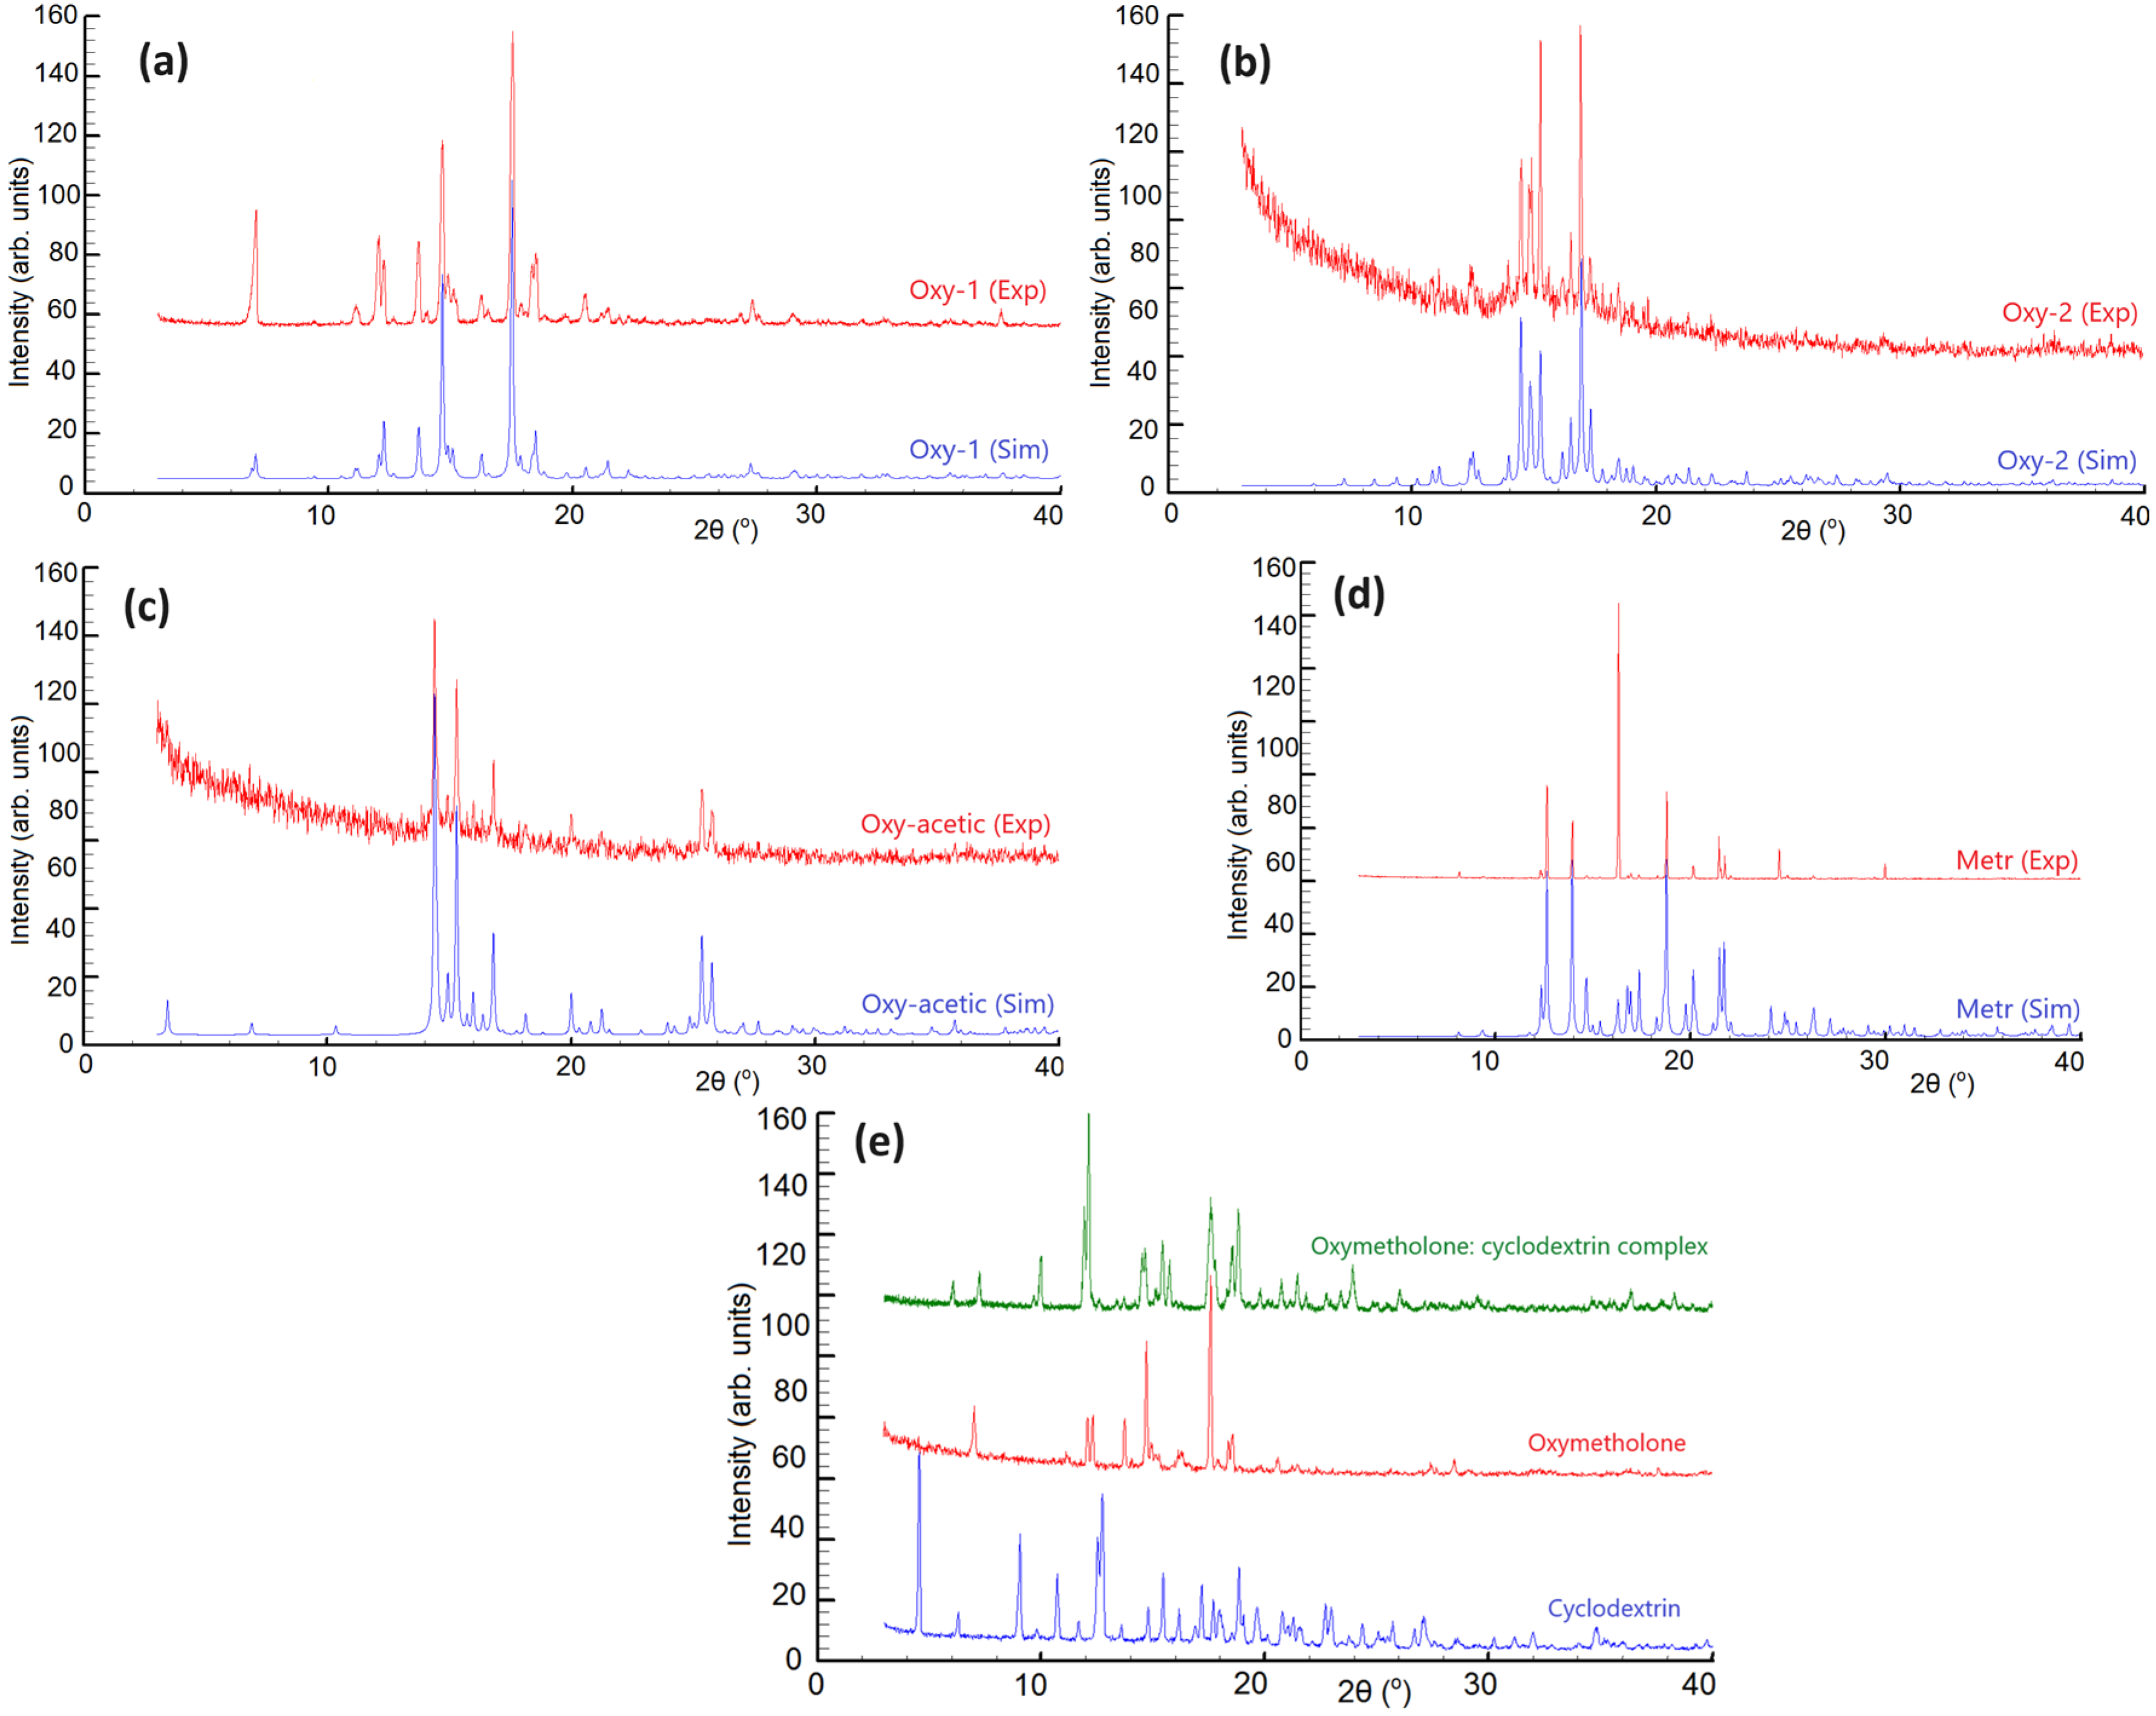
- Oxymetholone, the first polymorph, starting compound (denoted Oxy-1) was crystallized from acetone solution (Figure 1a);
- (ii)
- Oxymetholone, second polymorph (denoted Oxy-2) was crystallized from dichloromethane solution (Figure 1a);
- (iii)
- Oxymetholone-acid acetic solvate (denoted Oxy-acetic) was crystallized in a mixture of acetic acid-water in 1:1 volumetric proportions (Figure 1b);
- (iv)
- Metribolone, found as a start form (denoted Metr) was crystallized from a solution of ethanol (Figure 1c).
2.2. Preparation of β-Cyclodextrin Inclusion Complex of Oxymetholone
2.3. Powder X-ray Diffraction
2.4. Single-Crystal X-ray Diffraction and Refinement
2.5. Computational Chemistry
2.6. Differential Scanning Calorimetry (DSC), Differential Thermal Analysis (DTA) and Thermogravimetric Analysis (TGA)
2.7. Fourier-Transform Infrared Spectroscopy
2.8. Solubility Check
3. Results
3.1. Crystal Structures Descriptions
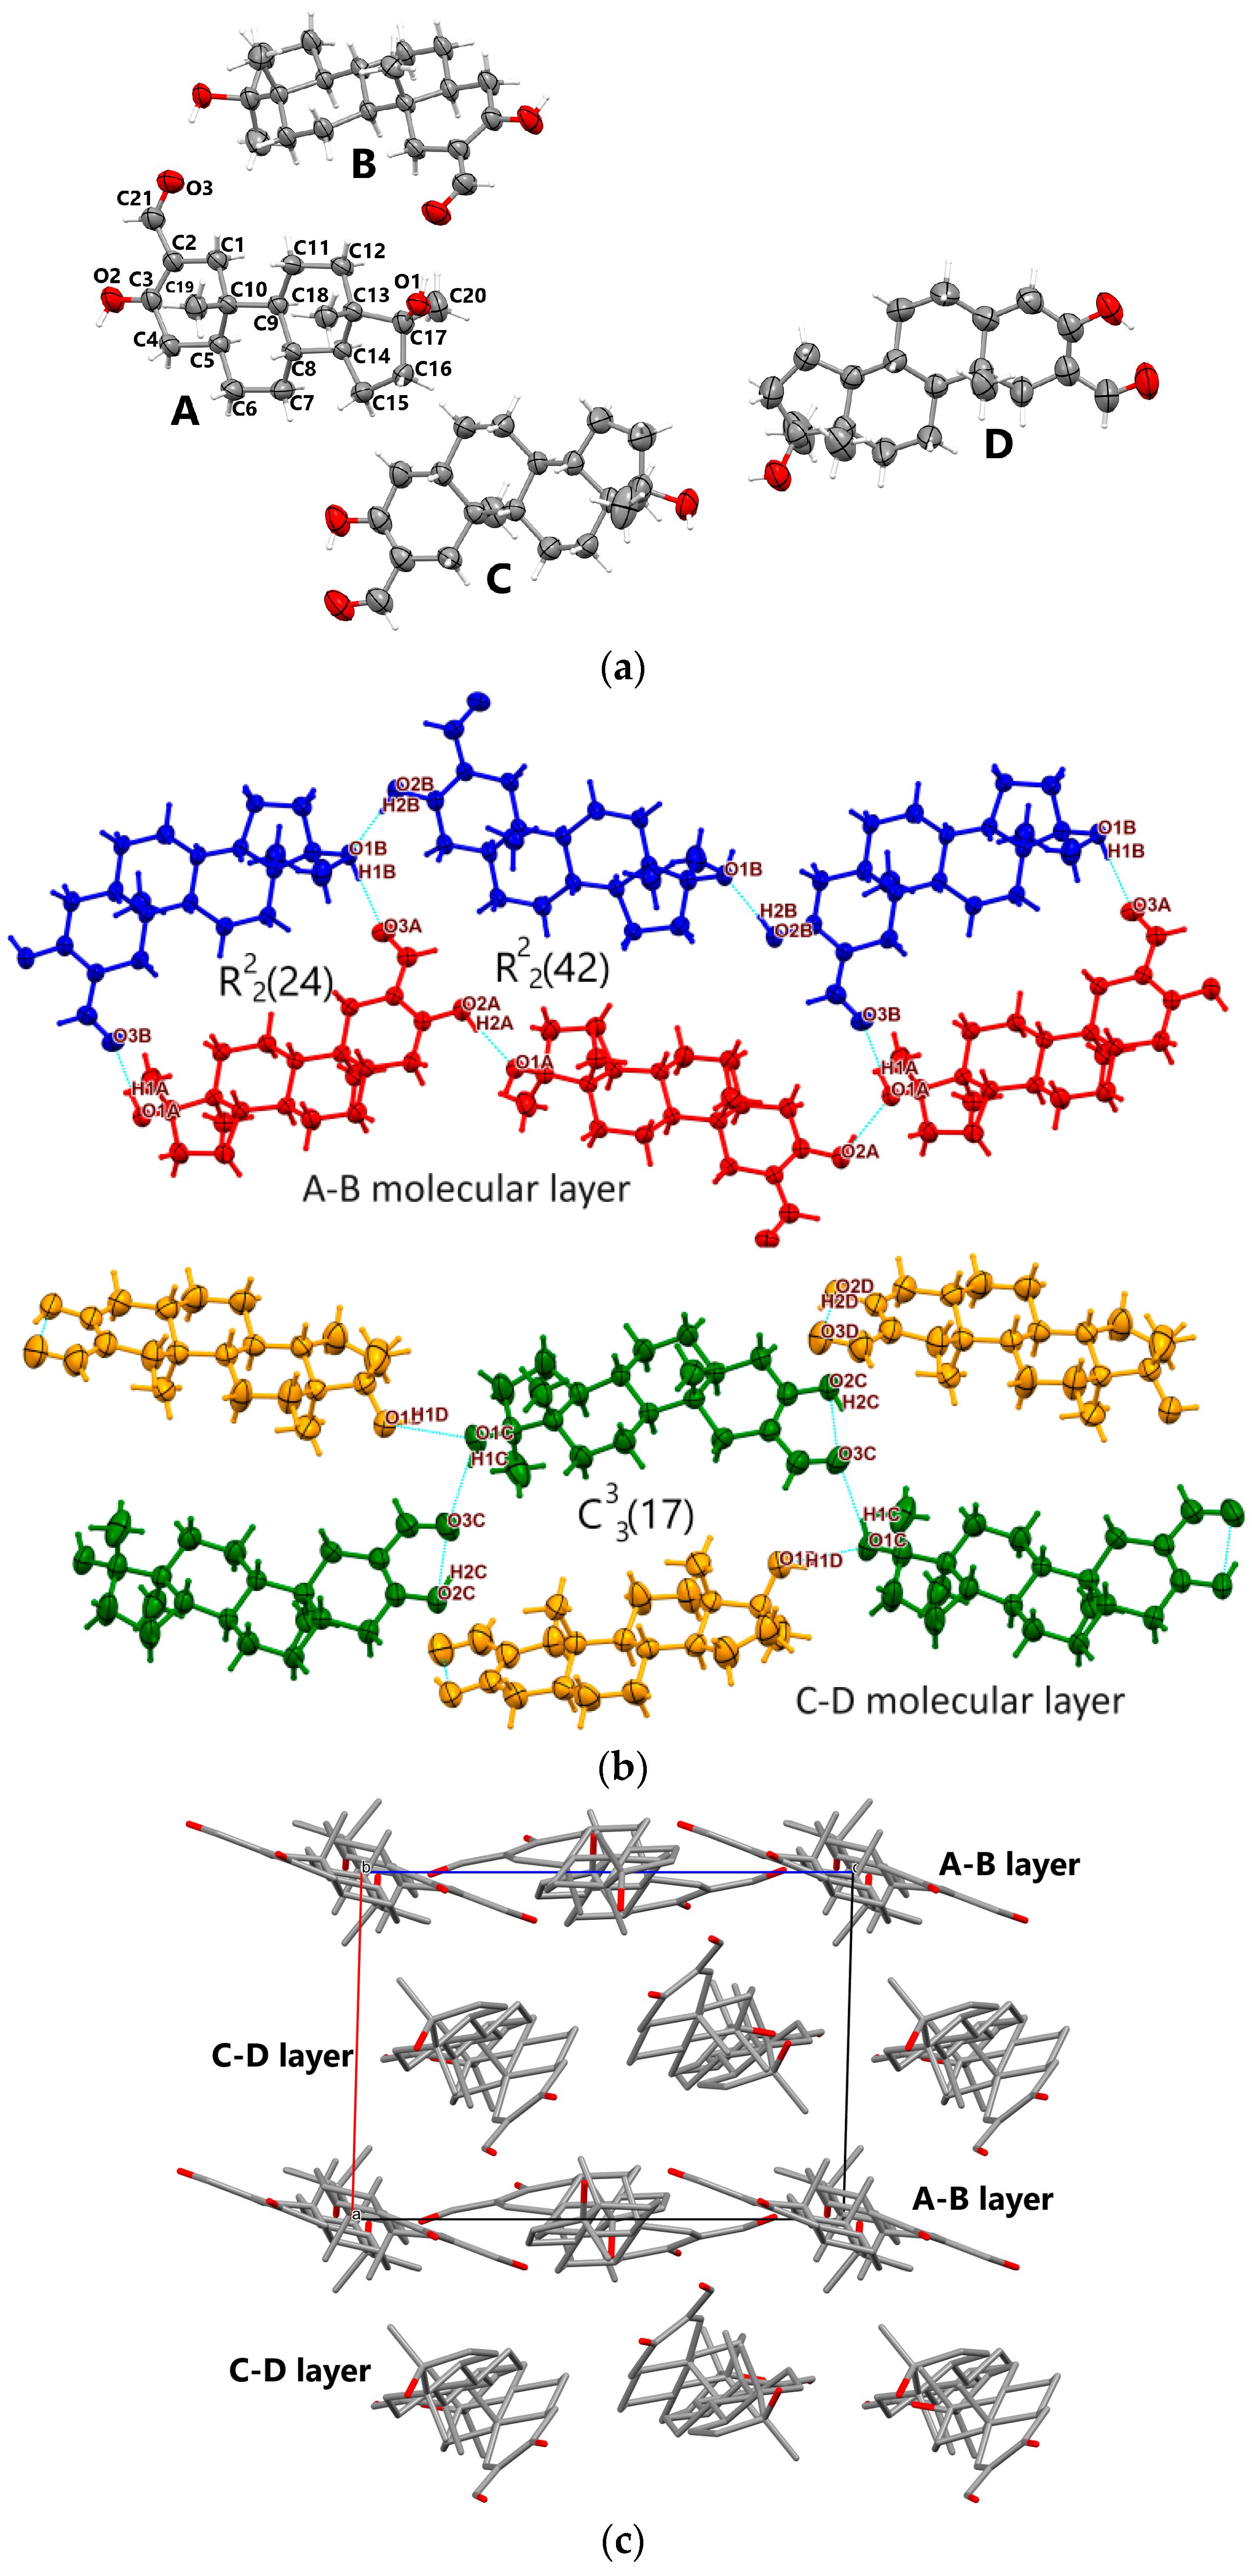
3.1.1. Oxy-1
3.1.2. Oxy-2
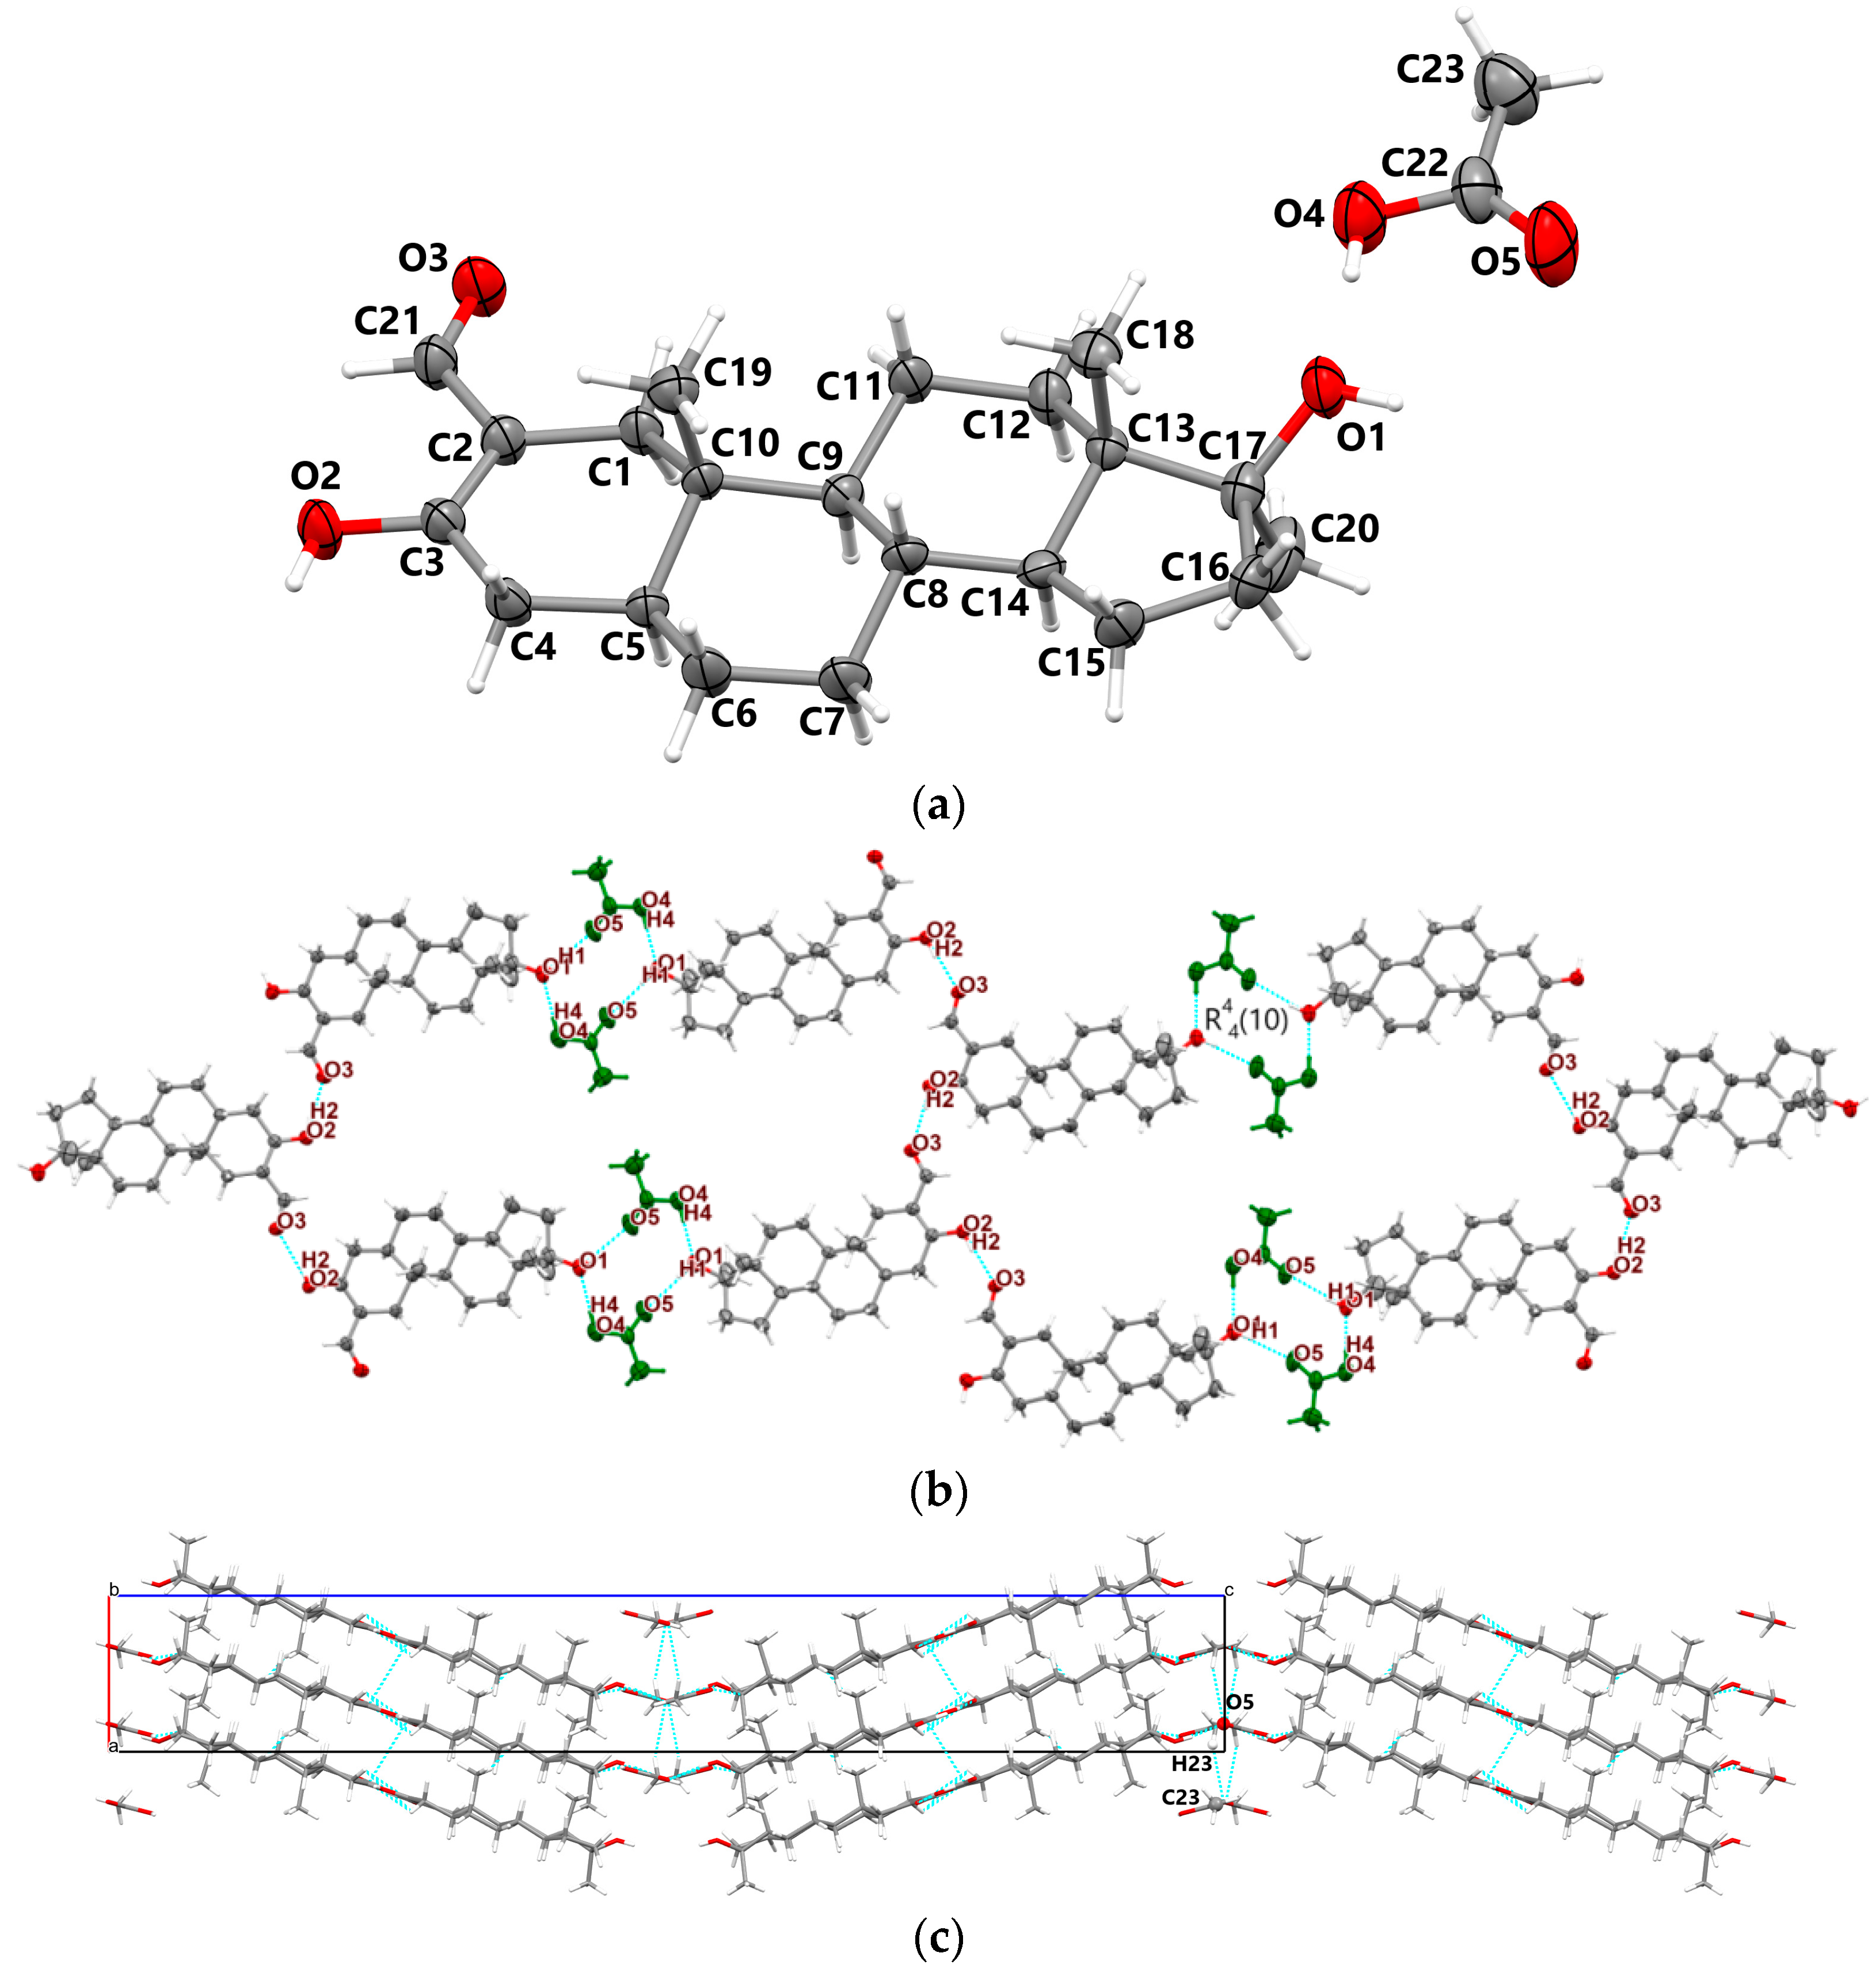
3.1.3. Oxy-Acetic
3.1.4. Metr
- (i)
- All solid forms crystallized in non-centrosymmetric space groups (monoclinic P21 for Oxy-1, Oxy-2, Metr and orthorhombic C2221 space group for Oxy-acetic);
- (ii)
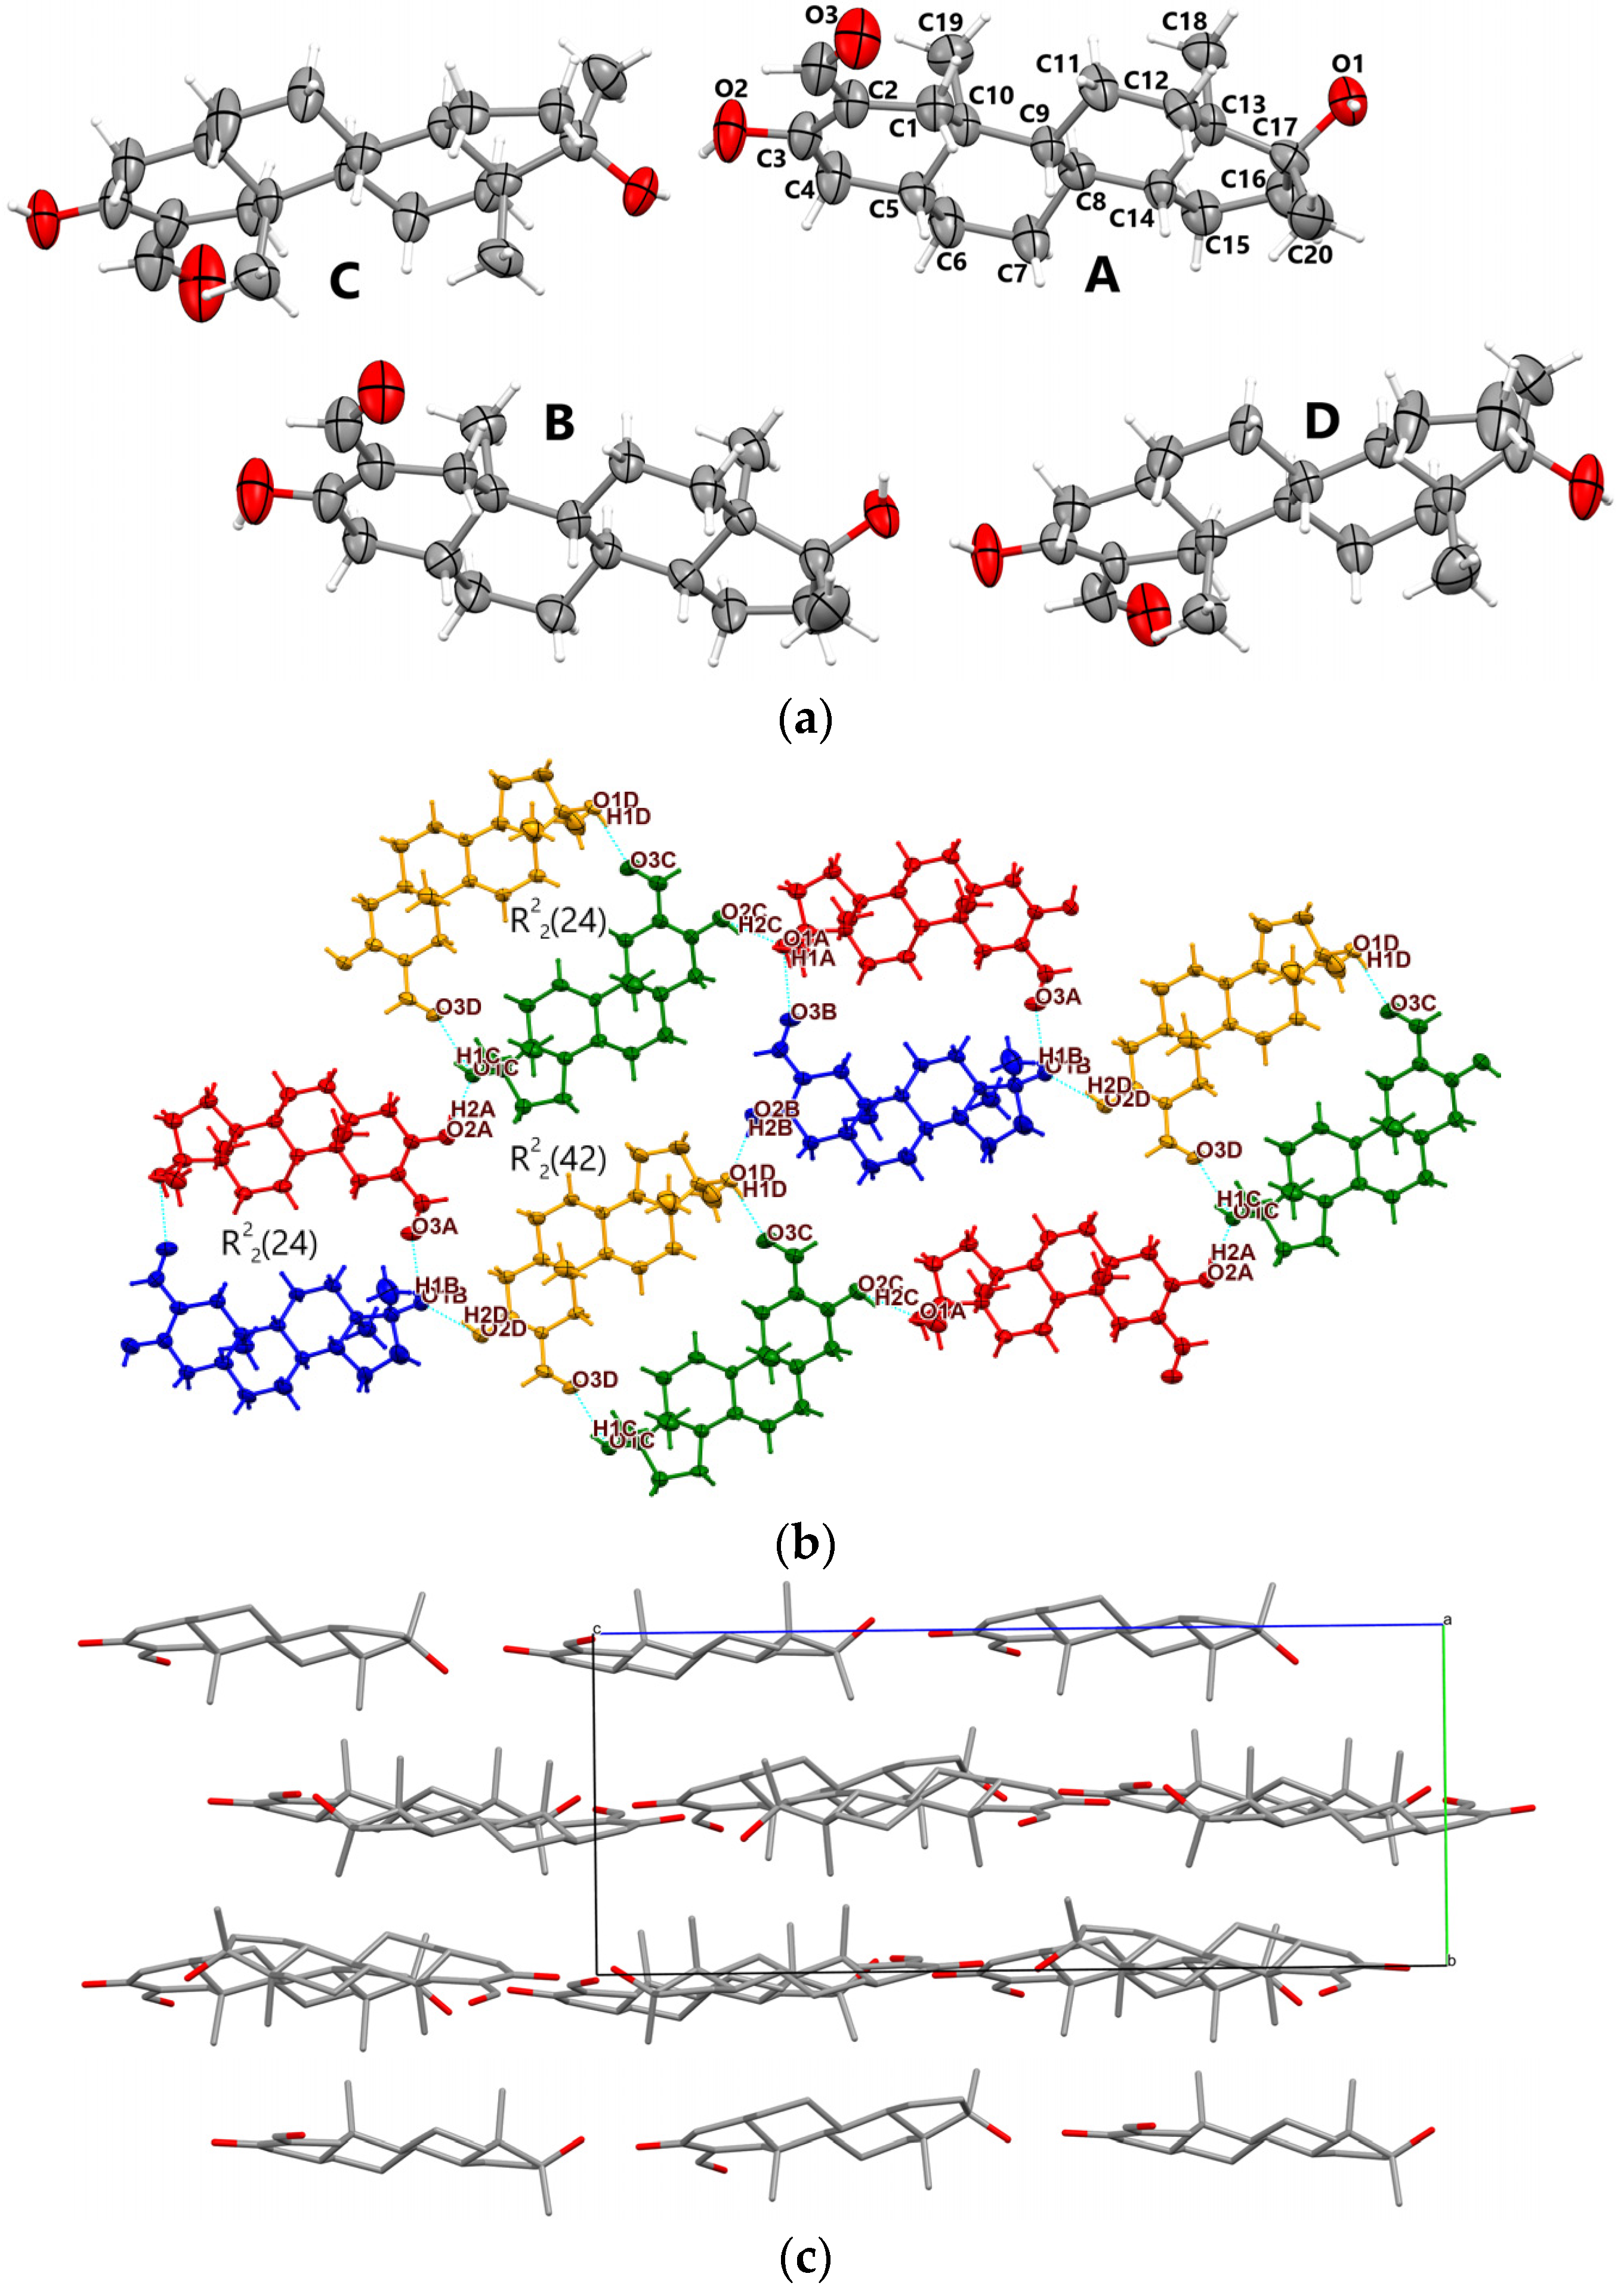
- Oxymetholone polymorphs (Oxy-1 and Oxy-2) are characterized by rather unusual asymmetric units which consist of four individual molecules; Metr is characterized by two molecules in the asymmetric unit;
- (iii)
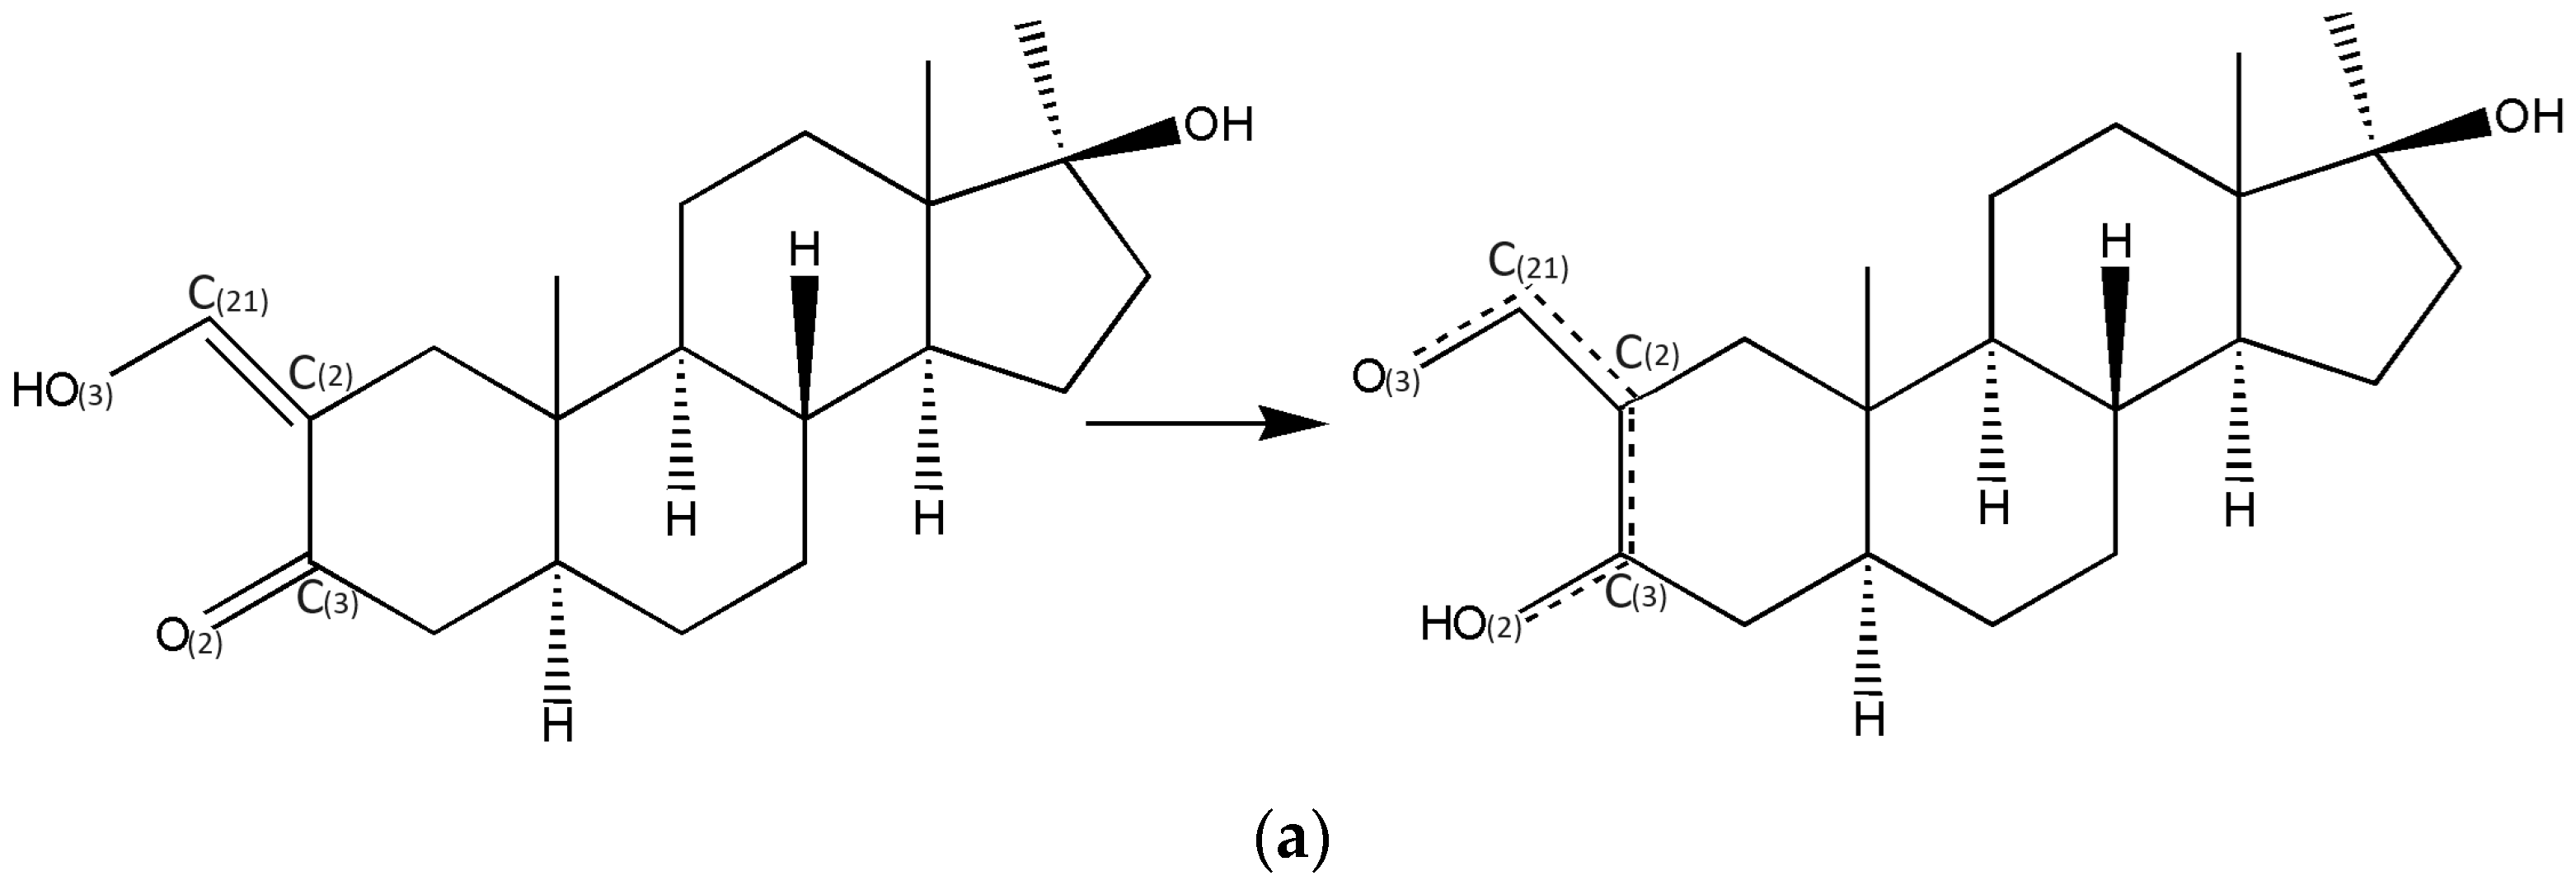
- In all three oxymetholone-based crystals, the C3=O2 distances related to the carbonyl group, the C2-C3 bond within six-membered A rings, the double C2=C21 bond, and the C21-O3 simple bond in the oxy group are involved in resonance, since these bonds have intermediate distance values between single and double bonds (see Figure 2)
- (iv)
- (v)
- Although in oxymetholone crystals the six-membered A rings are characterized by simple C-C bonds and are expected to depict chair configurations, due to the resonance bonding, they are found as half-chair; the six-membered B and C rings are chair and the five-membered D rings depict envelope geometry; other C17 alkylated testosterone analogues possess similar geometries as well [32,33,34,35].
- (vi)
- (vii)
- Cohesion of supramolecular architectures is driven mainly by electrostatic and dispersion energies (see Table S1, Supporting Information).
3.2. X-ray Powder Diffraction Analysis
3.3. Intermolecular Interaction Energies Evaluation
- (i)
- Due to the presence of O-H⋯O bonding, the electrostatic energy is the dominant component which is the main factor in cohesion in all crystal structures;
- (ii)
- The dispersion component plays an important role in cohesion and is present in the intermolecular interactions which exhibit C-H⋯H-C contacts but lack O-H⋯O bonding;
- (iii)
- In oxymetholone-based crystals, due to the resonance, the protonated carbonyl O2 participates in head-to-tail steroid⋯steroid interactions with the C17 bounded O1 hydroxyl group, which led to high absolute values of electrostatic terms, zero magnitudes of the repulsion term and an overall lower magnitude of Etot (more stable lattice configuration) with values up to −114.8 kJ/mol in Oxy-1;
- (iv)
- In Metr, the interaction energies involving O-H⋯O hydrogen bonds are lower in absolute value;
- (v)
- Out of the attraction terms, the polarization term is the least significant and indicates that molecules are not polarized.
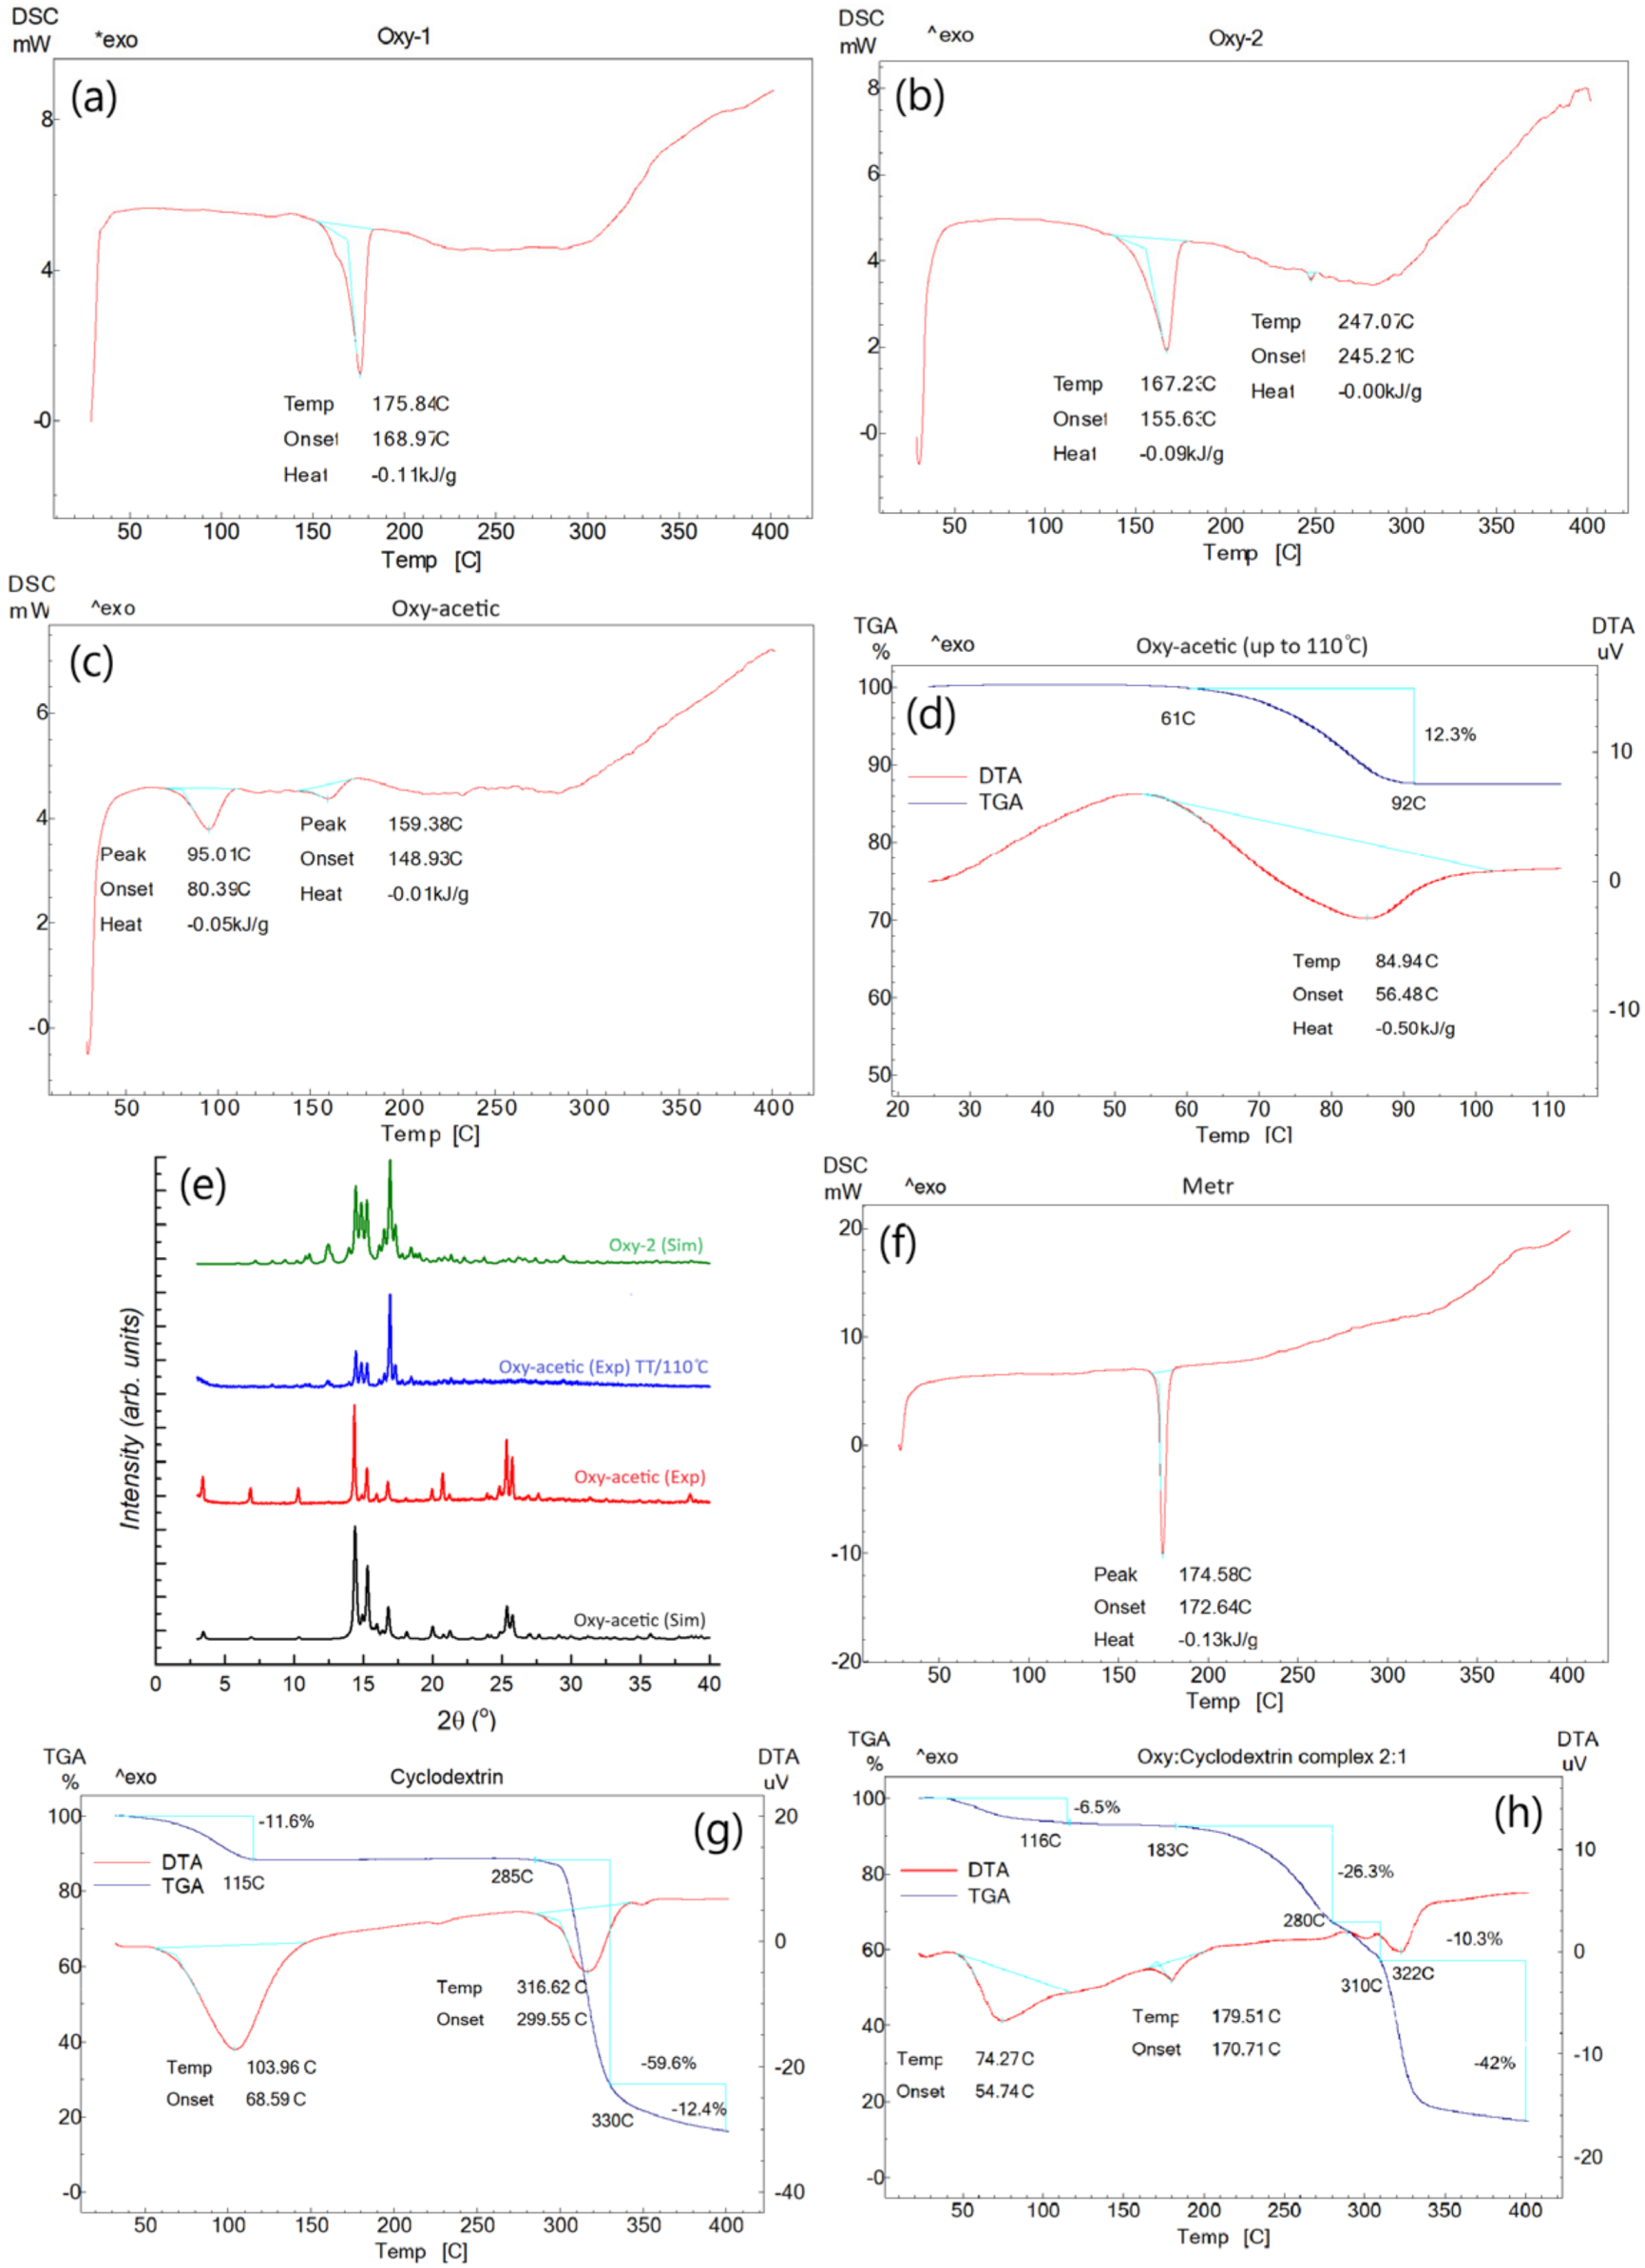
3.4. DSC/DTA/TGA Analysis
3.5. FT-IR Spectroscopy
3.6. Solubility Assessment
4. Conclusions
Supplementary Materials
Author Contributions
Funding
Data Availability Statement
Conflicts of Interest
References
- Lednicer, D. Steroid Chemistry at a Glance, 1st ed.; Wiley: Chichester, UK, 2010. [Google Scholar]
- Mooradian, A.D.; Morley, J.E.; Korenman, S.G. Biological actions of androgens. Endocr. Rev. 1987, 8, 1–28. [Google Scholar] [CrossRef] [PubMed]
- Shahidi, N.T. A review of the chemistry, biological action, and clinical applications of anabolic-androgenic steroids. Clin. Ther. 2001, 23, 1355–1390. [Google Scholar] [CrossRef] [PubMed]
- Kicman, A.T. Pharmacology of anabolic steroids. Br. J. Pharmacol. 2008, 154, 502–521. [Google Scholar] [CrossRef] [PubMed]
- Grunfeld, C.; Kotler, D.P.; Dobs, A.; Glesby, M.; Bhasin, S. Oxandrolone in the treatment of HIV-associated weight loss in men: A randomized, double-blind, placebo-controlled study. J. Acquir. Immune Defic. Syndr. 2006, 41, 304–314. [Google Scholar] [CrossRef] [PubMed]
- Woerdeman, J.; Ronde, W. Therapeutic effects of anabolic androgenic steroids on chronic diseases associated with muscle wasting. Expert Opin. Investig. Drugs 2011, 20, 87–97. [Google Scholar] [CrossRef] [PubMed]
- Adachi, M.; Takayanagi, R. Effect of anabolic steroids on osteoporosis. Clin. Calcium 2008, 18, 1451–1459. [Google Scholar]
- Baum, N.H.; Crespi, C.A. Testosterone replacement in elderly men. Geriatrics 2007, 62, 15–18. [Google Scholar] [PubMed]
- Francis, R.M. Androgen Replacement in Aging Men. Calcif. Tissue Int. 2001, 69, 235–238. [Google Scholar] [CrossRef] [PubMed]
- Solimini, R.; Rotolo, M.C.; Mastrobattista, L.; Mortali, C.; Minutillo, A.; Pichini, S.; Pacifici, R.; Palmi, I. Hepatotoxicity associated with illicit use of anabolic androgenic steroids in doping. Eur. Rev. Med. Pharmacol. Sci. 2017, 21, 7–16. [Google Scholar]
- Elks, J.; Ganellin, C.R. The Dictionary of Drugs: Chemical Data: Chemical Data, Structures and Bibliographies, 1st ed.; Springer: New York, NY, USA, 2013; p. 924. [Google Scholar]
- Index Nominum 2000: International Drug Directory; Amer Pharmacists Assn: Washington, DC, USA, 2000; p. 779.
- Llewellyn, W. Anabolics, 11th ed.; Molecular Nutrition LLC: Jupiter, FL, USA, 2011; pp. 323–334. [Google Scholar]
- Brueggemeier, R.W. Sex Hormones (Male): Analogs and Antagonists. Rev. Cell Biol. Mol. Med. 2006, 1, 1–70. [Google Scholar] [CrossRef]
- Brinkmann, A.O.; Kuiper, G.G.; de Boer, W.; Mulder, E.; Bolt, J.; van Steenbrugge, G.J.; van der Molen, H.J. Characterization of androgen receptors after photoaffinity labelling with [3H] methyltrienolone (R1881). J. Steroid Biochem. 1986, 24, 245–249. [Google Scholar] [CrossRef]
- Buschmann, H.J.; Schollmeyer, E. Applications of cyclodextrins in cosmetic products: A review. J. Cosmet. Sci. 2002, 53, 185–191. [Google Scholar] [PubMed]
- Loftsson, T.; Duchene, D. Cyclodextrins and their pharmaceutical applications. Int. J. Pharm. 2007, 329, 1–11. [Google Scholar] [CrossRef]
- Wenz, G. An Overview of Host-Guest Chemistry and its Application to Nonsteroidal Anti-Inflammatory Drugs. Clin. Drug Investig. 2012, 19, 21–25. [Google Scholar] [CrossRef]
- Khomutov, S.M.; Sidorov, I.A.; Dovbnya, D.V.; Donova, M.V. Estimation of cyclodextrin affinity to steroids. J. Pharm. Pharmacol. 2002, 54, 617–622. [Google Scholar] [CrossRef]
- Rigaku. CrysAlis PRO; Rigaku Oxford Diffraction: Oxfordshire, UK, 2018. [Google Scholar]
- Dolomanov, O.V.; Bourhis, L.J.; Gildea, R.J.; Howard, J.A.; Puschmann, H.K. OLEX2: A complete structure solution refinement and analysis. J. Appl. Cryst. 2009, 42, 339–341. [Google Scholar] [CrossRef]
- Sheldrick, G.M. SHELXT-Integrated Space-Group and Crystal-Structure Determination. Acta Cryst. 2015, A71, 3–8. [Google Scholar] [CrossRef]
- Sheldrick, G.M. Crystal Structure Refinement with SHELXL. Acta Cryst. 2015, C71, 3–8. [Google Scholar] [CrossRef]
- Spackman, P.R.; Turner, M.J.; McKinnon, J.J.; Wolff, S.K.; Grimwood, D.J.; Jayatilaka, D.; Spackman, M.A. CrystalExplorer: A program for Hirshfeld surface analysis, visualization and quantitative analysis of molecular crystals. J. Appl. Cryst. 2021, 54, 1006–1011. [Google Scholar] [CrossRef]
- Mackenzie, C.F.; Spackman, P.R.; Jayatilaka, D.; Spackman, M.A. CrystalExplorer model energies and energy frameworks: Extension to metal coordination compounds, organic salts, solvates and open-shell systems. IUCrJ 2017, 4, 575–587. [Google Scholar] [CrossRef]
- Allen, F.H.; Kennard, O.; Watson, D.G.; Brammer, L.; Orpen, A.G.; Taylor, R. Tables of Bond Lengths determined by X-Ray and Neutron Diffraction. Part 1. Bond Lengths in Organic Compounds. J. Chem. Soc. Perkin Trans. 1987, 2, S1–S19. [Google Scholar] [CrossRef]
- Fox, M.A.; Whitesell, J.K. Organische Chemie: Grundlagen, Mechanismen, Bioorganische Anwendungen, 1st ed.; Springer: Berlin/Heidelberg, Germany, 1995. [Google Scholar]
- Weeks, C.M.; Duax, W.L.; Osawa, Y. 2α-Hydroxytestosterone diacetate. Acta Crystallogr. 1975, B31, 1502–1504. [Google Scholar] [CrossRef]
- Isaacs, N.W.; Motherwell, W.D.S.; Coppola, J.C.; Kennard, O. Crystal and molecular structure of 17α-hydroxyandrost-4-en-3one (epitestosterone). J. Chem. Soc. Perkin II 1972, 2335–2339. [Google Scholar] [CrossRef]
- Courseille, C.; Precigoux, C.; Leroy, F.; Busetta, B. 5α-Androstan-17β-ol-3-one, C19H30O2. Cryst. Struct. Commun. 1973, 2, 441. [Google Scholar]
- Busetta, B.; Courseille, C.; Fornies-Marquina, J.M.; Hospital, M. 5α-Androstan-17β-ol-3-one, C19H30O2. Cryst. Struct. Commun. 1972, 1, 43. [Google Scholar]
- Gaedecki, Z. Structure of 17-α-methyl-testosterone semihydrate C20H30O2·1/2H2O. J. Crystallogr. Spectrosc. Res. 1989, 19, 577–587. [Google Scholar] [CrossRef]
- Rendle, D.F.; Trotter, J. Crystal and molecular structure of 17β-hydroxy-17α-methyl-2-oxa-5α -androstan-3-one. J. Chem. Soc. Perkin II 1975, 1361–1365. [Google Scholar] [CrossRef]
- Turza, A.; Borodi, G.; Muresan-Pop, M.; Ulici, A. Polymorphism and β-cyclodextrin complexation of methyldrostanolone. J. Mol. Struct. 2022, 1250, 131852. [Google Scholar] [CrossRef]
- Turza, A.; Ulici, A.; Muresan-Pop, M.; Borodi, G. Solid forms and β-cyclodextrin complexation of turinabol. Acta Crystallogr. C Struct. Chem. 2022, 78, 305–313. [Google Scholar] [CrossRef]
- Precigoux, G.; Barrans, Y.; Hospital, M. 17-β Hydroxy-4,9,11 Estratriene-3 One, C18H22O2. Cryst. Struct. Commun. 1979, 8, 883–886. [Google Scholar]
- Borodi, G.; Turza, A.; Camarasan, P.A.; Ulici, A. Structural studies of Trenbolone, Trenbolone Acetate, Hexahydrobenzylcarbonate and Enanthate esters. J. Mol. Struct. 2020, 1212, 128127. [Google Scholar] [CrossRef]
- Carvalho, L.B.; Burusco, K.K.; Jaime, C.; Venancio, T.; Carvalho, A.F.S.; Murgas, L.D.S.; Pinto, L.M.A. Complexes between methyltestosterone and β-cyclodextrin for application in aquaculture production. Carbohydr. Polym. 2018, 179, 386–393. [Google Scholar] [CrossRef] [PubMed]
- Mazurek, A.H.; Szeleszczuk, L.; Bethanis, K.; Christoforides, E.; Dudek, M.K.; Zielinska-Pisklak, M.; Pisklak, D.M. 17-β-Estradiol—β-Cyclodextrin Complex as Solid: Synthesis, Structural and Physicochemical Characterization. Molecules 2023, 28, 3747. [Google Scholar] [CrossRef] [PubMed]
- Vicatos, A.I.; Hoossen, Z.; Caira, M.R. Inclusion complexes of the steroid hormones 17β-estradiol and progesterone with β- and γ-cyclodextrin hosts: Syntheses, X-ray structures, thermal analyses and API solubility enhancements. Beilstein J. Org. Chem. 2022, 18, 1749–1762. [Google Scholar] [CrossRef] [PubMed]
- Morin, N.; Chilouet, A.; Millet, J.; Rouland, J.C. Thermal and spectroscopic analysis of inclusion complex of spironolactone prepared by evaporation and hot melt methods. J. Therm. Anal. Calorim. 2000, 62, 187–201. [Google Scholar] [CrossRef]
- Esclusa-Diaz, M.T.; Gayo-Otero, M.; Perez-Marcos, M.B.; Vila-Jato, J.L.; Torres-Labandeira, J.J. preparation and evaluation of ketoconazole-β-cyclodextrin multicomponent complexes. Int. J. Pharm. 1996, 142, 183–187. [Google Scholar] [CrossRef]
- Abarca, R.L.; Rodríguez, F.J.; Guarda, A.; Galotto, M.J.; Bruna, J.E. Characterization of beta-cyclodextrin inclusion complexes containing an essential oil component. Food Chem. 2016, 196, 968–975. [Google Scholar] [CrossRef]

| Identification Code | Oxy-1 | Oxy-2 | Oxy-Acetic | Metr |
|---|---|---|---|---|
| Empirical formula | C21H32O3 | C21H32O3 | C23H36O5 | C19H24O2 |
| Formula weight | 332.46 | 332.46 | 391.51 | 284.38 |
| Temperature/K | 293(2) | 293(2) | 293(2) | 293(2) |
| Crystal system | monoclinic | monoclinic | orthorhombic | monoclinic |
| Space group | P21 | P21 | C2221 | P21 |
| a/Å | 15.0228(11) | 10.4662(7) | 7.1730(6) | 7.54040(10) |
| b/Å | 10.0976(11) | 24.4949(11) | 11.9246(6) | 19.0486(3) |
| c/Å | 25.223(2) | 14.8162(9) | 51.211(2) | 10.8991(2) |
| α/° | 90 | 90 | 90 | 90 |
| β/° | 90.077(9) | 91.542(5) | 90 | 93.0610(10) |
| γ/° | 90 | 90 | 90 | 90 |
| Volume/Å3 | 3826.1(6) | 3797.0(4) | 4380.4(5) | 1563.25(4) |
| Z’ | 4 | 4 | 1 | 2 |
| Z | 8 | 8 | 8 | 4 |
| ρcalcg/cm3 | 1.154 | 1.163 | 1.187 | 1.208 |
| μ/mm−1 | 0.075 | 0.594 | 0.082 | 0.597 |
| F(000) | 1456.0 | 1456.0 | 1704.0 | 616.0 |
| Radiation | MoKα (λ = 0.71073) | CuKα (λ = 1.54184) | MoKα (λ = 0.71073) | CuKα (λ = 1.54184) |
| 2Θ range for data collection/° | 5.834 to 58.18 | 5.968 to 142.416 | 6.364 to 58.174 | 8.124 to 141.292 |
| Index ranges | −20 ≤ h ≤ 19, −12 ≤ k ≤ 12, −33 ≤ l ≤ 32 | −12 ≤ h ≤ 11, −27 ≤ k ≤ 29, −18 ≤ l ≤ 16 | −9 ≤ h ≤ 6, −15 ≤ k ≤ 15, −67 ≤ l ≤ 62 | −9 ≤ h ≤ 9, −23 ≤ k ≤ 23, −13 ≤ l ≤ 13 |
| Reflections collected | 30,808 | 26,373 | 17,511 | 22,022 |
| Independent reflections | 15,697 [Rint = 0.1125, Rsigma = 0.1958] | 12,315 [Rint = 0.0392, Rsigma = 0.0509] | 5175 [Rint = 0.0798, Rsigma = 0.0787] | 5920 [Rint = 0.0286, Rsigma = 0.0224] |
| Data/restraints/parameters | 15,697/21/909 | 12,315/11/909 | 5175/3/259 | 5920/3/391 |
| Goodness-of-fit on F2 | 0.965 | 0.972 | 1.042 | 1.043 |
| Final R indexes [I ≥ 2σ (I)] | R1 = 0.0760, wR2 = 0.1084 | R1 = 0.0547, wR2 = 0.1400 | R1 = 0.0810, wR2 = 0.1701 | R1 = 0.0358, wR2 = 0.0884 |
| Final R indexes [all data] | R1 = 0.2124, wR2 = 0.1494 | R1 = 0.0804, wR2 = 0.1723 | R1 = 0.1173, wR2 = 0.1899 | R1 = 0.0401, wR2 = 0.0926 |
| Largest diff. peak/hole/e Å−3 | 0.20/−0.18 | 0.15/−0.19 | 0.26/−0.23 | 0.14/−0.15 |
| Flack parameter | - | −0.03(15) | - | 0.06(8) |
Disclaimer/Publisher’s Note: The statements, opinions and data contained in all publications are solely those of the individual author(s) and contributor(s) and not of MDPI and/or the editor(s). MDPI and/or the editor(s) disclaim responsibility for any injury to people or property resulting from any ideas, methods, instructions or products referred to in the content. |
© 2024 by the authors. Licensee MDPI, Basel, Switzerland. This article is an open access article distributed under the terms and conditions of the Creative Commons Attribution (CC BY) license (https://creativecommons.org/licenses/by/4.0/).
Share and Cite
Borodi, G.; Miclaus, M.O.; Muresan-Pop, M.; Turza, A. Solid Forms and β-Cyclodextrin Complexation of Oxymetholone and Crystal Structure of Metribolone. Crystals 2024, 14, 483. https://doi.org/10.3390/cryst14060483
Borodi G, Miclaus MO, Muresan-Pop M, Turza A. Solid Forms and β-Cyclodextrin Complexation of Oxymetholone and Crystal Structure of Metribolone. Crystals. 2024; 14(6):483. https://doi.org/10.3390/cryst14060483
Chicago/Turabian StyleBorodi, Gheorghe, Maria Olimpia Miclaus, Marieta Muresan-Pop, and Alexandru Turza. 2024. "Solid Forms and β-Cyclodextrin Complexation of Oxymetholone and Crystal Structure of Metribolone" Crystals 14, no. 6: 483. https://doi.org/10.3390/cryst14060483
APA StyleBorodi, G., Miclaus, M. O., Muresan-Pop, M., & Turza, A. (2024). Solid Forms and β-Cyclodextrin Complexation of Oxymetholone and Crystal Structure of Metribolone. Crystals, 14(6), 483. https://doi.org/10.3390/cryst14060483