Abstract
The sintering dynamics of nickel nanoparticles (Ni NPs) were investigated through a comprehensive approach that included in situ transmission electron microscopy annealing and molecular dynamics simulations. This study systematically examines the transformation behaviors of Ni NP agglomerates over a temperature spectrum from room temperature to 850 °C. Experimental observations, supported by molecular dynamics simulations, revealed the essential influence of rotational and translational motions of particles, especially at lower temperatures, on sintering outcomes. The effect of the orientation of particles on the sintering process was confirmed, with initial configurations markedly determining sintering efficiency and dynamics. Calculated activation energies from this investigation follow those reported in the literature, confirming surface diffusion as the predominant mechanism driving the sintering of Ni NPs.
1. Introduction
The characteristics of nanomaterials fundamentally differ from those of their bulk counterparts due to the pronounced influence of their surface areas. This difference is primarily attributed to their substantial surface-to-volume ratio, which ensures that the surface properties significantly shape the overall behavior of nanomaterials. The decrease in all sizes to tens of nanometers leads to the formation of monocrystalline particles with unique properties. Several metals, such as Au, Ag, Co, Ni, Cu, and Pd, or alloys, such as Fe-Cu, Co-Cu, Fe-Ag, or Ni-Ag, have been investigated in nanoparticle form and found use in a variety of applications [1,2,3,4]. Whether it is the magnetic properties of Fe-Co-Ni particles [5], the luminescence properties of ZnO nanoparticles [6], catalytic properties of Au [7], Pd [8], or CdS NPs [9], the size of the particles plays a crucial role.
A broad range of applications was found for nickel nanoparticles (Ni NPs), which can be used in electrocatalysis, photocatalysis, or biomedicine [10,11]. These unique properties of NPs as catalysts derive from the large percentage of coordinatively unsaturated atoms located at the surface, edges, and corners of the NPs compared to the total number of atoms [12]. The unsaturated atoms have the highest catalytic activity because they tend to increase their coordination number by coordinating with their surroundings. Furthermore, potential applications in magnetic sensors [13], memory devices [14,15], and conducting materials [16] have been examined. For the particles below a critical size, a single magnetic domain is energetically more stable, which results in their supermagnetic properties [17,18].
The synthesis of Ni NPs is achievable through various methods categorized into physical, chemical, and biological techniques, each with distinct advantages [19]. Chemical synthesis includes processes such as chemical reduction [20], electrochemical techniques [21], and thermal decomposition [22]. Biological synthesis uses biological sources like plants, bacteria, fungi, and other microorganisms for the synthesis [23]. Physical approaches, including mechanical milling and arc discharge [24], offer robust solutions for achieving precise control over particle size and morphology through top-down strategies. Notably, gas aggregation stands out for producing highly uniform and pure NiNPs with controlled size and shape [25].
Consolidation of individual nanoparticles occurs through the elevation of temperature, pressure, or application of electric fields [26]. This consolidation of individual monocrystalline particles to a dense microstructure causes a deterioration of the desired properties originating from the nano-size of the particles. When sintering nickel nanoparticles, the process differs significantly from that in bulk recrystallization [27] due to the large surface-to-volume ratio of nanoparticles. Studies of the sintering of Ni gas nanoparticles have been used to calculate diffusion coefficients [28]. However, there is a lack of studies that allow for the direct observation of the behavior of agglomerates of Ni nanocrystals at elevated temperatures.
The literature reveals a few key findings in molecular dynamics (MD) simulations for nickel nanoparticle sintering. Studies have focused on the effects of particle size and temperature on the melting and sintering processes, providing insights into the size-dependent melting phenomena and surface melting of nickel nanoparticles [29]. Additionally, research has explored the sintering mechanisms, particularly looking into nanoscale materials, which can offer a broader understanding applicable to nickel nanoparticles [30]. Another critical area of investigation involves using specific interatomic potentials, like Morse parameters and EAM functions, to accurately simulate the behavior of nickel nanoparticles and their interactions with other materials [31]. These studies collectively contribute to a deeper understanding of the sintering behavior of nickel nanoparticles at the atomic level. Crucially, for a comprehensive understanding, these simulations should be rigorously compared with experimental data to validate the accuracy and relevance of the theoretical models. Most molecular dynamics studies have predominantly concentrated on the sintering of two particles, not examining the effects that arise from the interaction of multiple particles.
In this work, pure Ni nanoparticles were prepared using magnetron sputtering. In situ annealing in the transmission electron microscope is used to monitor the coalescence of these particles in temperature ranges from room temperature to 800 °C. Experimental observations are complemented with MD simulations.
2. Materials and Methods
Pure Ni nanoparticles were prepared by DC magnetron sputtering at the following deposition conditions: pressure of Ar 13 Pa, current of 500 mA, and voltage of 335 V. The nanoparticles were sputtered from a 1.5 mm thick Ni target with a purity of at least 99%. The maximum amount of impurities is presented in Table 1. Details of the used geometry and procedure can be found in [32].

Table 1.
Composition of the sputtering target.
The samples for TEM were prepared by mixing the particles with methanol and dropping the solution on silicon dioxide ultrathin-film TEM window grids. The particles were characterized on a Jeol 2200FS electron microscope operated at 200 keV using conventional, scanning, and high-resolution transmission electron microscopy (TEM, STEM, and HRTEM, respectively). Bright-field (BF), high-angle annular dark-field (HAADF), and secondary electron (SE) detectors were used in the scanning mode. The annealing of particles was performed in situ up to 900 °C with the same microscope using a Gatan double-tilt heating holder. The calibration of the holder was performed using the phase transformation temperature of alpha to beta titanium at high temperatures and phase transformations in the Al-Sn system at low temperatures. The statistical evaluation of the number and size of nanoparticles was performed with ImageJ 1.45 software [33].
A pair and a pile of randomly oriented Ni nanoparticles with a radius of 3.5 nm for the molecular dynamics simulation were created in Atomsk [34]. The LAMMPS software 23 June 2022 version [35] with MEAM potential [36] was used for MD simulations. The particles were held at constant temperatures with a Nose–Hoover thermostat [37] for one ns, using a one fs time step. Simulated atomic configurations were visualized and analyzed using Ovito 3.2.1. [38].
3. Results
3.1. Experimental TEM Observations
3.1.1. Characterization of Initial State
In Figure 1, the TEM images reveal an agglomeration of nickel particles, predominantly of a spherical shape. A detailed view in Figure 1b shows the atomic distances within some of these particles. Fourier transformation analysis of these images confirms the presence of fcc nickel, evidenced by the matching interatomic distances to nickel 111 and 200 planes. The fcc structure of nickel is further confirmed by the selected area diffraction pattern (Figure 1c). No signs of surface oxidation were detected.
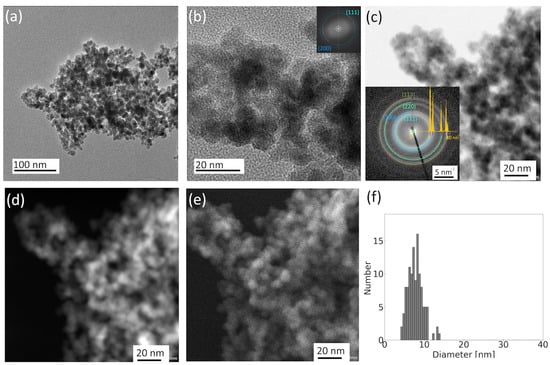
Figure 1.
TEM images of the initial state of an agglomerate of Ni nanoparticles—(a) TEM BF showing a representative agglomerate at room temperature, (b) detailed HRSTEM view with a confirmation of fcc Ni structure by Fourier transformation image in the inset, (c) STEM BF—diffraction contrast with selected area diffraction pattern (SAED) overlaid by fcc Ni diffraction pattern, (d) STEM HAADF—mass thickness contrast, (e) SE—surface contrast of the agglomerate detail, and (f) histogram of particles size distribution.
Images in the HAADF (Figure 1d) and SE (Figure 1e) detectors provide additional information about the thickness and surface morphology. The total number of particles of the agglomerate exceeding 2000 can be roughly estimated from these images. Regarding the size distribution of these nanoparticles, as depicted in Figure 1f, their diameters range from 4 to 14 nm, with an average value of 8 nm and a standard deviation of 2 nm.
3.1.2. In Situ TEM Annealing
The particles were annealed up to 100 °C, 300 °C, and 500 °C, then in 50 °C steps up to 850 °C. Each temperature was held for 5 min for the stabilization. The annealing process of the isolated nanoparticle agglomerate is shown in Figure 2. Initially, up to a temperature of 300 °C, the nanoparticles exhibit minimal changes in shape. However, upon reaching 500 °C, the particles begin to sinter, coalescing into larger entities that are two to three times their original size while approximately retaining the overall form of the agglomerate. The particles undergo progressive reshaping as temperatures increase between 500 °C and 800 °C. The process culminates at 850 °C, where the nanoparticles merge to form a single large particle.
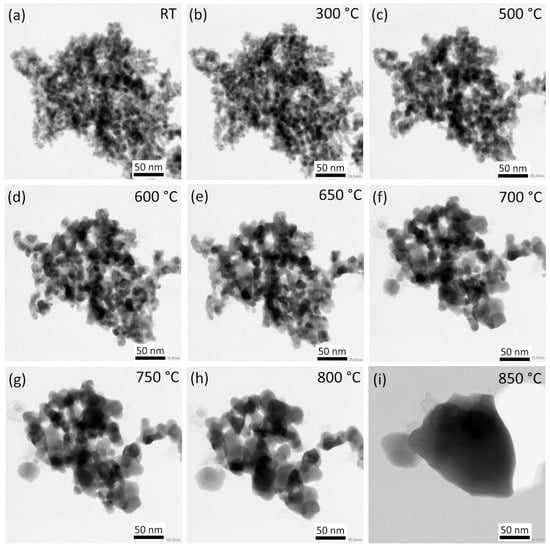
Figure 2.
In situ annealing of the nanoparticle agglomerate. STEM BF images in the temperature range of 25–850 °C: (a,b) initial stages of sintering, (c–h) coalescence of smaller particles, and (i) coalescence of the whole agglomerate into a single particle.
Figure 3 presents the changes in the size distribution of nanoparticles within an agglomerate across different temperatures. These statistical distributions were derived by measuring diameters for 120 distinct particles at room temperature (RT) and 300 °C. As temperatures escalate, there is a noticeable reduction in the total number of particles, and the distributions at 500 °C and 700 °C measured on 80 and 70 particles, respectively. The data reveal a significant increase in the mean diameter of the nanoparticles: from 8 nm at room temperature, it enlarges to 12 nm at 500 °C and expands further to 19 nm at 700 °C.
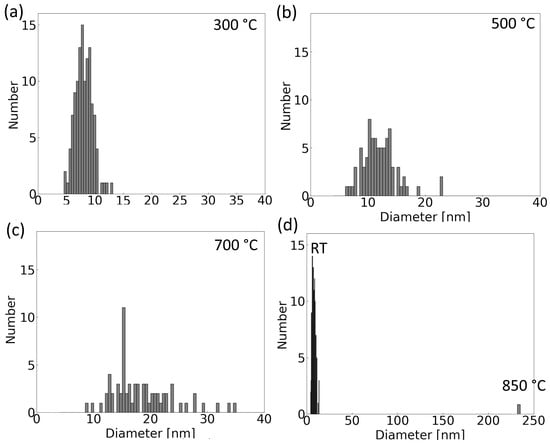
Figure 3.
Histograms of the size distribution of particles in the agglomerate in Figure 2 at chosen temperatures: (a) 300 °C, (b) 500 °C, (c) 700 °C, and (d) 850 °C compared to the room temperature. The total number of particles decreases with increasing temperature.
The characteristic sintering time (τ) of nickel particles is defined as the time required for the length of the sintered neck between two particles to reach 83% of the initial radius of the particles. The formula of characteristic sintering time as a function of the radius of the primary particles can be derived from macroscopic continuum theories of sintering via surface diffusion [28,39]:
where R represents the radius of the primary particles, D denotes the diffusion constant, γ signifies the surface free energy, and a corresponds to the diameter of the atoms. The model incorporates the temperature-dependent diffusion coefficient, D, which follows the Arrhenius relationship D = D0 × exp(−Ea/kBT), where D0 is the pre-exponential factor, Ea is the activation energy, kB is the Boltzmann constant, and T is the sintering temperature in Kelvin.
τ = kB × T/(25 × D × γ × a4) × R4,
Additional information from HAADF detectors (Figure 4a–d) allows for the distinction of thickness contrast from the diffraction contrast visible in BF. Compared to images of the surface from the SE detector (Figure 4e–h), all the dark parts corresponding to the holes in the SE images align well with dark parts in the HAADF detector corresponding to a reduced thickness. A conclusion that can be drawn from these observations is that the surface inhomogeneities are primarily attributable to the perspective of the agglomerates, as seen from above. The lack of significant cavities on the lower side suggests the adhesion of the particles to the SiO2 membrane. Furthermore, while the HAADF detector images suggest that particles appear as individual entities, the necking process—signifying the onset of sintering among these particles—is distinctly observed through the SE detector.
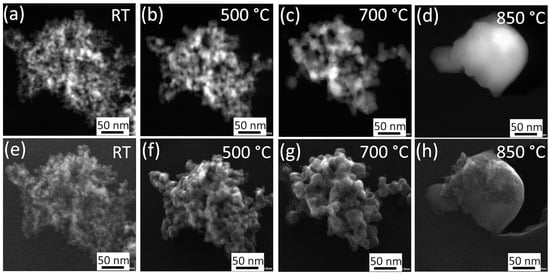
Figure 4.
Annealing of the nanoparticle agglomerate at temperatures with the most prominent shape changes, comparison of mass thickness contrast in STEM HAADF images (a–d), and surface morphology contrast in SE detector images (e–h).
The information from the HAADF, BF, and SE detectors and size distribution for temperatures of 300, 500, 700, and 850 °C (Figure 4) allow for estimating the surface area change. Implementing the modified phenomenological model of Koch and Friedlander, described by Tsyganov et al. [28], enables a quantitative analysis of this dependence. Initially, the volume of the two individual particles at 850 °C and the volume of the aggregate of particles at 800 °C were computed. In the case of non-spherical particles, the volume estimation employed a spherical model using the average radii obtained from measurements. With volume conservation validated between these temperatures, this principle of volume consistency was extrapolated across all examined temperatures. The particle count was estimated, adhering to their empirically measured distribution, enabling the subsequent surface area calculation, which was predicted using the spherical particle assumption. Area changes as a function of temperature are plotted in Figure 5a.
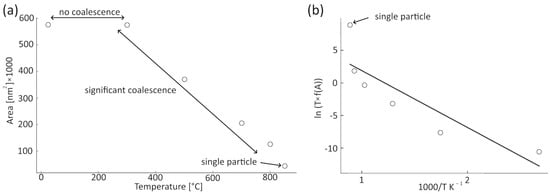
Figure 5.
Analysis of the surface area of the annealed agglomerate: (a) change in the estimated surface as a function of temperature, the ranges where no coalescence, coalescence of smaller particles, and coalescence of the whole agglomerate are indicated in the plot; (b) Arrhenius plot according to Equation (2). The solid line represents the linear regression of the measured data (empty circles). The initial and final areas (points marked as a single particle) were not used in the fit.
Employing Equation (1), combined with the principle of conserved volume, and integration of the Koch–Friedlander equation as well as diffusion coefficient D = D0 × exp(−Ea/kBT), the formulation of Equation (2) follows (detailed derivation in [28]):
where T is temperature, Ea is the activation energy, kB is the Boltzmann constant, C is a constant associated with sintering conditions, and f(A) is a function solely dependent on the agglomerate surface area before sintering (A0), during sintering (A), and in the fully sintered state (As). If we denote As/A0 as α, As/A as β, and A0/A as , then
T × f(A) = C × exp(−Ea/kBT),
By plotting the logarithm of T · f(A) as a function of inverse temperature (Figure 5b), the activation energy was determined as 0.75 eV/atom for a temperature range of 300–800 °C. The value is much smaller than volume diffusion, comparable to some values of the grain boundary and surface diffusion [40,41]. At 850 °C, when the nanoparticles merge into a larger single particle, there is a noticeable deviation from the linear fit in Figure 5b. This indicates a change in the sintering mechanism.
3.1.3. Initial Stages of Annealing
The details of the initial phases of sintering under 450 °C are depicted in Figure 6. Figure 6a–d capture the merging of particles of various sizes, forming larger aggregates, specifically a 7 nm, and a 6 nm particle with a larger 10 nm particle at a temperature of 300 °C. The increase in temperature to 400 °C facilitates the merging of slightly larger particles between 13 and 15 nm, as shown in Figure 6e–h. Both particle size and temperature significantly influence the initial stages of particle coalescence, forming larger, more consolidated structures.
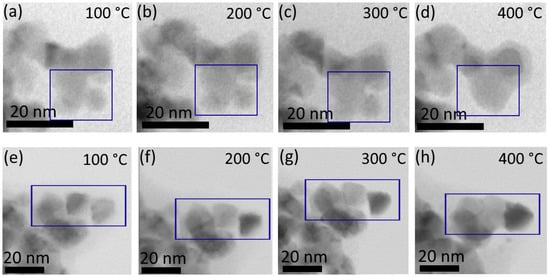
Figure 6.
Annealing of different agglomerates of Ni nanoparticles at a temperature range of 100–400 °C; detail of initial stages of sintering. STEM BF image sequences of two different areas: (a–d) first area and (e–h) the second area. Blue rectangles mark the coalescing particles.
Beyond the primary coalescence process, subtle positional adjustments among individual particles within the agglomerate are noticeable (Figure 7). These adjustments illustrate a tendency towards reducing inter-particle distances, contributing to the densification and overall compaction of the agglomerate.
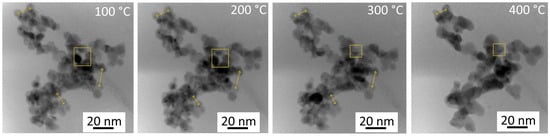
Figure 7.
Initial stages of annealing of a smaller agglomerate of Ni nanoparticles; STEM BF images at different temperatures. Yellow arrows and rectangles mark position changes between individual particles.
3.2. Characterization by Molecular Dynamics Simulations
3.2.1. Annealing Simulations of a Four-Particle Agglomerate: Particle Motion Analysis
The molecular dynamics simulation of the sintering process of the four nickel nanoparticles with the initial configuration shown in Figure 8 was run for two different temperatures (273 and 1100 K).
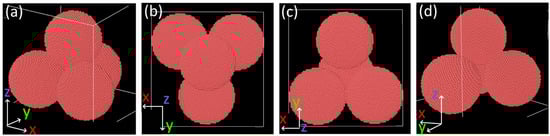
Figure 8.
Ovito visualization of the initial configuration of a pile of nanoparticles used in MD simulations: (a) front, (b) up, (c) down, and (d) back views.
The dynamics of a four-particle agglomerate over a 1 ns timescale at room temperature is illustrated in Figure 9. The whole body motion of all the particles can be observed to make contact between non-touching particles, causing a decrease in their distance (Figure 9e,f) and contact (Figure 9g). The small rotations between crystalline lattices of individual particles accompany this translational motion. Their behavior is similar to that observed at lower temperatures in the in situ TEM experiment. The contact area between two particles expands minimally, extending only a few interatomic distances. The translational and small rotational motion of individual particles in the agglomerate results from minimizing the surface energy and the boundary energy between two lattices.
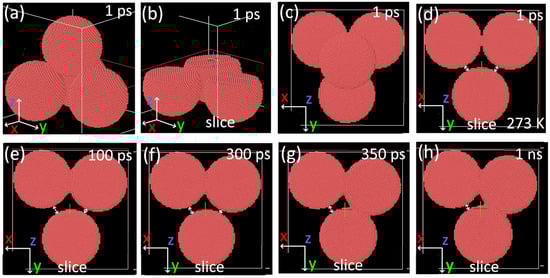
Figure 9.
Ovito visualization of results of MD simulations of the nanoparticles annealing at 273 K. (a–c) A 1 ps of simulation: (a) front view, (b) how the pile was sliced for a better view, (c) top view, and (d–h) top view sliced at different timesteps. White arrows mark the distance between individual particles.
Aside from the whole body motion at a high temperature of 1100 K (Figure 10), the traveling of individual atoms from the surface of the particles through the interspace between two particles can be detected. By combining these mechanisms, particles meet and coalesce into a single mass (Figure 10d). The initial contact and neck formation between initially non-touching particles occur in a shorter time (100 ps) than during the room temperature annealing (350 ps). This is a result of particle motion and rotations caused by attractive van der Waals forces [42] and energy minimization by lattice rotations between all four particles in the pile. After the contact, the neck growth continues, and the sintering time obeys predictions based on diffusion mechanisms.
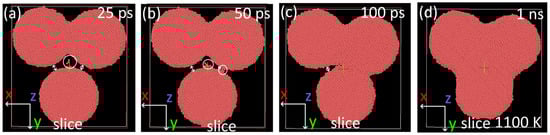
Figure 10.
Ovito visualization of results of annealing of nanoparticles at a temperature of 1100 K. Top view sliced at different timesteps (25 ps–1 ns): (a) 25 ps, (b) 50 ps, (c) 100 ps, and (d) 1 ns. White arrows mark the distance between individual particles, and white circles mark the motion of individual atoms through the void.
3.2.2. Motion of Individual Atoms
A selection of atoms from the vicinity of the neck of two joined particles was made at one ns of simulation (Figure 11d,h). Images of this particle selection at lower simulation times (Figure 11a–h) indicate the original position of atoms contributing to the necking. Most of these atoms are close to the contact area (the distance is lower than four lattice parameters—Figure 11a). Surface atoms are the only ones traveling more considerable distances (Figure 11f). Thus, the maximum final displacement of inner atoms is approximately 1.4 nm, while the final displacement of surface atoms can reach 4 nm.
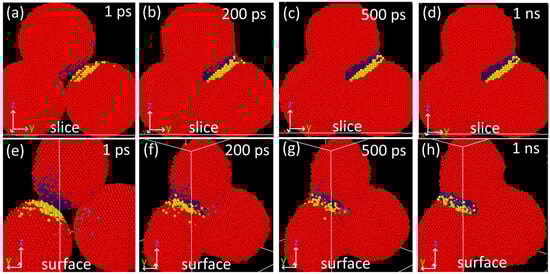
Figure 11.
Detail of necking of nanoparticles annealing at 1100 K at different time steps. The selection is colored according to the particle index: yellow, blue, and green atoms correspond to the selection in each particle; red atoms are outside of the selection. (a–d) Front view, a cross-section through the interior of particles, and (e–h) back view of the surface.
The motion of inner atoms unaffected by necking at 1100 K is visualized in Figure 12. A truncated conical volume was selected at the beginning of the simulation time, cutting through both particle surfaces (Figure 12a–d). The images of the selection at 1 ns show that only surface atoms shift and the inner ones remain stationary.
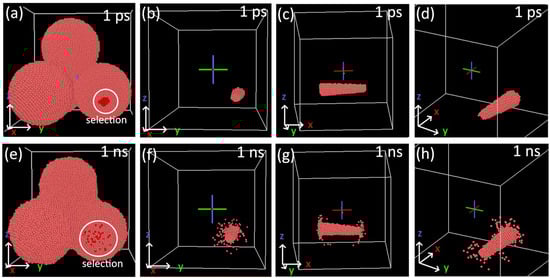
Figure 12.
Selection of atoms cutting through the nanoparticle. The selection was made manually at 1 ps of simulation: (a–d) front and side views at RT; (e–h) the corresponding views at 1 ns. The simulation was made at 1100 K.
3.2.3. Diffusion Coefficients
The diffusion coefficient was calculated from the sintering of two particles (Figure 12) with a radius of 3.5 nm at 1100 K from the initial slope of the atomic mean-square displacement, MSD, using the Einstein relation:
where N is the number of atoms in a particle, d is the dimensionality, and ri is the position of each atom. The calculated values for the same and different orientations of particles are 3.4 × 10⁻¹² m2/s and 1.1 × 10⁻¹¹ m2/s, respectively. The values match well with the diffusion coefficient for 1100 K that Rahbar et al. [40] obtained from calculations with different interatomic potentials. The increase in the total diffusion coefficient in misoriented particles is related to the formation of an additional non-crystalline area at the interface. The images of the nanoparticles with the same and different orientations at three simulation timesteps (Figure 13) confirm a lower sintering time for differently oriented particles. This phenomenon aligns with observations made in simulations of Al and Au nanoparticles [43,44], where a slower sintering evolution of particles with initially larger areas was reported.
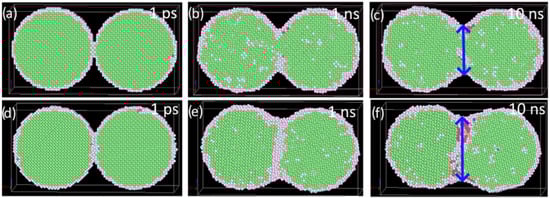
Figure 13.
Sintering of two particles at 1100 K for two different particle orientations: (a–c) same initial orientation of particles; (d–f) differently oriented nanoparticles ([100], [010], [001], and [1–10], [001], [110] directions parallel to x, y, and z axes). The atoms are colored according to the common neighbor analysis: green—fcc, red—hcp, and gray—not defined lattice structure. The final length of the sintered particles is marked by a blue arrow.
The diffusion coefficient value, 7.4 × 10⁻¹² m2/s, of individual particles in the nanoparticle pile with the same initial orientation (Figure 13) was computed at 1100 K. This is between the values of diffusion coefficients of two nanoparticles at the same temperature. The value indicates variations in the area of the disoriented lattice at the particle boundary due to mutual rotations of a many-body system.
4. Discussion
The diffusion in MD simulations occurs mainly through the diffusion of surface atoms. The mechanism matches the mechanism predicted in the experimental part, where the calculated activation energy corresponds to surface and grain boundary diffusion values. For nanoparticles, boundaries can be excluded or considered as the surfaces of two particles in contact. This result is expected and corresponds well to other experimental and simulation findings of nanoparticle sintering [28,43,44].
The TEM observations indicate a noticeable change in particle shapes at given temperatures. The images were captured within a few seconds, a time range resulting from the time required to acquire an STEM image. Consequently, this timeframe restricted the ability to detect processes that occurred faster. Each temperature was held for several minutes, allowing slower processes to come into play. When taking the values of gamma and D as constants from the established literature values, the characteristic sintering time as a function of temperature for different values of particle radii can be computed from Equation (1). For the sintering of particles with a diameter under 10 nm, a characteristic sintering time of 100 s is expected at room temperature, while it decreases to several seconds at 300 °C. The estimated characteristic sintering time ranges from seconds to hundreds of seconds for particles with diameters under 20 nm and temperatures over 500 °C. Sintering time estimates obtained from molecular dynamics simulations [29,40] cannot be directly applied to match the experimental results due to the significantly smaller particle sizes and higher temperatures involved in the simulations.
This estimation fits the temperature scale when the sintering of individual particles was observed with a microscope. The coalescence of smaller particles to ones with larger diameters was observed for the temperatures when characteristic sintering times were close to seconds. However, after the quick transformation after each temperature step, the newly formed structures remained unchanged for the ten-minute step, where they were held at a constant temperature. The necking of particles might have occurred. However, it did not result in coalescence, even after a longer time. Monte Carlo simulations [45] show that the increase in the sintering time is linked to the presence of faceted elongated particles. A more isotropic equilibrium shape is formed more slowly than expected for spherical particles because crystal growth on the facets requires the nucleation of new islands.
The influence of particle orientation on the sintering rate was shown in MD simulations, where the lattice mismatch between two particles resulted in lower sintering times. Similar results were reported in MD simulation studies of the sintering of Au and Al nanoparticles [43,44]. Many random orientations exist in our experiments using nanoparticle agglomerates without a preferred initial-contact-area orientation. Consequently, this influence should neutralize across the sample and not significantly impact the results.
Within the context of molecular dynamics simulations, nanoparticles exhibit rotational and translational motions when they are part of agglomerates. Small rotations of particles in MD simulations have been reported by Zhu and Averback [46] on two-particle simulations. They observed an elastic deformation during the early sintering stages, after which a relative rotation between the two particles begins until a low minimum energy grain boundary is achieved. The rotation effect was also observed in experimental Au nanoparticles [47] and numerical Au/Cu nanoparticles [48]. Generally, it is considered to be a process of boundary elimination.
However, the motion in our simulation appears to be unrelated to the alignment of lattice planes, but contributes to accelerating surface minimization. This fact could be the result of complications caused by the presence of several particles. Notably, this effect has not been accounted for in the calculated diffusion coefficients or the subsequently estimated time rates, thus representing an overlooked factor that speeds up the sintering process.
5. Conclusions
In situ TEM observations were used to study the coalescence and sintering of fcc Ni nanoparticles with an initial mean diameter of 8 nm from room temperature to 850 °C. The analysis of the images allowed the measurement of the particle size from which the activation energy of diffusion was determined for temperatures up to 800 °C. The activation energy of diffusion calculated during the direct in situ annealing observation aligns with the existing literature, reinforcing the dominance of surface diffusion as the primary mechanism driving these sintering phenomena through previously unexplored temperature ranges. The phenomena observed in the experimental findings, including rotational and translational movements during sintering at lower temperatures and sintering via surface diffusion, align with molecular dynamics simulations, validating the use of MD simulations for calculations in the temperature range of RT—800 °C. Between 800 and 850 °C, well under the melting temperature predicted for nanoparticles by molecular dynamics simulations, the coalescence of a nanoparticle agglomerate to one single particle was observed, indicating a change in the sintering mechanism. Direct experimental observations of fcc Ni nanoparticle sintering offer valuable data for validating the findings via various MD simulations.
Author Contributions
The following specifies the individual contributions of each author to this research article: conceptualization, methodology, and writing—original draft preparation, L.B.; data curation and validation, R.K.; visualization and investigation, B.K.; resources, software, and writing—review and editing, J.H.; supervision, project administration, and funding acquisition, M.C. All authors have read and agreed to the published version of the manuscript.
Funding
This research was funded by the Czech Science Foundation, grant number 22-22572S.
Data Availability Statement
The raw data supporting the conclusions of this article will be made available by the authors on request.
Conflicts of Interest
The authors declare no conflicts of interest.
References
- Dreaden, E.C.; Alkilany, A.M.; Huang, X.; Murphy, C.J.; El-Sayed, M.A. The golden age: Gold nanoparticles for biomedicine. Chem. Soc. Rev. 2012, 41, 2740–2779. [Google Scholar] [CrossRef]
- Kuang, X.; Wang, Z.; Luo, Z.; He, Z.; Liang, L.; Gao, Q.; Li, Y.; Xia, K.; Xie, Z.; Chang, R.; et al. Ag nanoparticles enhance immune checkpoint blockade efficacy by promotion of immune surveillance in melanoma. J. Colloid Interface Sci. 2022, 616, 189–200. [Google Scholar] [CrossRef]
- Jadhav, P.; Khalid, Z.B.; Krishnan, S.; Bhuyar, P.; Zularisam, A.W.; Razak, A.S.A.; Nasrullah, M. Application of iron-cobalt-copper (Fe-Co–Cu) trimetallic nanoparticles on anaerobic digestion (AD) for biogas production. Biomass Convers. Bioref. 2024, 14, 7591–7601. [Google Scholar] [CrossRef]
- Kumar, K.H.; Venkatesh, N.; Bhowmik, H.; Kuila, A. Metallic Nanoparticle: A Review. Biomed. J. Sci. Technol. Res. 2018, 4, 3765–3775. [Google Scholar]
- Yang, C.J.; Kim, K.S.; Wu, J. Isolated Fe–Co–Ni nanoparticles in a random arrangement and their magnetic properties. J. Appl. Phys. 2001, 90, 5741–5746. [Google Scholar] [CrossRef]
- Wang, X.; Zhao, F.; Xie, P.; Deng, S.; Xu, N.; Wang, H. Surface emission characteristics of ZnO nanoparticles. Chem. Phys. Lett. 2006, 423, 361–365. [Google Scholar] [CrossRef]
- Faramarzi, M.A.; Forootanfar, H. Biosynthesis and characterization of gold nanoparticles produced by laccase from Paraconiothyrium variable. Colloids Surf. B Biointerfaces 2011, 87, 23–27. [Google Scholar] [CrossRef] [PubMed]
- Das, S.K.; Parandhaman, T.; Pentela, N.; Islam, A.K.M.; Mandal, A.B.; Mukherjee, M. Understanding the Biosynthesis and Catalytic Activity of Pd, Pt, and Ag Nanoparticles in Hydrogenation and Suzuki Coupling Reactions at the Nano–Bio Interface. J. Phys. Chem. C 2014, 118, 24623–24632. [Google Scholar] [CrossRef]
- Lakowicz, J.R.; Gryczynski, I.; Gryczynski, Z.; Murphy, C.J. Luminescence Spectral Properties of CdS Nanoparticles. J. Phys. Chem. B 1999, 103, 7613–7620. [Google Scholar] [CrossRef]
- Seok, S.; Choi, M.; Lee, Y.; Jang, D.; Shin, Y.; Kim, Y.-H.; Jo, C.; Park, S. Ni Nanoparticles on Ni Core/N-Doped Carbon Shell Heterostructures for Electrocatalytic Oxygen Evolution. ACS Appl. Nano Mater. 2021, 4, 9418–9429. [Google Scholar] [CrossRef]
- Xie, Z.; Zhang, T.; Zhao, Z. Ni Nanoparticles Grown on SiO2 Supports Using a Carbon Interlayer Sacrificial Strategy for Chemoselective Hydrogenation of Nitrobenzene and m-Cresol. ACS Appl. Nano Mater. 2021, 4, 9353–9360. [Google Scholar] [CrossRef]
- Navalón, S.; Garcia, H. Nanoparticles for Catalysis. Nanomaterials 2016, 6, 123. [Google Scholar] [CrossRef] [PubMed]
- Wang, Z.K.; Kuok, M.H.; Ng, S.C.; Lockwood, D.J.; Cottam, M.G.; Nielsch, K.; Wehrspohn, R.B.; Gösele, U. Spin-Wave Quantization in Ferromagnetic Nickel Nanowires. Phys. Rev. Lett. 2002, 89, 027201. [Google Scholar] [CrossRef] [PubMed]
- Zheng, W.T.; Sun, C.Q. Electronic process of nitriding: Mechanism and applications. Prog. Solid State Chem. 2006, 34, 1–20. [Google Scholar] [CrossRef]
- Yoon, D.H.; Kim, S.J.; Jung, J.; Lima, H.S.; Kim, H.J. Low-voltage driving solution-processed nickel oxide based unipolar resistive switching memory with Ni nanoparticles. J. Mater. Chem. 2012, 22, 20117–20124. [Google Scholar] [CrossRef]
- Sze, J.Y.; Tay, B.K.; Pakes, C.I.; Jamieson, D.N.; Prawer, S. Conducting Ni nanoparticles in an ion-modified polymer. J. Appl. Phys. 2005, 98, 066101. [Google Scholar] [CrossRef]
- Fonseca, F.C.; Goya, G.F.; Jardim, R.F.; Muccillo, R.; Carreño, N.L.V.; Longo, E.; Leite, E.R. Superparamagnetism and magnetic properties of Ni nanoparticles embedded in SiO2. Phys. Rev. B 2002, 66, 104406. [Google Scholar] [CrossRef]
- Li, Q.; Kartikowati, C.W.; Horie, S.; Ogi, T.; Iwaki, T.; Okuyama, K. Correlation between particle size/domain structure and magnetic properties of highly crystalline Fe3O4 nanoparticles. Sci. Rep. 2017, 7, 9894. [Google Scholar] [CrossRef]
- Hassan, M.R.; Yasmin, F.; Noor, F.K.; Rahman, M.S.; Uddin, M.S.; Bhowmik, S. Synthesis and Applications of Nickel Nanoparticles (NiNPs)—Comprehensive Review. JUC 2023, 19, 9–37. [Google Scholar] [CrossRef]
- Su, F.; Qiu, X.; Liang, F.; Tanaka, M.; Qu, T.; Yao, Y.; Ma, W.; Yang, B.; Dai, Y.; Hayashi, K.; et al. Preparation of Nickel Nanoparticles by Direct Current Arc Discharge Method and Their Catalytic Application in Hybrid Na-Air Battery. Nanomaterials 2018, 8, 684. [Google Scholar] [CrossRef]
- Pandey, A.; Manivannan, R. A Study on Synthesis of Nickel Nanoparticles Using Chemical Reduction Technique. Recent Pat. Nanomed. 2015, 5, 33–37. [Google Scholar] [CrossRef]
- Ramos, R.; Valdez, B.; Nedev, N.; Curiel, M.; Perez, O.; Salvador, J. Electric discharge synthesis of nickel nanoparticles with virtual instrument control. Instrum. Sci. Technol. 2021, 49, 499–508. [Google Scholar] [CrossRef]
- Mourdikoudis, S.; Simeonidis, K.; Vilalta-Clemente, A.; Tuna, F.; Tsiaoussis, I.; Angelakeris, M.; Dendrinou-Samara, C.; Kalogirou, O. Controlling the crystal structure of Ni nanoparticles by the use of alkylamines. J. Magn. Magn. Mater. 2009, 321, 2723–2728. [Google Scholar] [CrossRef]
- Ahghari, M.R.; Soltaninejad, V.; Maleki, A. Synthesis of nickel nanoparticles by a green and convenient method as a magnetic mirror with antibacterial activities. Sci. Rep. 2020, 10, 12627. [Google Scholar] [CrossRef] [PubMed]
- Maicas, M.; Sanz, M.; Cui, H.; Aroca, C.; Sánchez, P. Magnetic properties and morphology of Ni nanoparticles synthesized in gas phase. J. Magn. Magn. Mater. 2010, 322, 3485–3489. [Google Scholar] [CrossRef]
- Kang, S.-J.L. Sintering: Densification, Grain Growth, and Microstructure; Elsevier: Oxford, UK, 2005; pp. 3–7. [Google Scholar]
- Jahani, N.; Reihanian, M.; Gheisari, K. Kinetics of recrystallization and microstructure distribution during isothermal annealing of cold rolled nickel. Mater. Res. Express 2019, 6, 096504. [Google Scholar] [CrossRef]
- Tsyganov, S.; Kästner, J.; Rellinghaus, B.; Kauffeldt, T.; Westerhoff, F.; Wolf, D. Analysis of Ni nanoparticle gas phase sintering. Phys. Rev. B 2007, 75, 045421. [Google Scholar] [CrossRef]
- Song, P.; Wen, D. Surface melting and sintering of metallic nanoparticles. J. Nanosci. Nanotechnol. 2010, 10, 8010–8017. [Google Scholar] [CrossRef] [PubMed]
- Zhang, Y.; Zhang, J. Sintering phenomena and mechanical strength of nickel-based materials in direct metal laser sintering process—A molecular dynamics study. J. Mater. Res. 2016, 31, 2233–2243. [Google Scholar] [CrossRef]
- Safina, L.; Baimova, J.; Mulyukov, R. Nickel nanoparticles inside carbon nanostructures: Atomistic simulation. Mech. Adv. Mater. Mod. Process. 2019, 5, 2. [Google Scholar] [CrossRef]
- Hanuš, J.; Vaidulych, M.; Kylián, O.; Choukourov, A.; Kousal, J.; Khalakhan, I.; Cieslar, M.; Solař, P.; Biederman, H.J. Fabrication of Ni@Ti core–shell nanoparticles by modified gas aggregation source. Phys. D Appl. Phys. 2017, 50, 475307. [Google Scholar] [CrossRef]
- Schneider, C.A.; Rasband, W.S.; Eliceiri, K.W. NIH Image to ImageJ: 25 years of image analysis. Nat. Methods 2012, 9, 671–675. [Google Scholar] [CrossRef]
- Hirel, P. Atomsk: A tool for manipulating and converting atomic data files. Comput. Phys. Comm. 2015, 197, 212–219. [Google Scholar] [CrossRef]
- Thompson, A.P.; Aktulga, H.M.; Berger, R.; Bolintineanu, D.S.; Brown, W.M.; Crozier, P.S.; in ’t Veld, P.J.; Kohlmeyer, A.; Moore, S.G.; Nguyen, T.D.; et al. LAMMPS—A flexible simulation tool for particle-based materials modeling at the atomic, meso, and continuum scales. Comp. Phys. Comm. 2022, 271, 10817. [Google Scholar] [CrossRef]
- Kavousi, S.; Novak, B.R.; Baskes, M.I.; Zaeem, M.A.; Moldovan, D. Modified embedded-atom method potential for high-temperature crystal-melt properties of Ti–Ni alloys and its application to phase field simulation of solidification. Model. Simul. Mater. Sci. Eng. 2019, 28, 015006. [Google Scholar] [CrossRef]
- Shinoda, W.; Shiga, M.; Mikami, M. Rapid estimation of elastic constants by molecular dynamics simulation under constant stress. Phys. Rev. B 2004, 69, 134103. [Google Scholar] [CrossRef]
- Stukowski, A. Visualization and analysis of atomistic simulation data with OVITO—The Open Visualization Tool. Model. Simul. Mater. Sci. Eng. 2010, 18, 015012. [Google Scholar] [CrossRef]
- Nichols, F.A. Coalescence of two spheres by surface diffusion. J. Appl. Phys. 1966, 37, 2805. [Google Scholar] [CrossRef]
- Rahbar, H. Sintering rate of nickel nanoparticles by molecular dynamics. J. Phys. Chem. 2023, 127, 6802–6812. [Google Scholar] [CrossRef]
- Kelchner, C.L.; Plimpton, S.J.; Hamilton, J.C. Dislocation nucleation and defect structure during surface indentation. Phys. Rev. B 1998, 58, 11085. [Google Scholar] [CrossRef]
- Shrestha, S.; Wang, B.; Dutta, P. Nanoparticle processing: Understanding and controlling aggregation. Adv. Colloid Interface Sci. 2020, 279, 102162. [Google Scholar] [CrossRef]
- Arcidiacono, S.; Bieri, N.R.; Poulikakos, D.; Grigoropoulos, C.P. On the coalescence of gold nanoparticles. Int. J. Multiph. Flow 2004, 30, 979–994. [Google Scholar] [CrossRef]
- Raut, J.S.; Bhagat, R.B.; Fichthorn, K.A. Sintering of aluminum nanoparticles: A molecular dynamics study. Nanostruct. Mater. 1998, 10, 837–851. [Google Scholar] [CrossRef]
- Combe, N.; Jensen, P.; Pimpinelli, A. Changing shapes in the nanoworld. Phys. Rev. Lett. 2000, 85, 110. [Google Scholar] [CrossRef]
- Zhu, H.; Averback, R.S. Sintering of Nanoparticle Powders: Simulations and Experiments. Mater. Manuf. Process. 1996, 11, 905–923. [Google Scholar] [CrossRef]
- Iijima, S.; Ajayan, P.M. Substrate and size effects on the coalescence of small particles. J. Appl. Phys. 1991, 70, 5138–5140. [Google Scholar] [CrossRef]
- Zeng, P.; Zajac, S.; Clapp, P.C.; Rifkin, J.A. Nanoparticle sintering simulations. Mater. Sci. Eng. A 1998, 252, 301–306. [Google Scholar] [CrossRef]
Disclaimer/Publisher’s Note: The statements, opinions and data contained in all publications are solely those of the individual author(s) and contributor(s) and not of MDPI and/or the editor(s). MDPI and/or the editor(s) disclaim responsibility for any injury to people or property resulting from any ideas, methods, instructions or products referred to in the content. |
© 2024 by the authors. Licensee MDPI, Basel, Switzerland. This article is an open access article distributed under the terms and conditions of the Creative Commons Attribution (CC BY) license (https://creativecommons.org/licenses/by/4.0/).