1. Introduction
Single-photon emitters are essential components in recent quantum technology developments. Single-photon sources are considered one of the possible means to secure information transport and quantum information processing. Among all existing realizations, solid-state-based systems play a leading role [
1,
2]. The most relevant types of these sources are as follows: heralded twin photons [
3,
4], semiconductor quantum dots [
5] and color centers in crystals [
6,
7,
8,
9,
10,
11,
12,
13,
14]. Er-doped crystals especially play an important role in quantum network research [
15,
16,
17,
18,
19].
The crystal structure of LiNbO
3 belonging to the trigonal (R3C) space group at room temperature is well known [
20]. The congruent (cLN) composition (where the solid and liquid composition is the same in the equilibrium melting/solidification process) corresponds to the Li/Nb ≈ 0.945 ratio, so it exhibits an Li-deficient structure. Crystals grown with this composition have a saturated oxygen octahedral sublattice and—because of the non-stoichiometric composition—some intrinsic defects: Nb on Li site and Li vacancies for charge-compensating. RE
3+ ions are easily incorporated into oxide crystals, as well as in cLN and fill the empty Li sites or they can substitute Li ions in the lattice [
21,
22].
The energy of the f-f electron transition depends slightly, while the lifetime of the radiation significantly, on the environmental matrix and the concentration of the RE ions. For the excitation of some RE ions (e.g., Tm
3+, Er
3+) via different energy transfer methods, double doping is a well-known method [
23]. The Yb
3+ ion is an ideal partner for this type of excitation, since its energy levels are in the appropriate region, its absorption cross-section is large, the f-f transition is slow (more than 100 µs) and the radiation lifetime is long. During these measurements, the luminescence of pure LN in the visible and infrared ranges must be taken into account [
24,
25].
For developing a well-defined and reliable method to produce particles with a diameter of about 10 nm containing the rare-earth dopant(s) in a predetermined concentration and in such a dilute form so that the optically active atoms are far enough from each other to behave as non-interacting optically active centers, mechanical grinding seems to be ideal. Pure and Pr
3+ doped LN monocrystalline powder has already been produced by high-energy ball milling in a mechanochemical way starting from oxides and followed by high-temperature treatment [
26,
27]. It is also a simple and relatively fast method for producing nanomaterials from macro range (top-down method) with high yield without introducing pollutants into the system, and by using distilled water as medium (wet milling process), the aggregation of the nanocrystals can be avoided. Based on the previous experimental experience of our laboratory [
28], it was possible to produce LN nanocrystals with a particle size of around 10 nm in a planetary mill by a wet grinding method, gradually reducing the diameter of the grinding balls after a certain grinding cycle.
What still needs to be paid attention to is the structural change due to the mechanical effect, since the knowledge of the crystal structure and the surroundings of the rare-earth ion is essential for further applications. There are several publications about the destruction of the defect-free crystal structure as a result of the mechanical force of grinding. This effect has been extensively investigated, especially in the case of substances used for medical purposes and food chemistry [
29,
30,
31,
32]. Spelak et al. [
33] discussed the structural transformations in some oxides (e.g., those of transition metals, aluminum and rare-earth elements) during a high-energy ball milling process and showed the appearance of an amorphous phase next to the crystalline one. It is also known that during the grinding of the pure LN crystal, Li
2O leaves the crystal lattice [
34], which causes the aqueous grinding medium to become alkaline (pH = 12–14) due to the LiOH formation. Since the predominant incorporation site of the RE
3+ ions is the Li position in the LN crystals, a logically arising question is whether the RE
3+ ions are equally mobile and whether they are either retained or ejected similarly to Li
+ ions upon grinding.
In the present work, we investigated the structural change of the RE-doped LN crystal due to high-energy ball milling, focusing on the RE loss by following the f-f transitions of the RE ions in the infrared absorption spectrum as a function of grinding time.
2. Materials and Methods
Yb- and Er-doped congruent LiNbO
3 samples were prepared from the homogeneous mixture of Li
2CO
3 (Sygma-Aldrich 99.99%, St. Louis, MO, USA), Nb
2O
5 (Starck LN Grade) and Yb
2O
3 or Er
2O
3 (Metall Rare Earth Ltd. 99.99%, Shenzhen, China) by solid-state reaction in two steps. In the first step, the starting materials were treated at 800 °C for 3 h in order to eliminate the CO
2, and then they were melted at 1250 °C where the RE-doped LN phases were formed [
35]. The Li/Nb molar ratio was 0.945 in the samples with the RE content of about 6 mol% Er
3+ and 1 mol% Yb
3.
The samples were ground by a Fritsch Pulverisette 7 Premium line planetary mill in a zirconia vial with 70 g zirconia balls with diameter of 3 mm. The system was equipped with an EASY GTM Gas Pressure and Temperature Measuring System in order to avoid damage caused by overheating or excessive pressure. The set limit was 70 °C for all milling. With our method (grinding for 1 min, waiting for 10 min), neither the pressure nor the temperature exceeded the set value even during 100 cycles of grinding. The rotation rate was 1100 rpm, while the load was 6 g RE-LiNbO
3 and 10 mL distilled water in each case. The milling time varied between 10 and 100 min. Then, 1 mL portions of the suspension were taken out from the samples for characterization. The mass of the missing material was replaced with distilled water in order to keep the charge/milling balls’ mass ratio constant. A new sample was loaded after every second sampling in order to avoid the error due to dilution.
Table 1 shows the sampling parameters.
Considering the inhomogeneity of the RE3+ content of the starting material, a method was developed—related to the concentration of RE3+ ions—to normalize the concentrations in each series.
The as-received suspensions were diluted to 500 times by distilled water and then dynamic light scattering (DLS) measurements were performed using a Malvern Zetasizer Nano S instrument working in the 0.1–10,000 nm diameter range and using a 633 nm laser wavelength for determining the size distribution of the nanoparticles based on their Brownian motion. A TESCAN MIRA3 type scanning electron microscope (SEM) was used also for imaging the particles. The powder was fixed onto a Si wafer by applying a polymer solution (polyethylene glycol) for enhancing the adhesion of the particles on the smooth surface. Optimum imaging voltage was 12 kV.
The energy of the electronic transitions of the RE3+ ions in LN depends on its surroundings. Measuring the frequency and the shape of the corresponding absorption bands, we can infer the changes of the surrounding crystal structure. For this end, the as-received suspensions were dried; then, 10 mg portions of nanocrystal were mixed with 300 mg KBr, and pellets 1 cm in diameter and about 1.5 mm thick were pressed by a Specac manual hydraulic pellet press for the optical measurements. The absorption spectra of the RE ions were recorded by a BRUKER IFS 66/v spectrophotometer in the 8000–14,000 cm−1 wavenumber range. To follow the small intensity or half-width changes in the absorption spectra caused by the alteration of the RE environment, low-temperature measurements at 9 K were performed with a spectral resolution of about 0.3 cm−1 using a closed-cycle helium cryostat.
X-ray powder diffraction analyses were performed on the dried as-received suspensions at room temperature for the identification of the phases formed during the grinding process using transmission capillary (0.5 mm diameter) geometry with the Ag Kα1,2 source of a BRUKER D8 Advance diffractometer.
After drying the as-received suspensions, the RE-doped LN samples were treated with 15% HNO3; then, the particles were repeatedly centrifuged and washed by decantation with ultrapure water for getting rid of the soluble compounds (Li2O and the possible Yb2O3 or Er2O3) that left the LN crystals during the milling process. The particles thus obtained were dried, and their RE/Nb ratio was determined with energy-dispersive X-ray spectrometry (EDS) in a TESCAN MIRA3 scanning electron microscope performed at 20 or 30 kV. The application of the 30 kV acceleration voltage was rationalized with the possibility of using the non-overlapping K lines of Nb and Zr, the latter being the impurity due to the slow destruction of the vial/balls in the alkaline medium.
For eliminating the alkaline solvent residue, a sedimentation process was applied using a DLAB D2012 High Speed Mini Centrifuge (decantation).
3. Results
3.1. Size and Phase Analysis
DLS measurements were performed on the as-received suspension of polycrystalline samples of Er- and Yb-doped LiNbO
3, prepared by the method described in the previous chapter, in order to follow the change in the diameter and the size distributions of the particles during the grinding process.
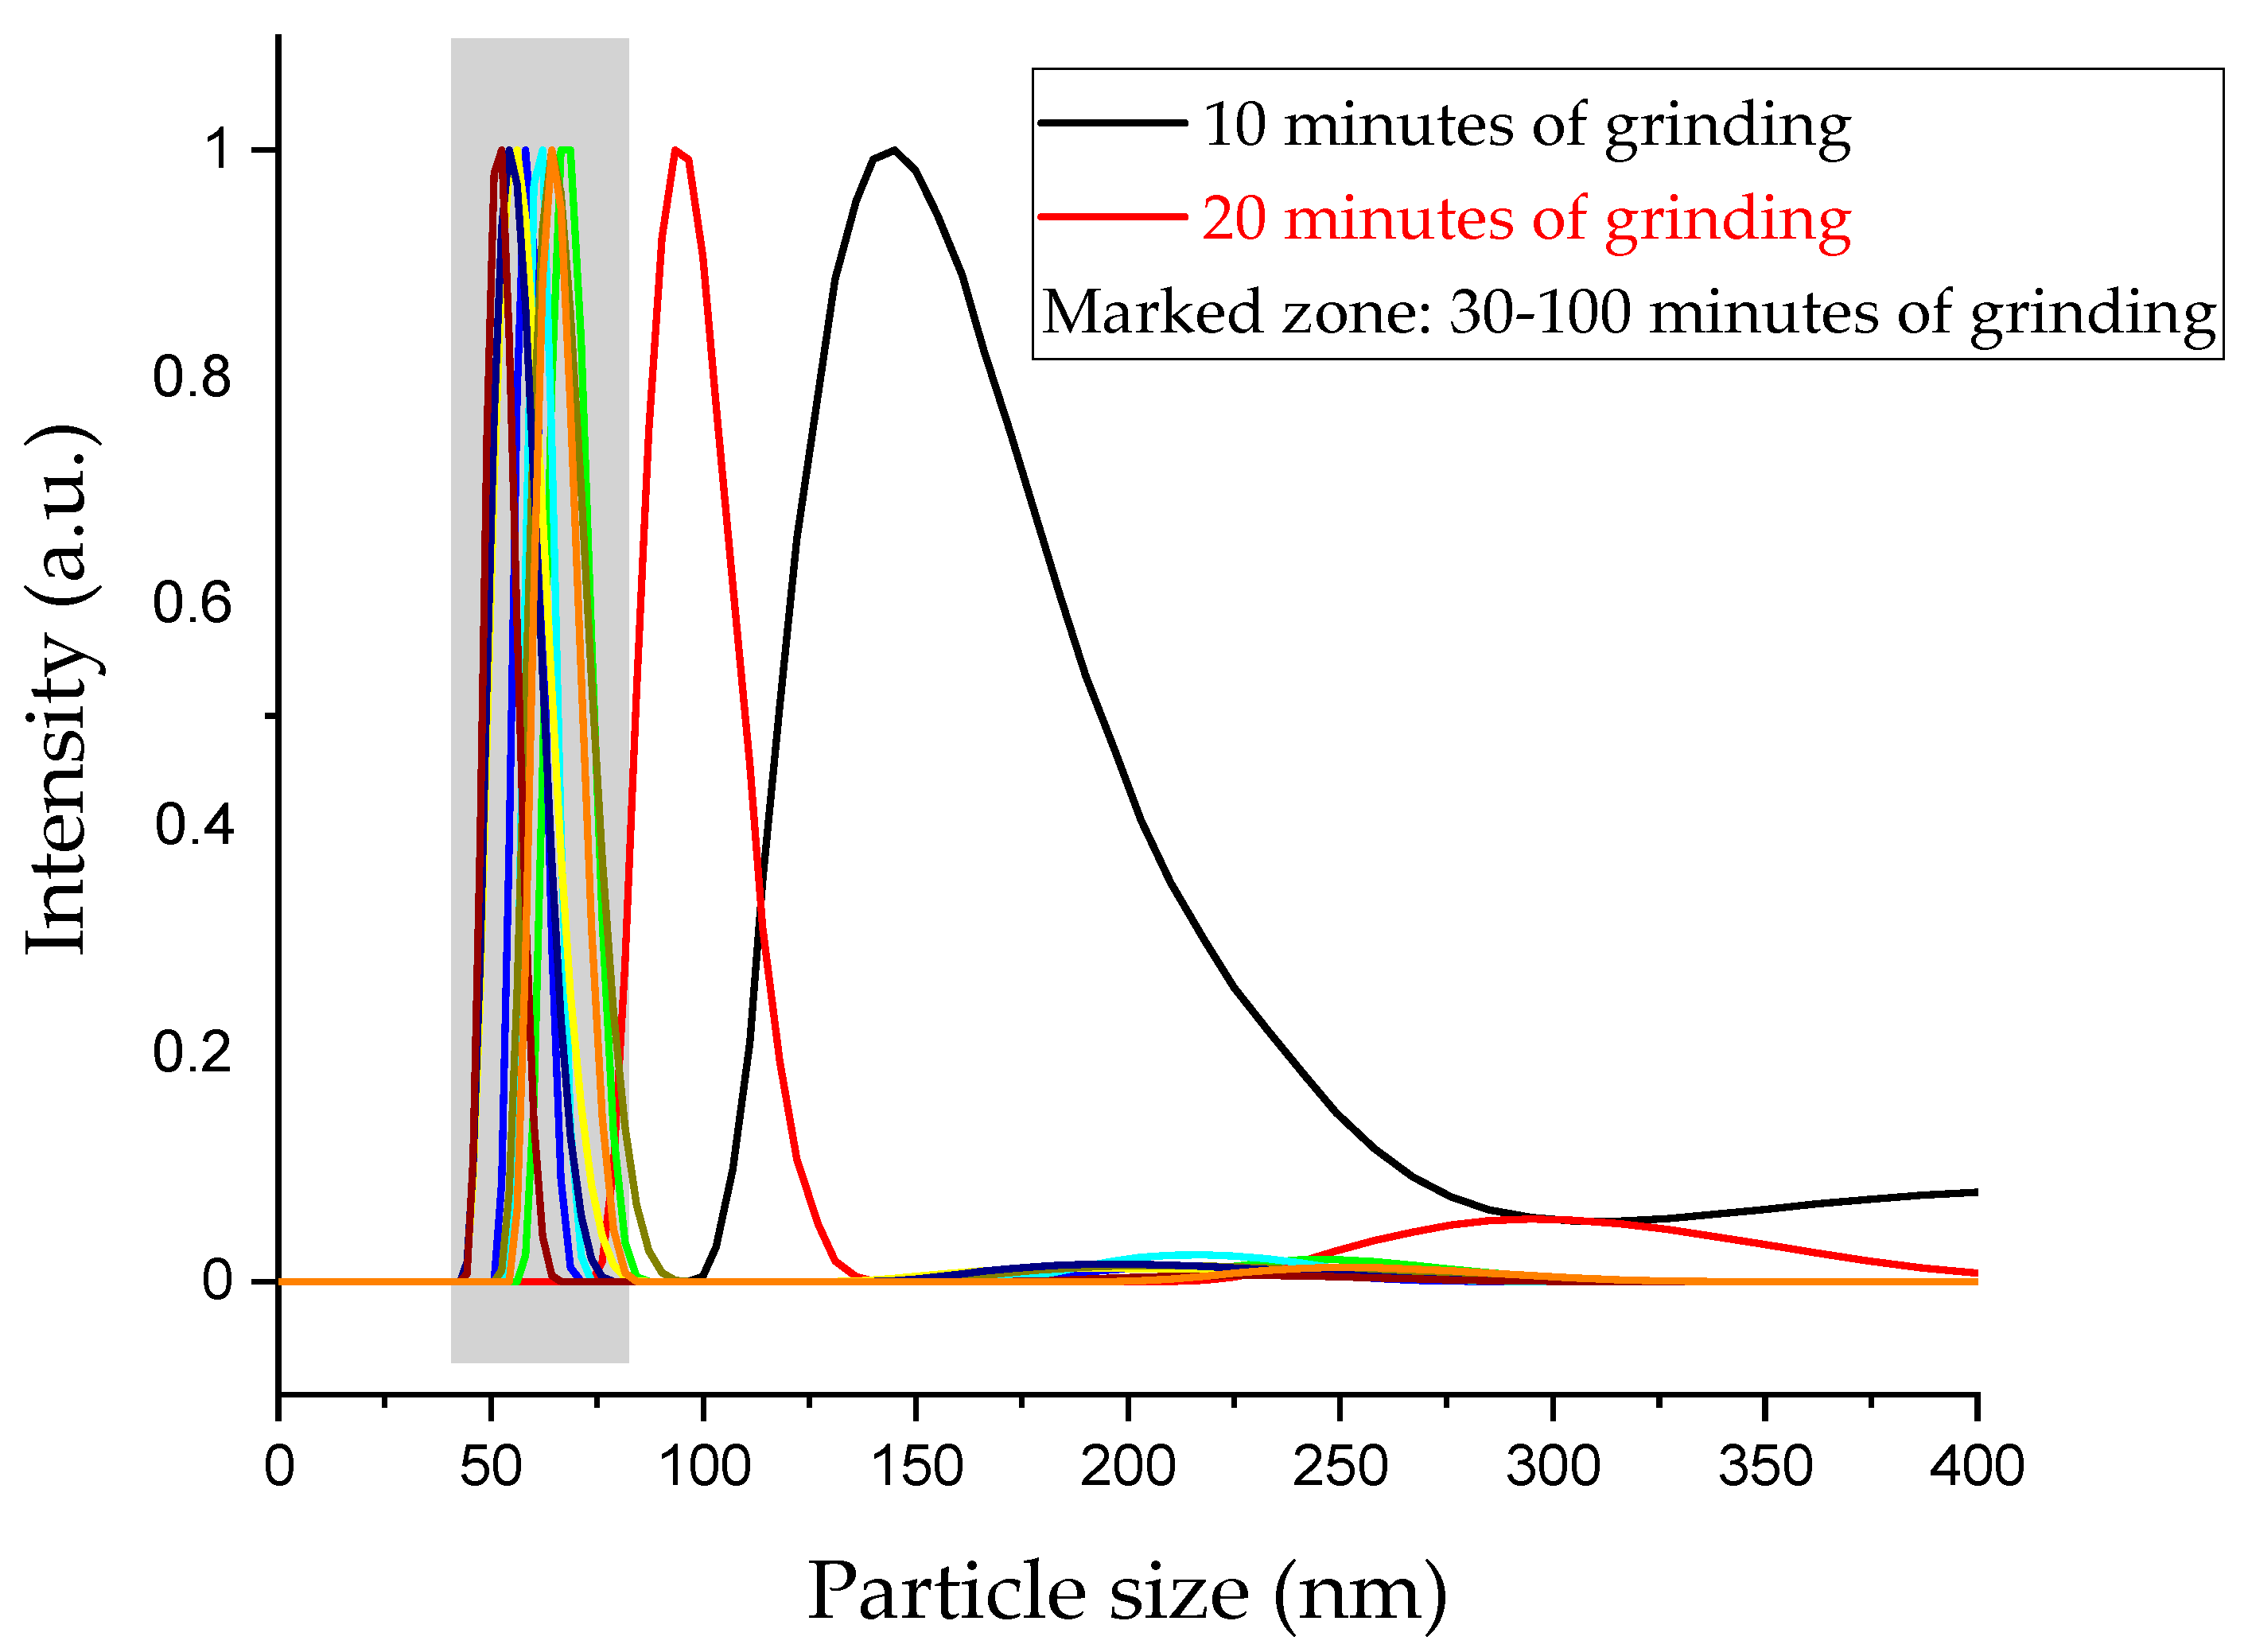
Figure 1 shows the change in the Yb-LN particle size distribution with the grinding time. It is clearly seen that after 30 min grinding time, the distribution curves show almost the same shapes, slopes and peak maxima at around 50–70 nm, so the size distribution of the particles did not change after the third sample (marked zone in
Figure 1). We can conclude that this is the final size we can obtain with these milling conditions; therefore, after 30 min of grinding, solely the mechanical effect can be investigated without further size reduction.
Size distributions of Er-doped LN samples show the same tendencies, so only the DLS curves of the Yb-doped LN samples are shown in
Figure 1 for the sake of simplicity.
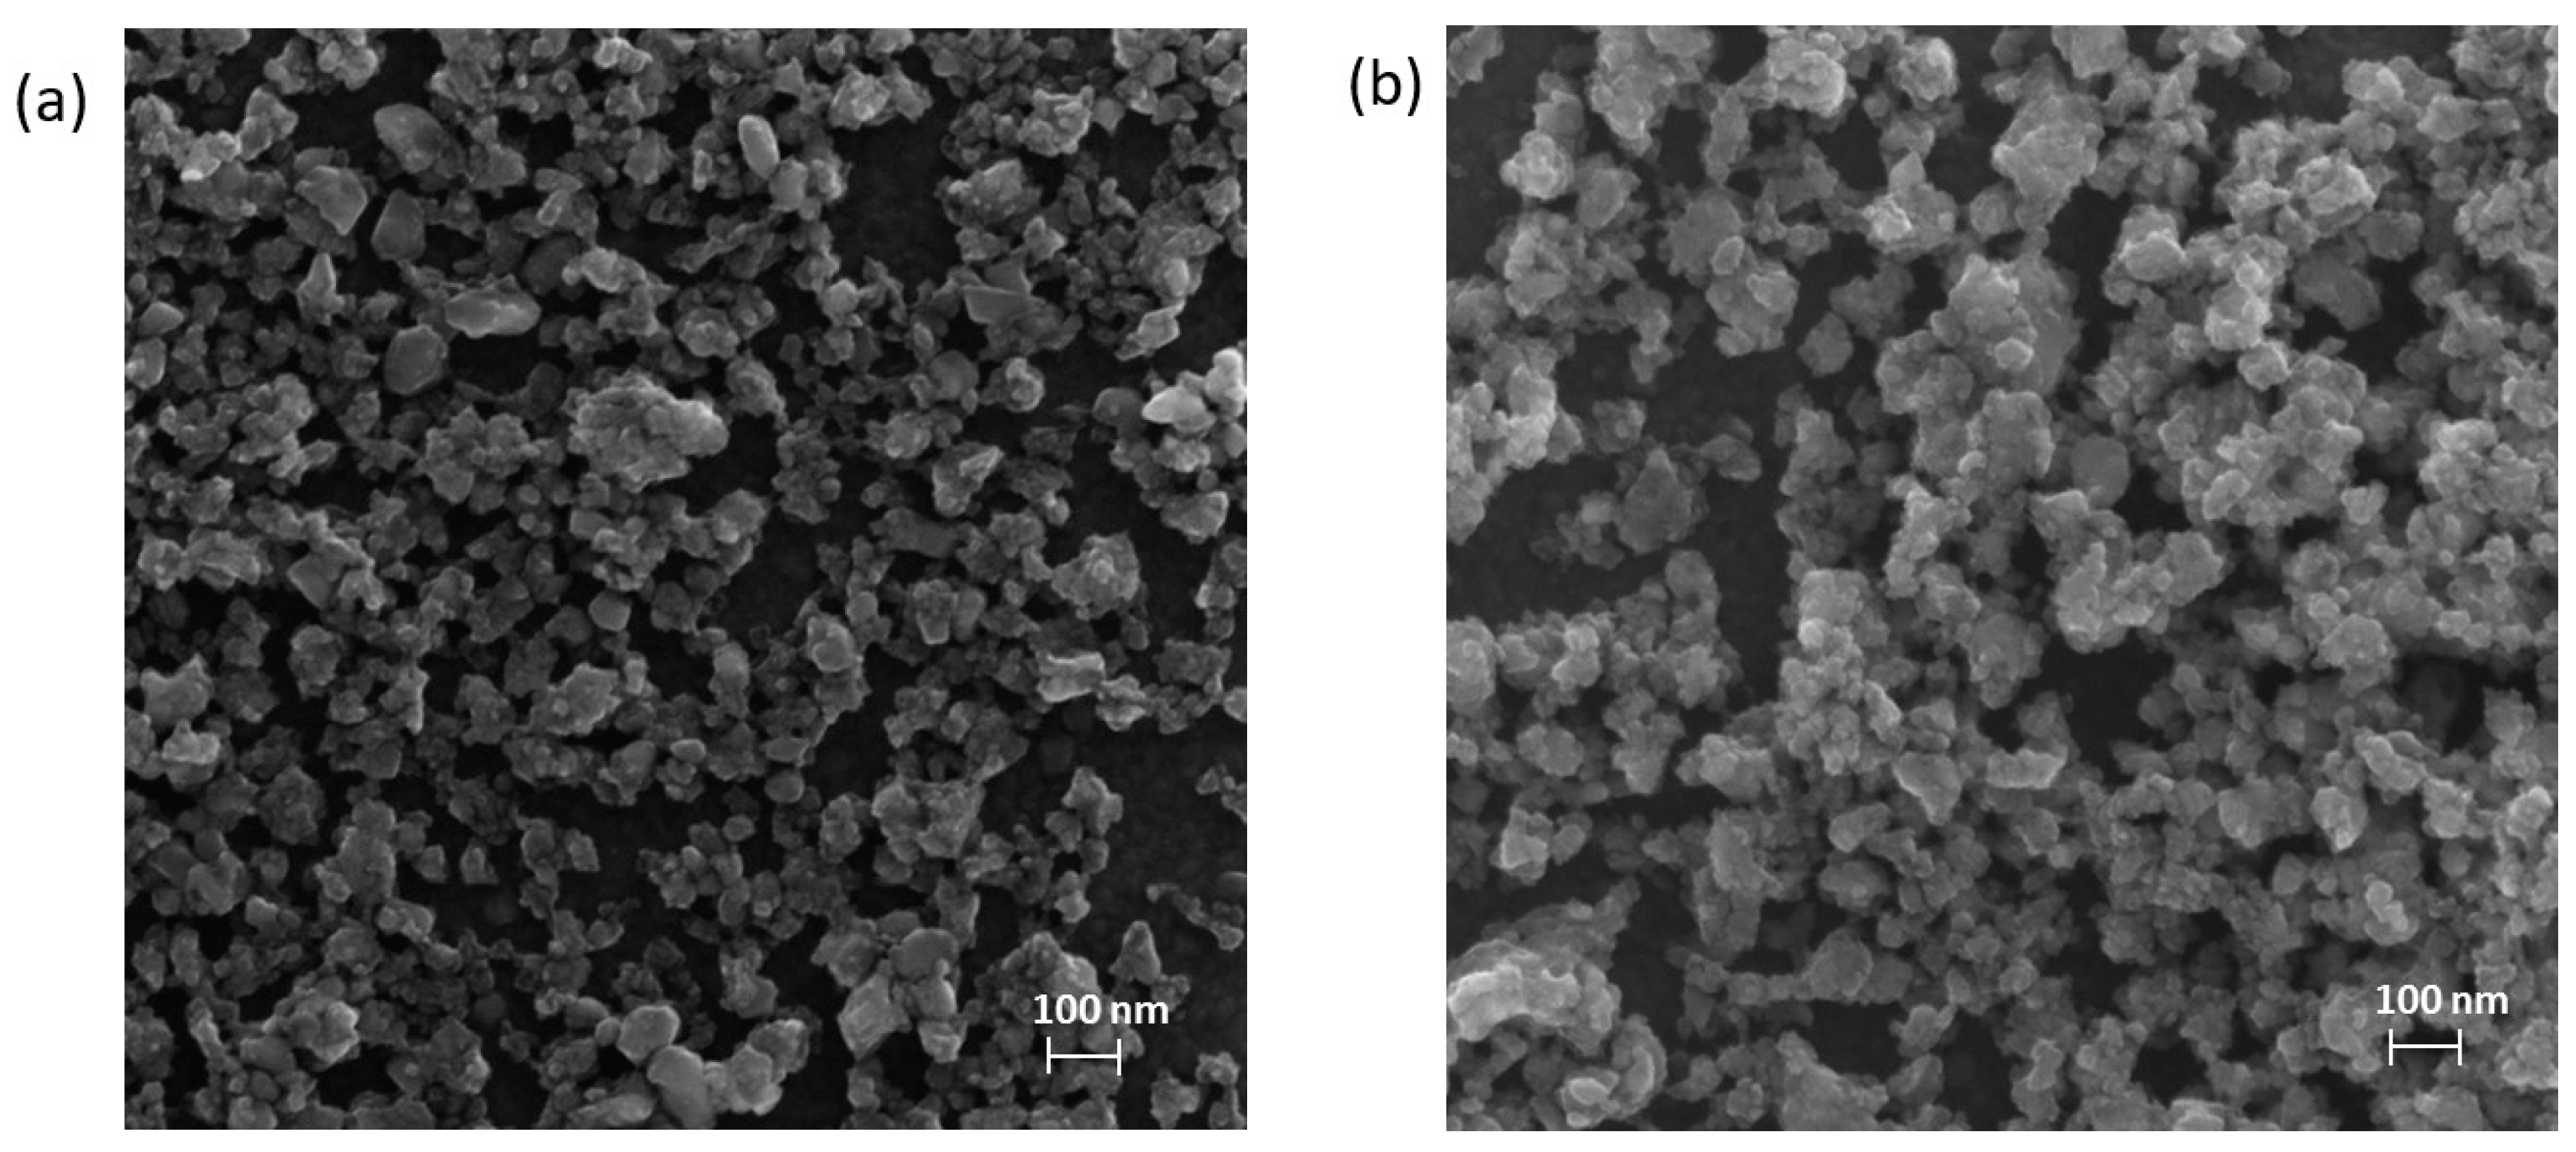
SEM experiments carried out on the same samples showed good correlation with the DLS results (
Figure 2). The particle sizes after 30 and 100 min grinding time were found to be the same, only the homogeneity of the sample was improved. The surface of the particles seems to be blurred because of the increased mechanical stress.
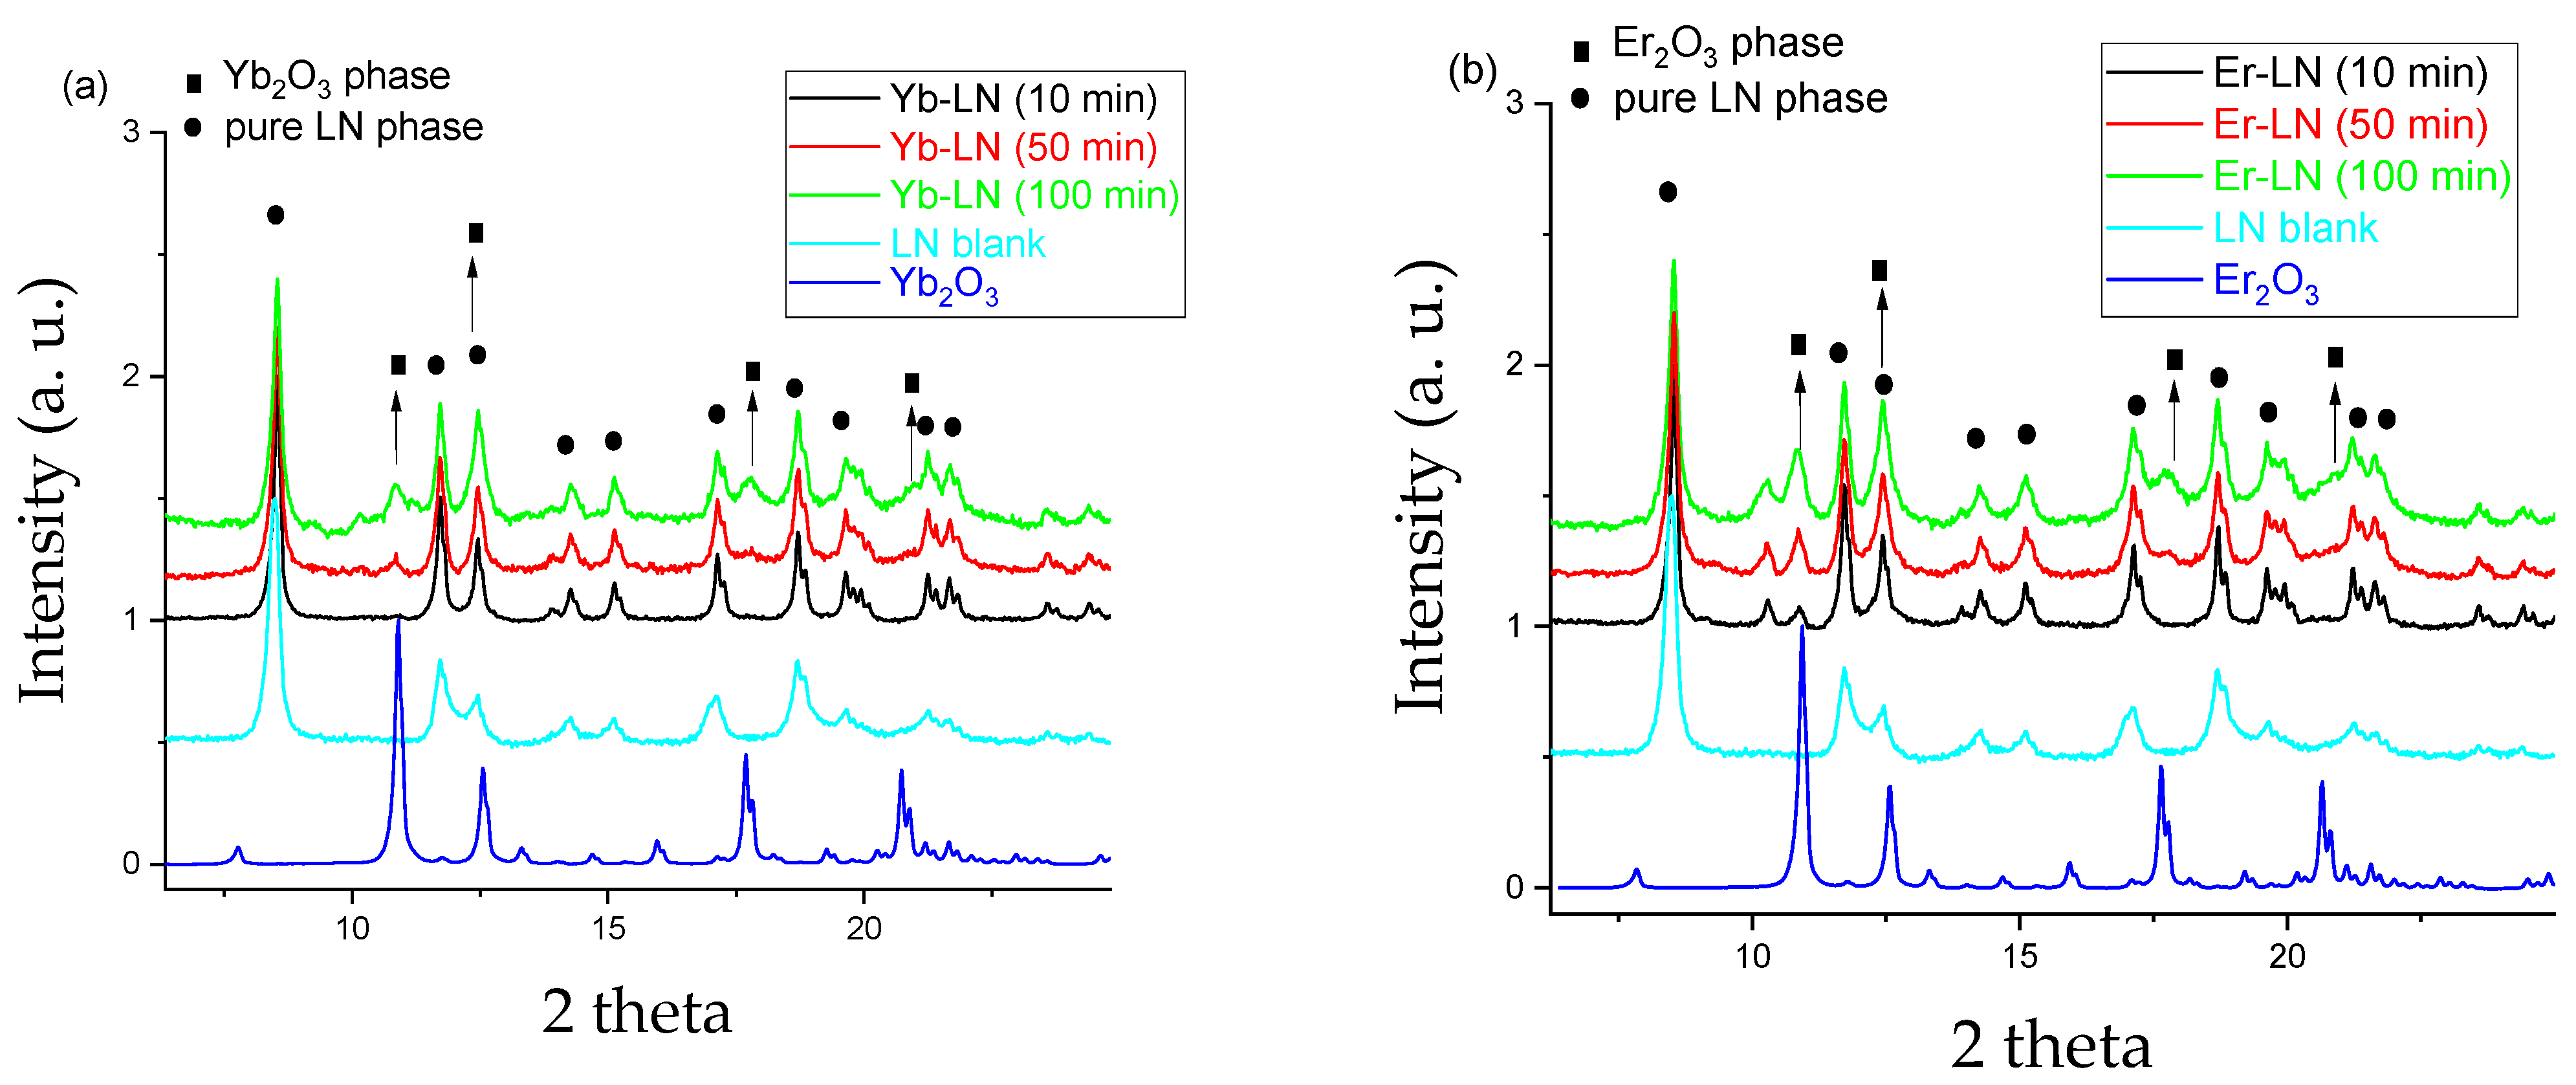
Phases appearing during the grinding process of the RE-LN samples were investigated in the as-received and dried suspension samples by X-ray powder diffraction method.
Figure 3 shows the diffractograms of the RE-LN 01, RE-LN 05 and RE-LN 10 samples (ground for 10, 50 and 100 min). Only these three mixtures are shown in the figure, because the tendency of the appearance of the new phase can be clearly seen. No other phase was found for the other samples. Undoped LN and RE
2O
3 powders were used as references to facilitate the identification.
Figure 4 shows that in the RE-LN samples ground for 10 min, mainly the LN phase is present. During further mechanical treatment, a new phase appeared gradually with the increasing grinding time, with identical peaks with the RE
2O
3 references, so they were identified as RE
2O
3. (Although LiNb
3O
8 was also formed during other grindings [
34], in our case it did not appear on the diffractograms).
The X-ray scattering form factors are scaled with the number of electrons of atoms/ions. The number of electrons of Er, Yb and Nb (the heaviest elements of LN) atoms are 68, 70 and 41, respectively. Thus, the difference between the atomic form factors of Er and Yb is very small in comparison with Er/Yb and Nb. This is the explanation for their nearly identical behavior in the LN lattice resulting in very similar X-ray diffractograms.
3.2. Absorption Properties
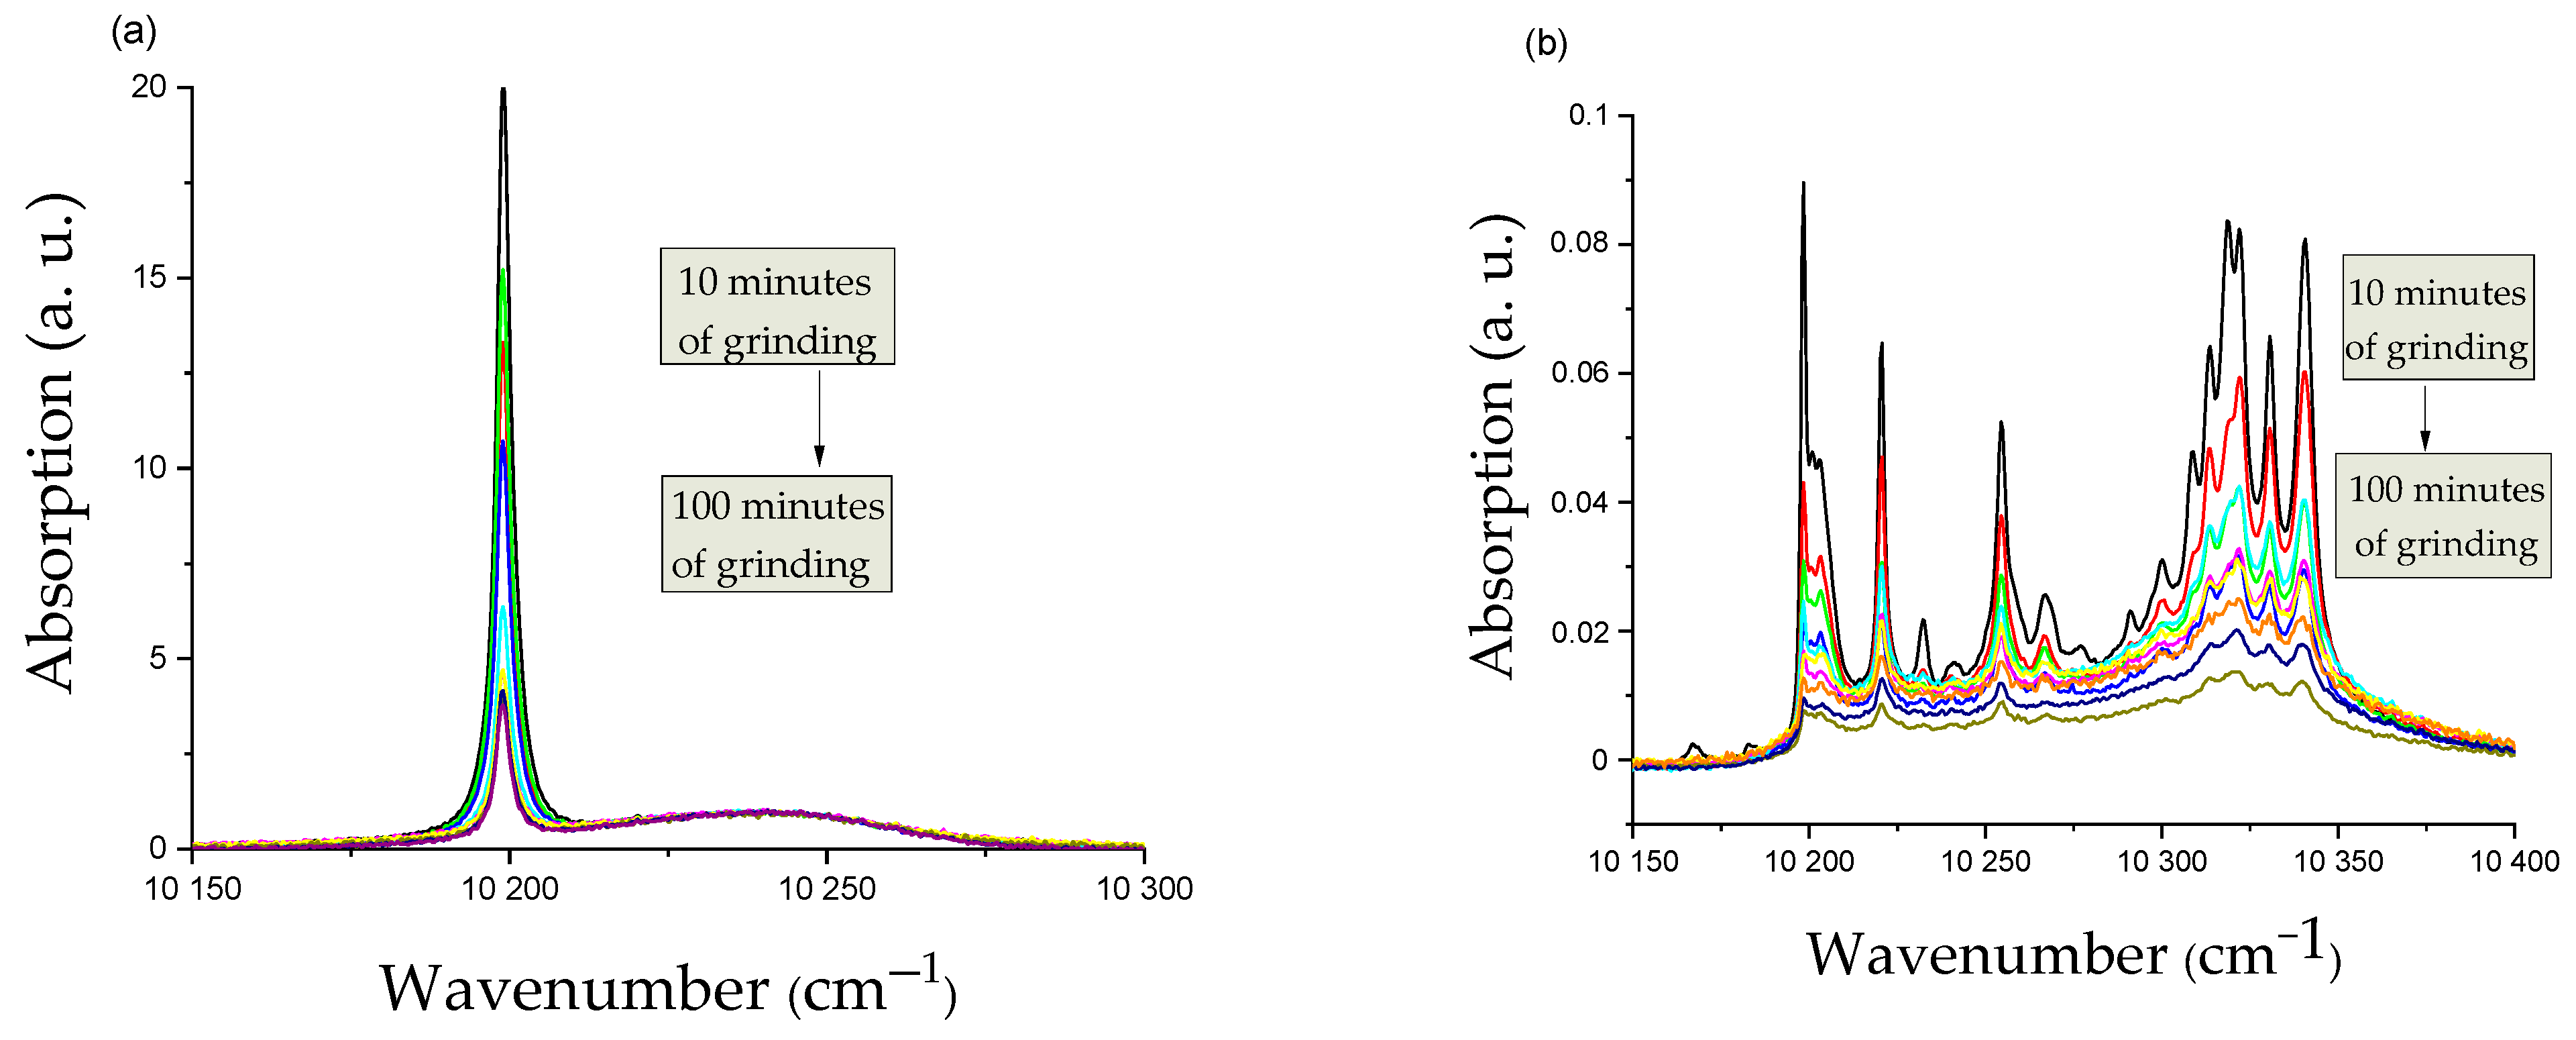
The absorption properties of incorporated RE ions are influenced by the defect structure in their immediate vicinity. From investigating the change in the RE absorption bands in the LN, we can infer a change in lattice structure. For this end, absorption spectra corresponding to the
2F
7/2 ⟶
2F
5/2 of the Yb
3+ ion [
36] and the
4I
15/2 ⟶
4I
11/2 transition of the Er
3+ ion [
37] were recorded at 9 K for each sample (
Figure 4). Two peaks appeared in all spectra of Yb-LN samples, one for the
2F
7/2 ⟶
2F
5/2 transition of the Yb
3+ ion, surrounded by undamaged LN crystal structure at 10,200 cm
−1, and another broad band right next to it at about 10,240 cm
−1. After increasing the number of the grinding cycles, the intensity of the absorption band of Yb
3+ near 10,200 cm
−1 (belonging to the crystalline LN phase) decreased. The broad absorption band with a center at about 10,240 cm
−1 could be explained by an unstructured environment of the RE ion (i.e., without a crystal-like regular order around the RE ion). The relative intensity of the main absorption band decreased also as compared to the broad band. In the absorption spectra of the Er
3+ ion, corresponding to the
4I
15/2 ⟶
4I
11/2 transition, several bands can be found between 10,200 cm
−1 and 10,400 cm
−1 due to the crystal field splitting. The intensity of all absorption bands decreased, and the fine structure of the spectrum disappeared as a consequence of band broadening of all peaks.
The integrated area under the absorption peaks is directly proportional to the number of the absorbing ions. So, the variation in the amount of ions in the same environment can be monitored with this parameter. For the determination of the Yb content of the samples, the area under the peak corresponding to the crystalline phase at 10,200 cm
−1 was used after baseline correction from 10,170 cm
−1 to 10,210 cm
−1, while for Er, the whole baseline-corrected spectra were integrated from 10,200 cm
−1 to 10,400 cm
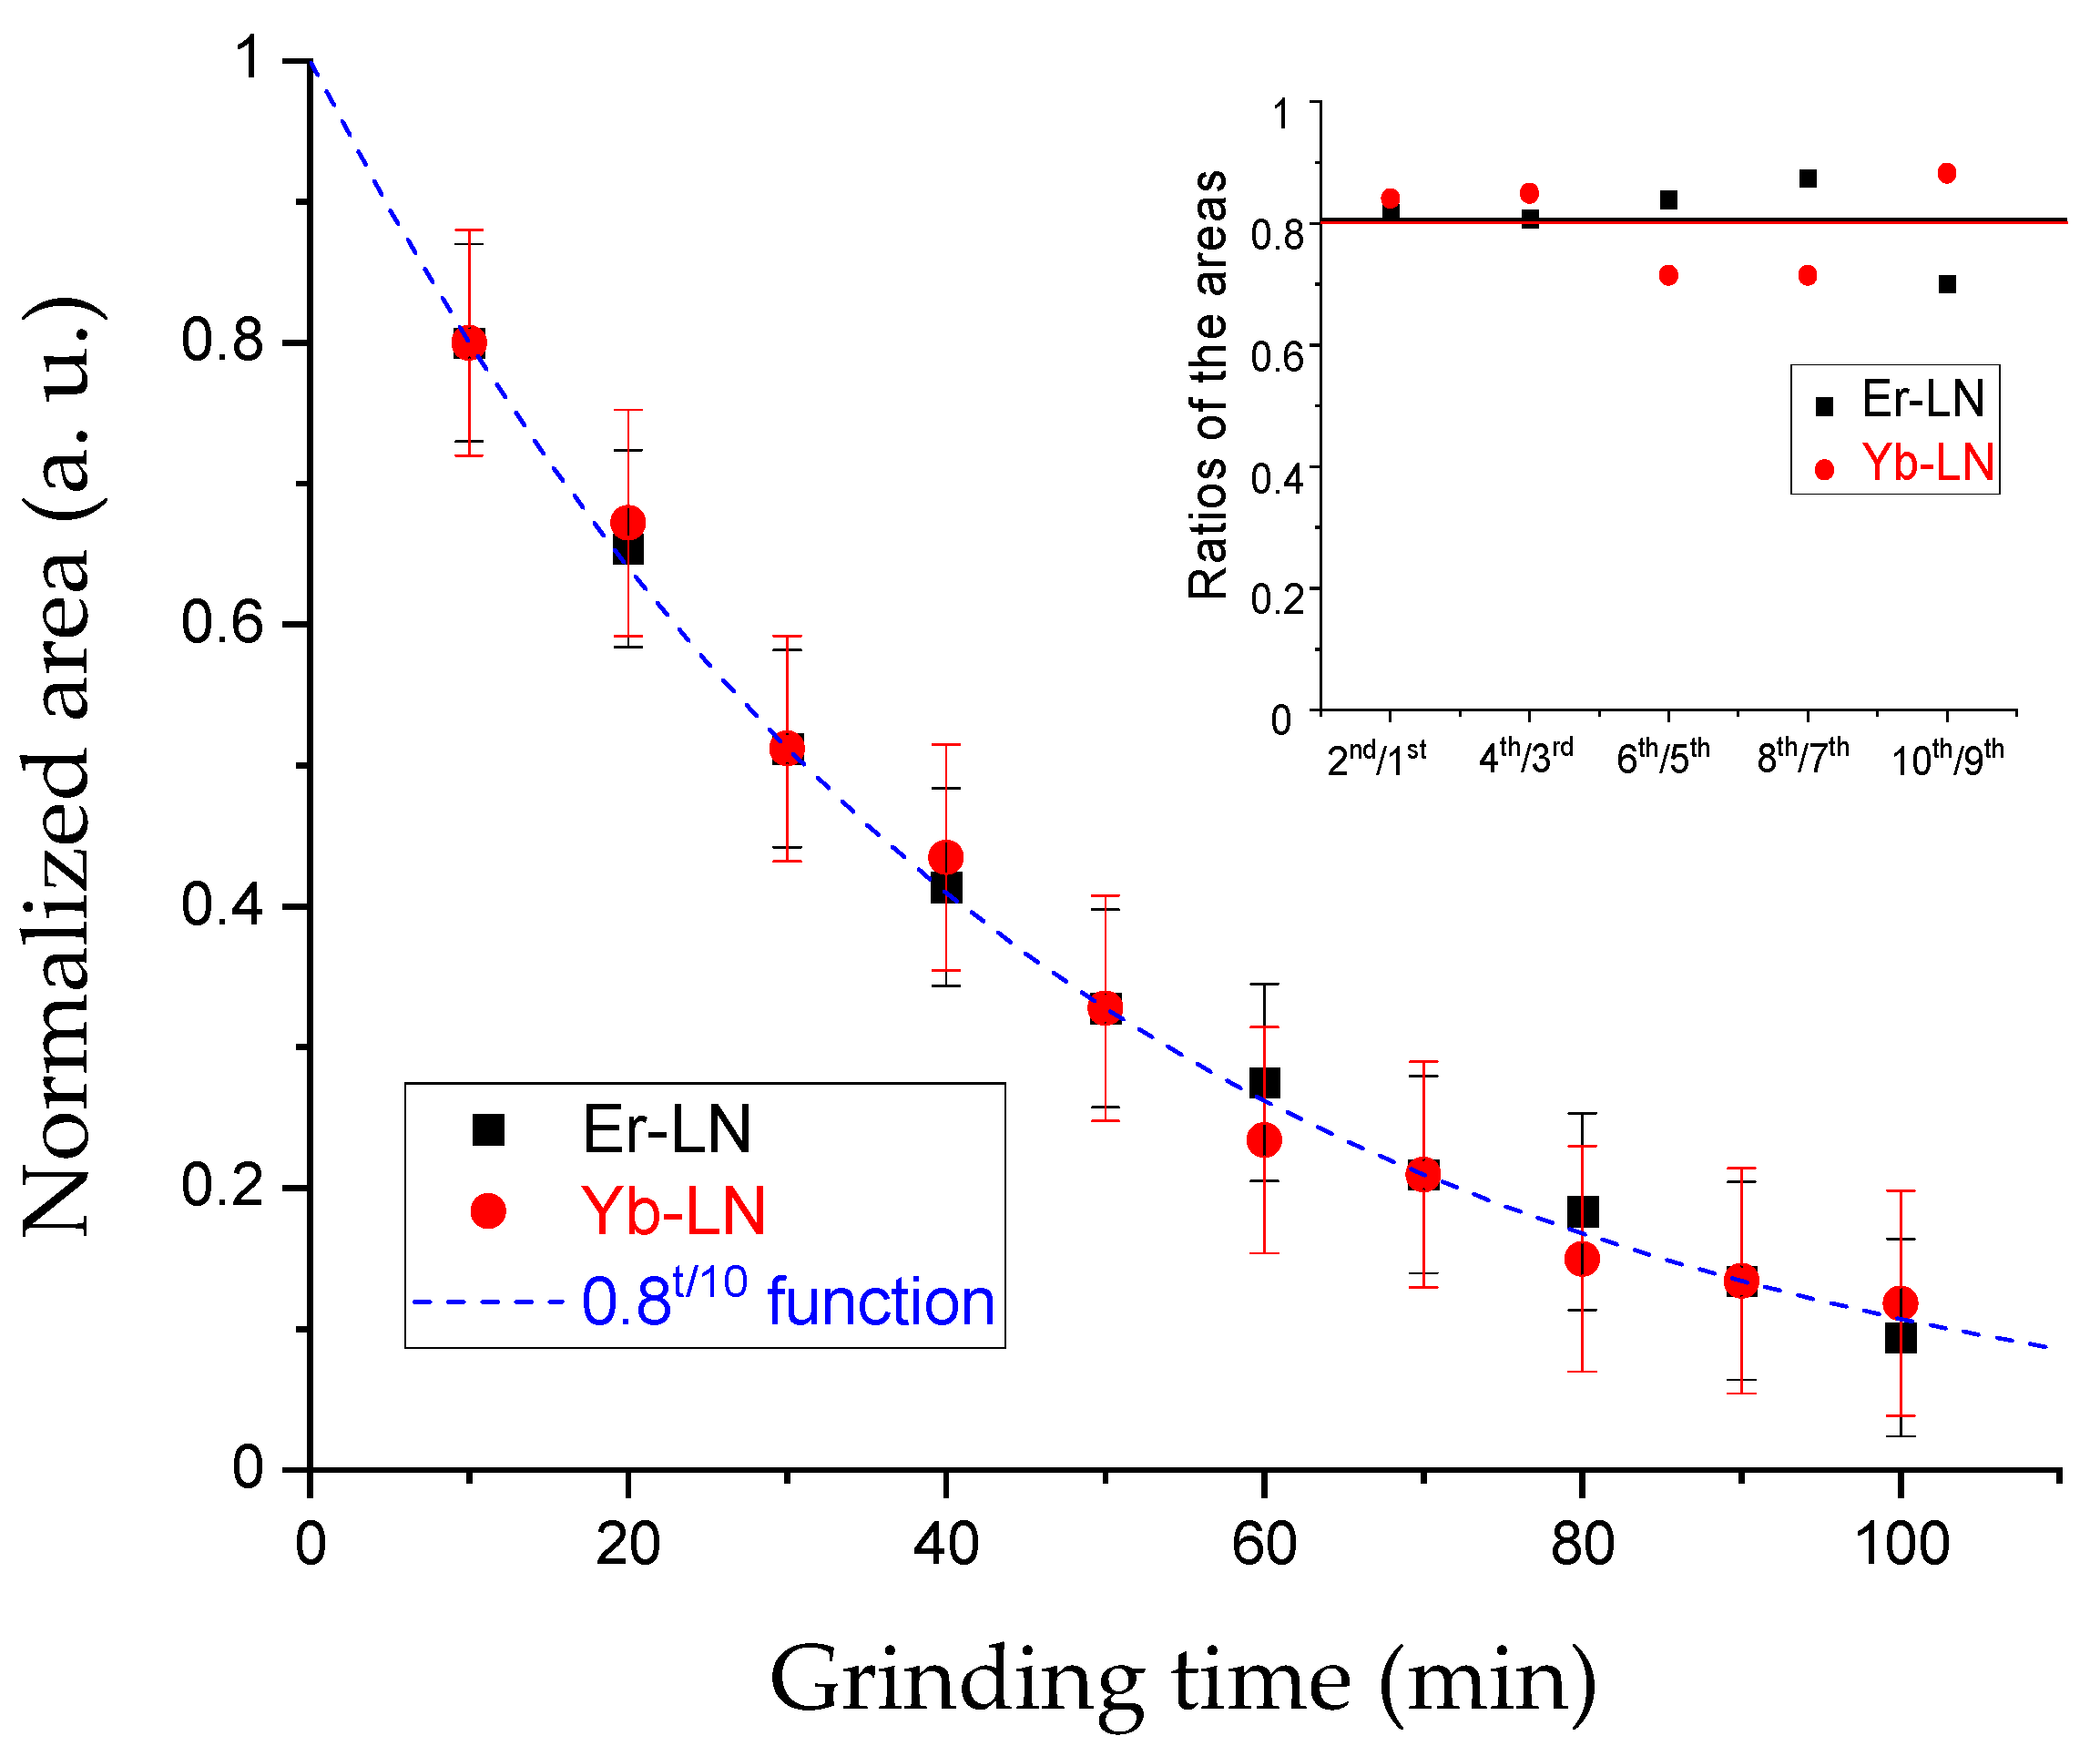
−1. The results can only be compared correctly in pairs of the same loads due to the sample preparation procedure. The deviation in the results caused by the inhomogeneity of the starting material for RE ions can thus be eliminated. In every pair of the samples obtained for the same load in the mill, the ratios of the second and the first area were found to be 0.80 ± 0.08 for Yb-LN and 0.81 ± 0.07 for Er-LN (
Figure 5, inset graph). The inaccuracy may come from the inhomogeneity of the RE-LN distribution in the KBr pellets. In order to generalize the results, an extrapolation was made for every pair of samples to estimate the starting RE content. Then, the areas were normalized with the starting values to get the change in the RE content during the grinding process (
Figure 5).
An obvious Yb3+ and Er3+ ion loss can be described with a 0.8t/10 min exponential function in both cases (t is the grinding time in minutes). The RE ion content of the RE-LN crystal structure is decreasing with the increase the grinding time. In this case, we can say that this effect is caused solely by the mechanical force of the milling process, not the size reduction (surface growth), since the size distributions of the particles are in the same range starting with the third mixture, so the surface area is constant from the 30th minute of grinding.
3.3. Removal of RE2O3 by Acid Treatment
RE
2O
3 can be removed from the LN sample by acid treatment (detailed above). The RE/Nb ratios of the as-received and dried suspension samples and of the treated samples were determined by EDS measurements (
Table 2). The atomic ratios were determined as an average of 5–6 measurements taken at different points of the sample. The RSD of the measurement can be estimated as 3–5%.
The Yb/Nb ratio in the samples was around 0.01 and the change in the Yb/Nb atomic ratio was within the RSD% of the measurement, so the Yb loss cannot be followed by this method.
For Er-LN, we can conclude that the RE2O3 content of the samples was about 80%. This result cannot be compared with the results from the untreated samples, only further evidence that RE3+ ions leave the crystal lattice.
4. Discussion
Similarly to the already published Li loss of the LN crystal during a high-energy ball milling process, the RE ions in Li sites are also leaving the lattice. Since the particle size distribution did not change after 30 min of grinding, the samples milled for 30–100 min can be compared well with each other and any change is caused solely by the mechanical force. Since the RE3+ ion loss occurs on the surface of the particles, we can say that during the grinding process, the RE3+ ions migrate from the inner part of the 40–60 nm particles towards the surface (despite the fact that the size of the RE3+ ion is much larger than that of Li+). The behaviors of Yb3+ and Er3+ ions were found to be very comparable, as expected from their very similar chemical properties, size and position in the crystal lattice.
Both the Yb3+ and Er3+ loss of the LN matrix during the grinding process with the given parameters (1100 rpm, 10 min, 3 mm ball diameter) were consistent and can be described by a 0.8t/10 min function where t is the grinding time in minutes. The curves of the different RE ions overlapped each other independently from their quantity in the samples. After 100 min of wet grinding at 1100 rpm for the RE-LN samples, roughly 90% of the RE content left the crystalline structure in RE2O3 form.
The EDS study also confirmed that for each sample pair obtained from the same load of the mill, the RE content of the particles decreased. The particle residue after the acidic washing process removed the RE-oxide (or hydroxide) that was leached out from the LN crystals upon the milling process; hence, the EDS measurement after the removal of the soluble components was informative about the residual RE content of the crystals only. Although the precision of the EDS measurements is not comparable to the optical measurements, the RE loss ratio could be estimated to be the same as estimated from the optical absorption measurements.
5. Conclusions
In this paper, the RE ion loss of the doped LiNbO3 matrix due to the mechanical force of the grinding process was investigated. X-ray measurements showed that part of the LN crystal structure was destroyed, while a huge amount of RE ions left the LN lattice by out-diffusion and formed RE2O3 phase. In addition, it was concluded from infrared absorption measurements that the ratio of the RE loss in our grinding procedure can be described by a 0.8t/10 min function (e.g., after 100 min the loss is 90%). It is important to notice that the latter result could depend on the technical parameters of the grinding process (e.g., the size of the milling balls, rotational speed).
This result is independent of the dopant concentration in the applied concentration range, the chemical quality of the RE ion and the size reduction (e.g., the samples ground for 10 and 20 min—where the average particle sizes are over 100 nm—fit exactly into the measurement trends and results obtained for particles with 40–60 nm average size).
Author Contributions
Conceptualization, G.D., K.L. and L.P.; methodology, G.D., K.L., L.K., L.T., L.P. and D.G.; software, G.D., K.L. and L.T.; validation, G.D., K.L. and L.P.; formal analysis, G.D., K.L. and L.P.; investigation, G.D., K.L., L.K., D.G., L.T. and L.P.; resources, G.D., K.L. and L.P.; data curation, G.D., K.L. and D.G.; writing—original draft preparation, G.D.; writing—review and editing, K.L. and L.P.; visualization, G.D.; supervision, K.L. and L.P.; project administration, G.D.; funding acquisition, G.D., K.L. and L.P. All authors have read and agreed to the published version of the manuscript.
Funding
This research was supported by the National Research, Development and Innovation Fund of Hungary (OTKA 134921) and by the Ministry of Culture and Innovation and the National Research, Development and Innovation Office within the Quantum Information National Laboratory of Hungary (Grant No. 2022-2.1.1-NL-2022-00004).
Data Availability Statement
The original contributions presented in the study are included in the article, further inquiries can be directed to the corresponding author.
Acknowledgments
László Kovács (Wigner Research Centre for Physics, Hungary) is acknowledged for the professional consultation and the proofreading of the manuscript.
Conflicts of Interest
The authors declare no conflicts of interest.
References
- Eisman, M.D.; Fan, J.; Migdall, A.; Polyakov, S.V. Invited Review: Single-photon sources and detectors. Rev. Sci. Instrum. 2011, 82, 071101. [Google Scholar] [CrossRef]
- Aharonovich, I.; Englund, D.; Toth, M. Solid-state single-photon emitters. Nat. Photonics 2016, 10, 631–641. [Google Scholar] [CrossRef]
- Zhong, T.; Hu, X.; Wong, F.N.C.; Berggren, K.K.; Roberts, T.D.; Battle, P. High-quality fiber-optic polarization entanglement distribution at 1.3 µm telecom wavelength. Opt. Lett. 2010, 35, 1392–1394. [Google Scholar] [CrossRef]
- Takeuchi, S. Recent progress in single-photon and entangled-photon generation and applications. Jpn. J. Appl. Phys. 2014, 53, 030101. [Google Scholar] [CrossRef]
- Senellart, P.; Solomon, G.; White, A. High-performance semiconductor quantum-dot single-photon sources. Nat. Nanotechnol. 2017, 12, 1026–1039. [Google Scholar] [CrossRef] [PubMed]
- Aharonovich, I.; Castelletto, S.; Johnson, B.C.; McCallum, J.C.; Simpson, D.A.; Greentree, A.D.; Prawer, S. Chromium single-photon emitters in diamond fabricated by ion implantation. Phys. Rev. B 2010, 81, 121201. [Google Scholar] [CrossRef]
- Rodiek, B.; Lopez, M.; Hofer, H.; Porrovechio, G.; Smid, M.; Chu, X.-L.; Gotzinger, S.; Sandoghdar, V.; Lindner, S.; Becher, C.; et al. Experimental realization of an absolute single-photon source based on a single nitrogen vacancy center in a nanodiamond. Optica 2017, 4, 71–76. [Google Scholar] [CrossRef]
- Babinec, T.M.; Hausmann, B.J.M.; Khan, M.; Zhang, Y.; Maze, J.R.; Hemmer, P.R.; Loncar, M. A diamond nanowire single-photon source. Nat. Nanotechnol. 2010, 5, 195–199. [Google Scholar] [CrossRef]
- Kolesov, R.; Xia, K.; Reuter, R.; Stöhr, R.; Zappe, A.; Meijer, J.; Hemmer, P.R.; Wrachtrup, J. Optical detection of a single rare-earth ion in a crystal. Nat. Commun. 2012, 3, 1029–1036. [Google Scholar] [CrossRef] [PubMed]
- Yin, C.; Rancic, M.; de Boo, G.G.; Stavrias, N.; McCallum, J.C.; Sellers, M.J.; Rogge, S. Optical addressing of an individual erbium ion in silicon. Nature 2013, 497, 91–94. [Google Scholar] [CrossRef]
- Utikal, T.; Eichhammer, E.; Petersen, L.; Renn, A.; Götzinger, S.; Sandoghdar, V. Spectroscopic detection and state preparation of a single praseodymium ion in a crystal. Nat. Commun. 2014, 5, 3627–3635. [Google Scholar] [CrossRef]
- Nakamura, I.; Yoshihiro, T.; Inagawa, H.; Fujiyoshi, S.; Matsushita, M. Spectroscopy of Pr3+ ion in LaF3 crystal at 1.5 K. Sci. Rep.-Nat. 2014, 4, 7364–7370. [Google Scholar] [CrossRef] [PubMed]
- Dibos, A.M.; Raha, M.; Phenicie, C.M.; Thompson, J.D. Atomic source of single photon in the telecom band. Phys. Rev. Lett. 2018, 120, 243601. [Google Scholar] [CrossRef] [PubMed]
- Zhong, T.; Kindem, J.M.; Bartholomew, J.G.; Rochman, J.; Craiciu, I.; Verma, V.; Nam, S.W.; Marsili, F.; Shaw, M.D.; Beyer, A.D.; et al. Optically addressing of single rare-earth ions in a nanophotonic cavity. Phys. Rev. Lett. 2018, 121, 183603. [Google Scholar] [CrossRef] [PubMed]
- Stevenson, P.; Phenicie, C.M.; Gray, I.; Horvath, S.P.; Welinski, S.; Ferrenti, A.M.; Ferrier, A.; Goldner, P.; Das, S.; Ramesh, R.; et al. Erbium-implanted materials for quantum communication applications. Phys. Rev. B 2022, 105, 224106. [Google Scholar] [CrossRef]
- Le Dantec, M.; Rancic, M.; Lin, S.; Billaud, E.; Ranjan, V.; Flanigan, D.; Bertaina, S.; Chanelière, T.; Goldner, P.; Erb, A.; et al. Twenty-three—Millisecond electron spin coherence of erbium ions in a natural-abundance crystal. Sci. Adv. 2021, 7, eabj9786. [Google Scholar] [CrossRef] [PubMed]
- Rancic, M.; Hedges, M.P.; Ahlefeldt, R.L.; Sellars, M.J. Coherence time of over a second in a telecom-compatible quantum memory storage material. Nat. Phys. 2018, 14, 50–54. [Google Scholar] [CrossRef]
- Raha, M.; Chen, S.; Phenicie, C.M.; Ourari, S.; Dibos, A.M.; Thompson, J.D. Optical quantum nondemolition measurement of a single rare earth ion qubit. Nat. Commun. 2020, 11, 1605–1611. [Google Scholar] [CrossRef] [PubMed]
- Chen, S.; Raha, M.; Phenicie, C.M.; Ourari, S.; Thompson, J.D. Parallel single-shot measurement and coherent control of solid-state spins below the diffraction limit. Science 2020, 370, 592–596. [Google Scholar] [CrossRef]
- Abrahams, S.C.; Reddy, J.M.; Bernstein, J.L. Ferroelectric lithium niobate 3. Single crystal X-ray diffraction study at 24 °C. J. Phys. Chem. Solids 1966, 27, 997–1012. [Google Scholar] [CrossRef]
- Lorenzo, A.; Jaffrezic, H.; Roux, B.; Boulon, G.; Solé, J.G. Lattice location of rare-earth ions in LiNbO3. Appl. Phys. Lett. 1995, 67, 3735–3737. [Google Scholar] [CrossRef]
- Solé, J.G. Non Equivalent Active Centres and Their Lattice Location in LiNbO3 Minilasers. Phys. Scr. 1994, T55, 30–36. [Google Scholar] [CrossRef]
- Arppe, R.; Hyppänen, I.; Perälä, N.; Peltomaa, R.; Kaiser, M.; Würth, C.; Christ, S.; Resch-Genger, U.; Schäferling, M.; Soukka, T. Quenching of the upconversion luminescence of NaYF4:Yb3+,Er3+ and NaYF4:Yb3+,Tm3+ nanophosphors by water: The role of the sensitizer Yb3+ in non-radiative relaxation. Nanoscale 2015, 7, 11746–11757. [Google Scholar] [CrossRef]
- Smirnov, M.; Manukovskaya, D.; Sidorov, N.; Palatnikov, M. Features of the defect structure and luminescence of nominally pure lithium niobate crystals produced using different technologies. Materials 2023, 16, 255–277. [Google Scholar] [CrossRef] [PubMed]
- Smirnov, M.V.; Sidorov, N.V.; Palatnikov, M.N. Luminescence properties of non-stoichiometric lithium niobate crystals of various composition and genesis. Opt. Spectrosc. 2022, 130, 160–172. [Google Scholar]
- Khalameida, S.; Sydorchuk, V.; Leboda, R.; Skubiszewska-Zieba, J.; Zazhigalov, V. Preparation of nano-dispersed lithium niobate by mechanochemical route. J. Therm. Anal. Calorim. 2014, 115, 579–586. [Google Scholar] [CrossRef]
- Sugak, D.; Vasylechko, L.; Sydorchuk, V.; Hurskyy, S.; Luchechko, A.; Syvorotka, I.I.; Lakhnik, A.; Yakhnevych, U.; Hreb, V.; Ubizskii, S.; et al. Mechanosynthesis, Structure and Photoluminescent Properties of the Pr3+ Doped LiNbO3, LiNbO3:Mg, LiTaO3 Nanopowders. Powders 2023, 2, 562–577. [Google Scholar] [CrossRef]
- Kocsor, L.; Péter, L.; Corradi, G.; Kis, Z.; Gubicza, J.; Kovács, L. Mechanochemical reactions of lithium niobate induced by high-energy ball-milling. Crystals 2019, 9, 334–349. [Google Scholar] [CrossRef]
- Regulska, K.; Januszewicz, B.; Klimek, L.; Palatynska-Ulatowska, A. Analysis of the Surface Condition and Changes in Crystallographic Structure of Zirconium Oxide Affected by Mechanical Processing. Materials 2021, 14, 4042–4055. [Google Scholar] [CrossRef] [PubMed]
- Aman, A.K.; Singh, R.K.; Kr, N.; Jabeen, A. Effect of superfine grinding on structural, morphological and antioxidant properties of ginger (Zingiberofficinale) nano crystalline food powder. Mater. Today Proc. 2021, 43, 3397–3403. [Google Scholar]
- Li, G.; Guo, W.; Gao, X.; Wang, Y.; Sun, S. Effect of superfine grinding on physicochemical and antioxidant properties of soybean residue powder. Food Sci. Nutr. 2020, 8, 1208–1214. [Google Scholar] [CrossRef] [PubMed]
- Páramo-Calderó, D.E.; Vázquez-Léon, L.A.; Palma-Rodríguez, H.M.; Utrilla-Coello, R.G.; Vargas-Torres, A.; Meza-Nieto, M.A.; Romero-Cortes, T.; Aparicio-Saguilán, A. Effect of high-energy mechanical milling on the physicochemical and rheological properties of chayotextle (Sechium edule Sw.) starch. Food Chem. 2023, 427, 136720–136730. [Google Scholar] [CrossRef] [PubMed]
- Šepelák, V.; Bégin-Colin, S.; LeCaër, G. Transformations in oxides induced by high-energy ball-milling. Dalton Trans. 2012, 41, 11927–11948. [Google Scholar] [CrossRef] [PubMed]
- Kocsor, L.; Kovács, L.; Bencs, L.; Kolonits, T.; Lengyel, K.; Bazsó, G.; Kis, Z.; Péter, L. Lithium oxide loss of lithium niobate nanocrystals during high-energy ball-milling. J. Alloys Compd. 2022, 909, 164713–164723. [Google Scholar] [CrossRef]
- Shimada, S.; Kodaira, K.; Matsushita, T. A study of the formation of LiNbO3 in the system Li2CO3-Nb2O5. Thermochim. Acta 1978, 23, 135–144. [Google Scholar] [CrossRef]
- Kis, Z.; Mandula, G.; Lengyel, K.; Hajdara, I.; Kovacs, L.; Imlau, M. Homogeneous linewidth measurements of Yb3+ ions in congruent and stoichiometric lithium niobate crystals. Opt. Mater. 2014, 37, 845–853. [Google Scholar] [CrossRef]
- Mandula, G.; Kis, Z.; Kovacs, L.; Szaller, Z.; Krampf, A. Site-selective measurement of relaxation properties at 980 nm in Er3+-doped congruent and stoichiometric lithium niobate crystals. Appl. Phys. B 2016, 122, 72. [Google Scholar]
| Disclaimer/Publisher’s Note: The statements, opinions and data contained in all publications are solely those of the individual author(s) and contributor(s) and not of MDPI and/or the editor(s). MDPI and/or the editor(s) disclaim responsibility for any injury to people or property resulting from any ideas, methods, instructions or products referred to in the content. |
© 2024 by the authors. Licensee MDPI, Basel, Switzerland. This article is an open access article distributed under the terms and conditions of the Creative Commons Attribution (CC BY) license (https://creativecommons.org/licenses/by/4.0/).


 ,
, 

