
Cast Microstructure and Crystallographic Features of Al3Sc Dendrites in High Sc-Contained Al-Sc Alloys

Abstract
1. Introduction
2. Materials and Methods
3. Results
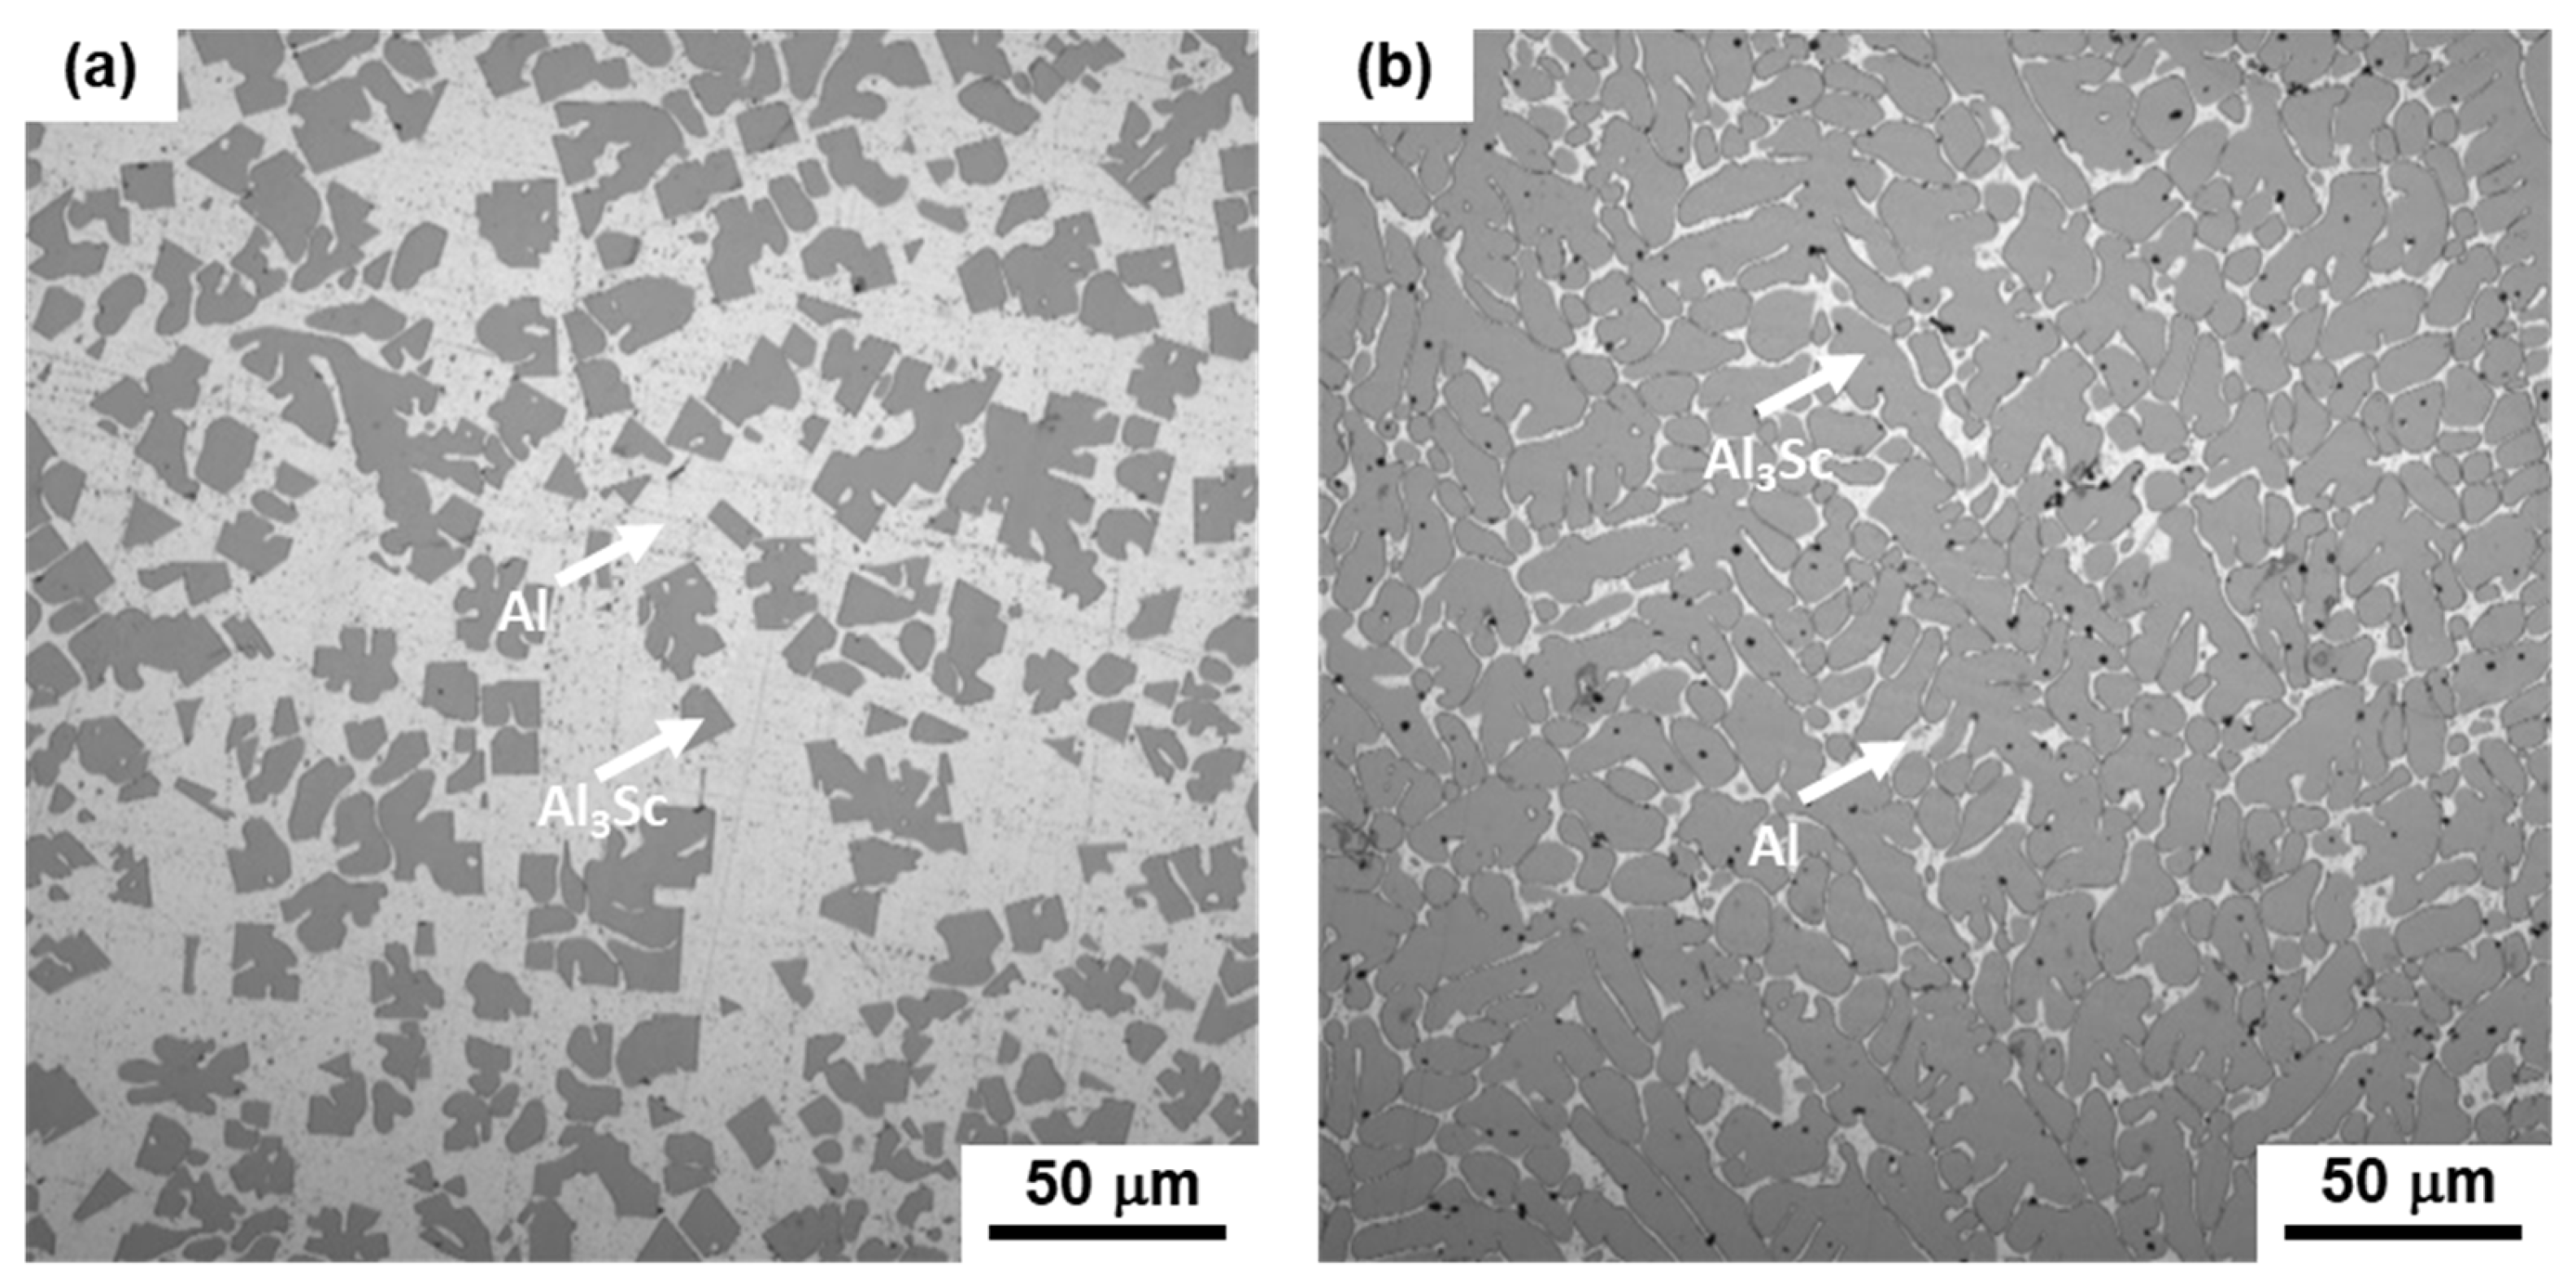
3.1. Microstructure
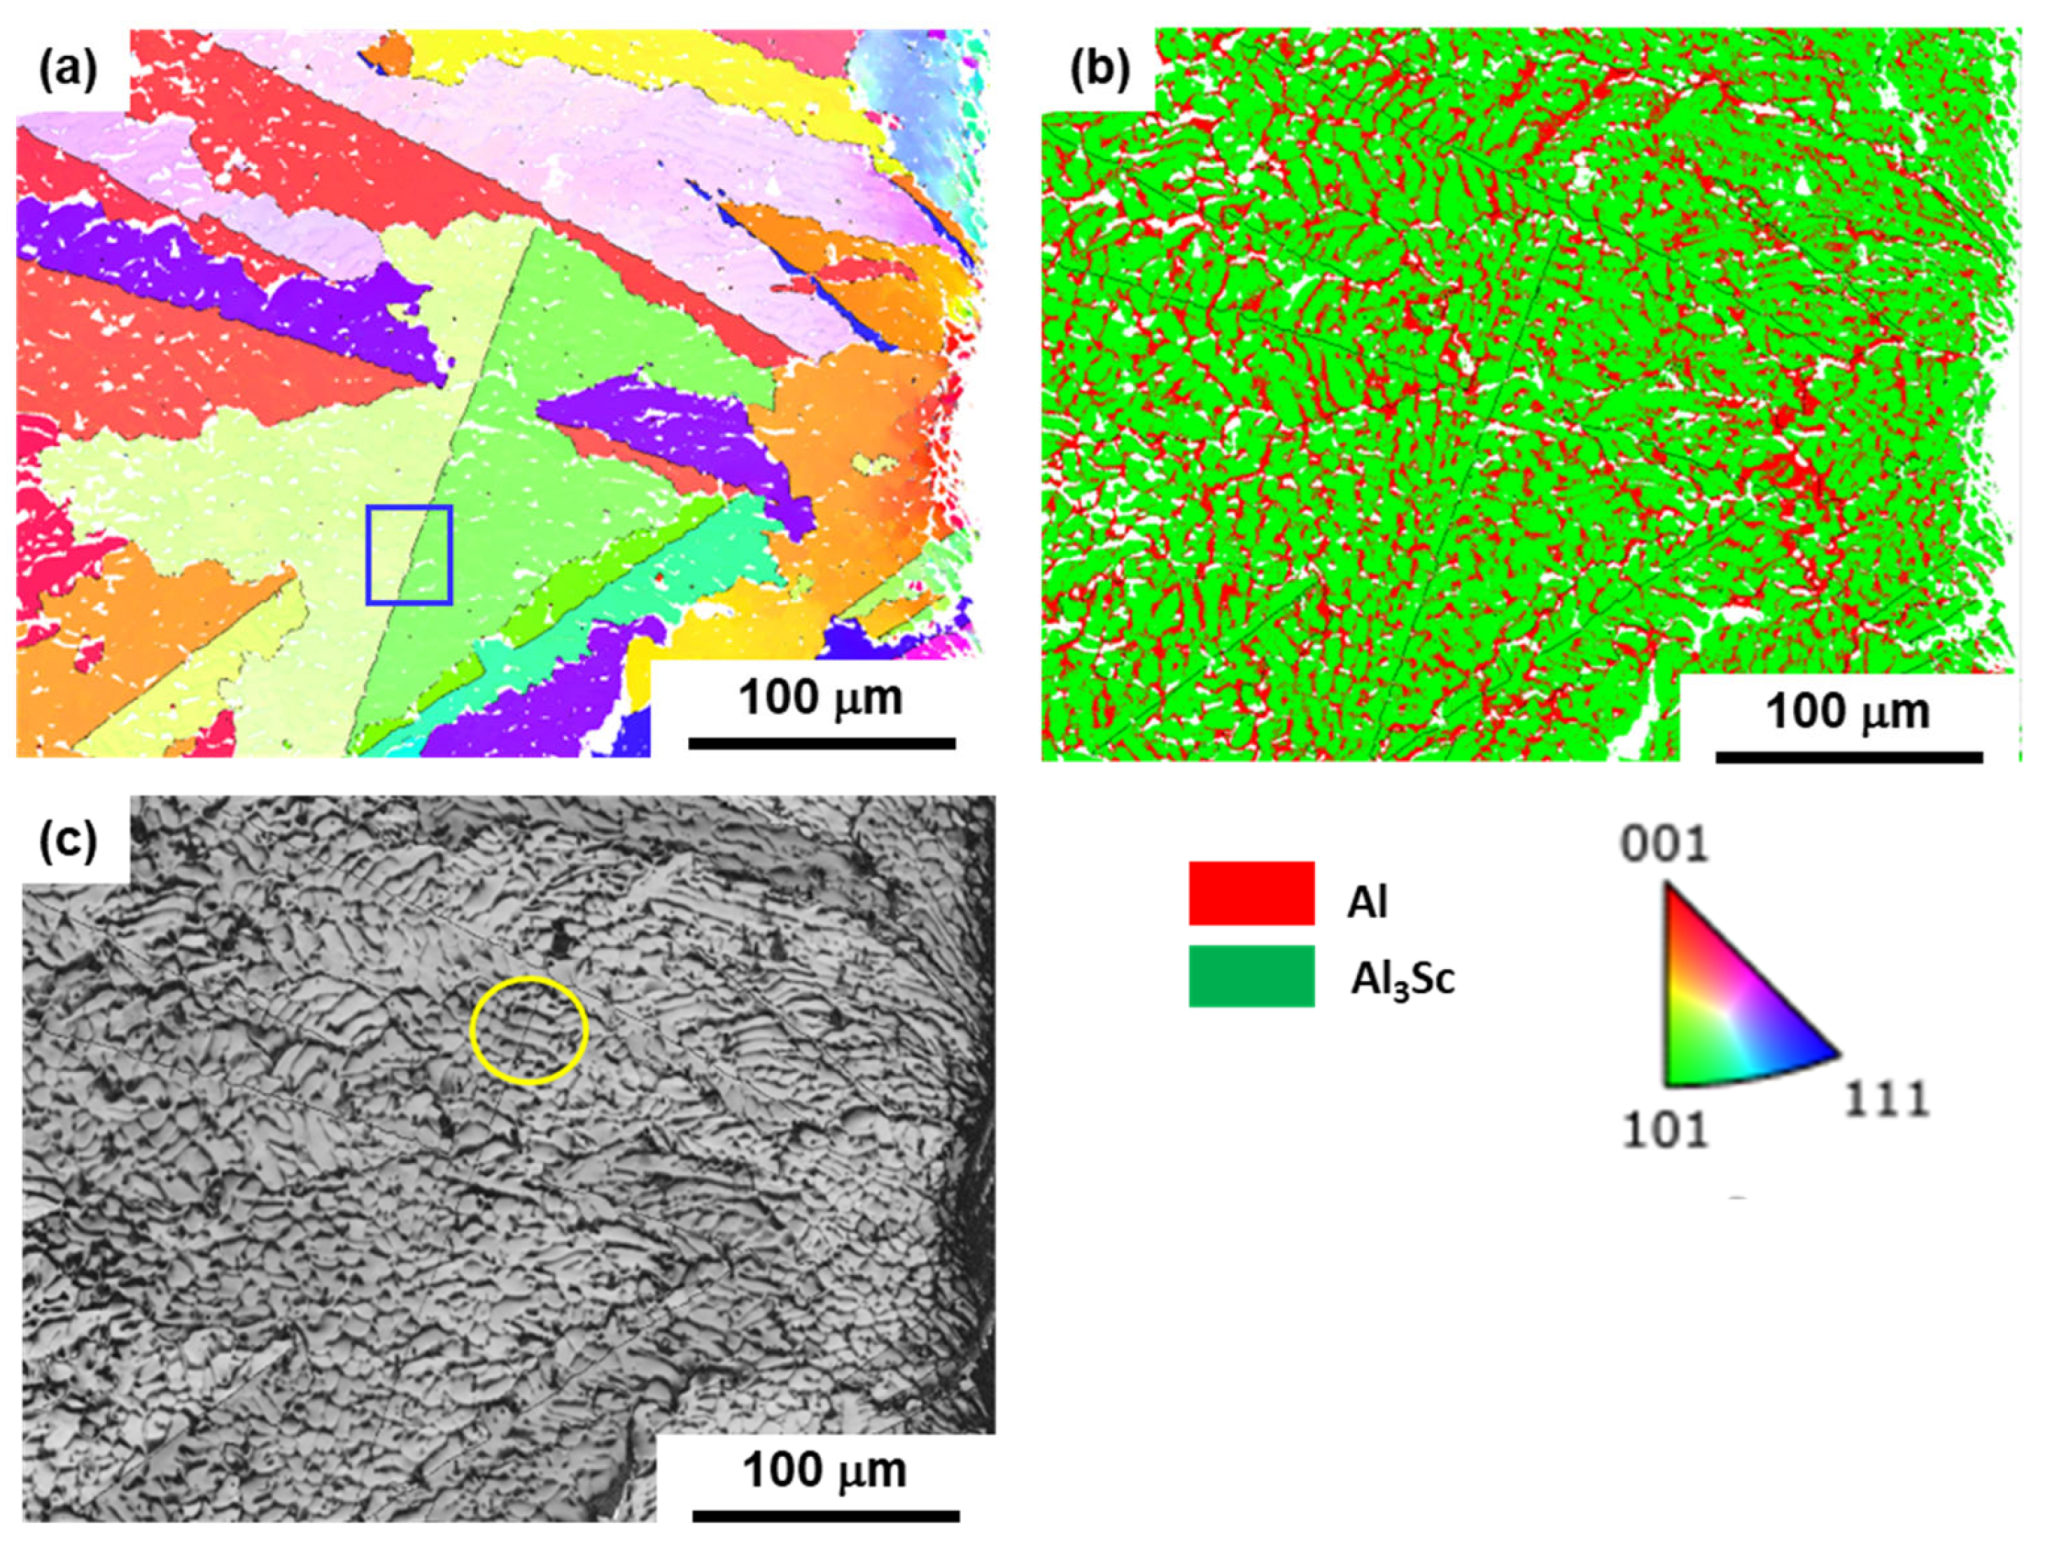
3.2. EBSD Results
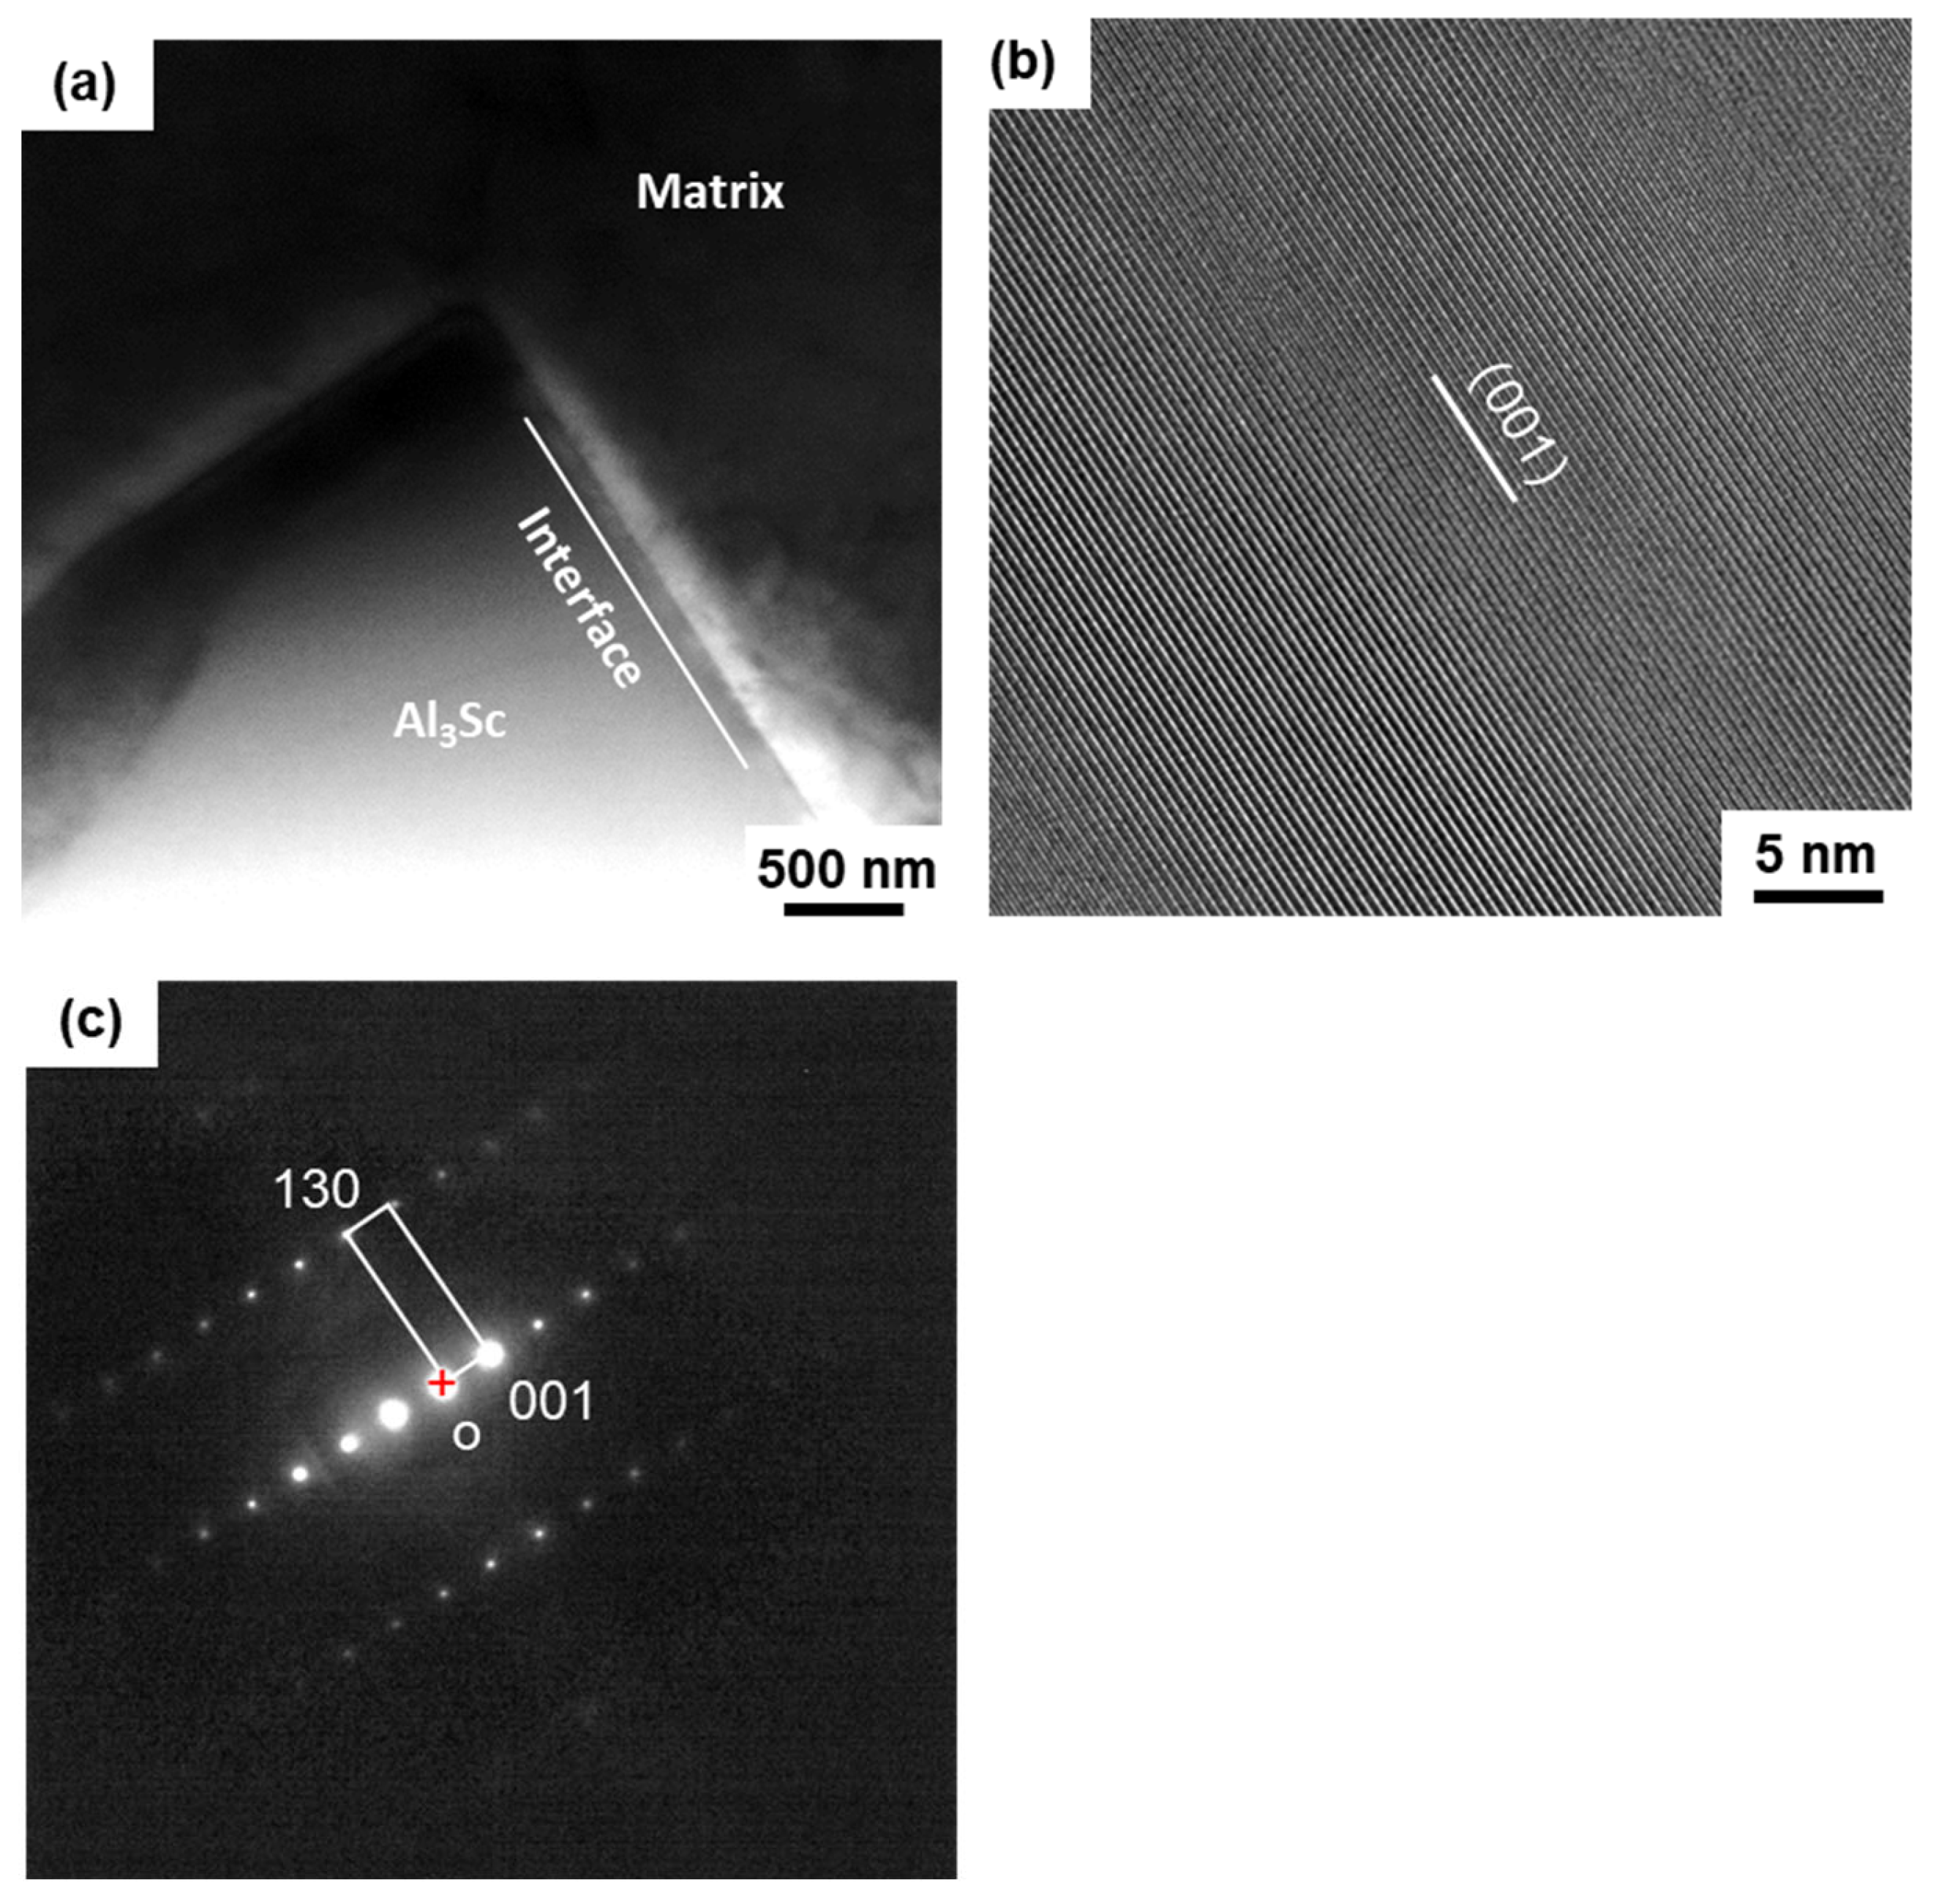
3.3. Dendrite Crystallography
4. Discussion
4.1. Microstructure Variation
4.2. Morphology Difference
4.3. The Crystallography of Al3Sc
5. Conclusions
- (1)
- With an increase in Sc content, the fraction of the Al3Sc phase also increases, and this change in Sc composition affects the morphology of the alloy, from faceted cuboidal to twinned dendrites.
- (2)
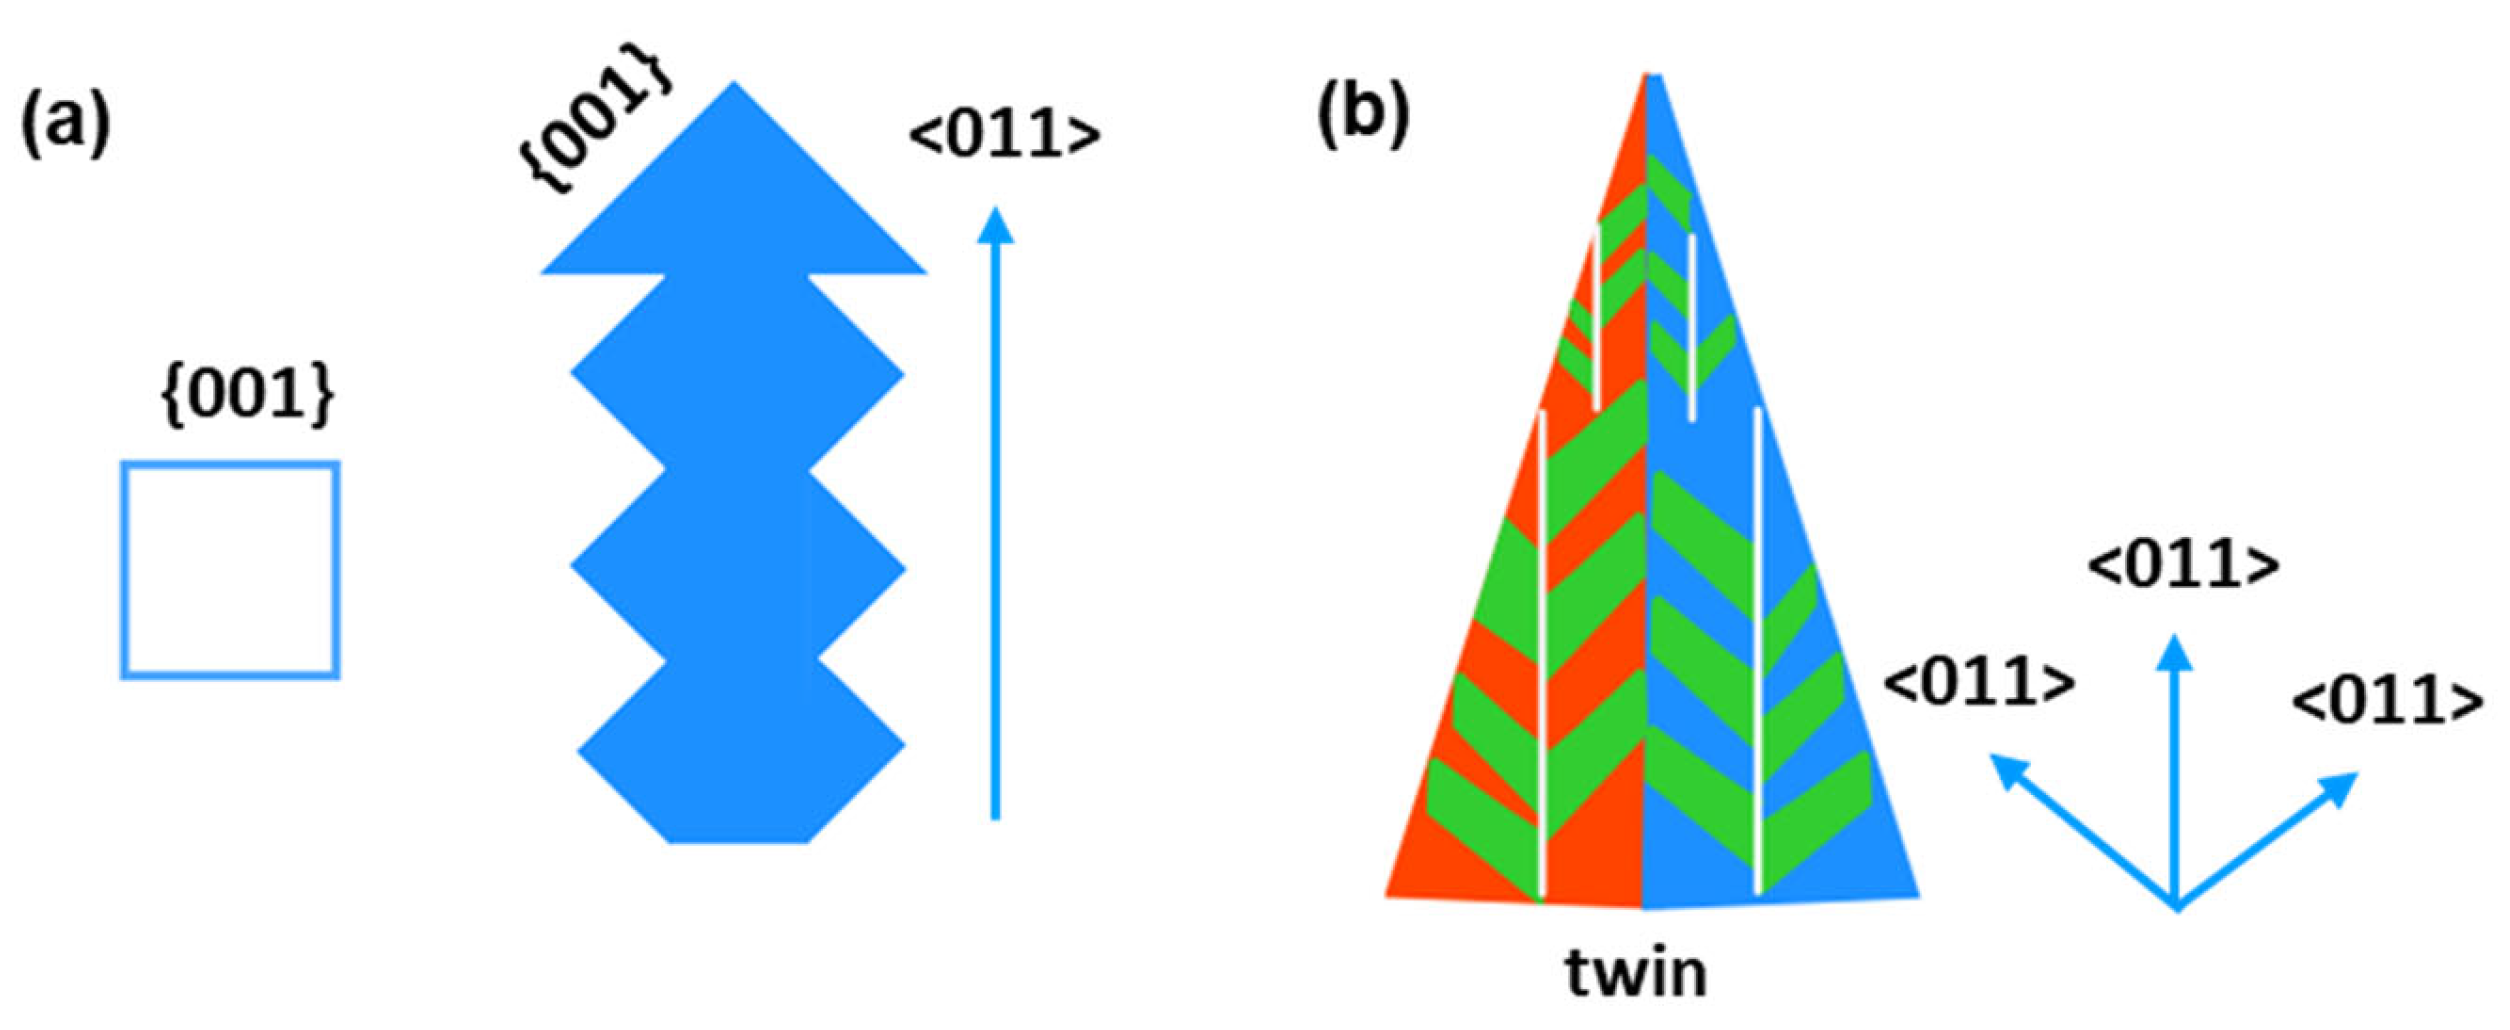
- The Al3Sc phases exhibit a cubic relationship with the Al matrix in both Al-10%Sc and Al-20%Sc alloys. The statistical analysis using EBSD data reveals that in Al-10%Sc alloys, the facet of the Al3Sc compound is parallel to the {001} plane. In contrast, a twin dendrite structure is observed in the Al-20%Sc alloy, with the twinning plane parallel to the {111} plane and dendrite growth occurring along the <110> directions.
- (3)
- The coarsen Al3Sc observed in the 20%Sc alloy is attributed to nucleation and a fast growth rate at high temperatures. The dendrite formation originates from interface instability and prefers growth along the <110> directions. The dendritic shape is more pronounced in Al-Sc alloys with higher Sc content. The twin structure is easily observed in the dendrites in Al3Sc structures.
Author Contributions
Funding
Data Availability Statement
Conflicts of Interest
References
- Akiyama, M.; Kamohara, T.; Kano, K.; Teshigahara, A.; Takeuchi, Y.; Kawahara, N. Enhancement of piezoelectric response in scandium aluminum nitride alloy thin films prepared by dual reactive cosputtering. Adv. Mater. 2009, 21, 593–596. [Google Scholar] [CrossRef]
- Tasnadi, F.; Alling, B.; Höglund, C.; Wingqvist, G.; Birch, J.; Hultman, L.; Abrikosov, I.A. Origin of the anomalous piezoelectric response in wurtzite ScxAl1−xN alloys. Phys. Rev. Lett. 2010, 104, 137601. [Google Scholar] [CrossRef] [PubMed]
- Akiyama, M.; Kano, K.; Teshigahara, A. Influence of growth temperature and scandium concentration on piezoelectric response of scandium aluminum nitride alloy thin films. Appl. Phys. Lett. 2009, 95, 162107. [Google Scholar] [CrossRef]
- Piazza, G.; Felmetsger, V.; Muralt, P.; Olsson, R.H., III; Ruby, R. Piezoelectric aluminum nitride thin films for microelectromechanical systems. MRS Bull. 2012, 37, 1051–1061. [Google Scholar] [CrossRef]
- Akiyama, M.; Tabaru, T.; Nishikubo, K.; Teshigahara, A.; Kano, K. Preparation of scandium aluminum nitride thin films by using scandium aluminum alloy sputtering target and design of experiments. J. Ceram. Soc. JPN 2010, 118, 1166–1169. [Google Scholar] [CrossRef]
- Yasuoka, S.; Shimizu, T.; Tateyama, A.; Uehara, M.; Yamada, H.; Akiyama, M.; Hiranaga, Y.; Cho, Y.; Funakubo, H. Effects of deposition conditions on the ferroelectric properties of (Al1−xScx) N thin films. J. Appl. Phys. 2020, 128, 114103. [Google Scholar] [CrossRef]
- Wall, J.M.; Yan, F. Sputtering Process of ScxAl1−xN Thin Films for Ferroelectric Applications. Coatings 2023, 13, 54. [Google Scholar] [CrossRef]
- Men, K.; Liu, H.; Wang, X.; Jia, Q.; Ding, Z.; Wu, H.; Wu, D.; Xiong, Y. AlScN films prepared by alloy targets and SAW device characteristics. J. Rare Earths 2022, 41, 434–439. [Google Scholar] [CrossRef]
- Ding, Z.; Cao, X.; Jia, Q.; Zhang, X. Preparation and performance of AlSc alloy targets. AIP Conf. Proc. 2022, 2474, 020029. [Google Scholar]
- Gschneidner, K.; Calderwood, F. The Al-Sc (aluminum-scandium) system. Bull. Alloy Phase Diagr. 1989, 10, 34–36. [Google Scholar] [CrossRef]
- Zhao, Y.; Zhang, W.; Koe, B.; Du, W.; Wang, M.; Wang, W.; Boller, E.; Rack, A.; Sun, Z.; Mi, J. 3D characterization of the primary Al3Sc phases in an Al-Sc alloy using Synchrotron X-ray tomography and electron microscopy. arXiv 2019, arXiv:1909.09388. [Google Scholar]
- Marquis, E.; Seidman, D.N. Nanoscale structural evolution of Al3Sc precipitates in Al (Sc) alloys. Acta Mater. 2001, 49, 1909–1919. [Google Scholar] [CrossRef]
- Koutny, D.; Skulina, D.; Pantělejev, L.; Paloušek, D.; Lenczowski, B.; Palm, F.; Nick, A. Processing of Al-Sc aluminum alloy using SLM technology. Procedia Cirp 2018, 74, 44–48. [Google Scholar] [CrossRef]
- Jia, Q.; Zhang, F.; Rometsch, P.; Li, J.; Mata, J.; Weyland, M.; Bourgeois, L.; Sui, M.; Wu, X. Precipitation kinetics, microstructure evolution and mechanical behavior of a developed Al–Mn–Sc alloy fabricated by selective laser melting. Acta Mater. 2020, 193, 239–251. [Google Scholar] [CrossRef]
- Schliephake, D.; Lopes, C.; Eggeler, Y.M.; Chen, H.; Freudenberger, J.; Bayoumy, D.; Huang, A.J.; Kauffmann, A. Improved work hardening capability and ductility of an additively manufactured and deformed Al-Mn-Mg-Sc-Zr alloy. J. Alloys Compd. 2022, 924, 166499. [Google Scholar] [CrossRef]
- Yang, X.; Cai, R.; Chen, C.; Araby, S.; Li, Y.; Wang, W.; Meng, Q. High-performance aluminum alloy with fully equiaxed grain microstructure fabricated by laser metal deposition. J. Mater. Res. 2022, 37, 3658–3667. [Google Scholar] [CrossRef]
- Kuo, C.; Peng, P. The strengthening mechanism synergy of heat-treated 3D printed Al-Sc alloy. Virtual Phys. Prototyp. 2023, 18, e2166539. [Google Scholar] [CrossRef]
- Jiang, A.; Wang, X. Dendritic and seaweed growth of proeutectic scandium tri-aluminide in hypereutectic Al-Sc undercooled melt. Acta Mater. 2020, 200, 56–65. [Google Scholar] [CrossRef]
- Yan, K.; Chen, Z.; Zhao, Y.; Ren, C.; Lu, W.; Aldeen, A. Morphological characteristics of Al3Sc particles and crystallographic orientation relationships of Al3Sc/Al interface in cast Al-Sc alloy. J. Alloys Compd. 2021, 861, 158491. [Google Scholar] [CrossRef]
- Porter, D.A.; Easterling, K.E. Phase Transformations in Metals and Alloys (Revised Reprint); CRC Press: Boca Raton, FL, USA, 2009. [Google Scholar]
- Wang, X.; Wang, Y.; Jia, Q.; Ding, Z.; He, J.; Hui, S.-X. Novel twinned Al3Sc dendrites in as-casted Al-Sc alloy. Rare Metals 2023, 42, 838–843. [Google Scholar] [CrossRef]
- Fu, C.L. Electronic, elastic, and fracture properties of trialuminide alloys: Al3Sc and Al3Ti. J. Mater. Res. 1990, 5, 971–979. [Google Scholar] [CrossRef]
- Gu, X.; Furuhara, T.; Zhang, W. PTCLab: Free and open-source software for calculating phase transformation crystallography. J. Appl. Crystallogr. 2016, 49, 1099–1106. [Google Scholar] [CrossRef]
- Nyyssönen, T.; Gazder, A.A.; Hielscher, R.; Niessen, F. Habit plane determination from reconstructed parent phase orientation maps. Acta Mater. 2023, 255, 119035. [Google Scholar] [CrossRef]
- Becker, H.; Hielscher, R.; Leineweber, A. Interplay between Habit Plane and Orientation Relationship in an Electron Backscatter Diffraction Analysis: Using the Example of eta-prime-Al8Fe3 in eta-Al5Fe2. Crystals 2022, 12, 813. [Google Scholar] [CrossRef]
- Nishizawa, T. Thermodynamics of Microstructures; ASM International: Materials Park, OH, USA, 2008. [Google Scholar]
- Cahn, J.W. Theory of crystal growth and interface motion in crystalline materials. Acta Metall. 1960, 8, 554–562. [Google Scholar] [CrossRef]
- Watanabe, C.; Watanabe, D.; Monzen, R. Coarsening behavior of Al3Sc precipitates in an Al–Mg–Sc alloy. Mater. Trans. 2006, 47, 2285–2291. [Google Scholar] [CrossRef]
- Shubin, A.; Shunyaev, K.Y.; Kulikova, T. Problem of the thermodynamic properties of liquid aluminum alloys with scandium. Russ. Metall. (Met.) 2008, 2008, 364–369. [Google Scholar] [CrossRef]
- Gupta, A.; Tas, B.; Korbmacher, D.; Dutta, B.; Neitzel, Y.; Grabowski, B.; Hickel, T.; Esin, V.; Divinski, S.V.; Wilde, G. A combined experimental and first-principles based assessment of finite-temperature thermodynamic properties of intermetallic Al3Sc. Materials 2021, 14, 1837. [Google Scholar] [CrossRef]
- Hyland, R.W.; Asta, M.; Foiles, S.M.; Rohrer, C.L. Al(f.c.c.):Al3Sc(L12) interphase boundary energy calculations. Acta Mater. 1998, 46, 3667–3678. [Google Scholar] [CrossRef]
- Turchin, A.; Zuijderwijk, M.; Pool, J.; Eskin, D.; Katgerman, L. Feathery grain growth during solidification under forced flow conditions. Acta Mater. 2007, 55, 3795–3801. [Google Scholar] [CrossRef]
- Henry, S.; Rappaz, M.; Jarry, P. <110> dendrite growth in aluminum feathery grains. Metall. Mater. Trans. A 1998, 29, 2807–2817. [Google Scholar]
- Henry, S.; Gruen, G.U.; Rappaz, M. Influence of convection on feathery grain formation in aluminum alloys. Metall. Mater. Trans. A 2004, 35, 2495–2501. [Google Scholar] [CrossRef]
- Liu, X.; Xue, J.; Guo, Z.; Zhang, C. Segregation behaviors of Sc and unique primary Al3Sc in Al-Sc alloys prepared by molten salt electrolysis. J. Mater. Sci. Technol. 2019, 35, 1422–1431. [Google Scholar] [CrossRef]


Disclaimer/Publisher’s Note: The statements, opinions and data contained in all publications are solely those of the individual author(s) and contributor(s) and not of MDPI and/or the editor(s). MDPI and/or the editor(s) disclaim responsibility for any injury to people or property resulting from any ideas, methods, instructions or products referred to in the content. |
© 2024 by the authors. Licensee MDPI, Basel, Switzerland. This article is an open access article distributed under the terms and conditions of the Creative Commons Attribution (CC BY) license (https://creativecommons.org/licenses/by/4.0/).
Share and Cite
He, J.; Jia, Q.; Ding, Z.; Wang, X.; Cao, X.; Cao, Z.; Gu, X. Cast Microstructure and Crystallographic Features of Al3Sc Dendrites in High Sc-Contained Al-Sc Alloys. Crystals 2024, 14, 200. https://doi.org/10.3390/cryst14020200
He J, Jia Q, Ding Z, Wang X, Cao X, Cao Z, Gu X. Cast Microstructure and Crystallographic Features of Al3Sc Dendrites in High Sc-Contained Al-Sc Alloys. Crystals. 2024; 14(2):200. https://doi.org/10.3390/cryst14020200
Chicago/Turabian StyleHe, Jinjiang, Qian Jia, Zhaochong Ding, Xingquan Wang, Xiaomeng Cao, Ziqi Cao, and Xinfu Gu. 2024. "Cast Microstructure and Crystallographic Features of Al3Sc Dendrites in High Sc-Contained Al-Sc Alloys" Crystals 14, no. 2: 200. https://doi.org/10.3390/cryst14020200
APA StyleHe, J., Jia, Q., Ding, Z., Wang, X., Cao, X., Cao, Z., & Gu, X. (2024). Cast Microstructure and Crystallographic Features of Al3Sc Dendrites in High Sc-Contained Al-Sc Alloys. Crystals, 14(2), 200. https://doi.org/10.3390/cryst14020200