
Failure Mechanism and Residual Stress Analysis of Crystal Materials for the Thermal Battery

Abstract
1. Introduction
2. Experimental Methodologies
2.1. Equipment for the Experiment
2.2. Characterization of Cathode and Electrolyte Materials for the Thermal Battery
2.2.1. Characterization and Analysis of the Cathode Materials
2.2.2. Characterization and Analysis of the Electrolyte Materials
2.3. Characterization of the Thermal Battery after Service
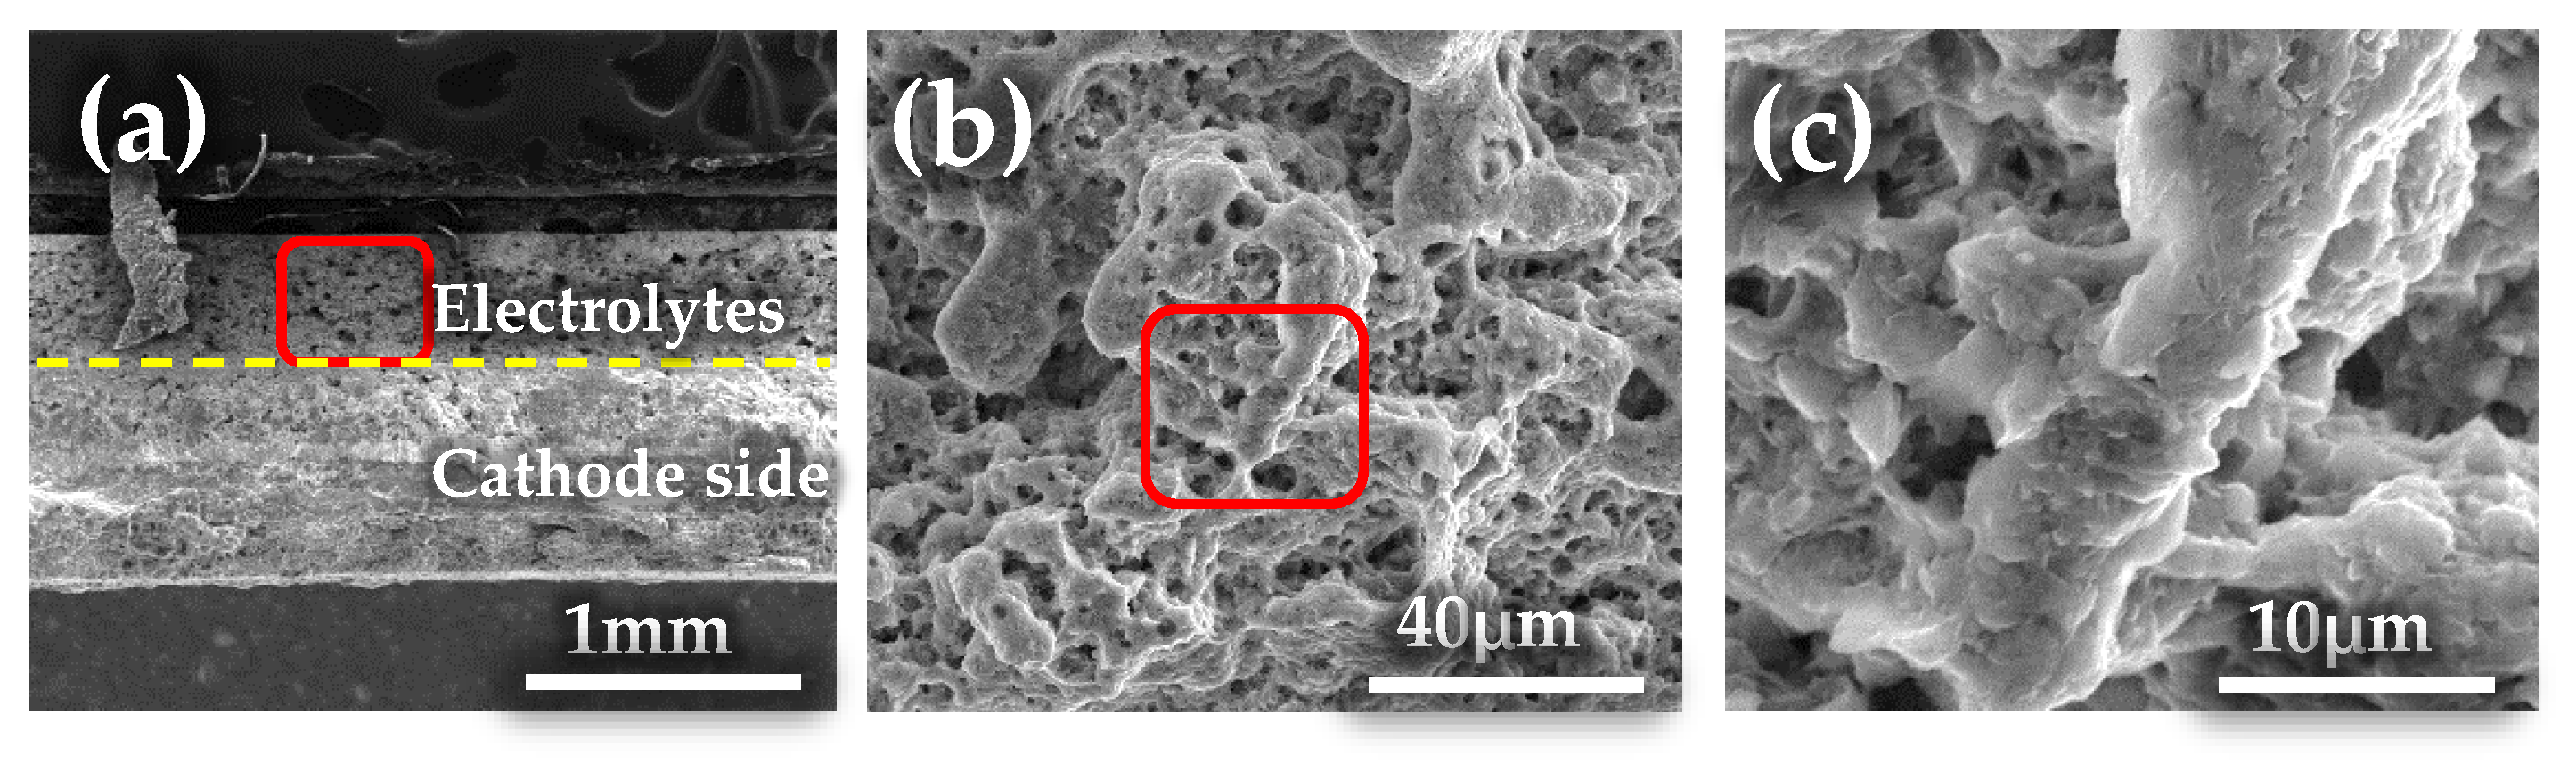
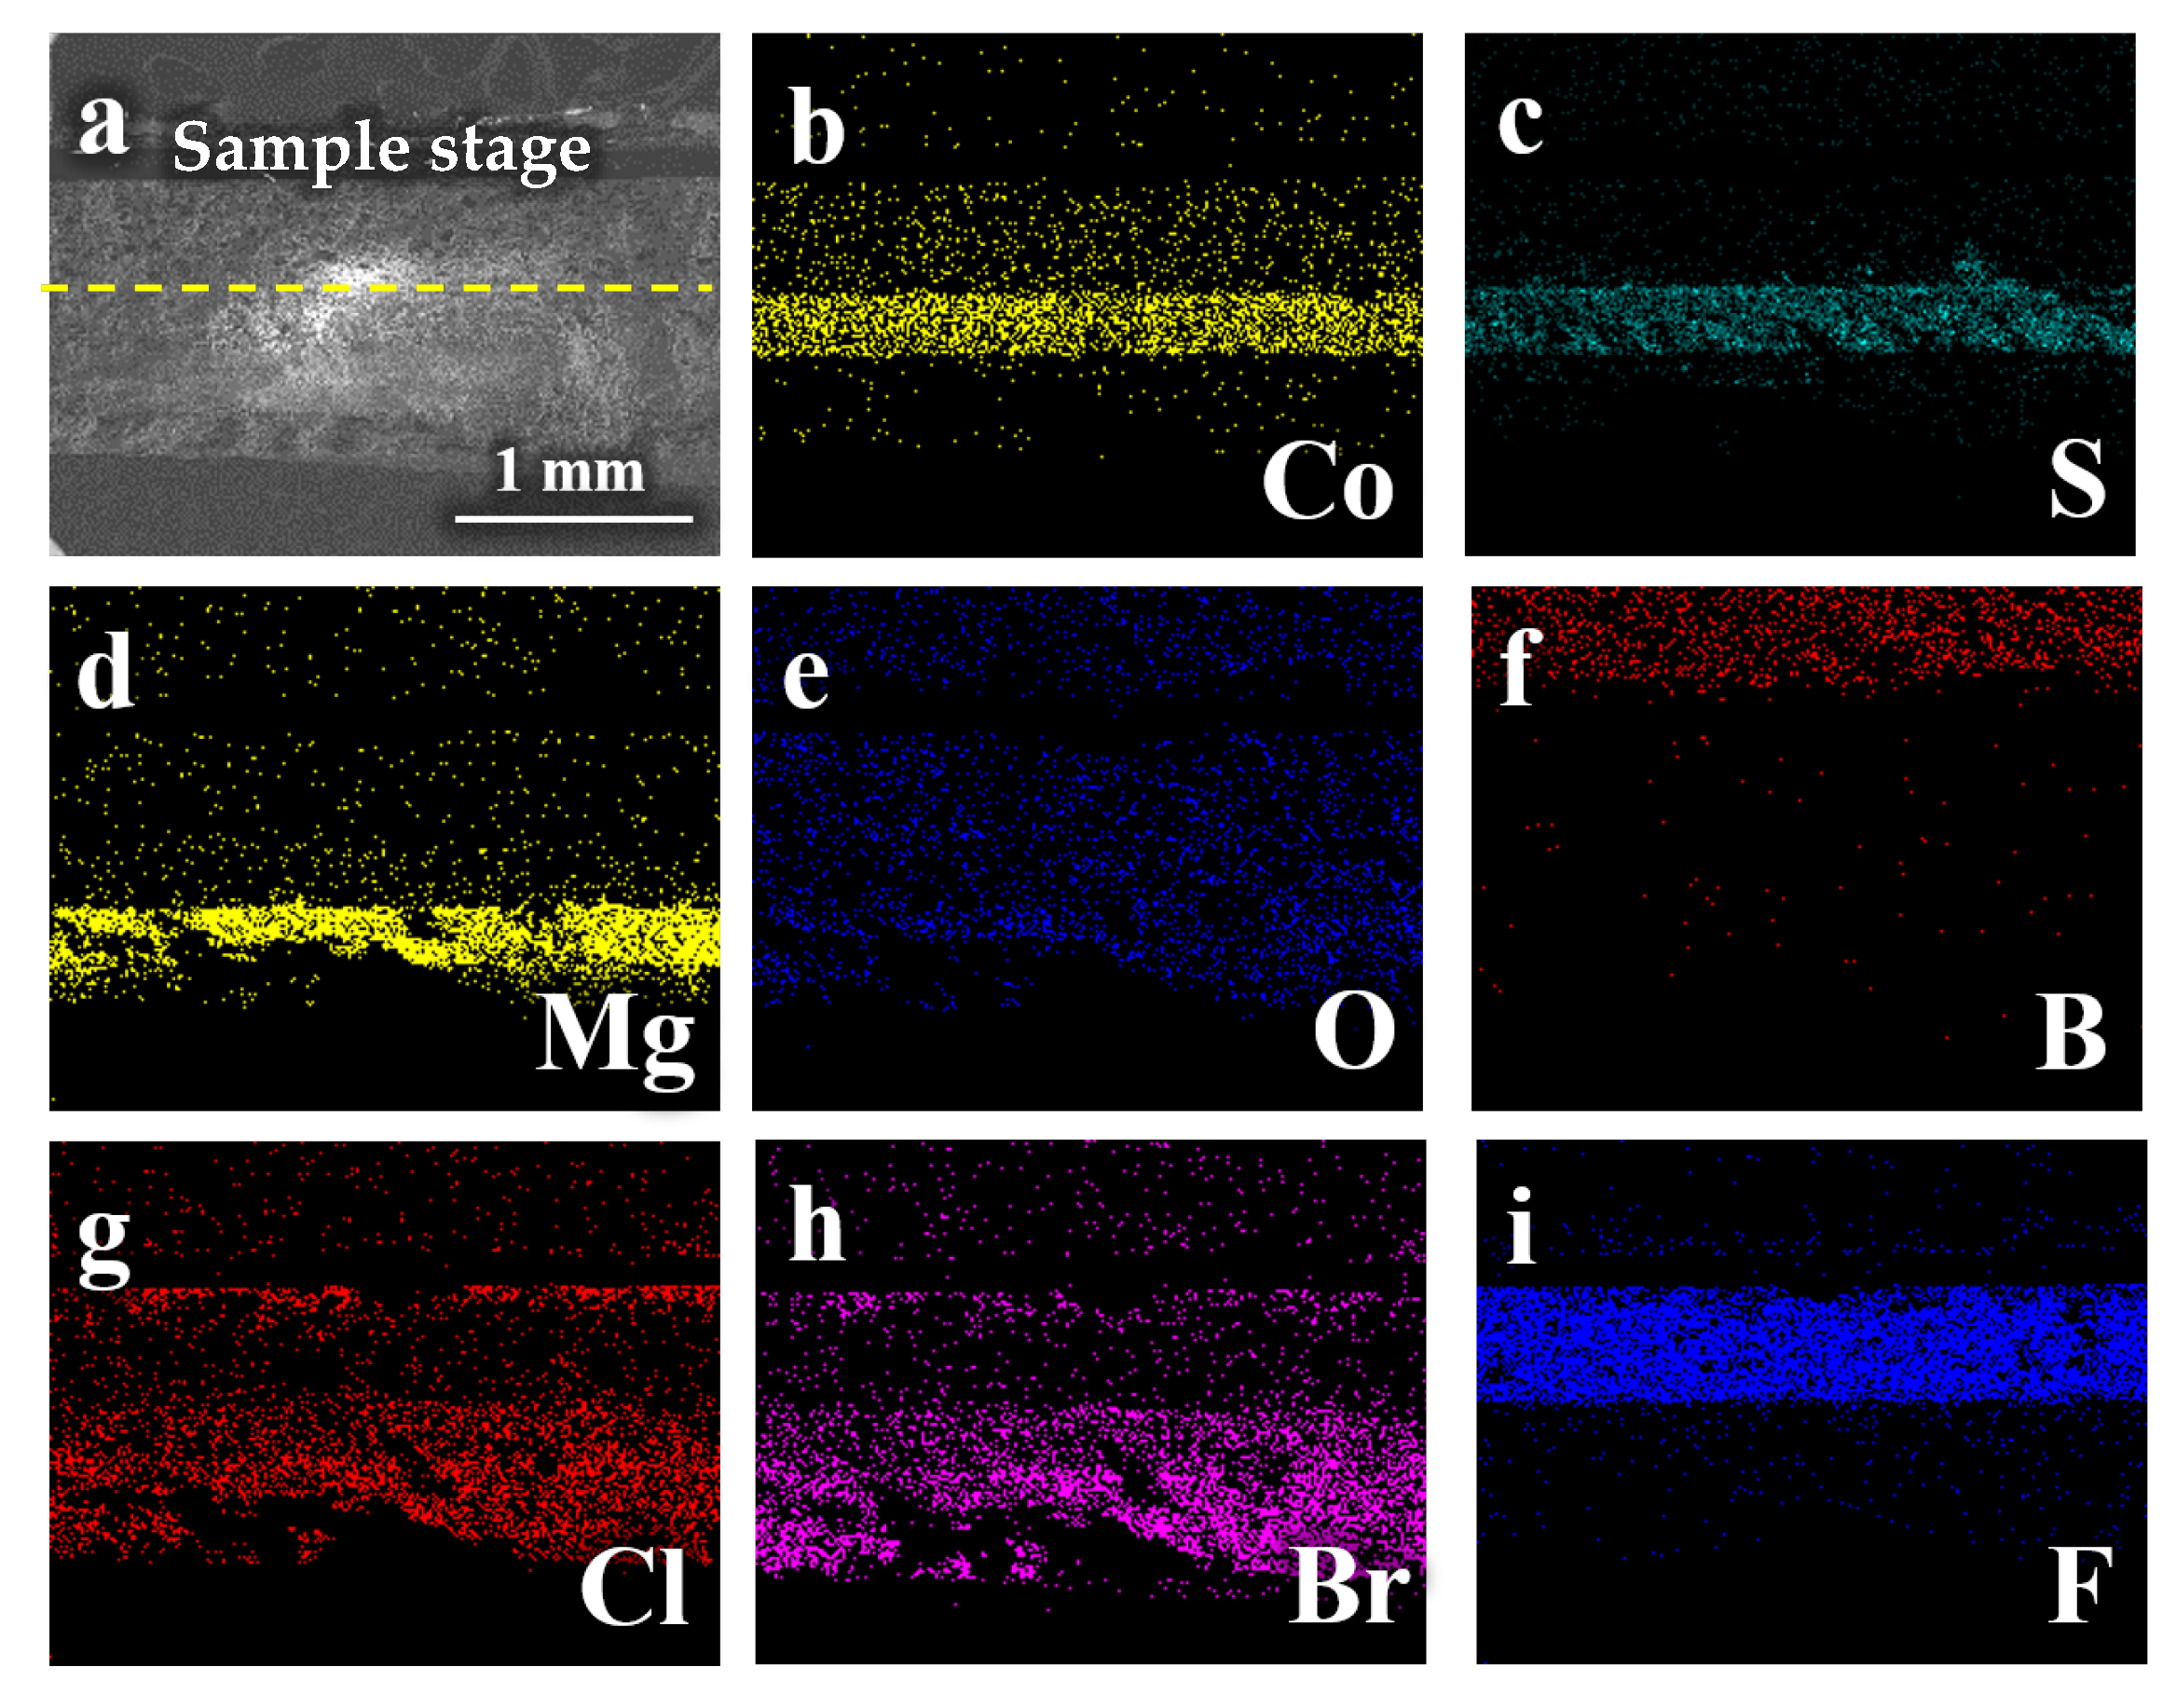
2.3.1. Characterization and Analysis of the Cross-Section of the Thermal Battery after Service
2.3.2. Characterization and Analysis of the Cathode Side
2.3.3. Characterization and Analysis of the Anode Surface
3. Finite Element Methods
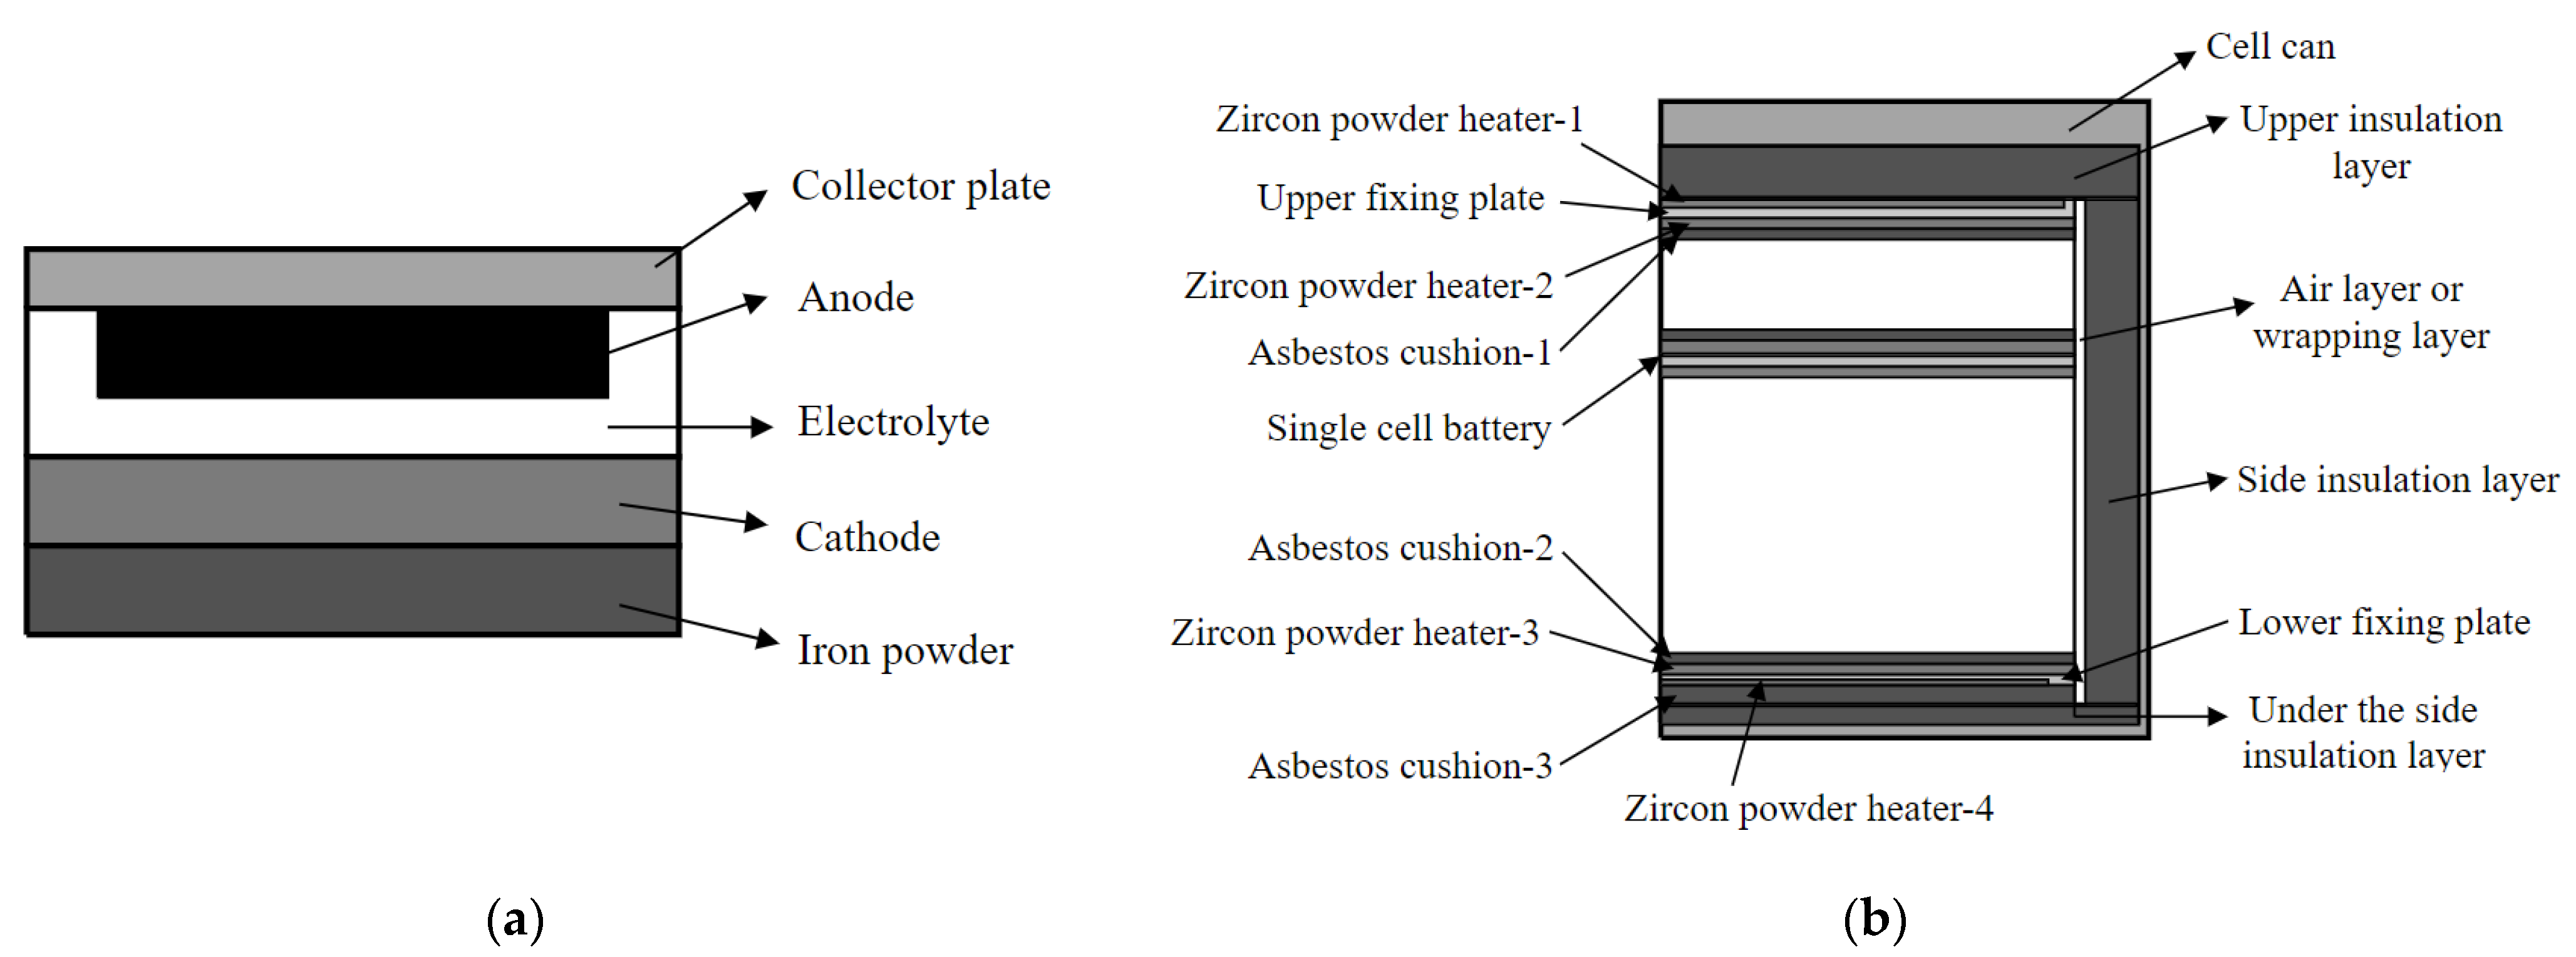
3.1. Geometric Modeling of the Thermal Battery
3.2. Modeling of Finite Elements
4. Results and Discussion
4.1. Reaction Mechanisms of the Thermal Battery
4.2. Analysis of Residual Stress
5. Conclusions
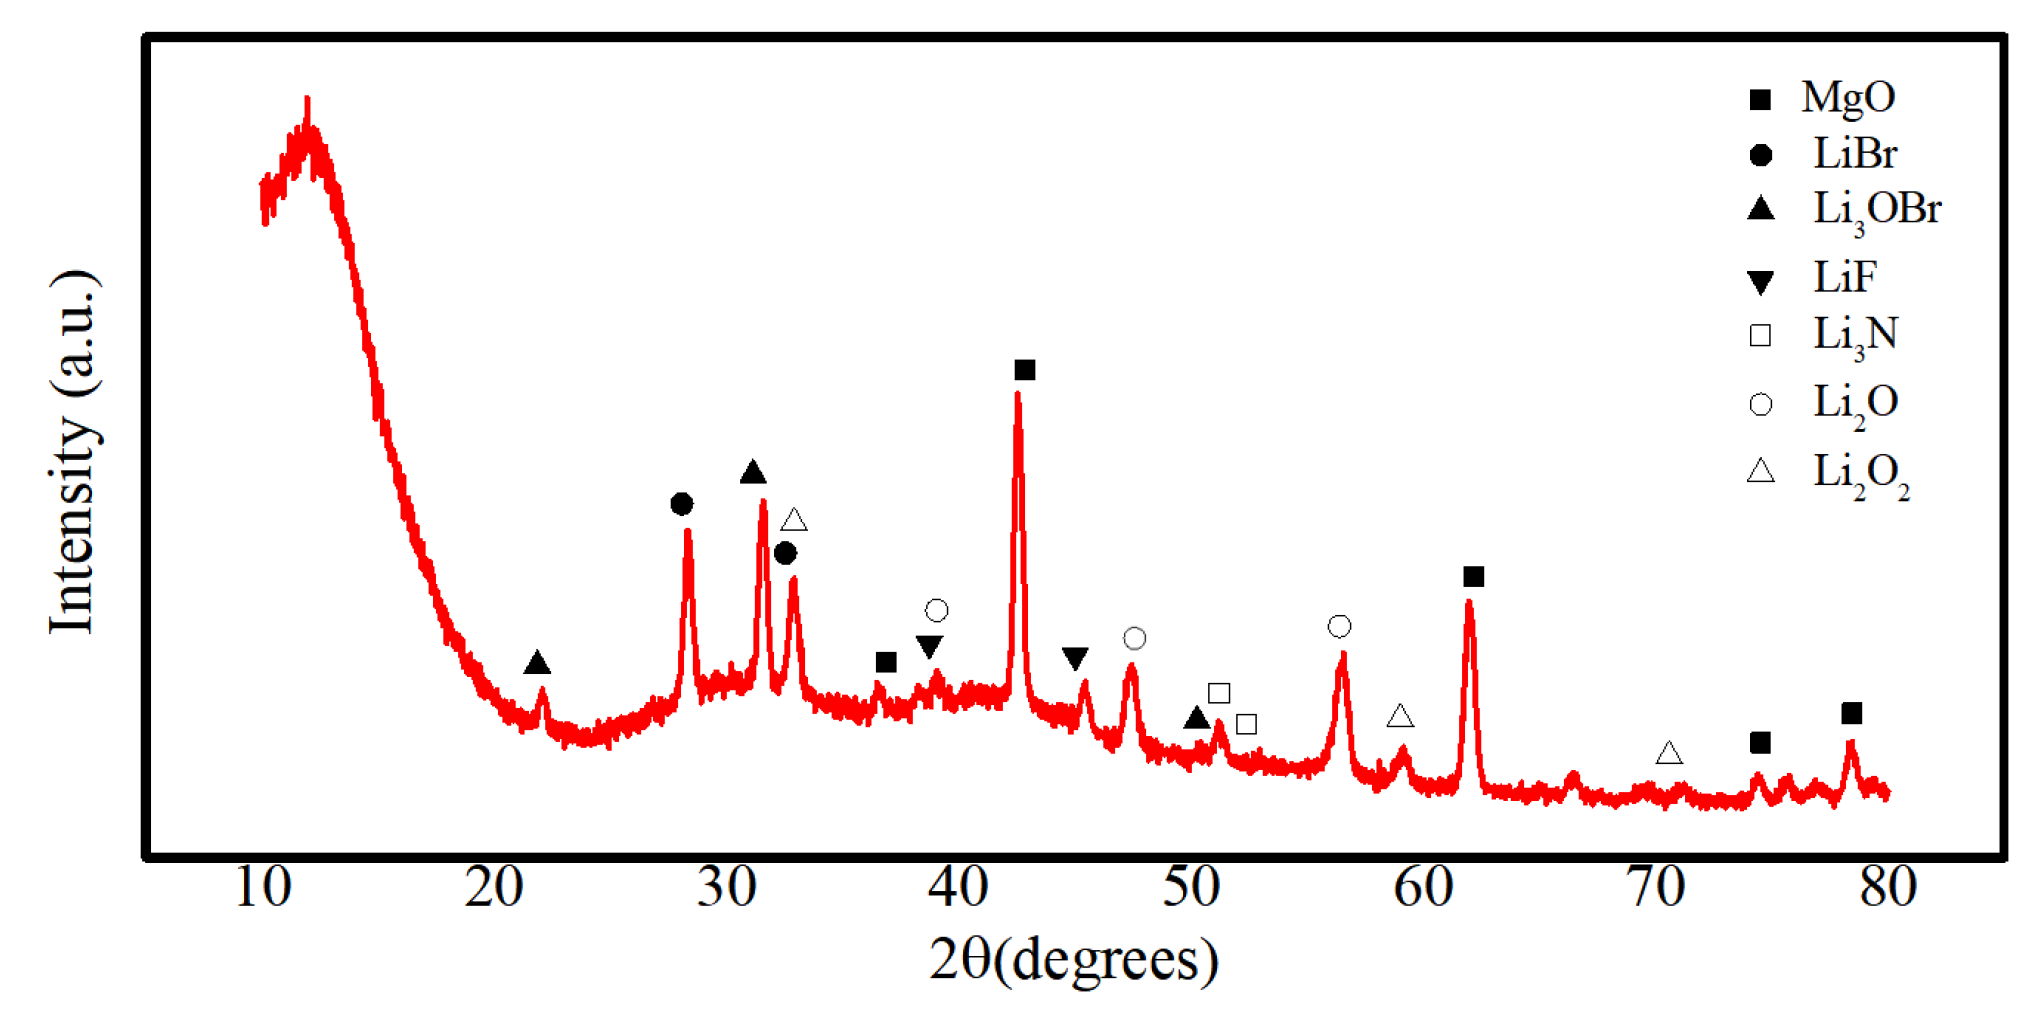
- The cathode material is made up of pure—phase CoS2, exhibiting a decomposition temperature of 655 °C, which is higher than that of FeS2 and similar cathode materials. Moreover, this temperature is far higher than the operational temperature of the thermal battery (500 °C), indicating that the cathode material is highly thermally stable. The electrolyte material comprises mainly MgO, LiF, LiBr, and LiCl. The particles aggregate in a flaky morphology that is dominant. MgO primarily solidifies the molten salt electrolyte under the thermal battery’s working temperature and does not change significantly during the working interval;
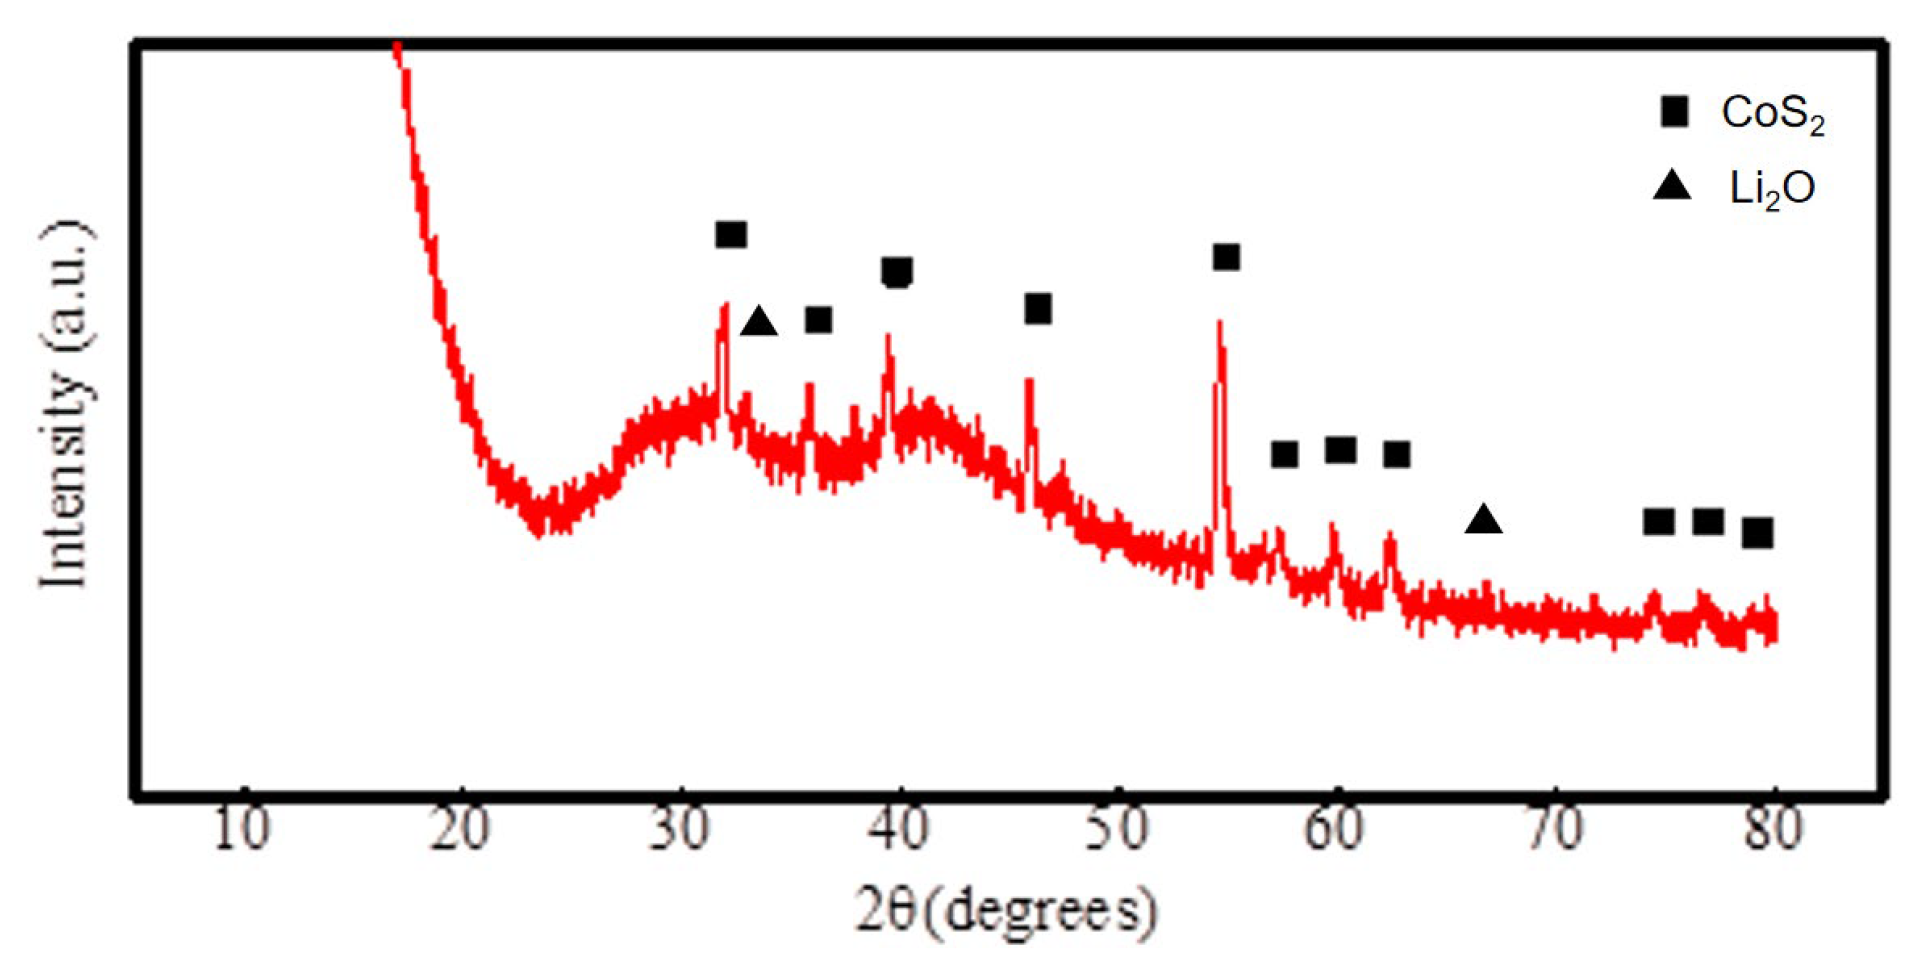
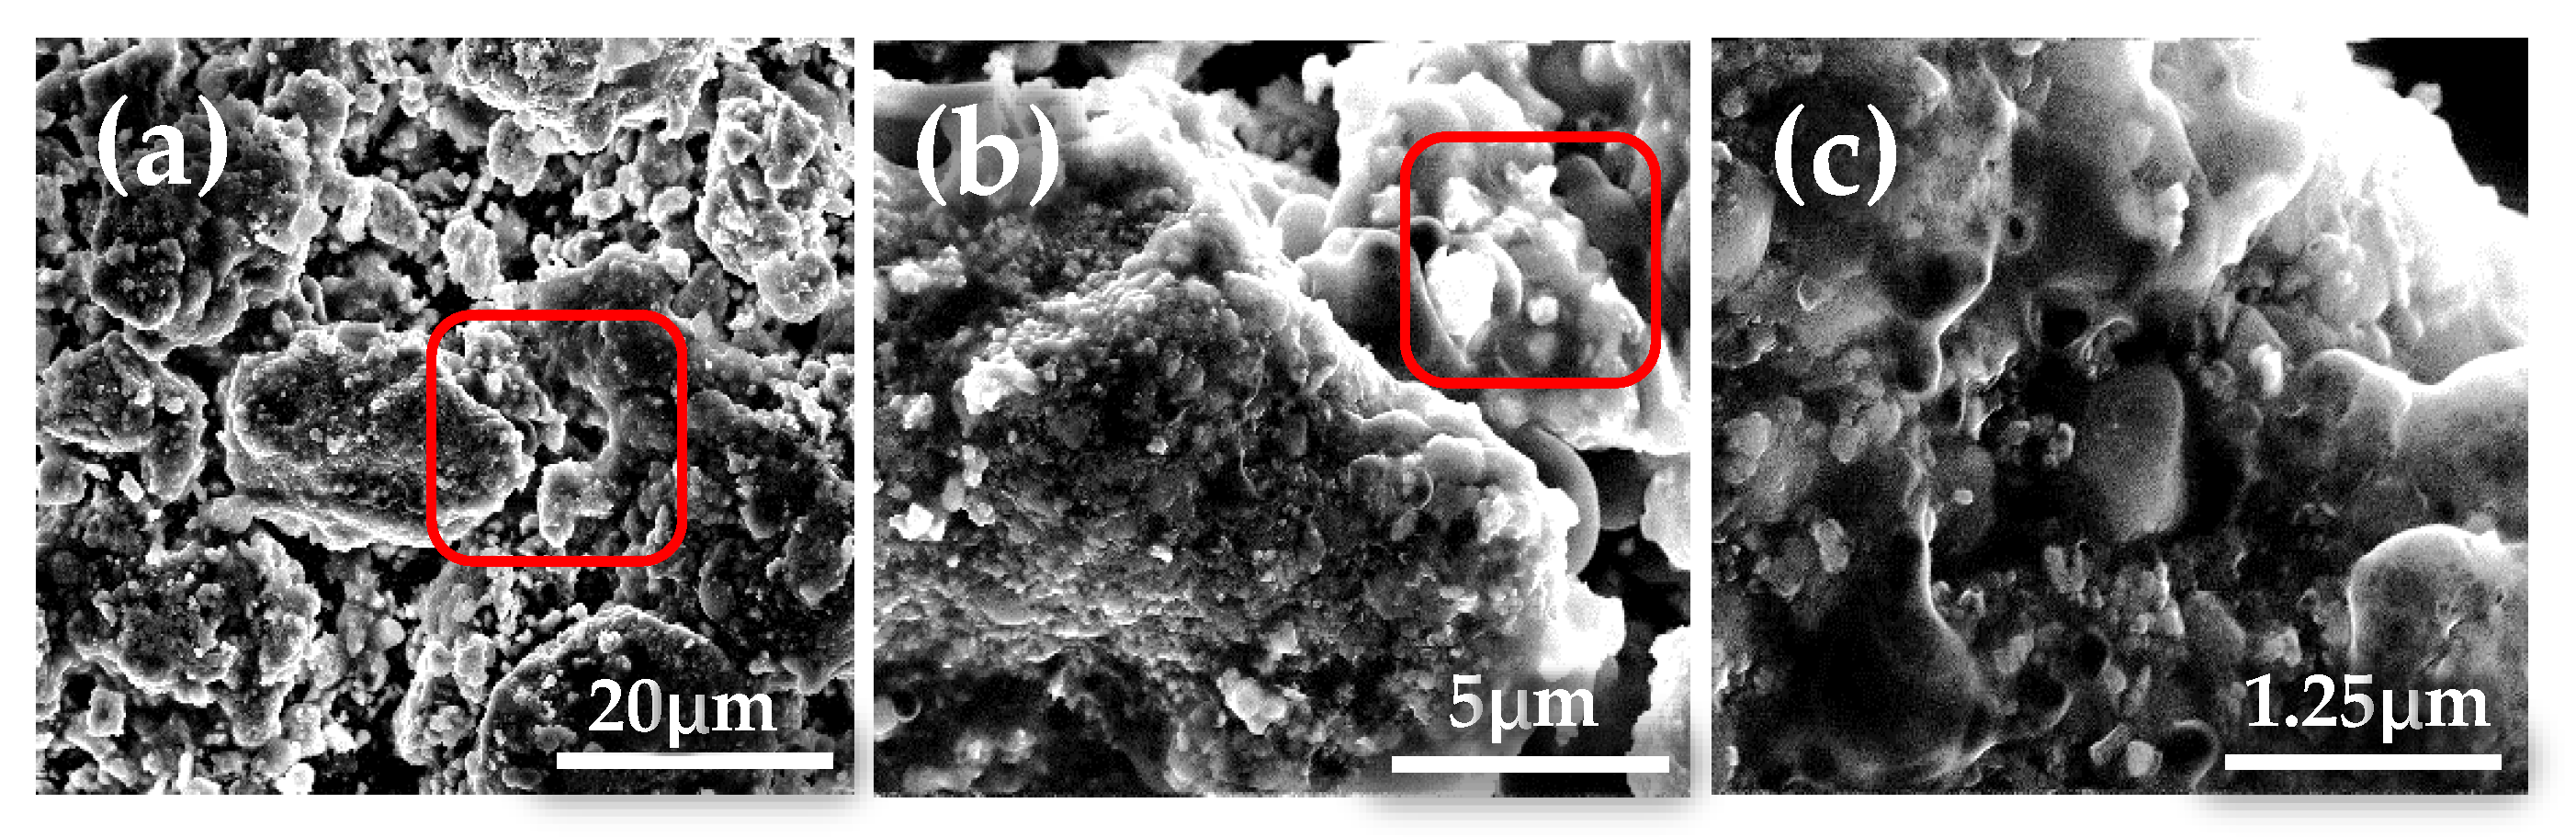
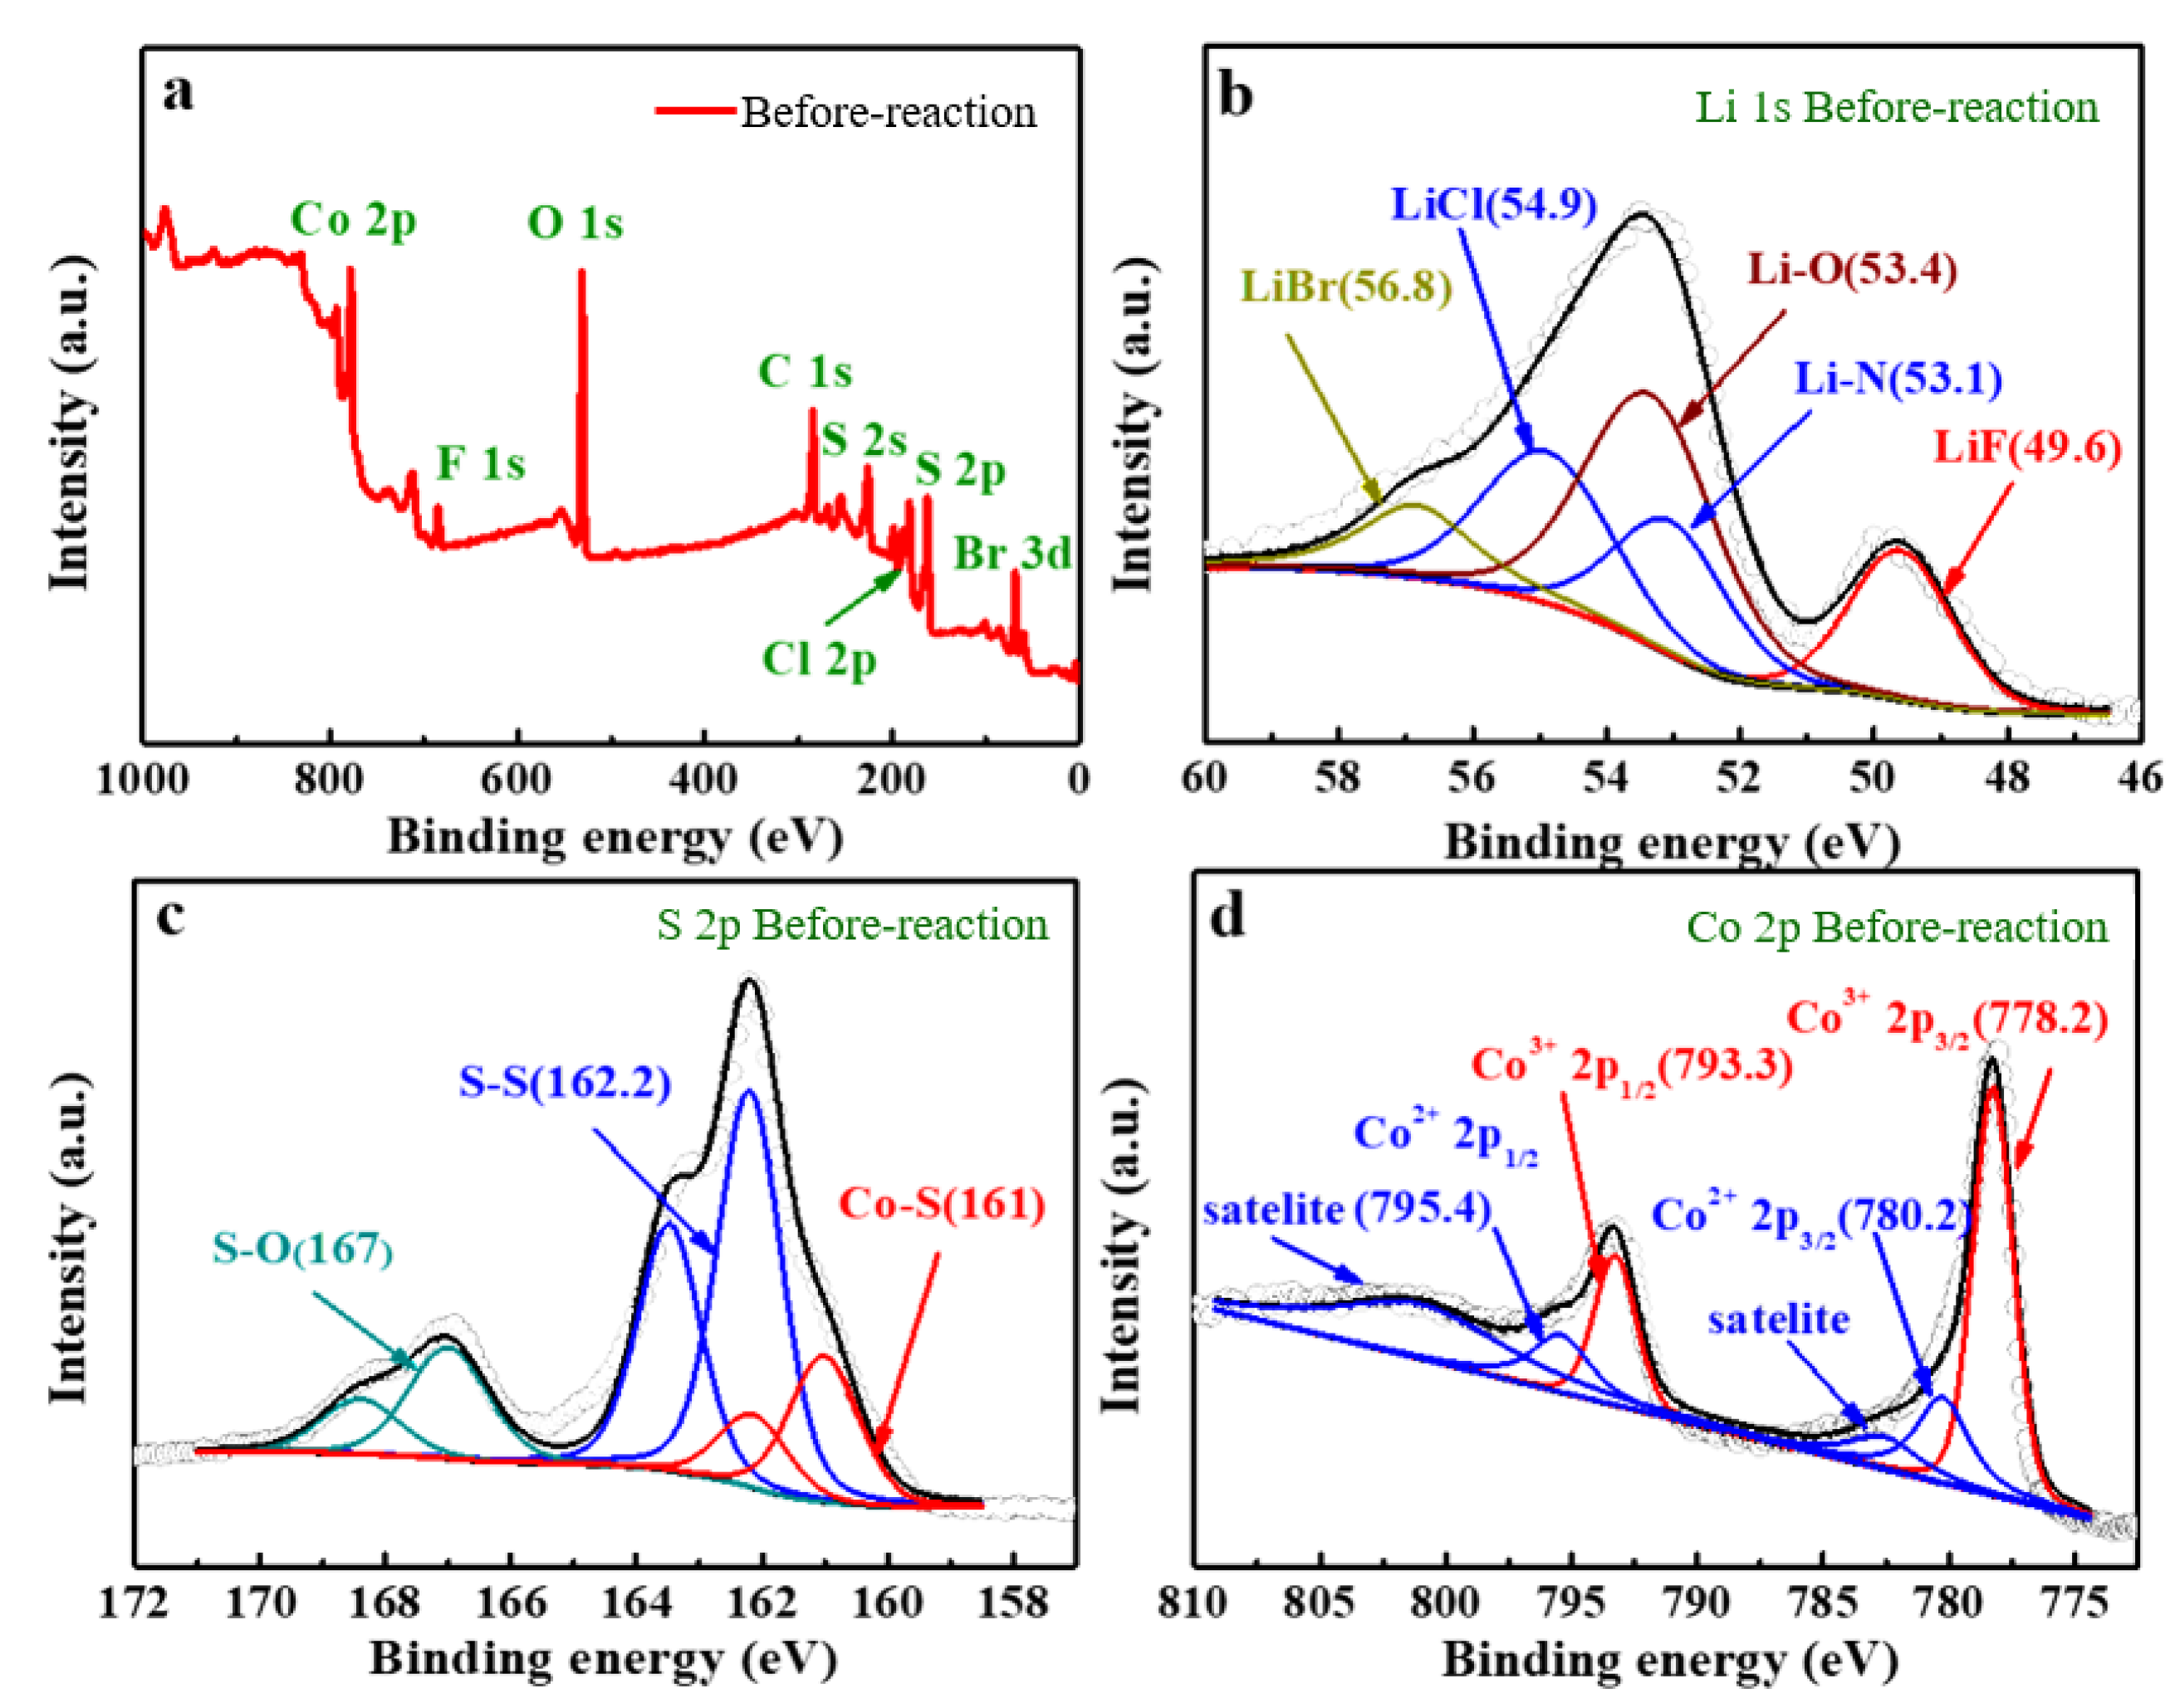
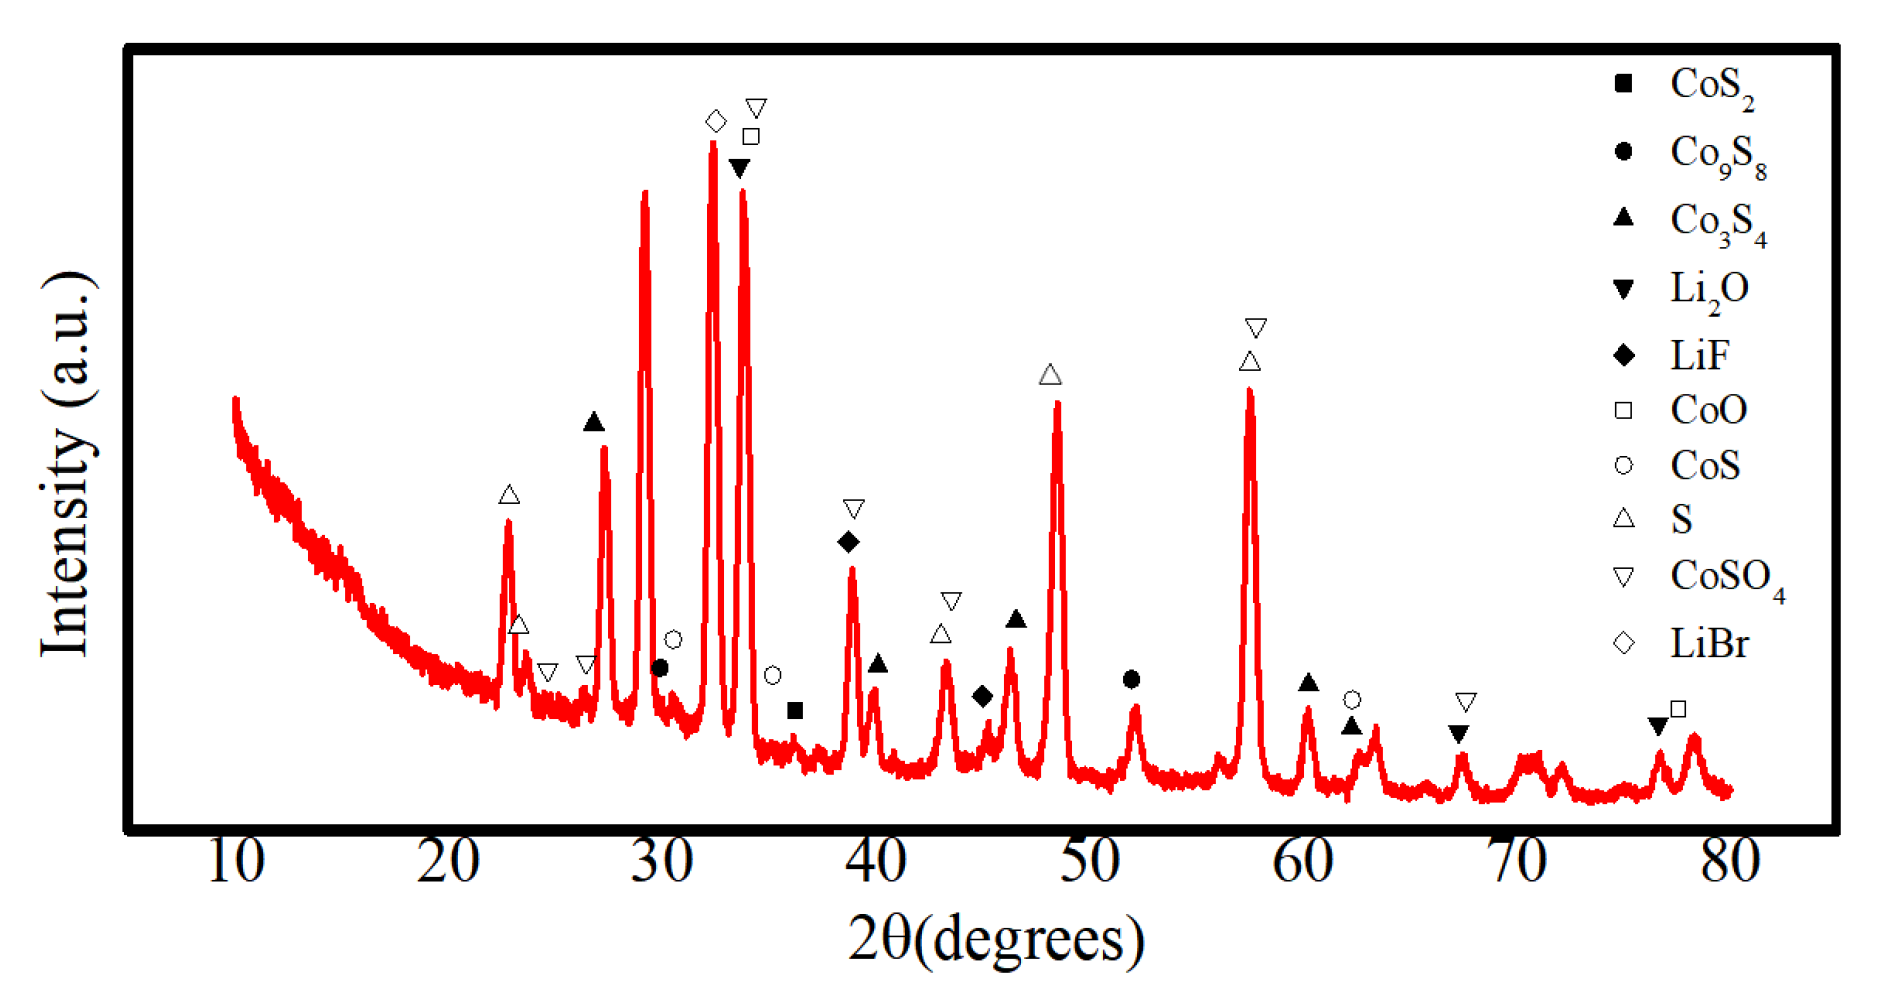
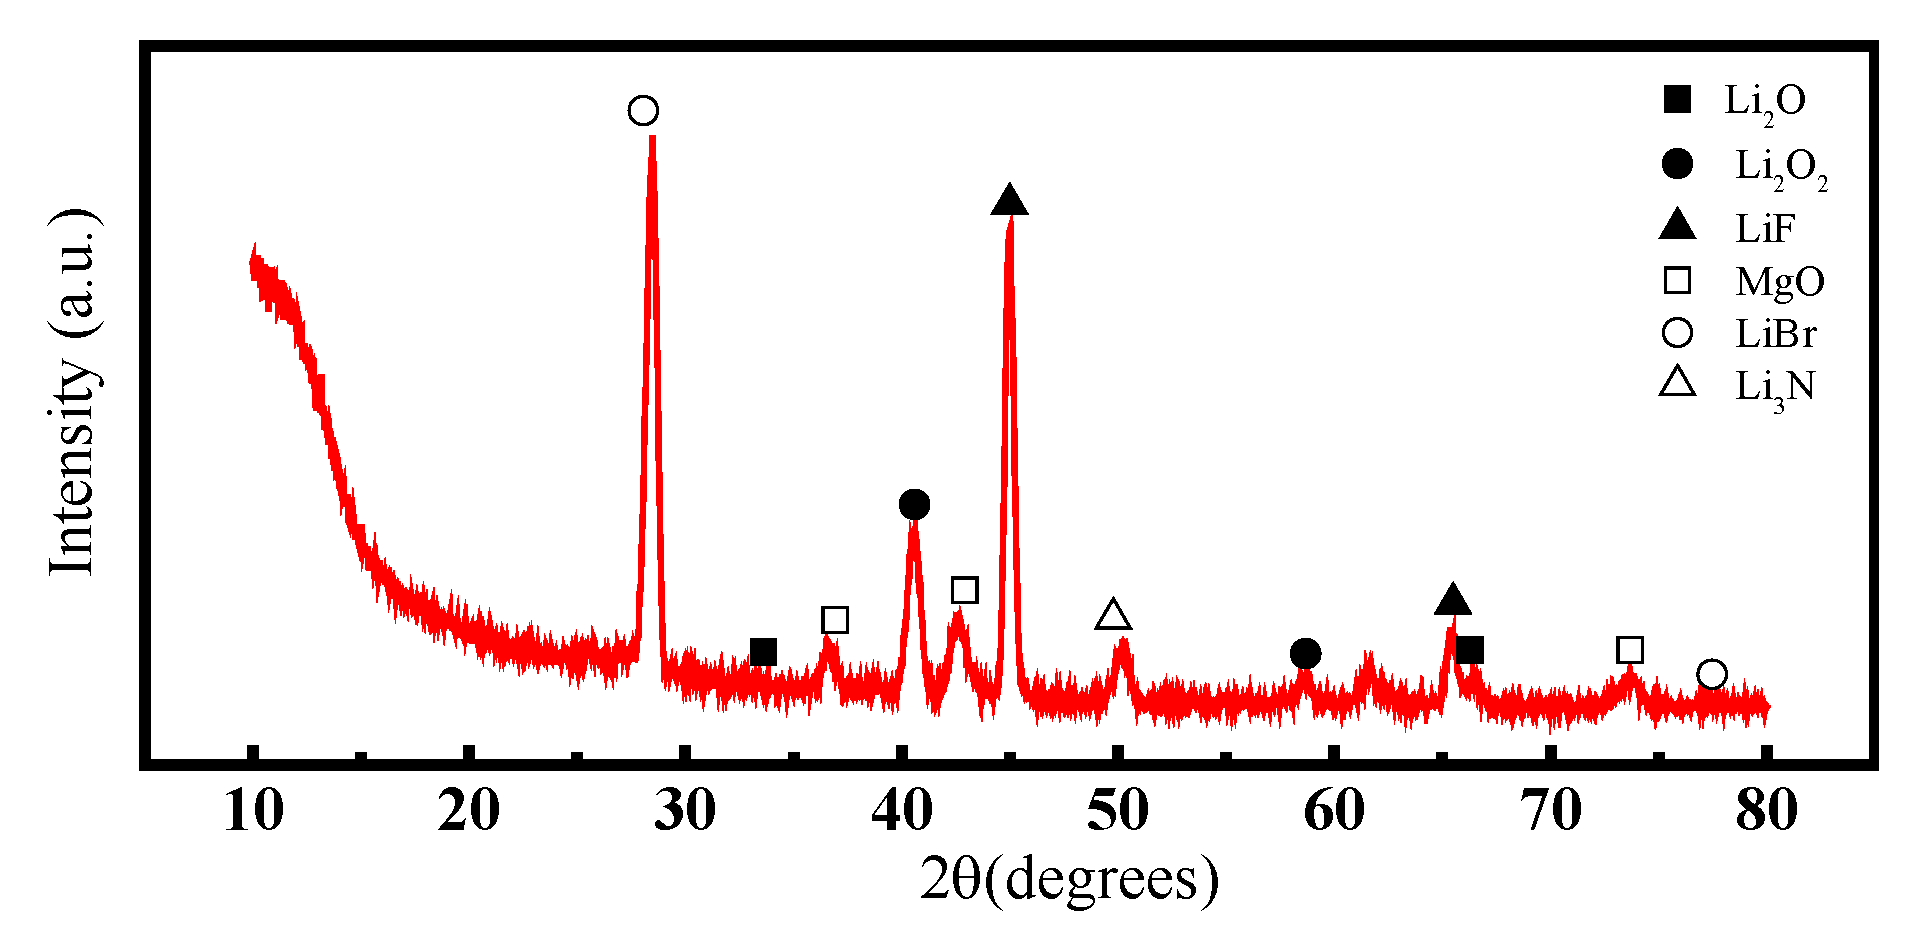
- The analysis mechanism indicates two main discharge platforms for CoS2 thermal battery discharge. The first platform yields the Co3S4 phase while the second platform produces phases of Co9S8 and Co monomer. The discharge process of this sample transitions from CoS2 to Co3S4 and Co9S8, along with a small quantity of Co monomers, as confirmed by XRD and XPS analysis. After the reaction, the electrolyte material consists mainly of LiF, LiBr, and LiCl and the crystal components remain largely unchanged. However, noticeable porous and loose morphologies are present, indicating significant changes in morphology during the melting process;
- The discharge reaction of the positive electrode was incomplete, resulting in reduced CoS2 residue in the thermal battery monomer after service. The reaction yielded a combination of Co3S4, Co9S8, and small amounts of Co monomers, indicating possible inconsistencies in the phase composition of the pole piece during the reaction process;
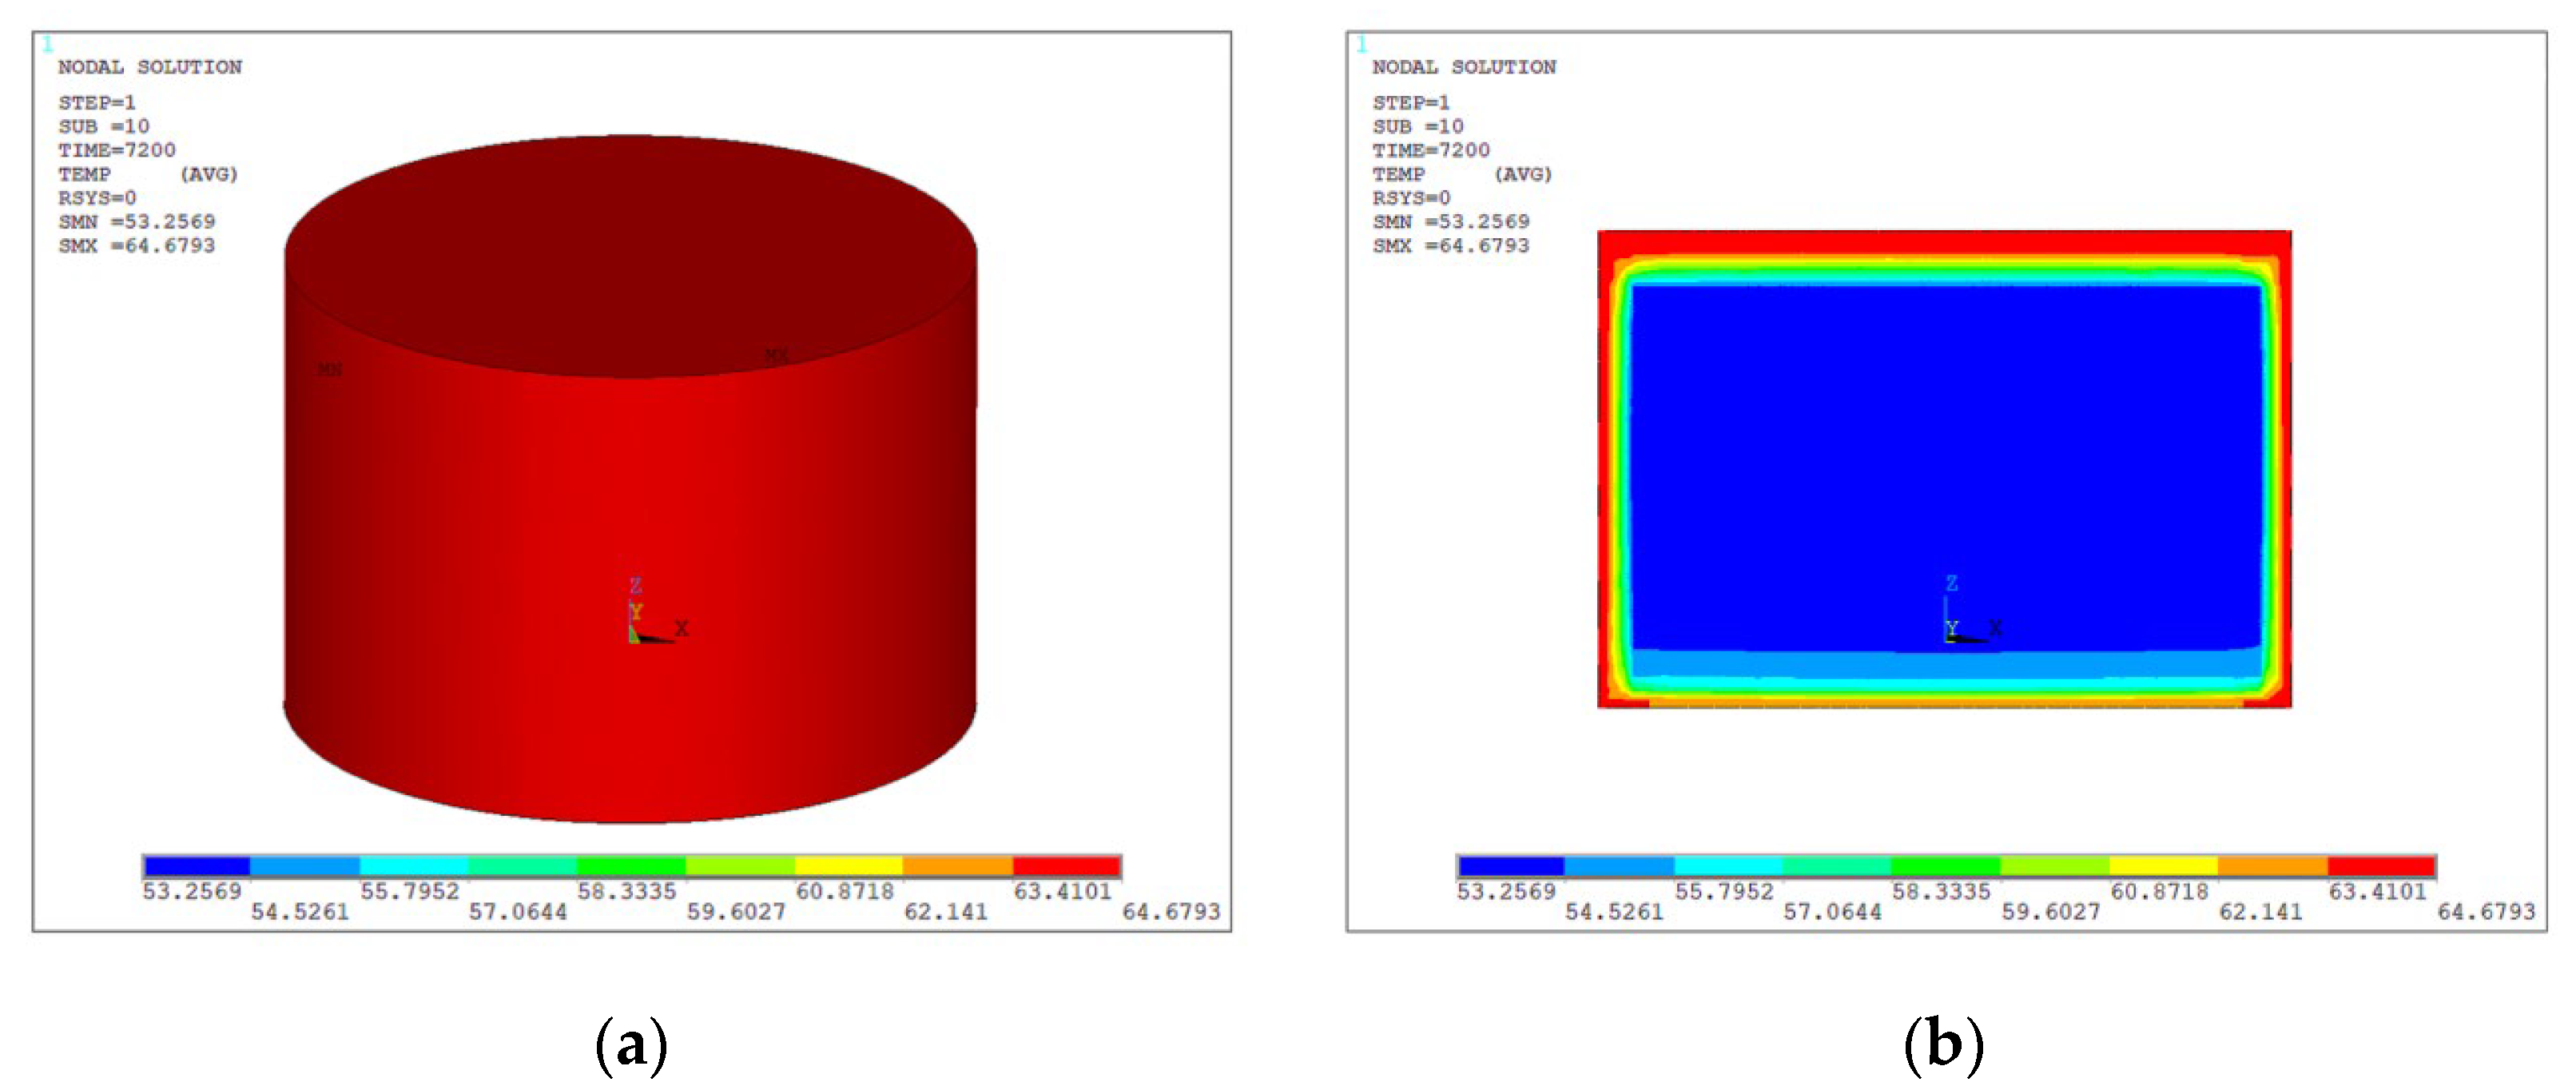
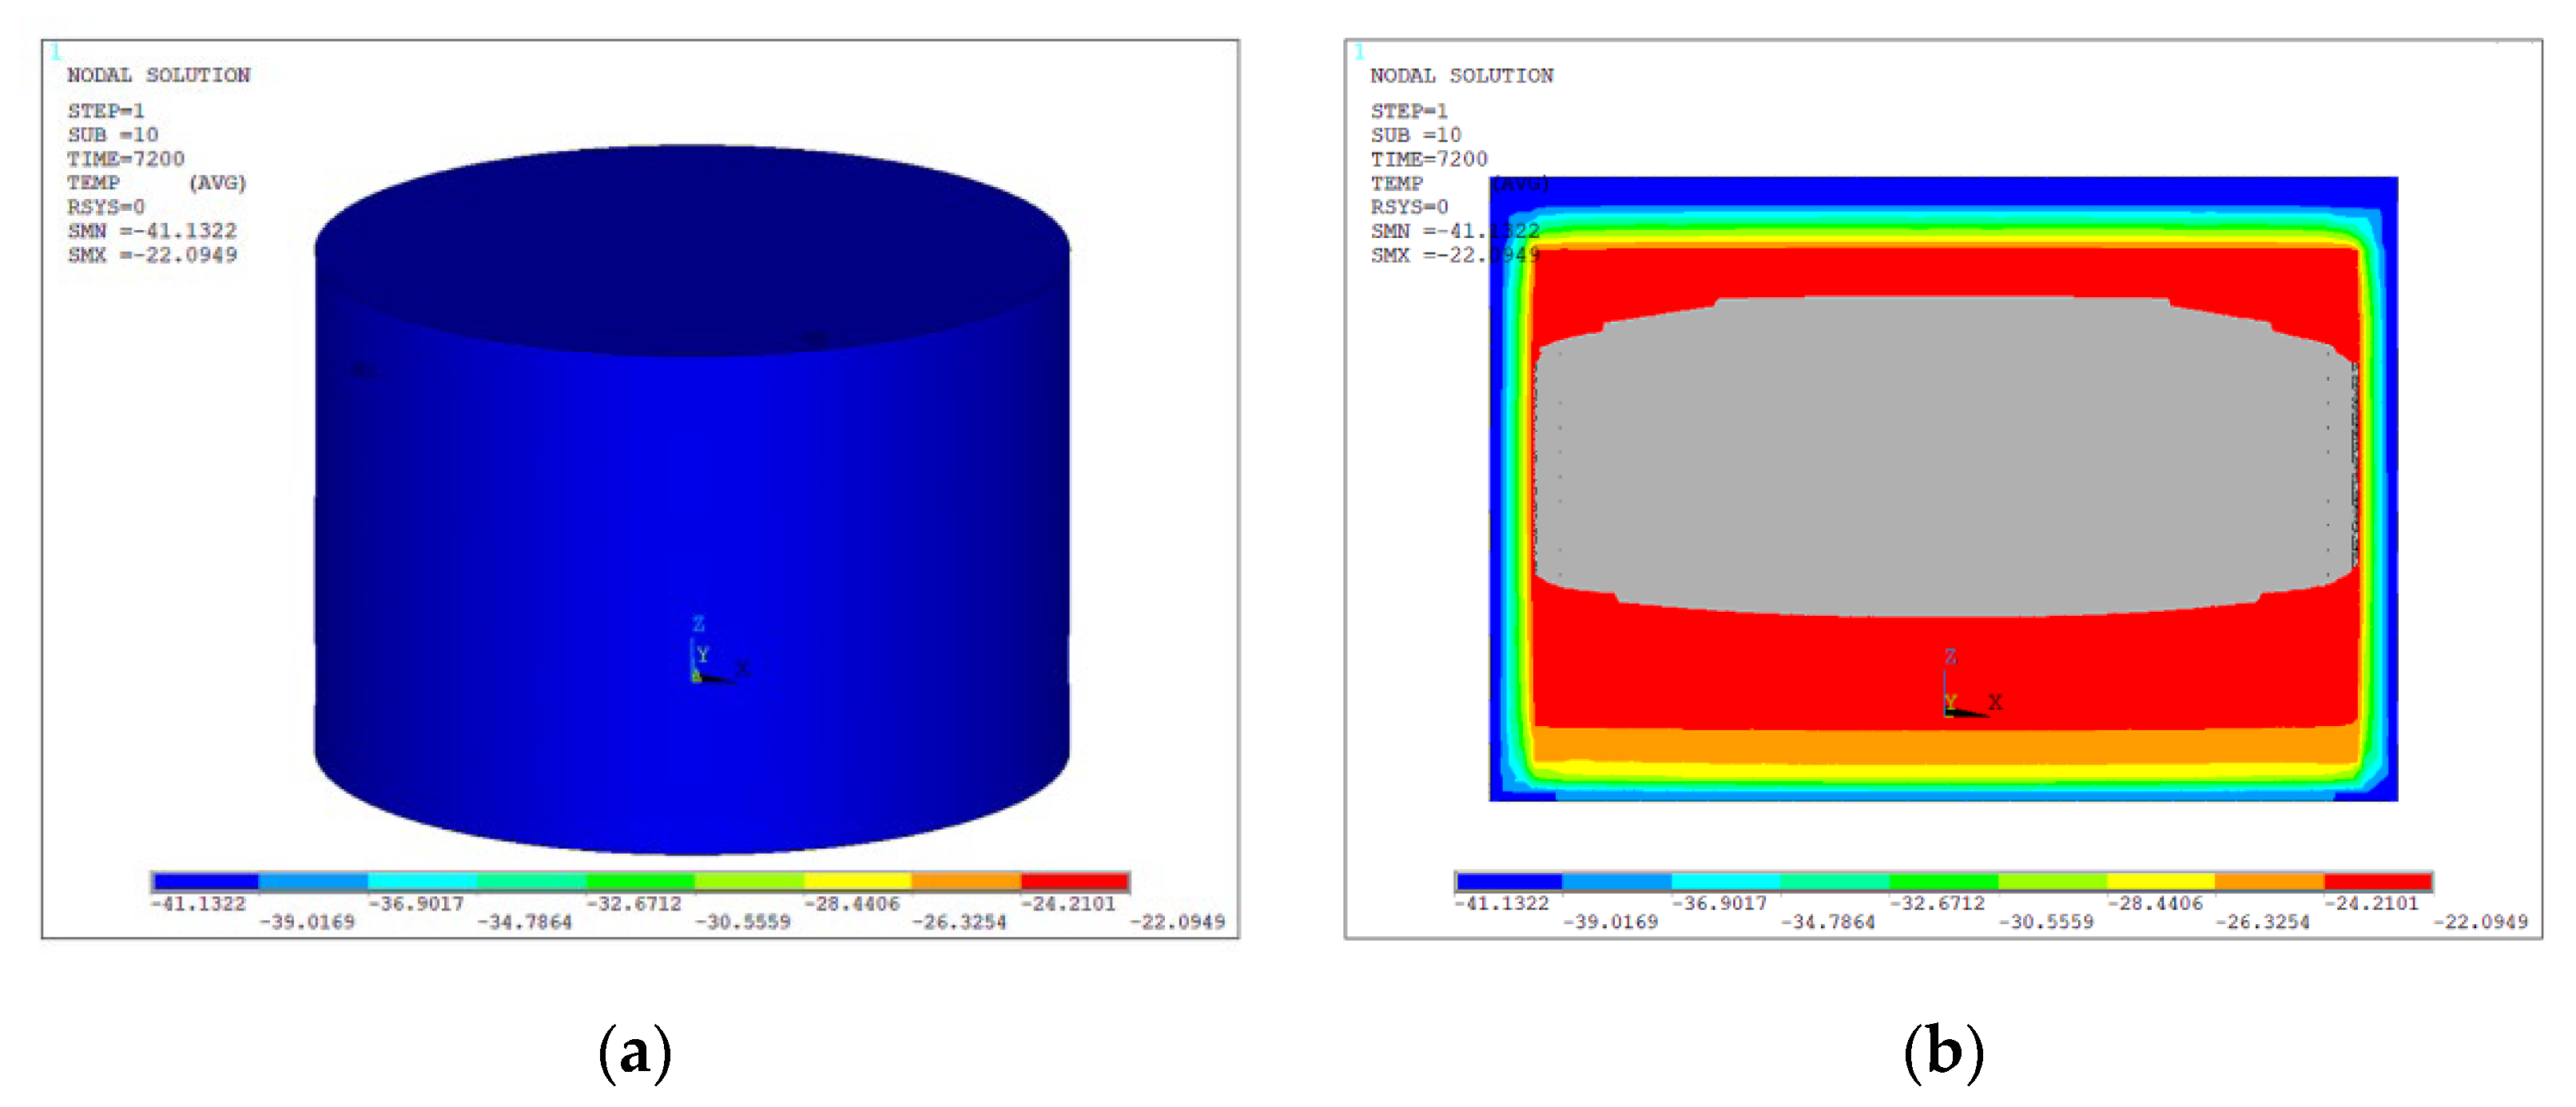
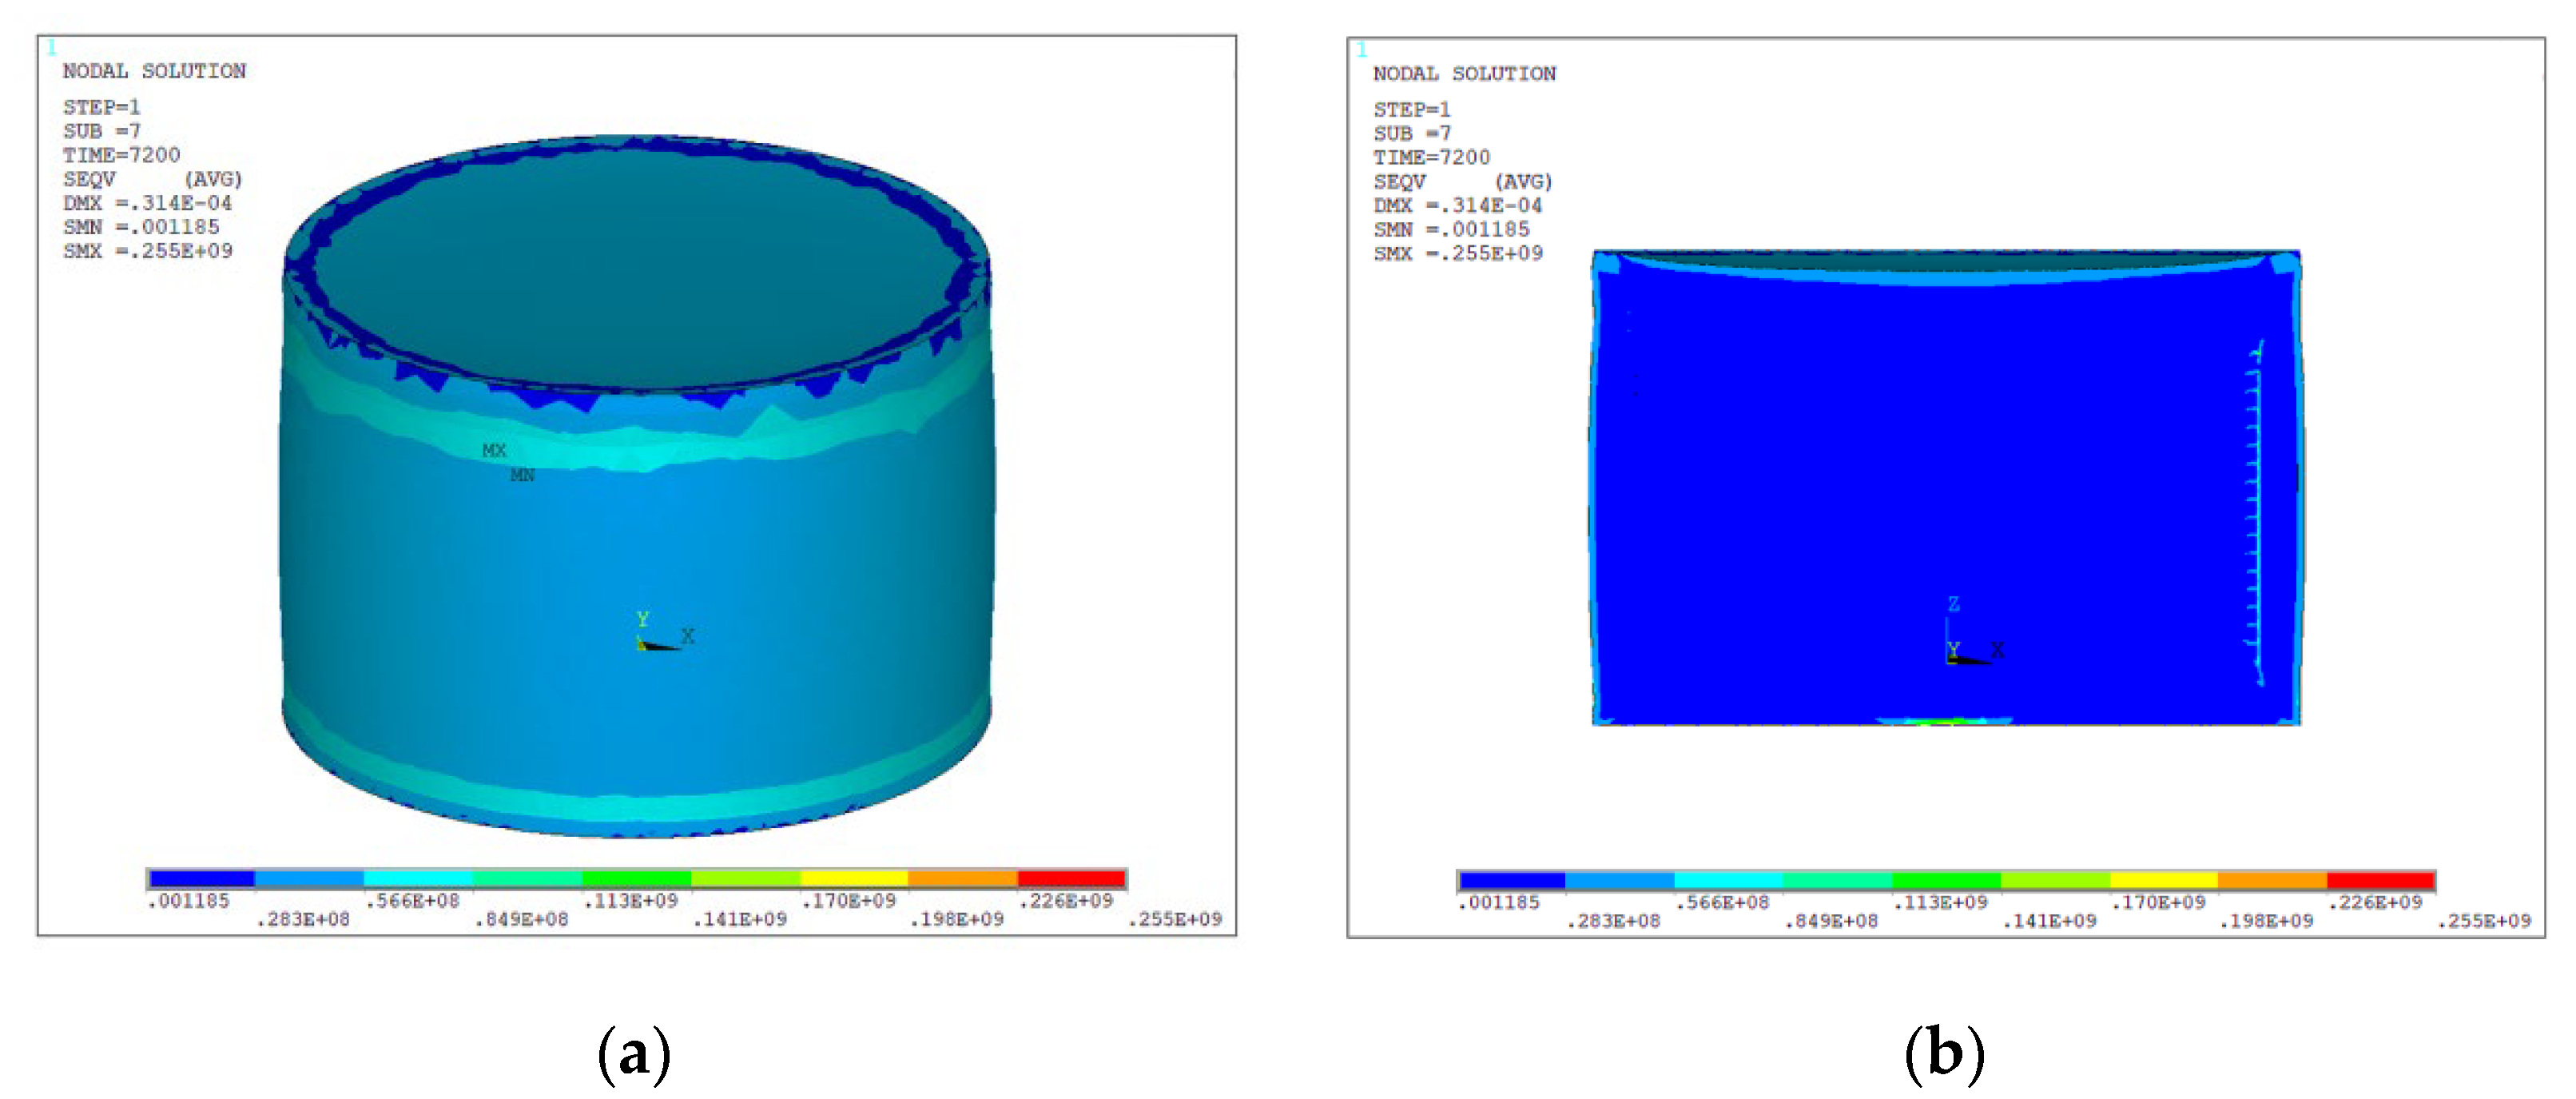
- The simulation results indicate that exposure to a 70 °C environment for 2 h causes the maximum residual stress of the battery, which had an initial temperature of 25 °C, to reach 0.26GPa. The thermal battery subjected to an initial temperature of 25 °C exhibited a maximum residual stress of 0.42 GPa subsequent to a 2—hour exposure to a temperature of −50 °C.
Author Contributions
Funding
Data Availability Statement
Conflicts of Interest
References
- Gao, Q.; Zhao, J. Development of Military Reserve Battery and its Detection Technology. Mar. Electr. Electron. Eng. 2021, 41, 1–4. [Google Scholar]
- Lv, K.; Zhao, P. Research status on thermal battery cathode materials. Chin. Battery Ind. 2012, 17, 189–192. [Google Scholar]
- Wei, L.; Lu, Z.; Cao, F.; Zhang, L.; Yang, X.; Yu, X.; Jin, L. A comprehensive study on thermal conductivity of the lithium—ion battery. Int. J. Energy Res. 2020, 44, 9466–9478. [Google Scholar] [CrossRef]
- Payne, J.L.; Giagloglou, K.; Carins, G.M.; Crouch, C.J.; Percival, J.D.; Smith, R.I.; Gover, R.K.B.; Irvine, J.T.S. In-situ Studies of High Temperature Thermal Batteries: A Perspective. Energy. Res. 2018, 6, 116–121. [Google Scholar] [CrossRef]
- Afzal, A.; Abdul Razak, R.K.; Mohammed Samee, A.D.; Kumar, R.; Ağbulut, Ü.; Park, S.G. A critical review on renewable battery thermal management system using heat pipes. Therm. Anal. Calorim. 2023, 148, 8403–8442. [Google Scholar] [CrossRef]
- Ge, Y.X.; Luo, C.X.; Zheng, X.; Liu, J.K. CoxNi1-xCl2 allomeric nanosheets with high specific surface area and excellent energy storage performance for cathode materials of thermal batteries. J. Power Sources 2023, 233, 584–598. [Google Scholar] [CrossRef]
- Ko, J.; Kang, S.H.; Cheong, H.W.; Yoon, Y.S. Recent Progress in Cathode Materials for Thermal Batteries. J. Korean Ceram. Soc. 2019, 56, 233–255. [Google Scholar] [CrossRef]
- Giagloglou, K.; Payne, J.L.; Crouch, C.; Gover, R.K.B.; Connor, P.A.; Irvine, J.T.S. Transition Metal Chlorides NiCl2, KNiCl3, Li6VCl8 and Li2MnCl4 as Alternative Cathode Materials in Primary Li Thermal Batteries. J. Electrochem. Soc. 2018, 165, 3510–3516. [Google Scholar] [CrossRef]
- Li, R.; Guo, W.; Qian, Y. Recent Developments of Cathode Materials for Thermal Batteries. Front. Chem. 2022, 10, 832–972. [Google Scholar] [CrossRef]
- Tian, Q.; Wang, J.; Xiang, W.; Zhao, J.; Guo, H.; Hu, J.; Han, X.; Hu, W. Fabrication of the Ni-NiCl2 Composite Cathode Material for Fast-Response Thermal Batteries. Front. Chem. 2021, 9, 213–231. [Google Scholar] [CrossRef]
- Rao, Z.; Wang, S. A review of power battery thermal energy management. Renew. Sustain. Energy Rev. 2011, 15, 4554–4571. [Google Scholar] [CrossRef]
- Al Miaari, A.; Ali, H.M. Batteries temperature prediction and thermal management using machine learning: An overview. Energy Rep. 2023, 10, 2277–2305. [Google Scholar] [CrossRef]
- Al-Zareer, M.; Dincer, I.; Rosen, M.A. A review of novel thermal management systems for batteries. Int. J. Energy Res. 2018, 42, 3182–3205. [Google Scholar] [CrossRef]
- Kim, J.; Lee, H. Review on battery thermal management system for electric vehicles. Appl. Therm. Eng. 2019, 149, 192–212. [Google Scholar] [CrossRef]
- Bhutto, Y.A.; Pandey, A.K.; Saidur, R.; Sharma, K.; Tyagi, V.V. Critical insights and recent updates on passive battery thermal management system integrated with nano-enhanced phase change materials. Mater. Today Sustain. 2023, 23, 412–443. [Google Scholar] [CrossRef]
- Masset, P.; Guidotti, R.A. Thermal activated (thermal) battery technology. J. Power Sources 2007, 164, 397–414. [Google Scholar] [CrossRef]
- Shahid, S.; Agelin–Chaab, M. A review of thermal runaway prevention and mitigation strategies for lithium-ion batteries. Energy Convers. Manag. X 2022, 16, 286–310. [Google Scholar]
- Can, A.; Selimefendigil, F.; Öztop, H.F. A review on soft computing and nanofluid applications for battery thermal management. J. Energy Storage 2022, 53, 205–214. [Google Scholar] [CrossRef]
- Takatsuka, S.; Oshitani, M. Thermally Activated Batteries: Overview. Encycl. Electrochem. Power Sources 2009, 35, 129–136. [Google Scholar]
- Feng, X.; Zheng, S.; Ren, D.; He, X.; Wang, L.; Liu, X.; Li, M.; Ouyang, M. Key Characteristics for Thermal Runaway of Li-ion Batteries. Energy Procedia 2019, 158, 4684–4689. [Google Scholar] [CrossRef]
- Yilbas, B.S.; Anwar, M.K.; Al-Sharafi, A. Innovative Design of a Thermal Battery: Influence of Carbon Nanotubes Concentration on Thermal Storage Characteristics. Int. J. Thermophys. 2018, 39, 112–134. [Google Scholar] [CrossRef]
- Alhanouti, M.; Giebler, M.; Blank, T.; Gauterin, F. New Electro-Thermal Battery Pack Model of an Electric Vehicle. Energies 2016, 9, 563. [Google Scholar] [CrossRef]
- Butler, P.; Guidotti, R.; Masset, P. Thermally Activated Batteries. Calcium 2019, 34, 98–107. [Google Scholar]
- Zhang, Y.; Liang, F.; Li, S.; Zhang, C.; Zhang, S.; Liu, X.; Zhao, S.; Yang, S.; Xia, Y.; Lin, J.; et al. A review on battery thermal management and its digital improvement-based cyber hierarchy and interactional network. Int. J. Energy Res. 2022, 46, 11529–11555. [Google Scholar] [CrossRef]
- Li, G.; Zhou, G.; Zhuang, Z.; Li, Z.; Xiao, Y. Failure Mode and Accelerated Storage Test of Thermally Activated Battery. Equip. Environ. Eng. 2022, 19, 21–26. [Google Scholar]
- Xing, Y.; Xie, X.; Zhao, J.; Wang, Y. Influence of high temperature accelerated storage on properties of thermal battery. Chin. J. Power Sources 2012, 36, 999–1001. [Google Scholar]
- Chong, J.; Dong, J.; Cao, J.; Dong, S.; Zhang, W.; Zhao, J.; Zhu, J. Study on the storage life of Lix(M)/FeS2 thermal battery. Chin. J. Power Sources 2004, 10, 621–625. [Google Scholar]
- Ye, D.; Wang, C. Thermal simulation of thermal battery structural components based on multi-field coupling conditions. Chem. Eng. Equip. 2018, 04, 4–6. [Google Scholar]
- Zhou, W.; Xiao, X.; Wang, R.; Liu, Z.; Yi, J. Thermal battery assembly defect detection based on image recognition. Manuf. Autom. 2022, 44, 87–91. [Google Scholar]
- Wang, C.; Zhang, X.; Cui, Y.; He, K.; Cao, Y.; Liu, X.; Zeng, C. A system-level thermal-electrochemical coupled model for evaluating the activation process of thermal batteries. Appl. Energy 2022, 328, 120–177. [Google Scholar] [CrossRef]
- Christen, R.; Rizzo, G.; Gadola, A.; Stöck, M. Test Method for Thermal Characterization of Li-Ion Cells and Verification of Cooling Concepts. Batteries 2017, 3, 3. [Google Scholar] [CrossRef]
- Diao, W.; Xing, Y.; Saurabh, S.; Michael, P. Evaluation of Present Accelerated Temperature Testing and Modeling of Batteries. Appl. Sci. 2018, 8, 1786. [Google Scholar] [CrossRef]
- El, Ouaragli, J.; Xiao, Z.; Tao, M.; Granados-Focil, S.; Van, Dessel, S. A novel passive polymer-sorbent thermal battery for low-temperature energy applications: A numerical feasibility study. J. Energy Storage 2022, 56, 968–971. [Google Scholar]
- Wang, G.; Gao, W.; He, X.; Peng, R.; Zhang, Y.; Dai, X.; Ping, P.; Kong, D. Numerical investigation on thermal runaway propagation and prevention in cell-to-chassis lithium-ion battery system. Appl. Therm. Eng. 2023, 236, 502–528. [Google Scholar] [CrossRef]
- Qiu, W.; Li, G.; Ouyang, C.; Zeng. Simulation and Experimental investigation of Battery Thermal Management System for a Hybrid Vehicle. IOP Conf. Ser. Environ. Sci. 2021, 631, 72–93. [Google Scholar] [CrossRef]
- Zhu, Y.; Li, K.; Kang, E.; Quan, T.; Sun, T.; Luo, J.; Zhao, S. Simulation Investigation on Thermal Characteristics of Thermal Battery Activation Process Based on COMSOL. Crystals 2023, 13, 641. [Google Scholar] [CrossRef]


| Geometric Parameter | Designation | Reference Value (mm) | |
|---|---|---|---|
| Positive electrode | Radius | R1 | 50 |
| Electrolyte | R2 | ||
| Negative electrode | R3 | 3 | |
| Collector plate-4 | R4 | 50 | |
| Iron powder | R5 | ||
| Positive electrode | Height | H1 | 1 |
| Electrolyte | H2 | 1.5 | |
| Negative electrode | H3 | 0.5 | |
| Collector plate-4 | H4 | ||
| Iron powder | H5 | 1 |
| Geometric Parameter | Designation | Reference Value (mm) | |
|---|---|---|---|
| Asbestos cushion-1 | Radius | R6 | 50 |
| Upper fixing plate | R8 | ||
| Zircon powder heater-1 | R9 | 3 | |
| Under the side insulation layer | R12 | 50 | |
| Asbestos cushion-1 | Height | H6 | 2 |
| Upper fixing plate | H8 | 3 | |
| Zircon powder heater-1 | H9 | 1.5 | |
| Lower fixing plate | H12 | 2 | |
| Upper insulation layer | H18 | 6 | |
| Under the side insulation layer | H19 | 2 | |
| Air layer | Thickness | T16 | 1.5 |
| Side insulation layer | T17 | 3 | |
| Battery case | T20 | 1 |
| Material | Modulus of Elasticity (GPa) | Poisson’s Ratio | Density (g/cm3) | Thermal Conductivity [W/(m·°C)] | Specific Heat Capacity [J/(kg·°C)] | Coefficient of Thermal Expansion (10−6/°C) | |
|---|---|---|---|---|---|---|---|
| Positive electrode | 10 | 0.33 | 2.76 | 1.02 | 740 | 1 | |
| Electrolyte | 2.49 | 1.22 | 870 | ||||
| Negative electrode | 1.00 | 27.4 | 3330 | ||||
| Stainless steel (current collector, upper fixing plate, lower fixing plate, fixed connection strip, battery case) | 197 | 0.27 | 7.86 | 21.64 | 480 | 13 | |
| Iron powder | 150 | 0.25 | 3.75 | 21.85 | 710 | 10 | |
| Asbestos cushion | 1 | 0.33 | 1.00 | 0.2 | 1000 | 1 | |
| Zircon powder heater | 1 | 10 | 0.33 | 1.07 | 1 | 2000 | 1 |
| 2 | 1.45 | ||||||
| 3 | |||||||
| 4 | 1.60 | ||||||
| Air layer | 10−9 | 0.33 | 1.21 | 0.0257 | 1005 | 10−54 | |
| Side insulation layer | 10 | 0.33 | 0.26 | 0.03 | 1100 | 1 | |
| Upper and lower insulation layers | 0.86 | 0.05 | 1200 | ||||
| Working Condition 1 | Working Condition 2 | |
|---|---|---|
| Initial temperature (°C) | 25 | 25 |
| Ambient temperature (°C) | 70 | −50 |
| Duration of the test (h) | 2 | 2 |
| Coefficient of convective heat transfer [W/(m2·°C)] | 13.8 | 13.8 |
Disclaimer/Publisher’s Note: The statements, opinions and data contained in all publications are solely those of the individual author(s) and contributor(s) and not of MDPI and/or the editor(s). MDPI and/or the editor(s) disclaim responsibility for any injury to people or property resulting from any ideas, methods, instructions or products referred to in the content. |
© 2024 by the authors. Licensee MDPI, Basel, Switzerland. This article is an open access article distributed under the terms and conditions of the Creative Commons Attribution (CC BY) license (https://creativecommons.org/licenses/by/4.0/).
Share and Cite
Su, W.; Chen, M.; Wang, Z.; Zhong, B.; Nie, Z. Failure Mechanism and Residual Stress Analysis of Crystal Materials for the Thermal Battery. Crystals 2024, 14, 198. https://doi.org/10.3390/cryst14020198
Su W, Chen M, Wang Z, Zhong B, Nie Z. Failure Mechanism and Residual Stress Analysis of Crystal Materials for the Thermal Battery. Crystals. 2024; 14(2):198. https://doi.org/10.3390/cryst14020198
Chicago/Turabian StyleSu, Wei, Ming Chen, Zhizhe Wang, Butian Zhong, and Zhenhua Nie. 2024. "Failure Mechanism and Residual Stress Analysis of Crystal Materials for the Thermal Battery" Crystals 14, no. 2: 198. https://doi.org/10.3390/cryst14020198
APA StyleSu, W., Chen, M., Wang, Z., Zhong, B., & Nie, Z. (2024). Failure Mechanism and Residual Stress Analysis of Crystal Materials for the Thermal Battery. Crystals, 14(2), 198. https://doi.org/10.3390/cryst14020198