Article

Axial Vibration Control Technique for Crystal Growth from the Melt: Analysis of Vibrational Flows’ Behavior

1
Department of Chemistry and Technology of Crystals, D. Mendeleev University of Chemical Technology of Russia (MUCTR), 125480 Moscow, Russia
2
Prokhorov General Physics Institute of the Russian Academy of Sciences, 119991 Moscow, Russia
*
Author to whom correspondence should be addressed.
Crystals 2024, 14(2), 126; https://doi.org/10.3390/cryst14020126
Submission received: 30 December 2023 / Revised: 19 January 2024 / Accepted: 24 January 2024 / Published: 26 January 2024
(This article belongs to the Special Issue Modelling of Crystal Growth Processes)

Abstract

:
A problem of efficacy of crystal growth methods for crystallization from solutions or melt has been investigated. The axial vibrational control (AVC) technique was considered as a perspective method to manage both heat-mass transfer and chemical component composition of the melts in the case of crystallization of complex chemical compounds. Numerical modeling and the search for generalized dependencies made it possible to predict the AVC parameters that provide optimal heat and mass transfer modes for creating flat liquid-solid interfaces, as well as the component composition of dissociated melts of various chemical compounds—Ge, NaNO3, CdTe.

1. Introduction

Over the past 20 years, in the field of functional materials, there has been a market shift towards thin-film and nano-sized structures [1]. Nevertheless, the market for single crystals still continues to grow [2]. In spite of the progress in polycrystal technology, many properties which are found in single crystals cannot be replicated in polycrystals. In many practical applications, only single crystal materials are able to provide the required and record-breaking functional characteristics [3,4].
To date, single crystals of semiconducting materials are one of the most widely researched and used materials. In addition to Si and Ge, the single crystals of III–V semiconductors, due to their outstanding optical and electronic properties, are an integral part of devices for application in fiber-optic communication, wireless and satellite communication, solid-state lighting, etc. [5,6].
In this regard, the tasks of both improving quality, primarily structural, and reducing the cost of crystals are fundamental. Taking into account the fact that more than 90% of all mass-production single crystals are grown from the liquid phase (solution or melt growth methods), the issue of improving these methods is extremely relevant.
Numerous studies on improving of crystal growth methods by various types of mixing (ultrasonic [7,8], ACRT—accelerated crucible rotation technique [9], CVS—coupled vibrational stirring [10], rotating baffle [11], HFR—heat field rotation [12], TMF—travelling magnetic field [13], AHP—axial heat flux technique [14]) were mainly aimed at effective control of heat and mass transfer, creating conditions for obtaining a flat interface in the case of directional crystallization methods.
At the same time, the issue of control of chemical thermodynamics states in growth systems has been considered extremely infrequently [15].
A study of the influence of low-frequency vibrations on the equilibrium of chemical reactions [16] showed that a clear effect of chemical equilibrium control was possible. In ref. [17], when analyzing the crystals growth processes of chemical compounds, an explanation for this effect was given. It has been established that when an AVC is introduced into a liquid through harmonic vibrations of a solid chemically inert flat cylindrical disk, which has a sharp edge on a cylindrical generatrix, such high-energy flows are generated in the region of the sharp edge that the energy of viscous dissipation of liquid layers becomes comparable to the chemical interaction energy of clusters in the melt. The transformation of the mechanical energy of a moving liquid into chemical energy leads to a change in the chemical nature of the liquid phase, in particular, to a change in the component composition and destruction of associates in the melt. From this point of view, the AVC technique can be considered not only as an effective tool for organizing the required heat and mass transfer, but also as a tool for controlling the thermodynamic properties of the liquid phase.
The efficacy of the AVC technique application for growth of both dielectric [18,19], and semiconductor crystals [20] has been demonstrated. The application of the AVC technique made it possible to both improve the structural perfection of the grown crystals and increase the volumetric growth rate in several times. However, for each specific crystal and each method, the authors were forced to experimentally optimize the AVC modes to achieve the desired result.
Taking into account the above, it would be extremely desirable to have a generalized dependence of the influence of the parameters of the AVC method on the properties of flows in the liquid phase and their component composition. Optimization of the AVC method for growing crystals is a multi-parameter problem in which it is possible to distinguish the control parameters of the AVC technique (oscillation amplitude and frequency, disk geometry) and the parameters of a specific technology (properties of the crystallizing melt, geometry of the crystal growing method). To achieve the generalized dependence, first of all, it is necessary to establish the dependence of the speeds of vibration flows on the amplitude, frequency, density, and viscosity of the liquid for a cylindrical vibrating body with a different radius of edge rounding. To achieve this, this study excluded all factors such as free sur-face, thermal convection, and crystallization front, which are always present in a real environment of growth process and interfere with an objective assessment of the characteristics of vibration flows.

2. Numerical Model

To understand the nature of the vibratory flow formation and properties, we have excluded from consideration the thermal convection which always accompanies the melt crystal growth process by conducting the system analysis in ideal isothermal conditions. Numerical simulation was conducted using the ANSYS Fluent package and germanium. Cadmium telluride and sodium nitrate melt were considered as model substances. The AVC technique was realized by low-frequency harmonic oscillations of a cylindrical disk submerged into the melt. The disk is specified by three critical parameters: (1) diameter—D, (2) thickness—d, and (3) radius of the edge curvature between a cylindrical generatrix and a faceplate—R. It had been demonstrated that the R-value sufficiently influenced on average flows’ generation [18].

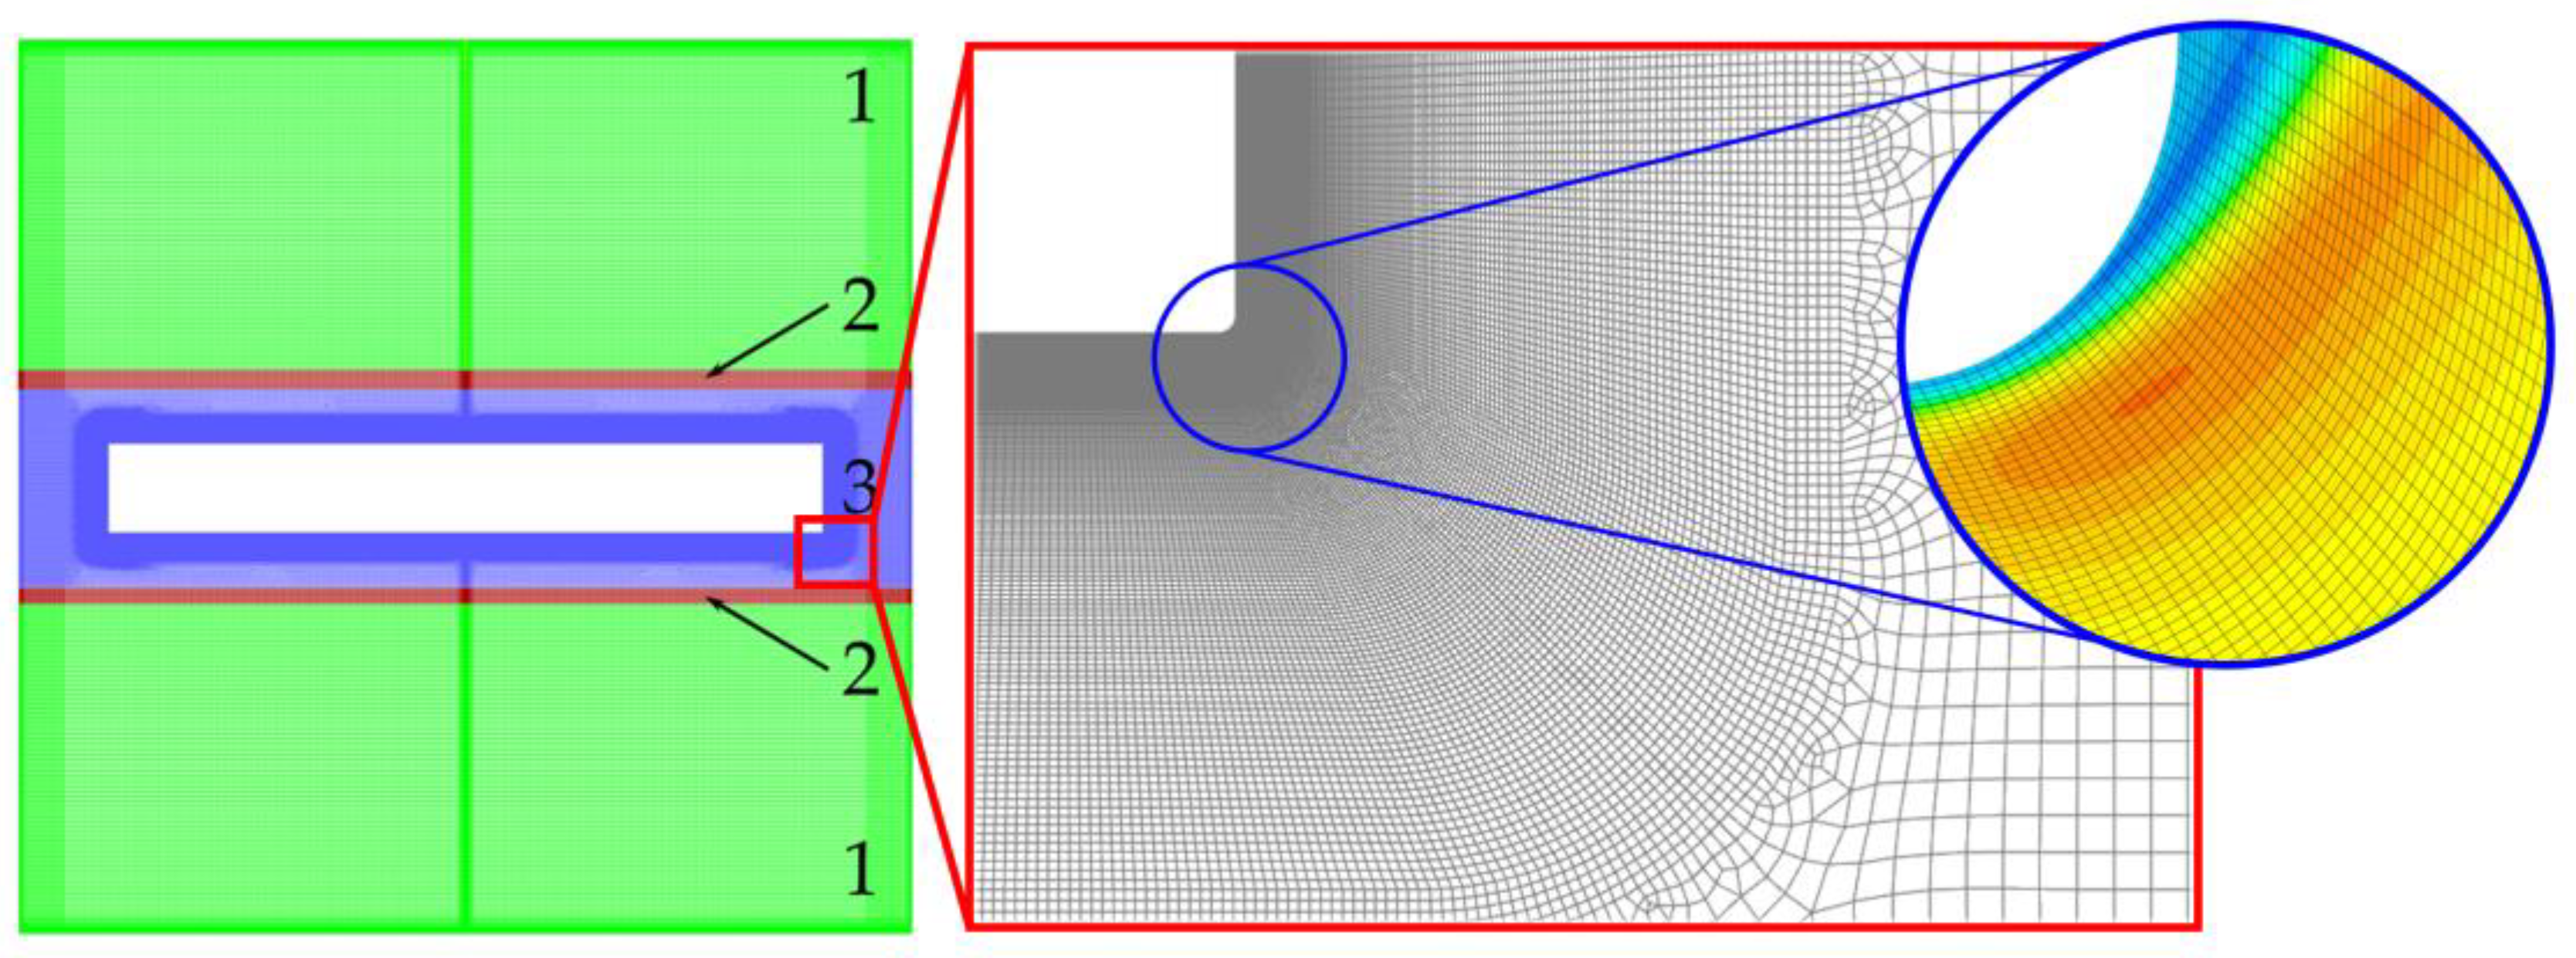
2.1. Model of Fluid Motion under the AVC Action

The analysis of the AVC technique was carried out by numerical modeling in a two-dimensional axisymmetric approximation using the geometric model shown in Figure 1. The grid model (see Figure 1 right) contains 187,000 cells for modeling half of the axially symmetric model with an average size of 0.3 mm in the region of the liquid phase with compaction of cell layers at the boundaries. The first mesh layer at the disk surface is 1.7 μm thick and the minimum cell size on the disk rounding is 4.9 μm with a gradual expansion into the main design volume. The dimensions of the geometric model are presented in Table 1.
The simulating area was divided into five zones (Figure 1 center). In a zone surrounding the vibrator—disk zone—the grid was moving with the vibrator as well. In the two zones belonging to the upper and lower ends of the crucible—stationary zones—grids were non-moving. There were two zones between the moving disk zone and the non-moving stationary zones at the crucible ends. In these zones, the grid was stretched and compressed with disk motion.
The velocity and pressure fields were calculated using the Navier–Stokes equation, supplemented by the continuity equation, at constant density and viscosity:
ρ v t + v · v = p + μ v ;
· v = 0 ,
here  ρ  represents the density of the melt,  v  represents the velocity of the moving melt,  p  represents the melt pressure,  μ  represents the melt dynamic viscosity coefficient.
The model was calculated under isothermal conditions:
T = const ,
here  T  represents the melt temperature.
Boundary conditions for a stationary wall were specified using no-slip boundary condition:
v n = 0 ,
here  n  represents the normal direction of the surface.
The oscillation of the disk along the z-axis was specified using the boundary condition for changing the speed:
v z = A ω · cos ω t ; v r = 0 ,
ω = 2 π f ,
here  v z  represents the velocity component of oscillating disk along z-axis,  v r  represents the velocity component of oscillating disk along r-axis,  A  represents the vibration amplitude,  ω  represents the angular frequency and  f  represents the vibration frequency.
The numerical integration of the system of differential equations was carried out using the finite volume method. The search for a solution was carried out using the iterative Gauss–Seidel method using the pressure-velocity separated SIMPLE scheme. The gradients were discretized using the least squares method. Spatial discretization of velocity and pressure was carried out according to a second-order scheme. Time discretization was carried out according to a first-order scheme. The disk movement was accompanied by the use of a dynamic mesh.
In this work, we used a UDF file that describes the motion of the mesh according to the following iterative formula:
x j i = x j i 1 + v z i · x j i 1 x 0 i 1 x n i 1 x 0 i 1 · t ,
here  x j i  represents the position of node j (from 0 to n) at the current time step i x j i 1  represents the position of node j (from 0 to n) at the previous time step i − 1;  x 0 i 1  represents the position of the fixed boundary of the deformable mesh zone at the previous time step i − 1;  x n i 1  represents the position of the moving boundary of the deformable zone at the previous time step i − 1;  v z i  represents the velocity of the disk from Equation (5) at the current time step I t  represents the time step.
The entire deformation procedure is determined by a single value of the current displacement of the disk relative to the average position; old and new coordinates of individual grid nodes are not stored separately anywhere; they are simply recalculated using a formula.

2.2. Material Properties

NaNO3, Ge and CdTe melts were used as model liquid phases. Their physicochemical properties are presented in Table 2.

3. Results

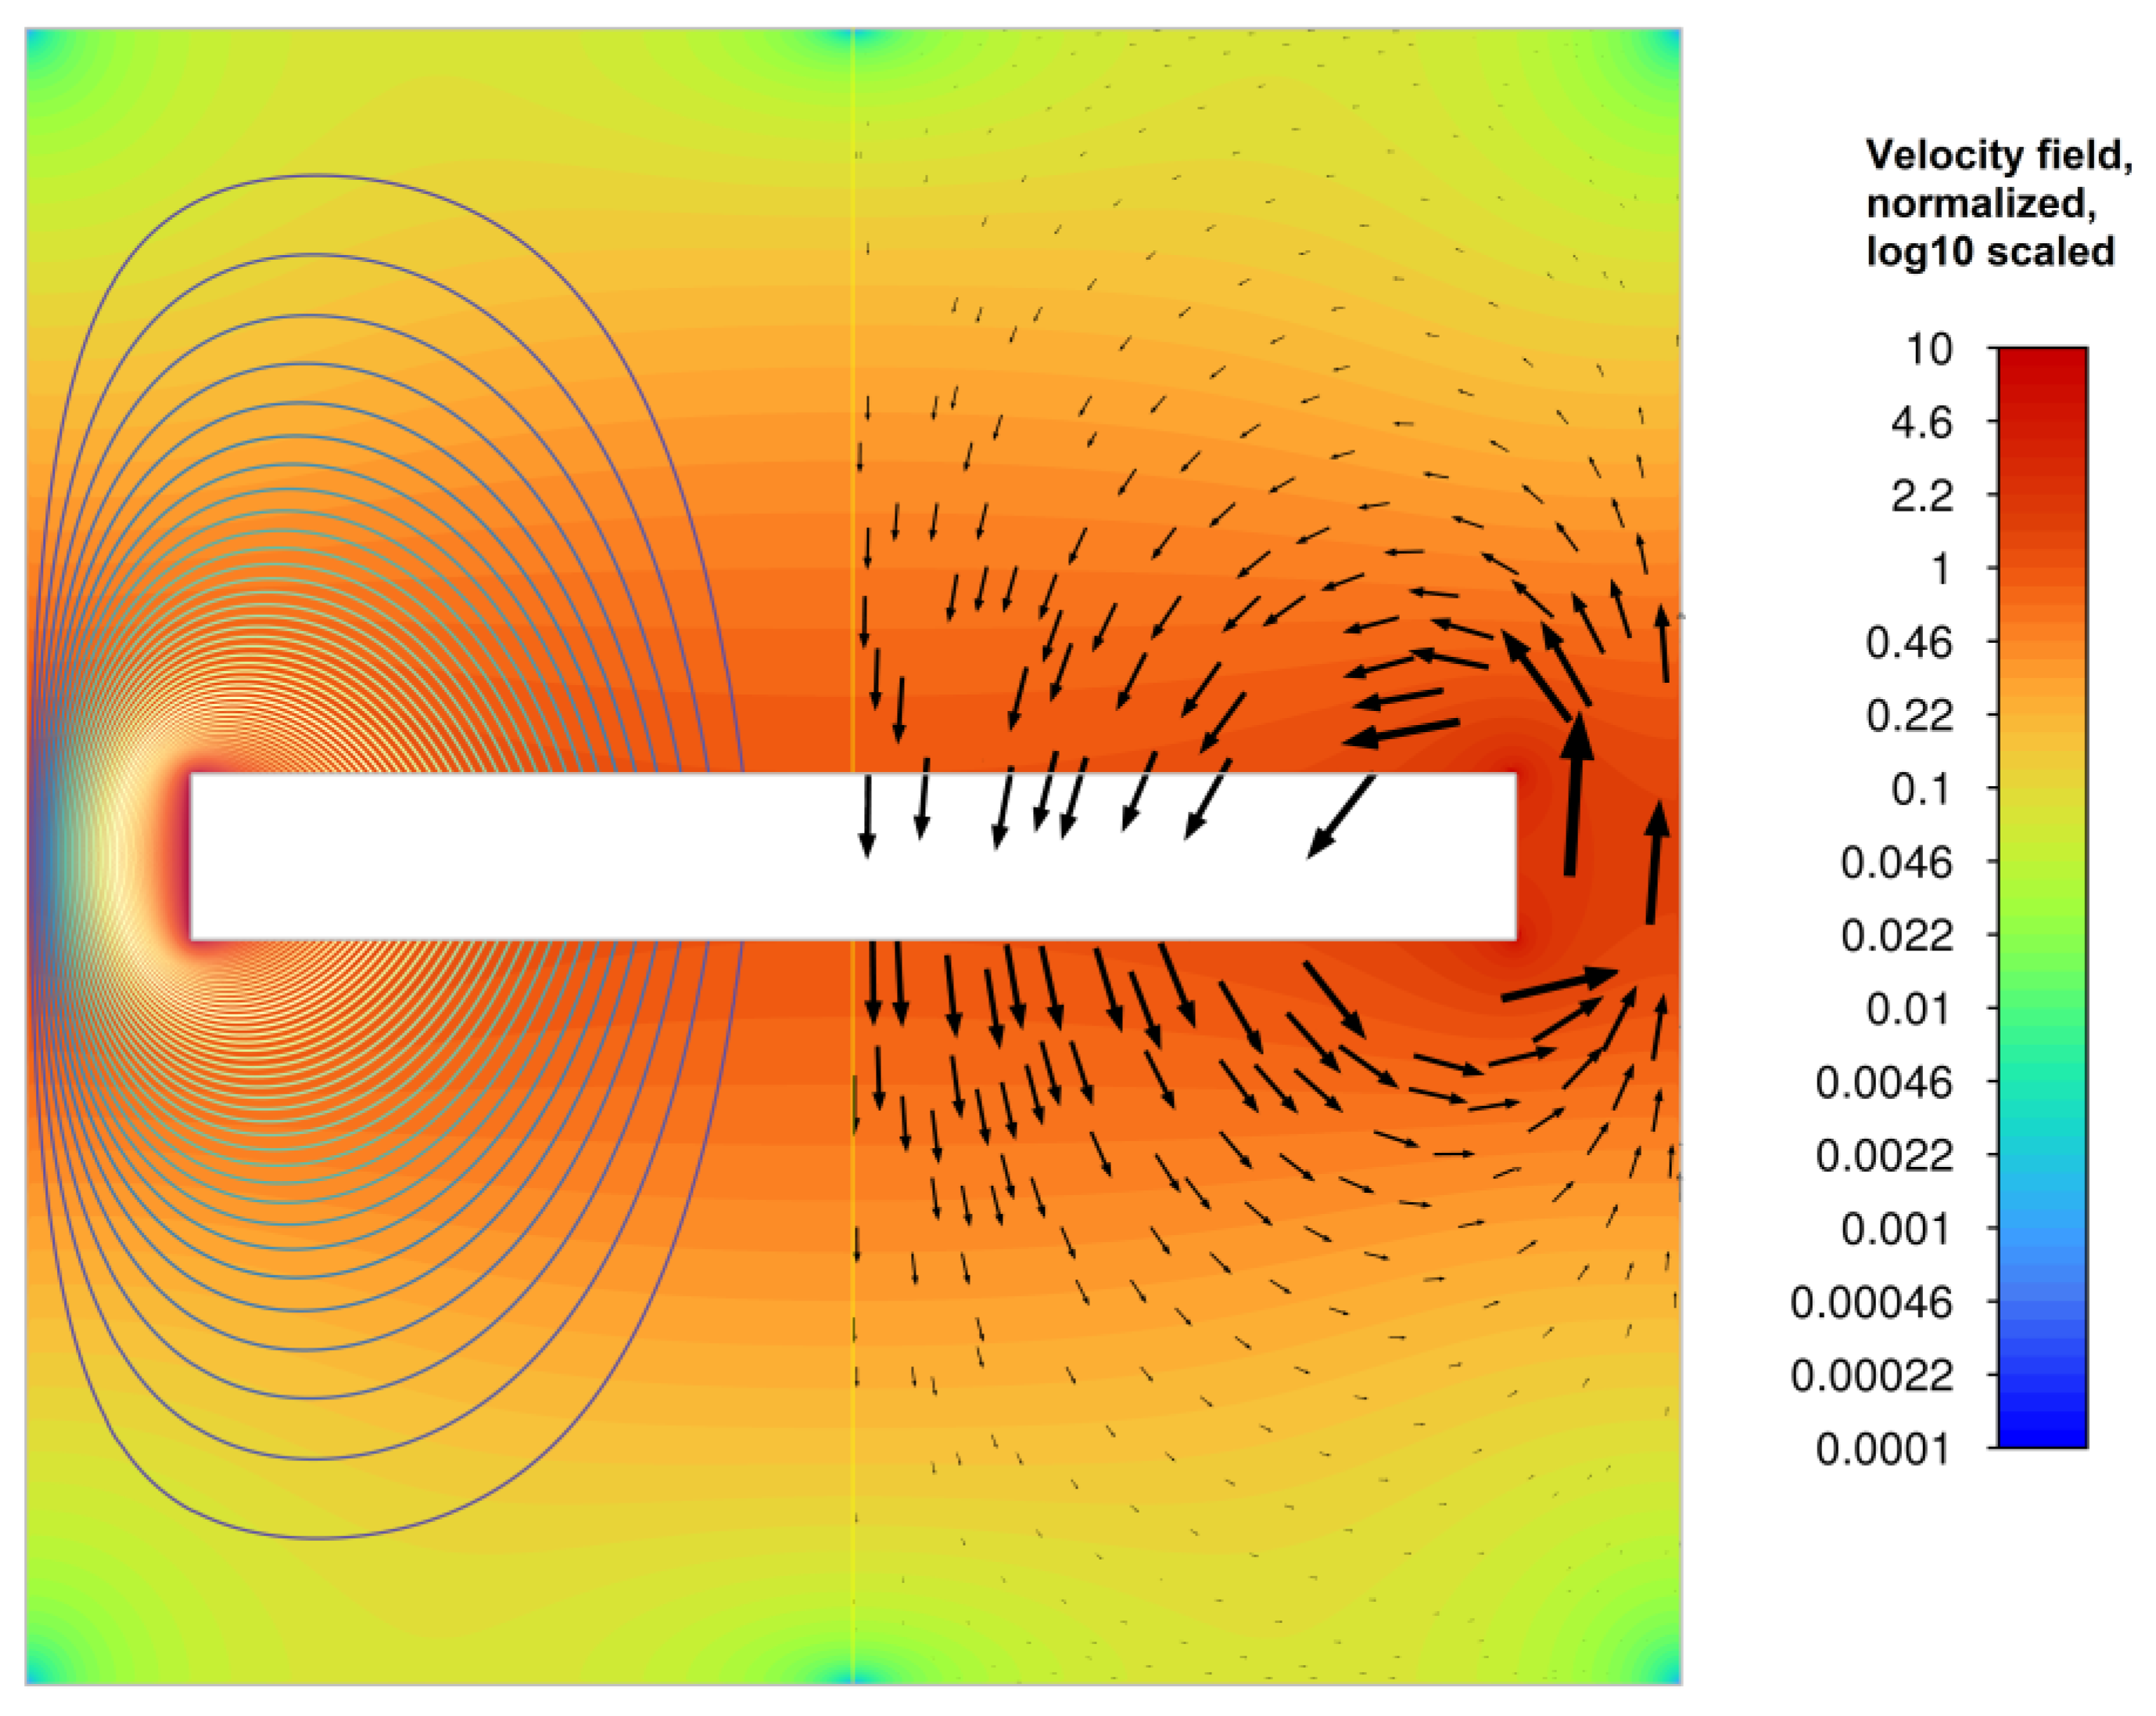
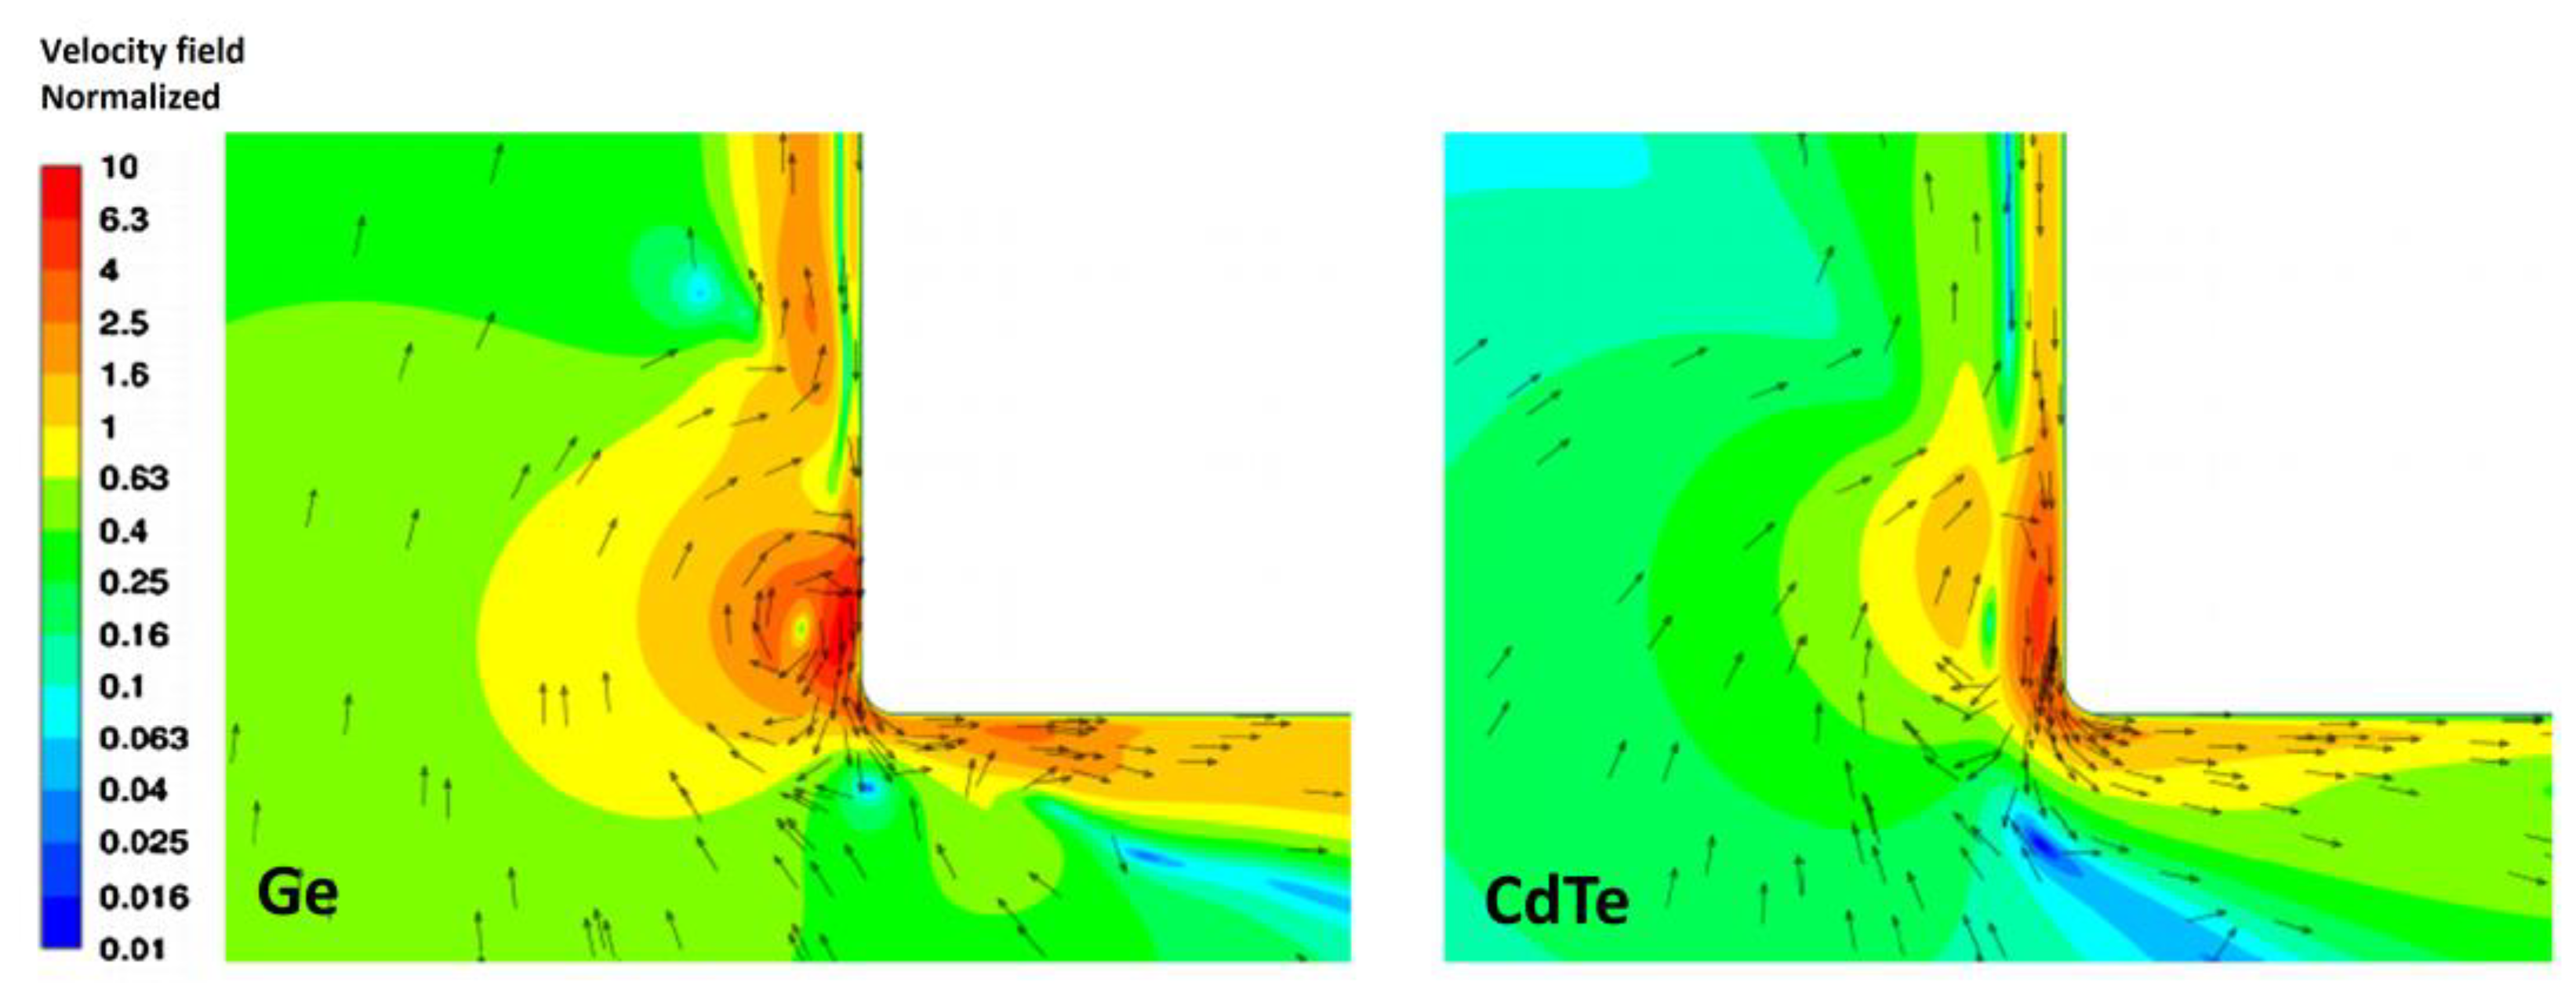
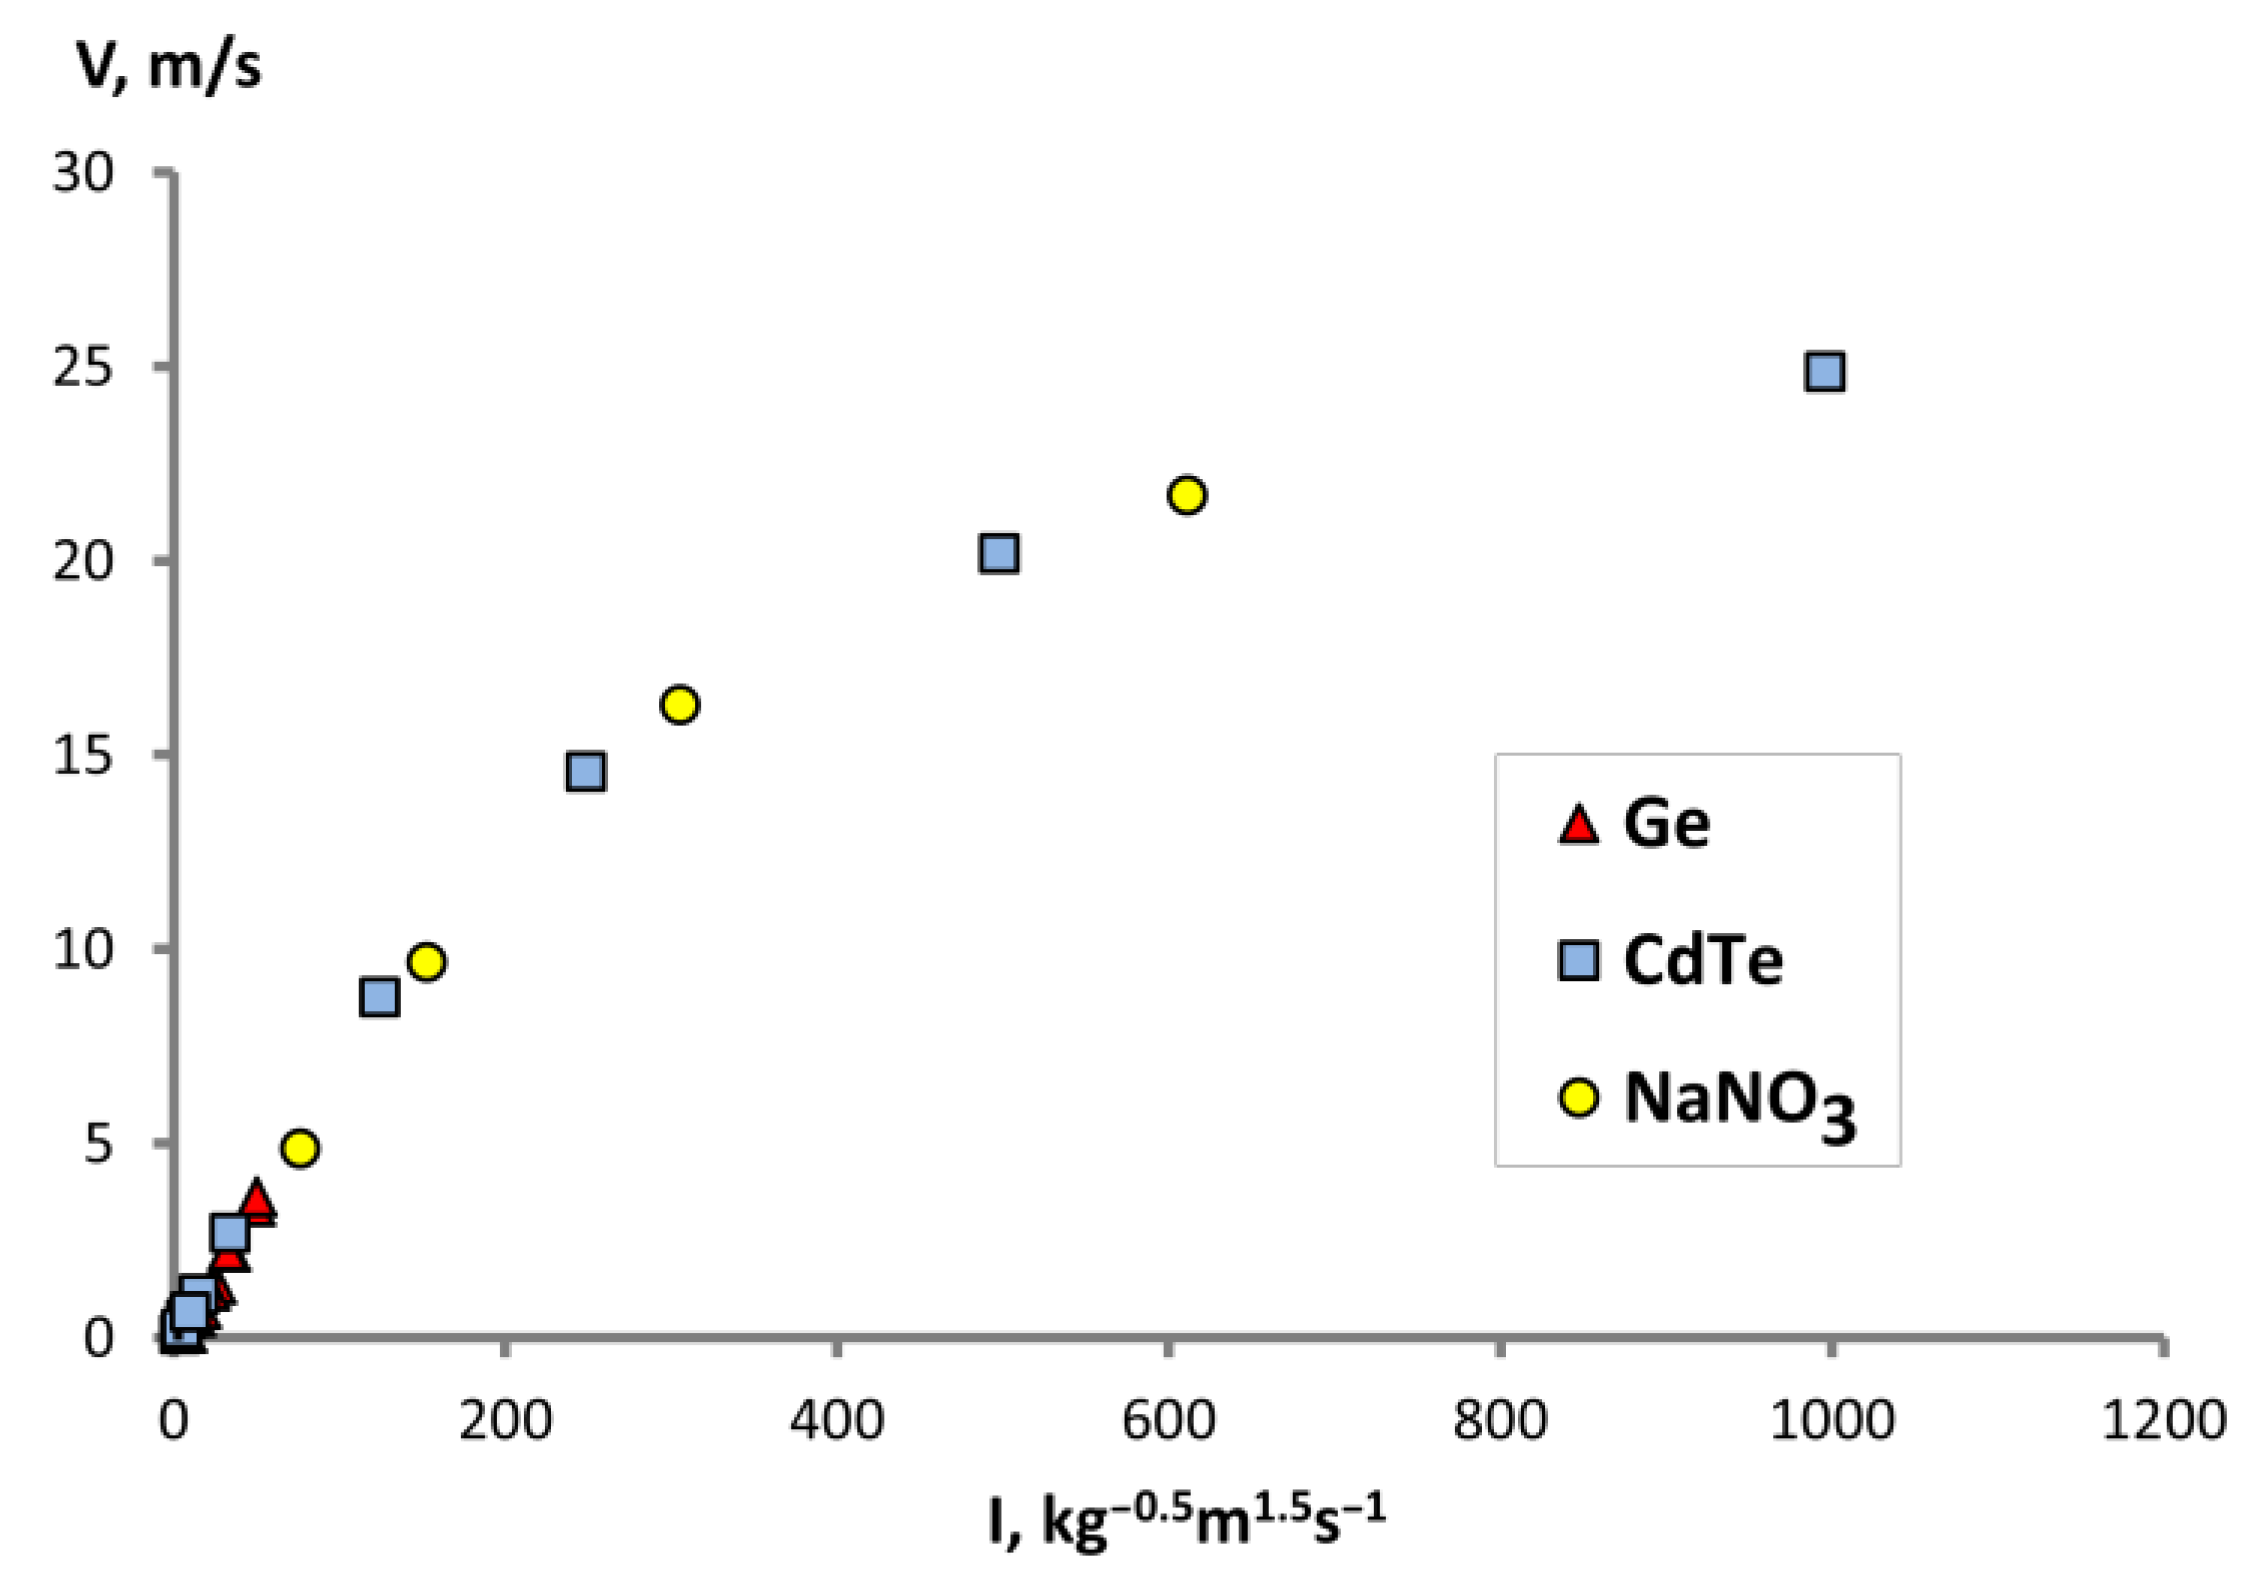
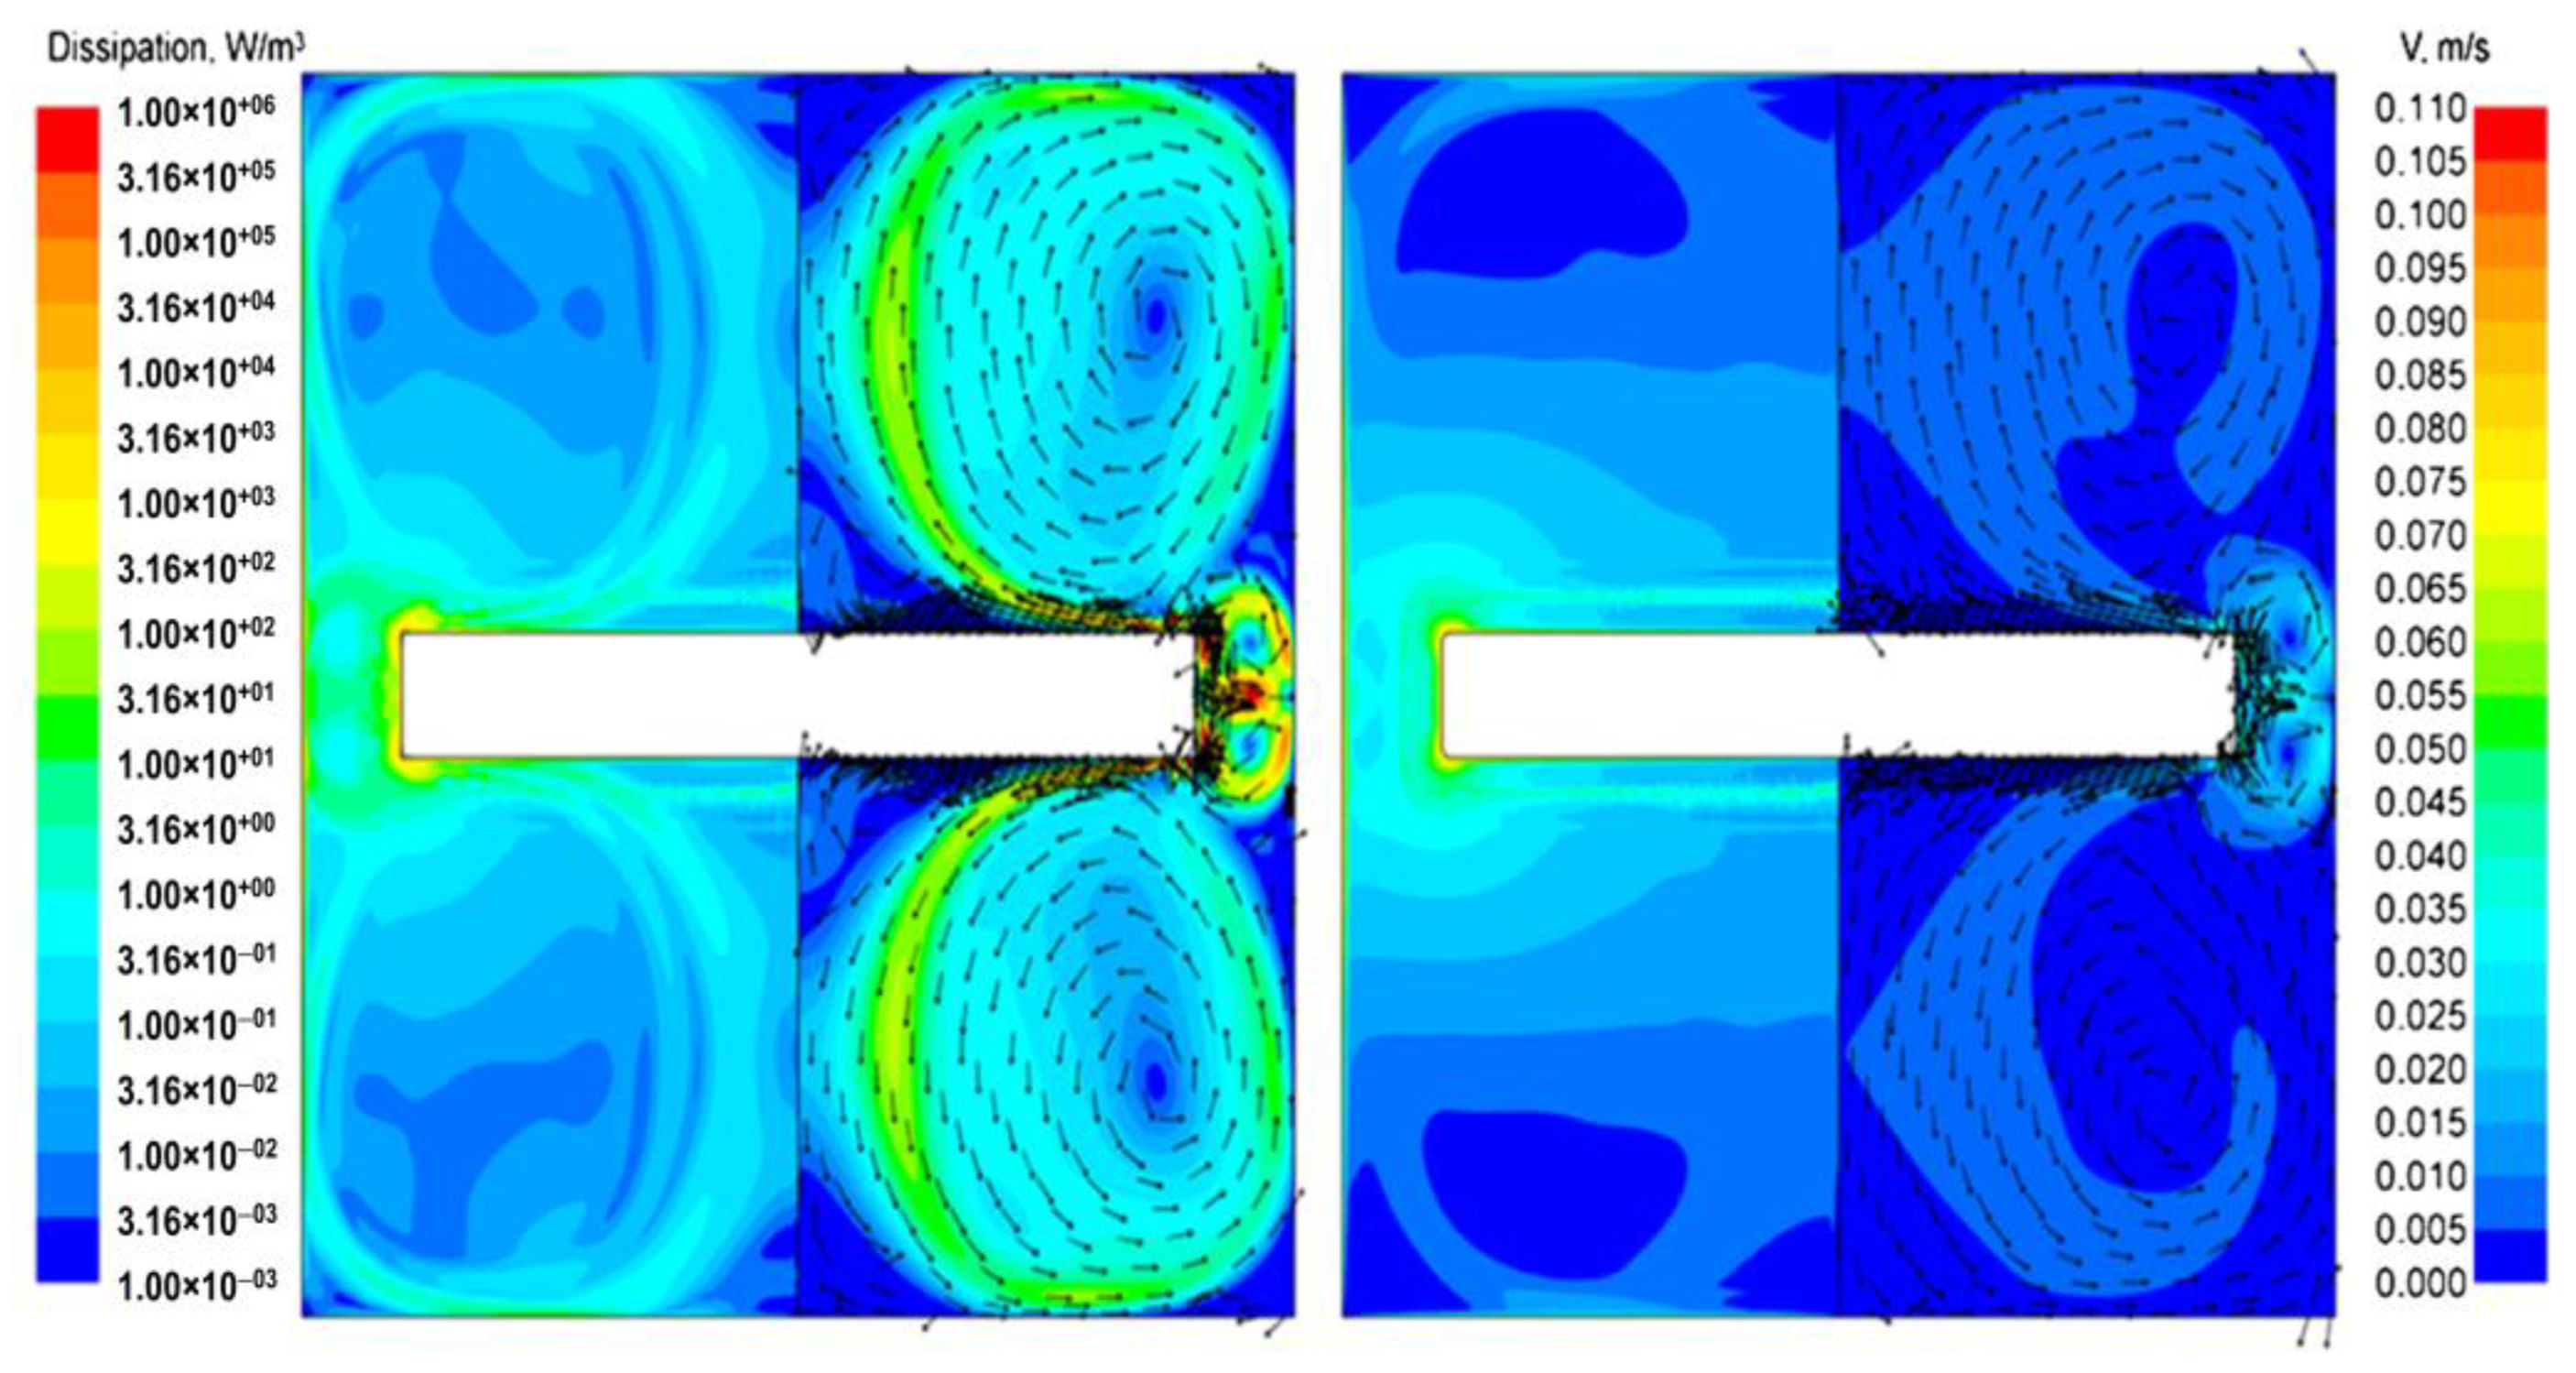
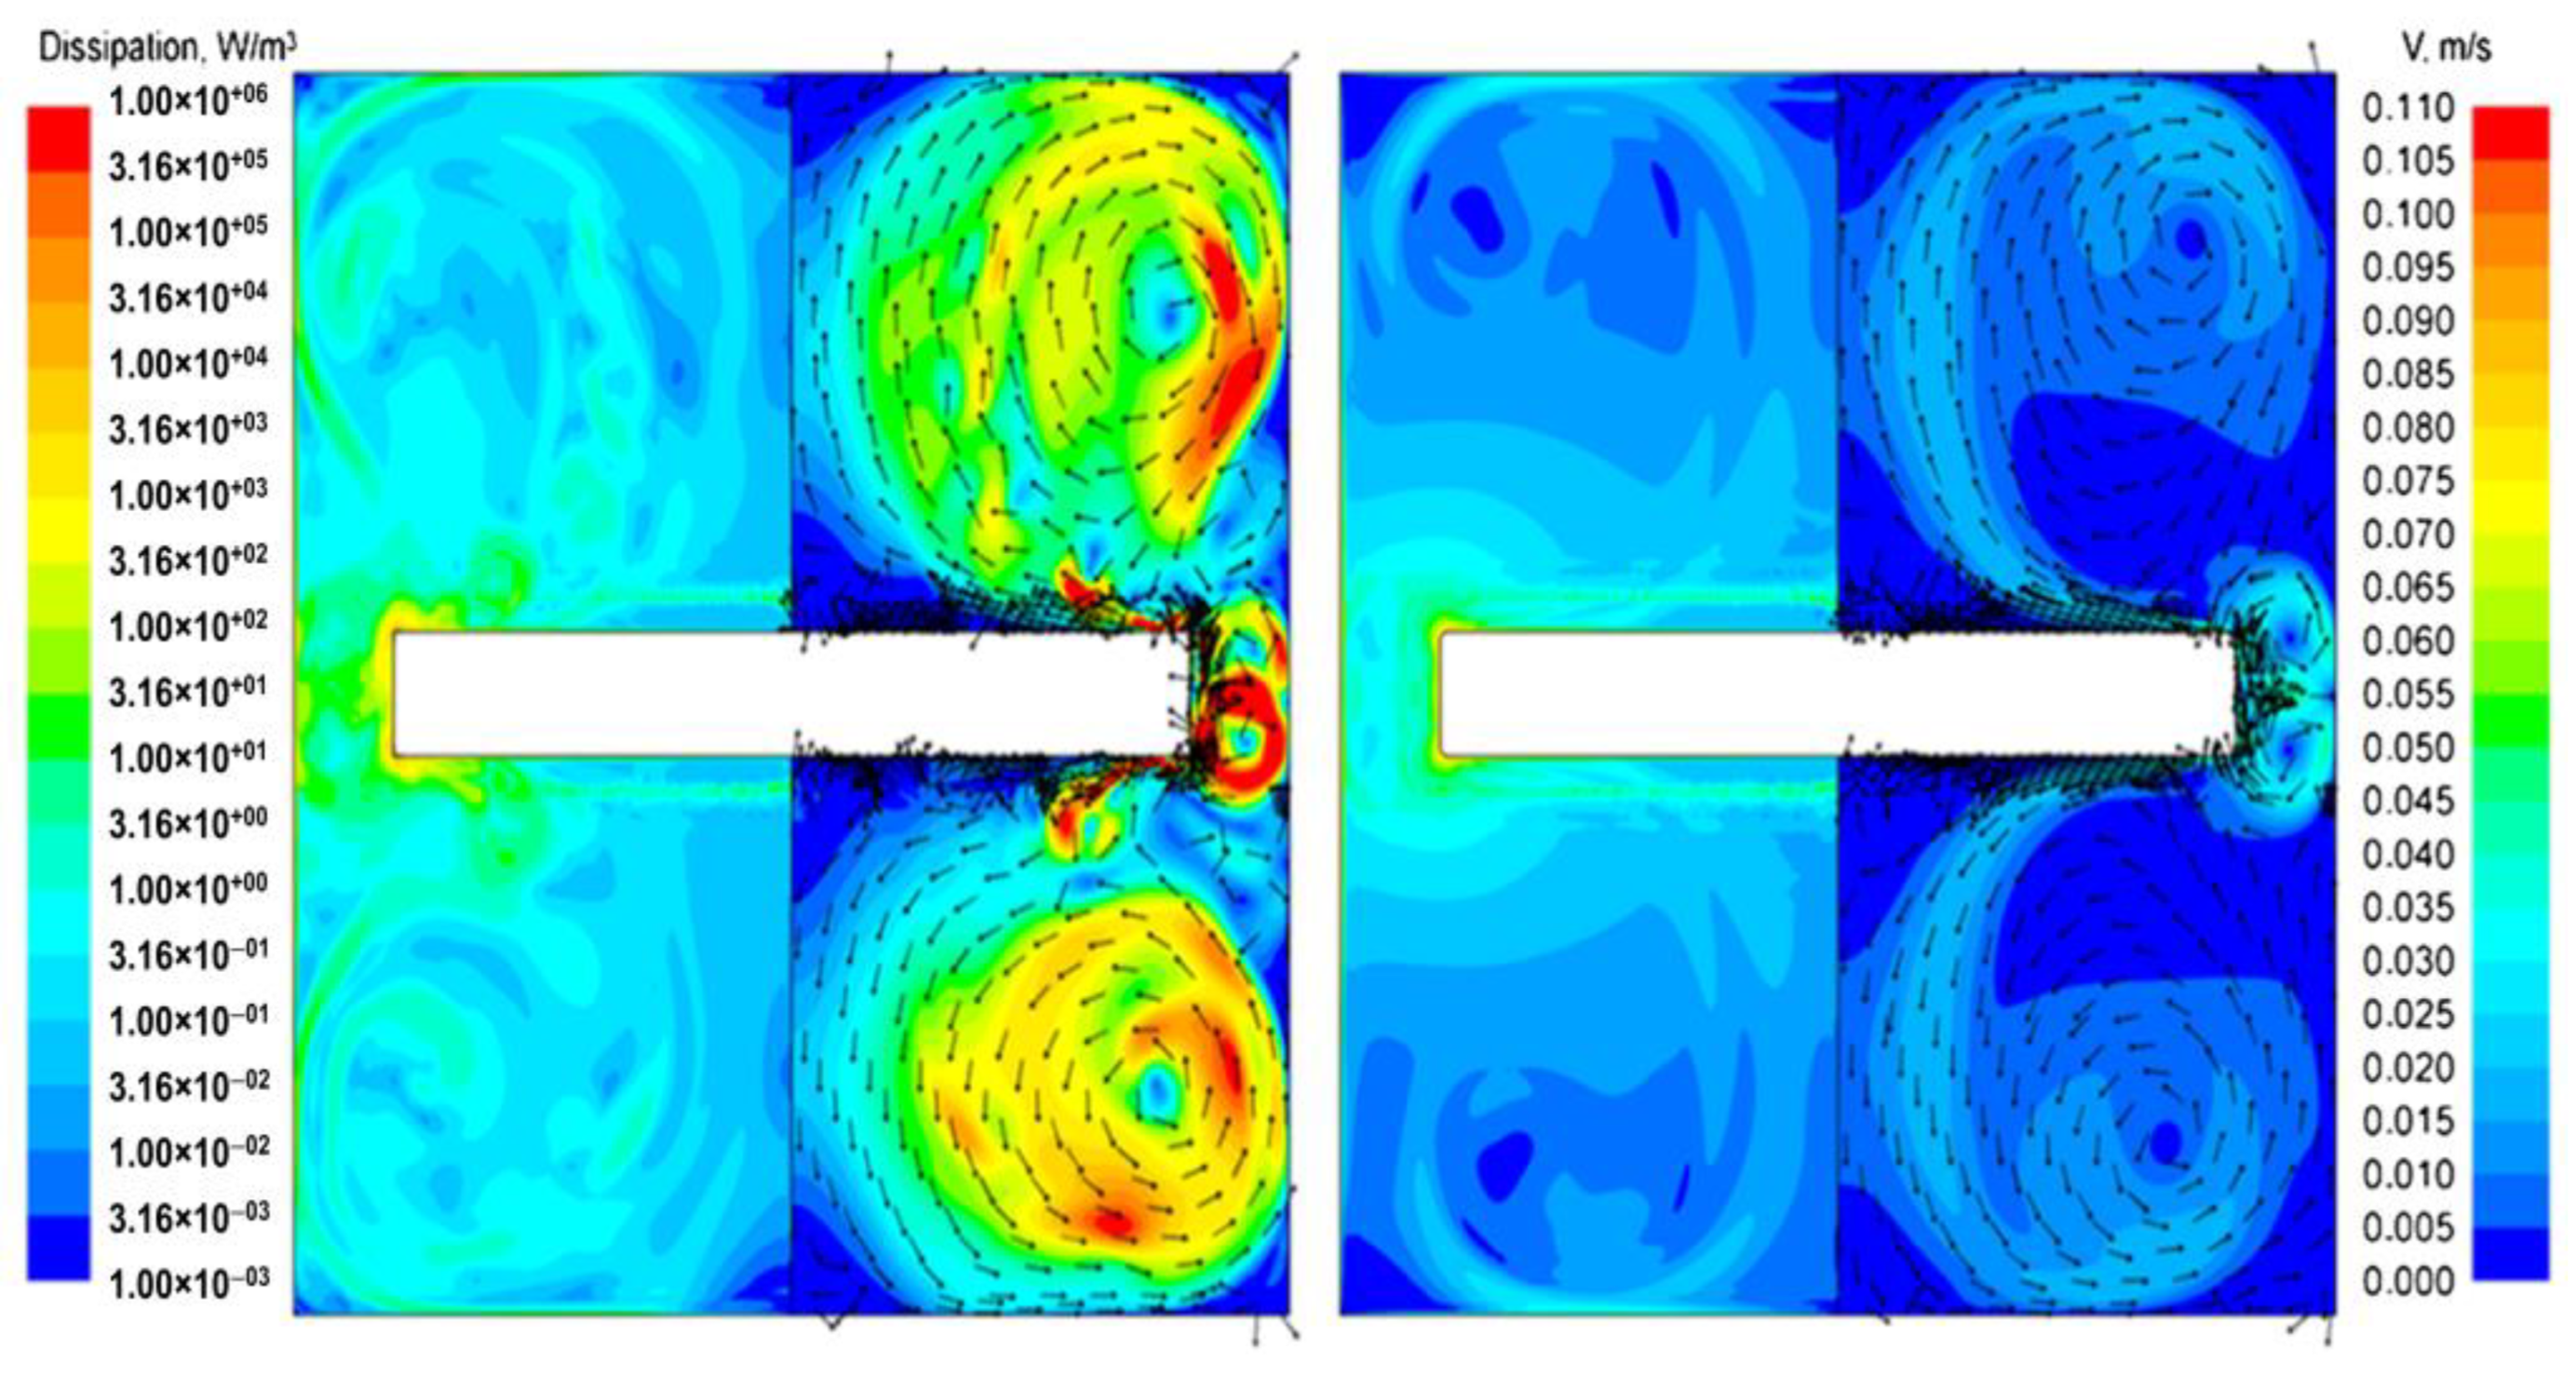
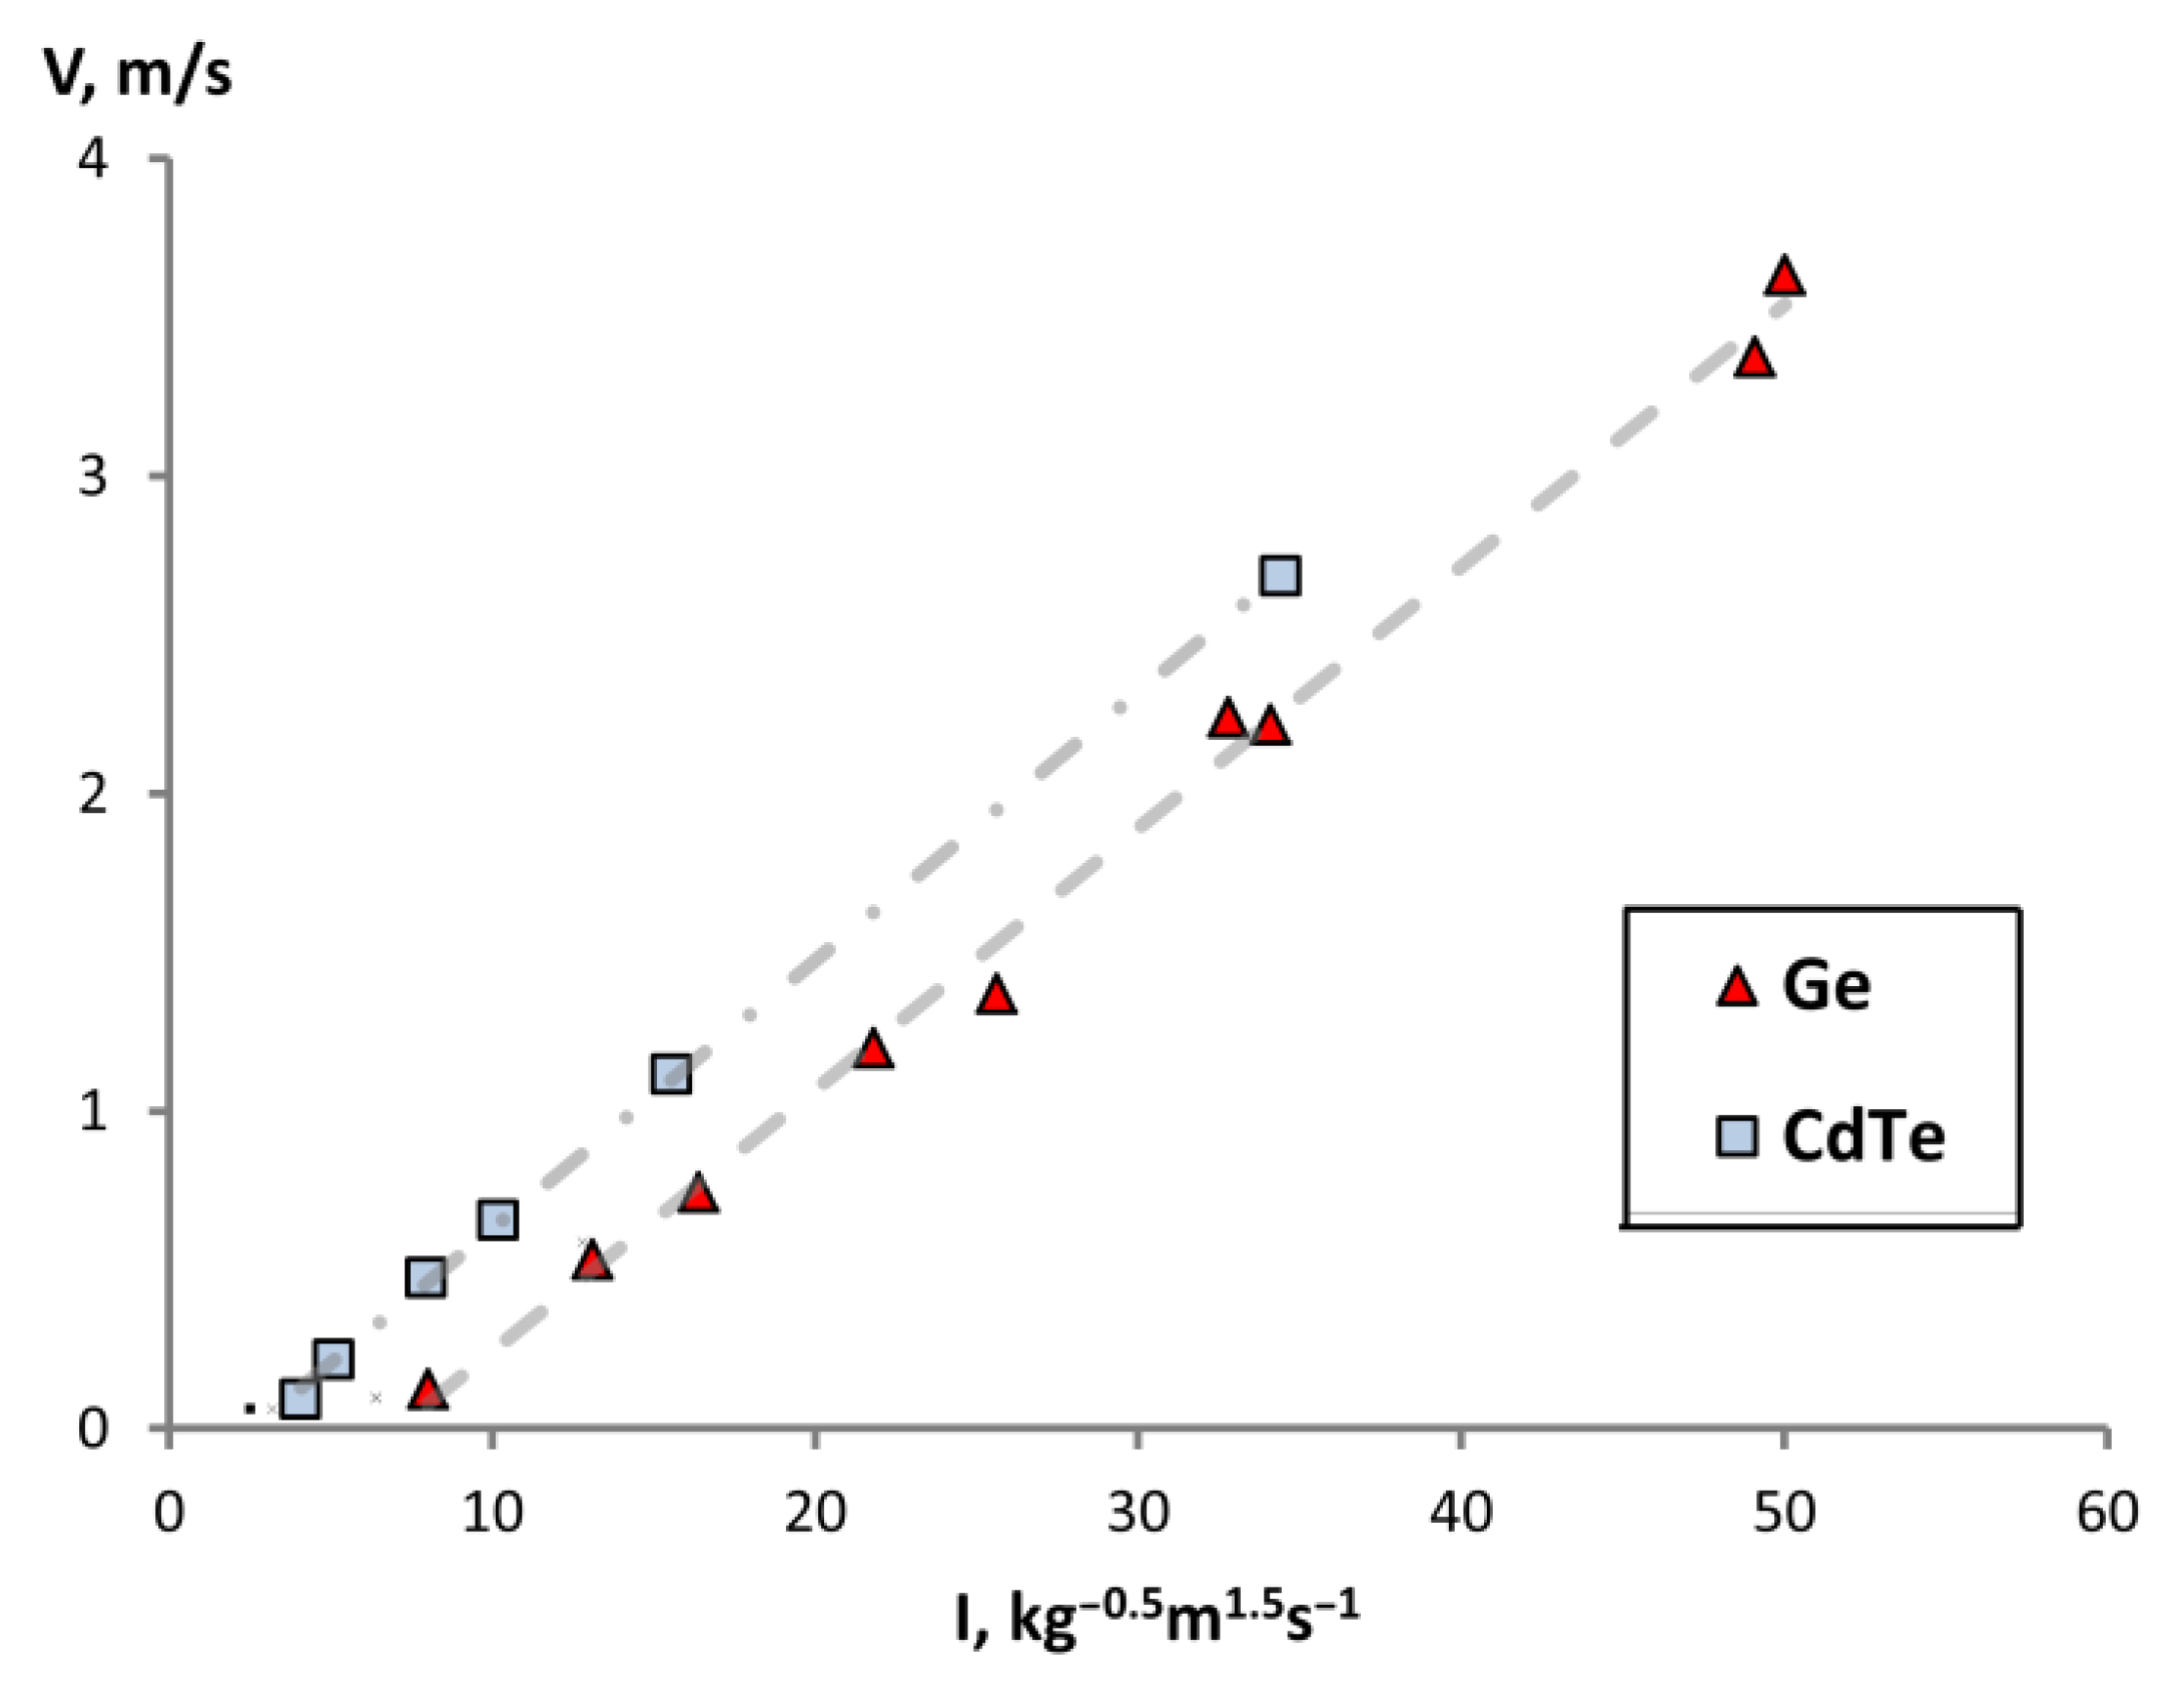
3.1. AVC Flows Velocities

For the selected materials, non-stationary calculations were carried out with a time step equal to 1/400 of the oscillation period until a stationary regime of melt flow was established, that is, until the velocity values averaged over the oscillation period reached a constant value. Distributions of the flow velocity of melts of Ge, CdTe, and NaNO3 were obtained at various values of the amplitude (A) and frequency (f) of disk oscillation, as well as at various radii of the disk edge (R) (Table 3).
At the beginning of oscillations (over several periods of oscillation), the disk forms a solenoidal melt flow field in space and sinusoidal in time (Figure 2), which we normalized for clarity to the maximum speed of oscillation of the disk . It can be seen that near the edge of the disk the speed of movement of the melt increases by approximately 10 times the speed of movement of the disk, and in the area between the disk and the side wall the speed of movement of the melt is opposite to the movement of the disk. However, over time, due to the viscosity of the melt, a thin layer of liquid should appear on the side of the disk, which will move in the same direction as the movement of the disk, which will lead to a break in the existing streamlines and the formation of a controlled vortex flow of the melt.
The closest zone to the surface of the disk (Figure 3) forms a thin viscous layer of melt, which moves in the same direction as the movement of the disk. When reaching the edge of the disk, this layer is divided into two components. One part of the melt layer, according to the oscillatory motion of the disk (Figure 2), changes the direction of movement to the opposite and partially closes near the edge of the disk, forming a primary vortex. The second part of the melt layer, acquiring a fairly high speed at the edge of the disk, is directed at an angle towards the flow around the surface of the disk, flowing into the main mass of the melt, causing, together with the oscillatory component of the field, secondary vortices (Figure 4). There are two such vortices—between the disk and the side surface of the chamber (small vortex) and a vortex in the main region of the melt, which, in the case of growing crystals using the technique of axial low-frequency vibrations, reaches the crystallization front. Therefore, we are most interested in correlating the flow rate of the secondary vortex with the vibrational parameters and physical properties of the melt.
Analysis of fluid flows in normalized scale v/() at the edge of the disk showed that in the case of more viscous CdTe the thickness of the boundary layer on the side surface of the disk is significantly greater comparing to Ge melt (Figure 3). However, the scale of the edge vortex is almost the same in both cases.
It is also clear that for less viscous germanium, inertial effects are much stronger. Hence, the higher speeds of jet flows from the corner, which create circulation in the main volume of the melt.
The mechanism of vortex generation is the tear off of flows when flowing around an edge of large curvature (small radius of curvature). Due to the tear off of flows during the forward and reverse disk motion, the liquid in the edge region moves along different trajectories, resulting in the formation of an edge vortex. The scale of the vortex is determined by the region of separated flow at the disk edge.
To analyze the influence of oscillatory parameters and physical properties of the substance on the nature of the flow, the modulus of the maximum flow velocity along the central axis was taken as a flow characteristic. We tried to find a power-law relationship (ni) between the melt velocity and amplitude A, angular frequency ω, disk edge radius R, melt density ρ and dynamic viscosity µ:
v   ~   A n 1 ω n 2 R n 3 ρ n 4 μ n 5 .
In the case of laminar stationary motion, the data must fit into a linear relationship. As a selecting result, the degrees of ni using regression analysis, we revealed (Figure 5) that the speed of the melt motion should be proportional to the expression, which for brevity we will denote as I and will call the intensity of oscillations:
v   ~   ρ 0.5 A 3 ω 2 R μ   ~   I .
It can be noted that the full set of points we calculated (Figure 5) at I intensity is divided into a linear region at low values of the amplitude and frequency of oscillations and a logarithmic region at high values amplitude and frequency of oscillations. The linear region corresponds to the laminar flow regime without the vortex shedding from the edge of the disk. The logarithmic region coincides with the beginning of the transition to the turbulent regime. At the edge of the disk, one can observe a loss of flow stability, which leads to the development of small vortices. These vortices, with further development, form a vortex street, which transport into a secondary vortex under the disk.
In the region of low frequencies and vibrations (Figure 6), in which the points of Ge and CdTe fall, a linear dependence is observed with a general slope of the straight line. The role of the shift of lines will be discussed in Section 4 when analyzing the obtained dependence. We observe that the linear dependence, hence the laminar flow regime, remains in the range of oscillation intensity from 10 to 50 kg−0.5 m1.5 s−1.
At high frequencies and amplitudes of oscillations (Figure 5), which included points of CdTe and NaNO3 at f = 25 Hz and A = 500 μm when R changed from 0.1 mm to 0.8 mm, it is clear that the melt flow regime begins to become turbulent. This is explained by the appearance of an uneven velocity field in the secondary vortex, as well as an increase in the dissipation energy in the area under the disk (Figure 7 and Figure 8). Separation vortices begin to form here, which are transferred from the edge of the disk to the region of the secondary vortex, leading to a change in the speed of the secondary vortex. This is most clearly visible in the velocity field of CdTe melt at R = 0.1 mm, where several small vortices (blue dots) can be seen that leave the disk edge and propagate into the central flow. Also, in the central region under the disk, a reverse flow occurs more actively, which also leads to a redistribution of velocity on the axis. It can be seen that with a decrease in the radius of the disk edge, this regime stabilizes, gradually reducing to a laminar flow regime and more potential type of the flow.

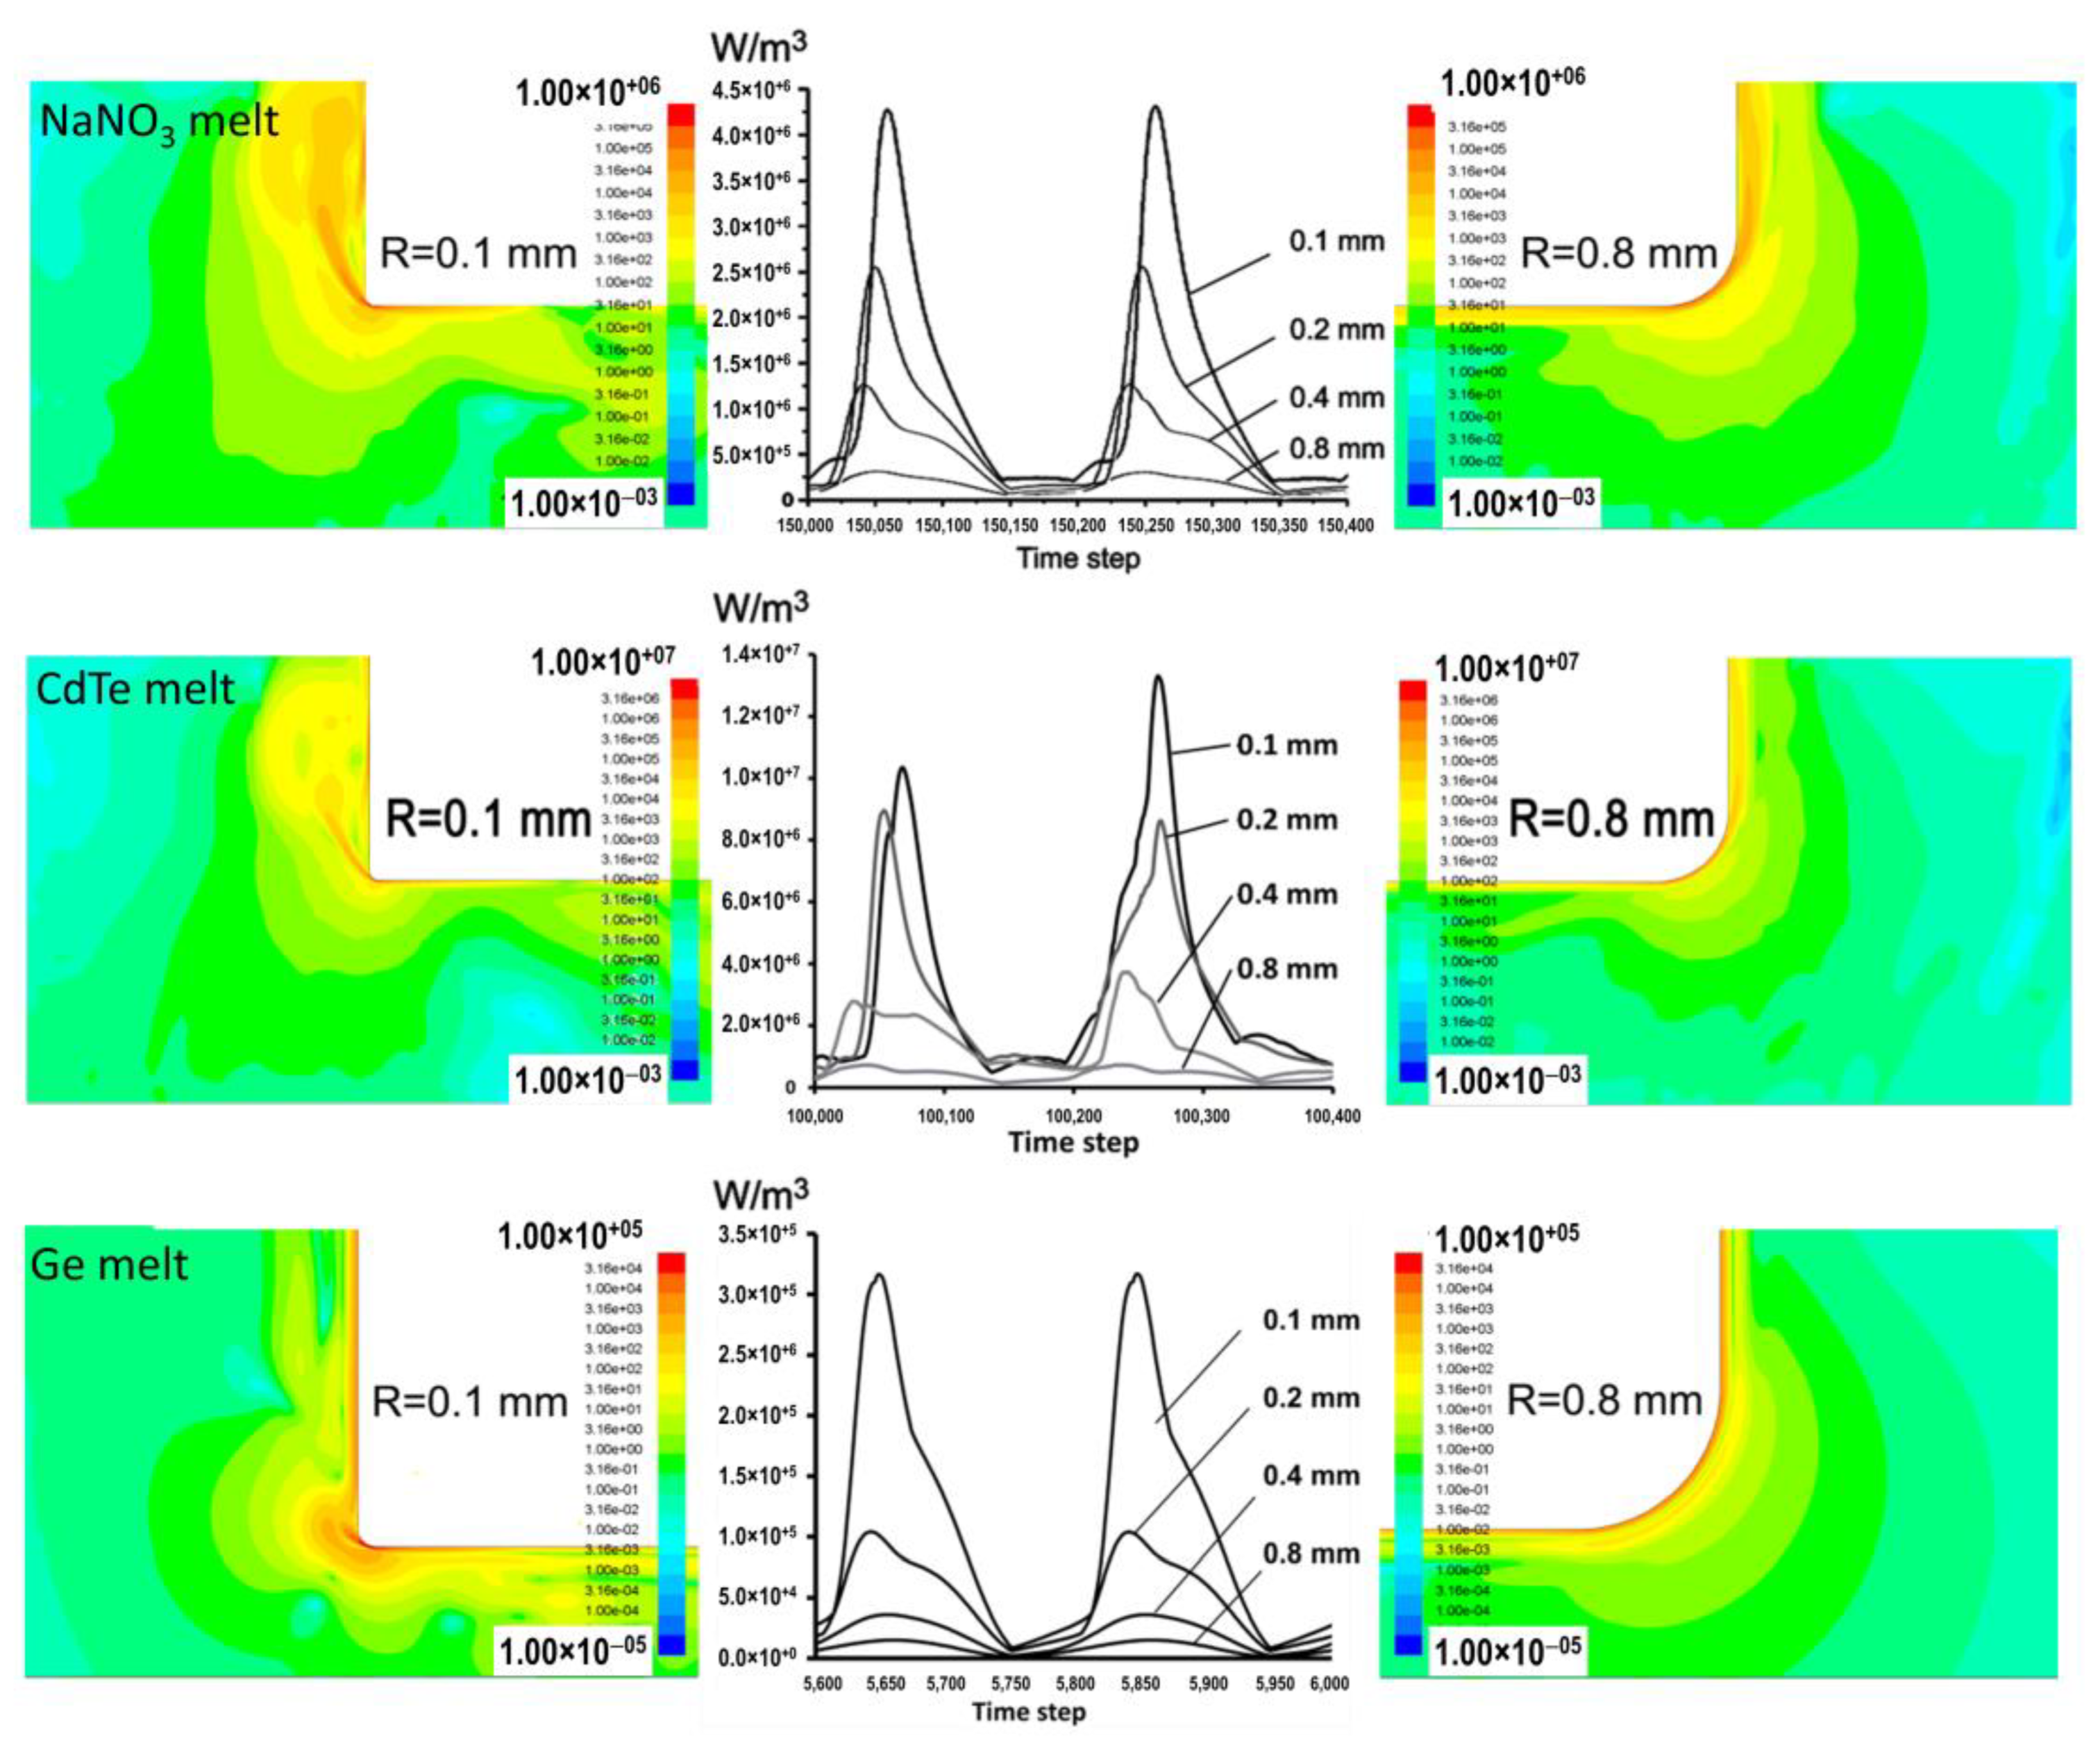
3.2. AVC Thermodynamic Control

We carried out a detail analysis of R influence on generation and on parameters of steady vibrational flows as well as on viscous dissipation energy (Pw), determined by the expression:
P w = μ σ i j 2 ;
σ i j = v + v T .
During crystal growth processes, the average vibrational flows are responsible for heat-mass-transfer, while Pw determines structure characteristics of the melt of a complex chemical composition [17]. Numerical simulation showed that the maximum (averaged over the oscillation period) velocity of vibrational flows was inversely to R and demonstrated a non-linear increase with AVC amplitude (A). Integral viscous dissipation energy for the whole melt volume, which can be processed by integrating Equation (9) over the volume, demonstrated the cubic dependence vs. the oscillating velocity and inverse proportionality to edge radius: Pw ~ A3ω3R−1. The maximum viscous dissipation (Figure 9) near the disc edge is also proportional to oscillating velocity and inverse proportionality to edge radius A3ω3R−1, but it increases faster with 3.8 number exponents.
In the case of NaNO3 melt, the most stable values of viscous dissipation energy were obtained, since at f = 25 Hz, A = 500 μm its flow, despite the formation of separation vortices, is still stable. Under these conditions, CdTe melt is in a stronger turbulent regime, which is expressed in variable values of the maximum dissipation energy. In the case of Ge-melt at f = 25 Hz, A = 500 μm, an extremely unstable turbulent regime of oscillatory flow is achieved, so we calculated the dissipation energy for the parameters f = 25 Hz, A = 100 μm.
Recalculation of an instant maximum dissipation rate for 0.1 mm edge radius, results in ~220 Joule/mole per second in the case of NaNO3 melt; and ~330 Joule/mole per second for CdTe melt in one cubic nanometer near the disk edge. These values match the approximation for energy of cluster formation in a liquid phase [21]. For Ge at R = 0.1 mm we are able to introduce only ~2–3 Joule/mole per second in one cubic nanometer near the disc edge. This energy is enough to organize the laminar flow motion in the melt for desired heat-mass transfer, but it is insufficient to change the Ge melt thermodynamic state with respect to components’ composition.

4. Discussion

The resulting dependence of the velocity v on the intensity I (Equation (9)) is primarily a mathematical correlation, but it is also possible to speculate on its physical interpretation. Using the data approximation in Figure 6, we can conduct the linear regression equation in the form:
v = b I + v 0 = b · ρ 0.5 A 3 ω 2 μ R + v 0 ,
Equation (12) could be transformed to the form:
ρ v v 0 2 = b 2 · A 6 ω 4 R 2 ν 2 = A 2 ω ν · A R · b ω 2 ,
where b is the proportionality coefficient,  ν = μ / ρ  is the kinematic viscosity. We see that the left side of the equation is reduced to the form of dynamic pressure of the melt. On the right side of the equation, the factor  Re s = A 2 ω / ν  represents the Reynolds number for a stationary melt flow during oscillatory motion of the disk, and the factor  ε = A / R  is the ratio of the oscillation amplitude to the characteristic size of the body. Also, the factor  ε  can be interpreted as the ratio of the oscillatory velocity to the flow velocity, and this hints to us that this ratio must contain some other characteristic size, which is a function of R, since the flow velocity near the edge of the disk is 10 times greater than the oscillatory flow velocity, as stated earlier. In the case of direct proportionality, the missing parameter is included in b.
Both quantities are dimensionless, therefore, in the expression:
ρ v v 0 2 = Re s 2 · ε 2 · b ω 2 ,
the factor  b ω 2 , obviously, must also be equal in dimension to pressure. Then, you can evaluate:
b 2 = m / l = k g · m 1 ,
and get that:
ρ v v 0 2 = Re s 2 · ε 2 · m ω 2 l = Re s 2 · ε 2 · p .
The resulting expression is very similar in appearance to Bernoulli’s law for an ideal fluid with corrections for viscous dissipation. From the obtained dependence, we can assume that  v 0  is the limiting speed at which the speed of the secondary vortex along the axis is determined only by the speed of oscillation of the disk. At low frequency and amplitude of oscillations,  Re s 2  will decrease quite quickly, and then the right side will tend to zero. Also, an increase in the radius of the disk edge will lead to a decrease in the parameter  ε 2 , which in the limiting case will also lead to zeroing of the right side. At small values of  Re s 2  and  ε 2 , a regime of complete flow around the disk should occur when it oscillates in a liquid, where the maximum velocity is concentrated in a thin layer near the disk. However, to confirm this hypothesis, it is necessary to conduct a study of fluid flow in the region of small amplitudes and vibration frequencies, as well as expand the nomenclature of materials.
To correctly identify the value of  b 2  and determine what pressure gradient ∆p is implied in the resulting recording, it is necessary to conduct additional studies of the velocity values for sodium nitrate in the laminar region, as well as for germanium in the turbulent region, and to consider the relationship of parameters with other velocities. For instance, the maximum speed at the edge of the disk, as well as in the space between the disk and the crucible. These questions are of interest for further development of the study. Now, we can only assume that the pressure gradient, judging by the analysis of the b dimension, is somehow related to the inertial forces arising when the disk oscillates, as indicated by the fact that we presented ∆p above as:
p = b ω 2 = m ω 2 l = m · l ω 2 l 2 = m l 2 · d v ¯ dt = F S .
The obtained proportional dependence is useful in that it allows estimating the order of the speed of movement of the melt in the region near the crystallization front, since the flow motion speed along the axis and along the bottom wall are approximately equal for laminar stationary oscillatory motion. From the correlation (Figure 6) we obtain that the slope of the curve is 8.3·10−5 kg0.5 m−0.5. This value, together with the oscillation intensity I, can be used when estimating the oscillatory contribution of melt motion in real crystal growth processes, where the main driving force of the process is thermal convection or diffusion.
In conclusion, it should be noted that the AVC method is very energy efficient in terms of controlling flows in the liquid phase [22,23,24]. At the same time, the AVC method allows one to potentially overcome the scaling problem when increasing the diameter of the growth system from 20 mm to 200 mm or more without significantly changing the design of the vibration actuator.

5. Conclusions

The effects of AVC can be divided into two parts: (1) it is possible to control the oscillatory movement of the liquid in the melt and create vibration flows controlled in speed and configuration; (2) creation of average fast stable flows that provide a given heat and mass transfer and dominate over thermoconvective flows.
We were able to determine the linear dependence of the maximum melt velocity along the central axis on such system parameters as amplitude, frequency, radius of the disk edge, density, and viscosity of the melt when the disk oscillates in a closed crucible. An assessment was made of the intensity of oscillations I, at which a stable mode of oscillatory flow is maintained, which ranges from 10 to 50 kg−0.5 m1.5 s−1. An analysis of the obtained dependence was also carried out and a possible relationship between the parameters was identified, however, to confirm the obtained result it is necessary to collect a large sample of data.
When considering thermoconvective flow, for example, in the VGF method, without taking into account the crystallization heat of the substance, we can assume that there will be practically no flow motion in the melt due to the fact that the hotter melt layer will be located above the colder one. In this case, the side heater creates an axial temperature gradient, which leads to the melt movement from bottom to top along the wall. Taking into account the crystallization heat of the substance, the melt will be set in motion. Depending on the crystal growth rate, the crystallization heat value, and the thermal conductivity of a given substance in the melt and solid, thermal convection in the absence of vibrations can be easily assessed [24].
The general analysis we performed in this work let us provide an answer to what vibration parameters must be set in order to form a vibrational melt flow capable of leveling the crystallization front for substances with different physico-chemical and thermodynamic parameters.
Further research involves conducting physical experiments in an isothermal version in order to validate the data obtained. Next, the performance of the model will be tested on non-isothermal systems, taking into account the crystallization process on low-temperature model substances. After this, the developed model can be used to optimize the growth processes of high-temperature crystals.

Author Contributions

Conceptualization, O.N. and A.D.; methodology, V.K.; software, O.N., A.D. and V.K.; validation, I.A. and B.L.; formal analysis, B.L.; investigation, O.N., A.D., V.K. and B.L.; resources, I.A.; data curation, B.L.; writing—original draft preparation, I.A. and A.D.; writing—review and editing, O.N. and A.D.; visualization, B.L.; supervision, V.K.; project administration, I.A.; funding acquisition, A.D. All authors have read and agreed to the published version of the manuscript.

Funding

This research was funded by the Ministry of Science and Higher Education of Russia through the project FSSM-2022-0005.

Data Availability Statement

Data are contained within the article.

Acknowledgments

The authors are grateful to the Mendeleev Center for the Collective Use of Scientific Equipment for computational resources.

Conflicts of Interest

The authors declare no conflicts of interest.

References

  1. Ünlü, H.; Horing, N.J.M. (Eds.) Progress in Nanoscale and Low-Dimensional Materials and Devices; Topics in Applied Physics; Springer International Publishing: Cham, Switzerland, 2022; Volume 144. [Google Scholar] [CrossRef]
  2. Available online: https://www.simco-groups.com/market_segment/crystal-growth (accessed on 17 December 2023).
  3. Rudolph, P. Contributions to the Development of Crystal Growth Technologies. J. Cryst. Growth 2024, 625, 127456. [Google Scholar] [CrossRef]
  4. Milisavljevic, I.; Wu, Y. Current Status of Solid-State Single Crystal Growth. BMC Mater. 2020, 2, 2. [Google Scholar] [CrossRef]
  5. Frank-Rotsch, C.; Dropka, N.; Rotsch, P. III Arsenide. In Single Crystals of Electronic Materials: Growth and Properties; Fornari, R., Ed.; Woodhead Publishing: Cambridge, UK, 2018; pp. 181–240. ISBN 9780081020968. [Google Scholar]
  6. Kearns, J.K. Silicon single crystals. In Single Crystals of Electronic Materials: Growth and Properties; Fornari, R., Ed.; Elsevier Ltd.: Amsterdam, The Netherlands, 2019; pp. 5–56. [Google Scholar]
  7. Kozhemyakin, G.N. Imaging of Convection in a Czochralski Crucible under Ultrasound Waves. J. Cryst. Growth 2003, 257, 237–244. [Google Scholar] [CrossRef]
  8. Kozhemyakin, G.N.; Nemets, L.V.; Bulankina, A.A. Simulation of Ultrasound Influence on Melt Convection for the Growth of GaxIn1−xSb and Si Single Crystals by the Czochralski Method. Ultrasonics 2014, 54, 2165–2168. [Google Scholar] [CrossRef] [PubMed]
  9. Scheel, H.J.; Schulz-Dubois, E.O. Flux Growth of Large Crystals by Accelerated Crucible-Rotation Technique. J. Cryst. Growth 1971, 8, 304–306. [Google Scholar] [CrossRef]
  10. Zawilski, K.T.; Custodio, M.C.C.; Demattei, R.C.; Feigelson, R.S. Control of Growth Interface Shape Using Vibroconvective Stirring Applied to Vertical Bridgman Growth. J. Cryst. Growth 2005, 282, 236–250. [Google Scholar] [CrossRef]
  11. Ostrogorsky, A.G.; Riabov, V.; Dropka, N. Interface Control by Rotating Submerged Heater/Baffle in Vertical Bridgman Configuration. J. Cryst. Growth 2018, 498, 269–276. [Google Scholar] [CrossRef]
  12. Kokh, A.E.; Kononova, N.G. Crystal Growth under Heat Field Rotation Conditions. Solid-State Electron. 2000, 44, 819–824. [Google Scholar] [CrossRef]
  13. Miller, W.; Frank-Rotsch, C.; Czupalla, M.; Rudolph, P. Numerical Modelling of Czochralski Growth of Quadratic Silicon Crystals by Means of a Travelling Magnetic Field. Cryst. Res. Technol. 2012, 47, 285–292. [Google Scholar] [CrossRef]
  14. Golyshev, V.; Gonik, M.; Tsvetovsky, V. Problems of Bi4Ge3O12 and Li2B4O7 Single Crystal Growth by Crusibleless Variant of AHP Method. J. Cryst. Growth 1999, 198–199, 501–506. [Google Scholar] [CrossRef]
  15. Uda, S.; Koizumi, H.; Nozawa, J.; Fujiwara, K. Crystal Growth under External Electric Fields. AIP Conf. Proc. 2014, 1618, 261–264. [Google Scholar] [CrossRef]
  16. Fadeev, G.N.; Boldyrev, V.S.; Bogatov, N.A.; Nikolaev, A.L. Inhibition of Redox Reactions in a Low-Frequency Field. Dokl. Phys. Chem. 2019, 487, 91–93. [Google Scholar] [CrossRef]
  17. Avetissov, I.; Sadovskiy, A.; Belov, S.; Khomyakov, A.; Rekunov, K.; Kostikov, V.; Sukhanova, E. Thermodynamic Features of Axial Vibrational Control Technique for Crystal Growth from the Melt. CrystEngComm 2013, 15, 2213–2219. [Google Scholar] [CrossRef]
  18. Avetissov, I.C.; Sadovskiy, A.P.; Sukhanova, E.A.; Orlova, G.Y.; Belogorokhov, I.A.; Zharikov, E.V. Perfection of NaNO3 Single Crystals Grown by Axial Vibrational Control Technique in Czochralski Configuration. J. Cryst. Growth 2012, 360, 167–171. [Google Scholar] [CrossRef]
  19. Sadovsky, A.; Ermochenkov, I.; Dubovenko, E.; Sukhanova, E.; Bebyakin, M.; Dubov, V.; Avetissov, I. Potassium-Cobalt Sulphate Crystal Growth Assisted by Low Frequency Vibrations. J. Cryst. Growth 2018, 483, 31–38. [Google Scholar] [CrossRef]
  20. Avetissov, I.C.; Sukhanova, E.A.; Khomyakov, A.V.; Zinovjev, A.Y.; Kostikov, V.A.; Zharikov, E.V. Simulation and Crystal Growth of CdTe by Axial Vibration Control Technique in Bridgman Configuration. J. Cryst. Growth 2011, 318, 528–532. [Google Scholar] [CrossRef]
  21. Doye, J.P.K. The Structure, Thermodynamics and Dynamics of Atomic Clusters, Gonville & Caius College. 1996. Available online: http://doye.chem.ox.ac.uk/jon/PhD2/PhD.html (accessed on 27 December 2023).
  22. Zharikov, E.V. Problems and Recent Advances in Melt Crystal Growth Technology. J. Cryst. Growth 2012, 360, 146–154. [Google Scholar] [CrossRef]
  23. Zharikov, E.V. Advanced Technologies of Crystal Growth from Melt Using Vibrational Influence. In Crystal Growth Technology: Semiconductors and Dielectrics; Wiley: Hoboken, NJ, USA, 2010; pp. 41–64. [Google Scholar] [CrossRef]
  24. Nefedov, O.; Dovnarovich, A.; Kostikov, V.; Mozhevitina, E.; Bocharnikov, D.; Avetissov, I. Numerical Simulation of CdTe Crystal Growth Using the Vertical Gradient Freeze Technique Assisted by Axial Low-Frequency Oscillations of the Melt. Crystals 2024, 14, 72. [Google Scholar] [CrossRef]
Figure 1. Grid of calculation area (left) with grid extension near vibrating disk (right): 1—stationary zones, 2—stress-strained zone, 3—rigid zones.
Crystals 14 00126 g001
Figure 2. Normalized velocity field with streamlines (left) and velocity vectors (right) for the central position of a disk moving downward in a germanium melt (f = 25 Hz, A = 80 μm, R = 0.1 mm).
Crystals 14 00126 g002
Figure 3. Normalized instantaneous velocity with velocity vectors (arrows) at the edge of the disk (f = 25 Hz, A = 100 μm, R = 0.1 mm) for Ge and CdTe melts with residual fluid movement when the oscillating disk stops at bottom dead center.
Crystals 14 00126 g003
Figure 4. Velocity field averaged over the oscillation period, normalized to the oscillatory component, with streamlines (left) and velocity vectors (right) for the central position of a disk moving downward in a germanium melt (f = 25 Hz, A = 80 μm, R = 0.1 mm) after 90 s of calculation.
Crystals 14 00126 g004
Figure 5. Dependence of the modulus of the maximum speed of melts along the central axis on the of oscillation intensity (I).
Crystals 14 00126 g005
Figure 6. Dependence of the modulus of the maximum velocity of melts along the central axis on the intensity of oscillations I on the scale of laminar stationary oscillatory flow of the melt.
Crystals 14 00126 g006
Figure 7. Numerical simulation of momentum viscous dissipation rate (left half of the simulated volume, see Section 3.2) and velocity contours colored by velocity magnitude and supported by velocity vectors for NaNO3 melt activated by oscillation (f = 25 Hz, A = 500 μm) of cylindrical disc with an edge radius 0.1 mm (left) and 0.8 mm (right).
Crystals 14 00126 g007
Figure 8. Numerical simulation of momentum viscous dissipation rate (left half of the simulated volume, see Section 3.2) and velocity contours colored by velocity magnitude and supported by velocity vectors for CdTe melt activated by oscillation (f = 25 Hz, A = 500 μm) of cylindrical disc with an edge radius 0.1 mm (left) and 0.8 mm (right).
Crystals 14 00126 g008
Figure 9. Numerical simulation of momentum viscous dissipation in NaNO3, CdTe (f = 25 Hz, A = 500 μm) and Ge (f = 25 Hz, A = 100 μm) melts activated by oscillation of cylindrical disc with different curvature of a sharp edge (R).
Crystals 14 00126 g009
Table 1. Geometrical parameters of the numerical model.
ParameterValue, mm
Simulating area length100
Simulating area height100
Disk diameter, D80
Disk thickness, d10
Edge radius, R0.1; 0.2; 0.4; 0.8
Distance from the disk to the bottom and top walls45
Disk oscillation amplitude, A0.080–0.500
Frequency oscillation, f10–30 Hz
Table 2. Properties of the melts under study at T = Tm + 5 K.
PropertyValue
NaNO3GeCdTe
Melting temperature, Tm (K)579.951211.41369
Density, ρ (kg/m3)190354905661.8
Dynamic viscosity, μ (Pa s)2.2 × 10−37.14 × 10−42.33 × 10⁻³
Table 3. Modules of the maximum melt velocity along the central axis at various values of amplitude, frequency, disk edge radius and intensity.
f, HzA, μmR, mmI, kg0.5 m1.5 s−1v, mm·s−1
Ge
101250.18.000.126
102000.132.772.240
201000.116.390.744
201100.121.811.199
25800.113.110.535
251000.125.611.370
251100.134.082.217
251250.150.013.635
301100.149.083.376
251000.212.800.587
251000.46.400.096
251000.83.200.060
25500.056.400.096
CdTe
101250.12.490.064
102000.110.200.657
103000.134.422.683
201000.15.100.217
25800.14.080.091
251000.17.970.474
251250.115.561.114
255000.1996.0324.86
255000.2498.0120.18
255000.4249.0114.55
255000.8124.508.757
NaNO3
255000.1611.5721.67
255000.2305.7916.27
255000.4152.899.655
255000.876.454.857
Disclaimer/Publisher’s Note: The statements, opinions and data contained in all publications are solely those of the individual author(s) and contributor(s) and not of MDPI and/or the editor(s). MDPI and/or the editor(s) disclaim responsibility for any injury to people or property resulting from any ideas, methods, instructions or products referred to in the content.

