1. Introduction
Ceria (CeO
2) is an auspicious and widely applied catalytic material, owing to its oxygen storage and release capacity originating from the reversible redox reaction between Ce
3+ and Ce
4+ ions inside the ceria crystal lattice, as well as its thermal and mechanical stability and reasonable price. The physicochemical properties of ceria can be further improved by the introduction of defects, i.e., by replacing the cerium atom in the crystal lattice of ceria with an atom of different radius or valence, which is known as doping. The doping elements can be various transition or rare earth elements [
1], among which zirconium stands out as one of the most common and most researched dopants [
2,
3]. Zirconium-doped ceria (Ce
xZr
1−xO
2) solid solution shows improved oxygen mobility and oxygen storage capacity, better thermal stability, and enhanced catalytic activity [
2]. Therefore, Zr-doped ceria has been extensively investigated for its application in supercapacitors [
4], where it was proven that Zr doping enhances the pseudocapacitive behavior of ceria; in sensors [
5]; as anticorrosion pigments in waterborne epoxy–polymer coatings [
3]; and, most importantly, in catalysis [
6,
7,
8,
9,
10,
11]. Comprehensive reviews of the various possible catalytic applications of doped cerium oxide are given in the works of Trovarelli et al. [
9,
10] and Montini et al. [
11]. The well-established catalytic uses of Ce
xZr
1−xO
2 are as a promoter in three-way catalytic converters for the removal of pollutants stemming from the incomplete combustion of gasoline in automobile engines and a catalyst for the oxidation of soot and reduction of NO
x in diesel engines [
9,
11]. Among the emerging catalytic applications, the catalytic oxidation of volatile organic compounds presents an important area of research from the perspectives of environmental and human health protection [
11,
12]. Ceria is usually used in combination with noble metals or in the form of mixed oxides. In case of, e.g., methane, which is considered to be the most difficult to oxidize, pure ceria and mixed oxides, such as CeO
2-ZrO
2 systems, displayed satisfactory conversion in the medium to high temperature range, while the addition of noble metals shifted the conversion to lower temperatures [
11]. However, the goal is to achieve high conversion at lower temperatures without the addition of noble metals or, at least, the addition of as little as possible. In other words, the final goal is to make the abatement of VOCs an energy efficient and low-cost process. Therefore, the choice of the correct catalyst, with a high specific surface area, good catalytic activity, and thermal and mechanical stability, is crucial. The desired properties can be achieved by choosing the right dopant, reducing the particle size to the nanoscopic scale, and tuning the morphology of the prepared catalyst, which is directly linked to the choice of the correct preparation method.
There are many available methods for the preparation of ceria nanoparticles, including hydrothermal and solvothermal synthesis, the sol–gel method, mechanochemical synthesis, precipitation method, spray pyrolysis, etc. [
13]. Solution combustion synthesis (SCS) has become a very attractive method for the preparation of nanomaterials in the last few years because it involves a very simple and fast process that does not require complicated equipment or expensive chemicals. Essentially, SCS is a self-sustained reaction between oxidants (usually metal nitrates) and a fuel (such as urea, citric acid, different amino acids, etc.), which are dissolved in water to form a saturated solution and heated until all the water evaporates and the mixture self-ignites. This method enables the preparation of nanosized metal oxide materials, often without the need for subsequent thermal treatment; a uniform addition of small amounts of the doping agent; and a good control of the reaction parameters, mainly through the fuel to oxidant ratio (F/O), which has a significant effect on the properties (crystallite size, morphology, specific surface area, etc.) of the final product [
14]. The fuel to oxidant ratio is established by balancing reducing elements, with valences that are considered positive, and oxidizing elements with negative valences. The fuel and the oxidant both consist of oxidizing and reducing elements, which is why the fuel to oxidant ratio is conveyed by elemental stoichiometric coefficients as the equivalence ratio (
φ), defined by the following equation:
where
nfuel is the molar fraction of the chosen fuel and
noxidant is the molar fraction of metal salts used as oxidants. Metal cations, carbon, and hydrogen are regarded as reducing elements with their respective valences, oxygen as an oxidizing element with a valence of −2, and nitrogen as a neutral element with zero valence. When the equivalence ratio is equal to 1, the mixture is stoichiometric and maximal energy is released; when it is <1, the mixture is fuel lean; and when
φ > 1, the mixture is fuel rich [
15].
Even though zirconium-doped ceria is not a novel material, but rather a well-researched and valuable catalyst, the improvement of its properties in order to match various applications is of utmost importance. Our group has perfected the combustion synthesis of extremely porous and catalytically active nanomaterials, as well as catalyst supports using glycine as the fuel and metal nitrates as oxidants [
15,
16]. Additionally, extensive work has examined ceria-based nanocatalysts doped with various transition metals and prepared by different synthesis methods, aimed at the oxidation of volatile organic compounds [
17,
18]. The present work is the result of this combined knowledge and is a thorough study of nanocrystalline ceria catalysts doped with 10, 20, and 30 mol. % of zirconium prepared by a simple and affordable solution combustion synthesis method. The prepared nanocatalysts, as well as samples thermally treated at 500 °C for 2 h, are characterized by various techniques. Their catalytic activity is tested on the benzene, toluene, ethylbenzene, and
o-xylene (BTEX) oxidation process. The results of this study provide new insights into the morphology, thermal stability, and catalytic activity of zirconium-doped ceria nanocatalysts.
3. Results and Discussion
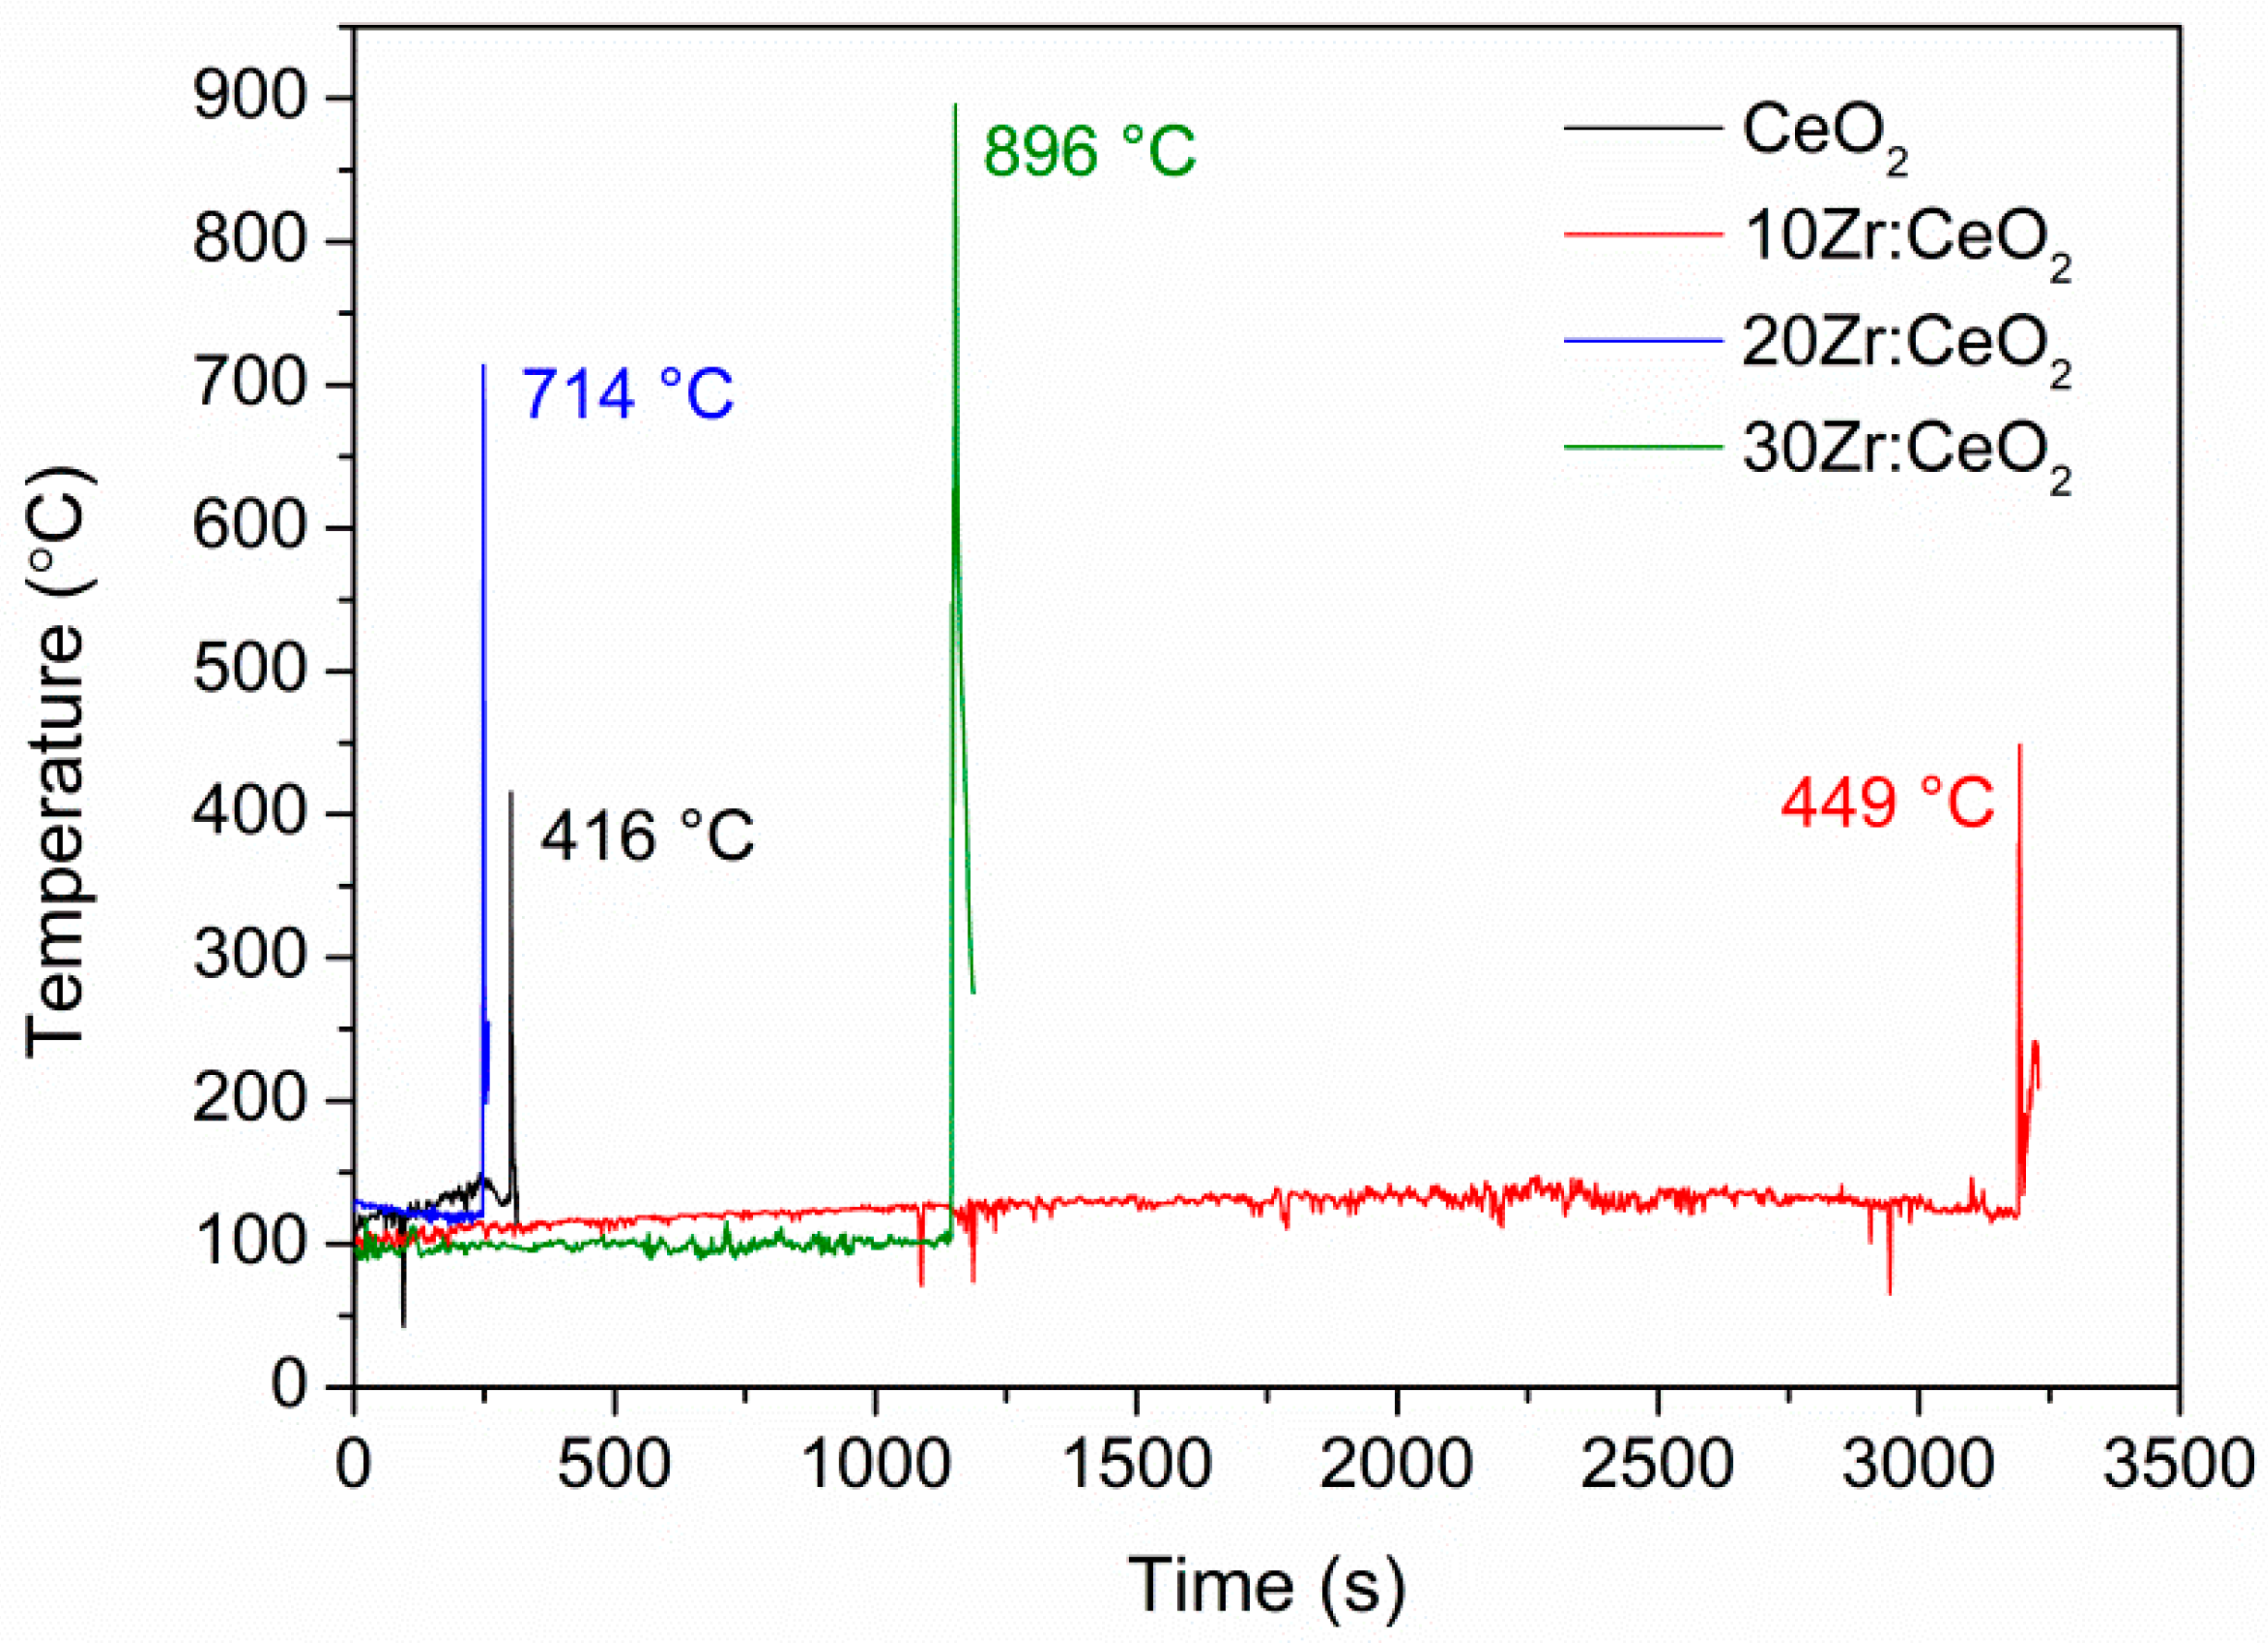
As was mentioned, the reaction mixture temperature was monitored with an IR pyrometer and the results are shown in
Figure 1. When the temperature is high enough to initiate a spontaneous combustion reaction, an intense increase in temperature can be observed. It can also be seen that the maximum temperature of the combustion process increases with an increase in the amount of zirconium doping, and the highest combustion temperature (896 °C) is recorded for the reaction mixture containing 30 mol. % Zr. The reaction is highly exothermic and very fast, as evidenced by the sudden drop in temperature after the maximum is reached, which signifies the completion of the reaction. Oscillations in the temperature before the start of the combustion reaction are caused by directing the targeting beam of the IR pyrometer at the bubbles that are formed during the heating of the reaction mixture. Regarding the ignition time, it is not possible to observe a trend because the ignition depends on the amount of residual water at the moment when the mixing is stopped, the reaction mixture transferred to the sand bath, the position of the porcelain bowl in the sand bath, and the configuration of the foil with which the container is covered in order to prevent excessive sample loss. The synthesis of the pure ceria sample seemed the most violent, with an intense flame, even though the maximum temperature was the smallest, and the final product consisted of yellow, light, and porous flakes that were crushed into powder. The combustion reactions of zirconium-doped samples were less intense, but the final product was similar in appearance, except for the sample 30Zr:CeO
2, which consisted of light-yellow sheets.
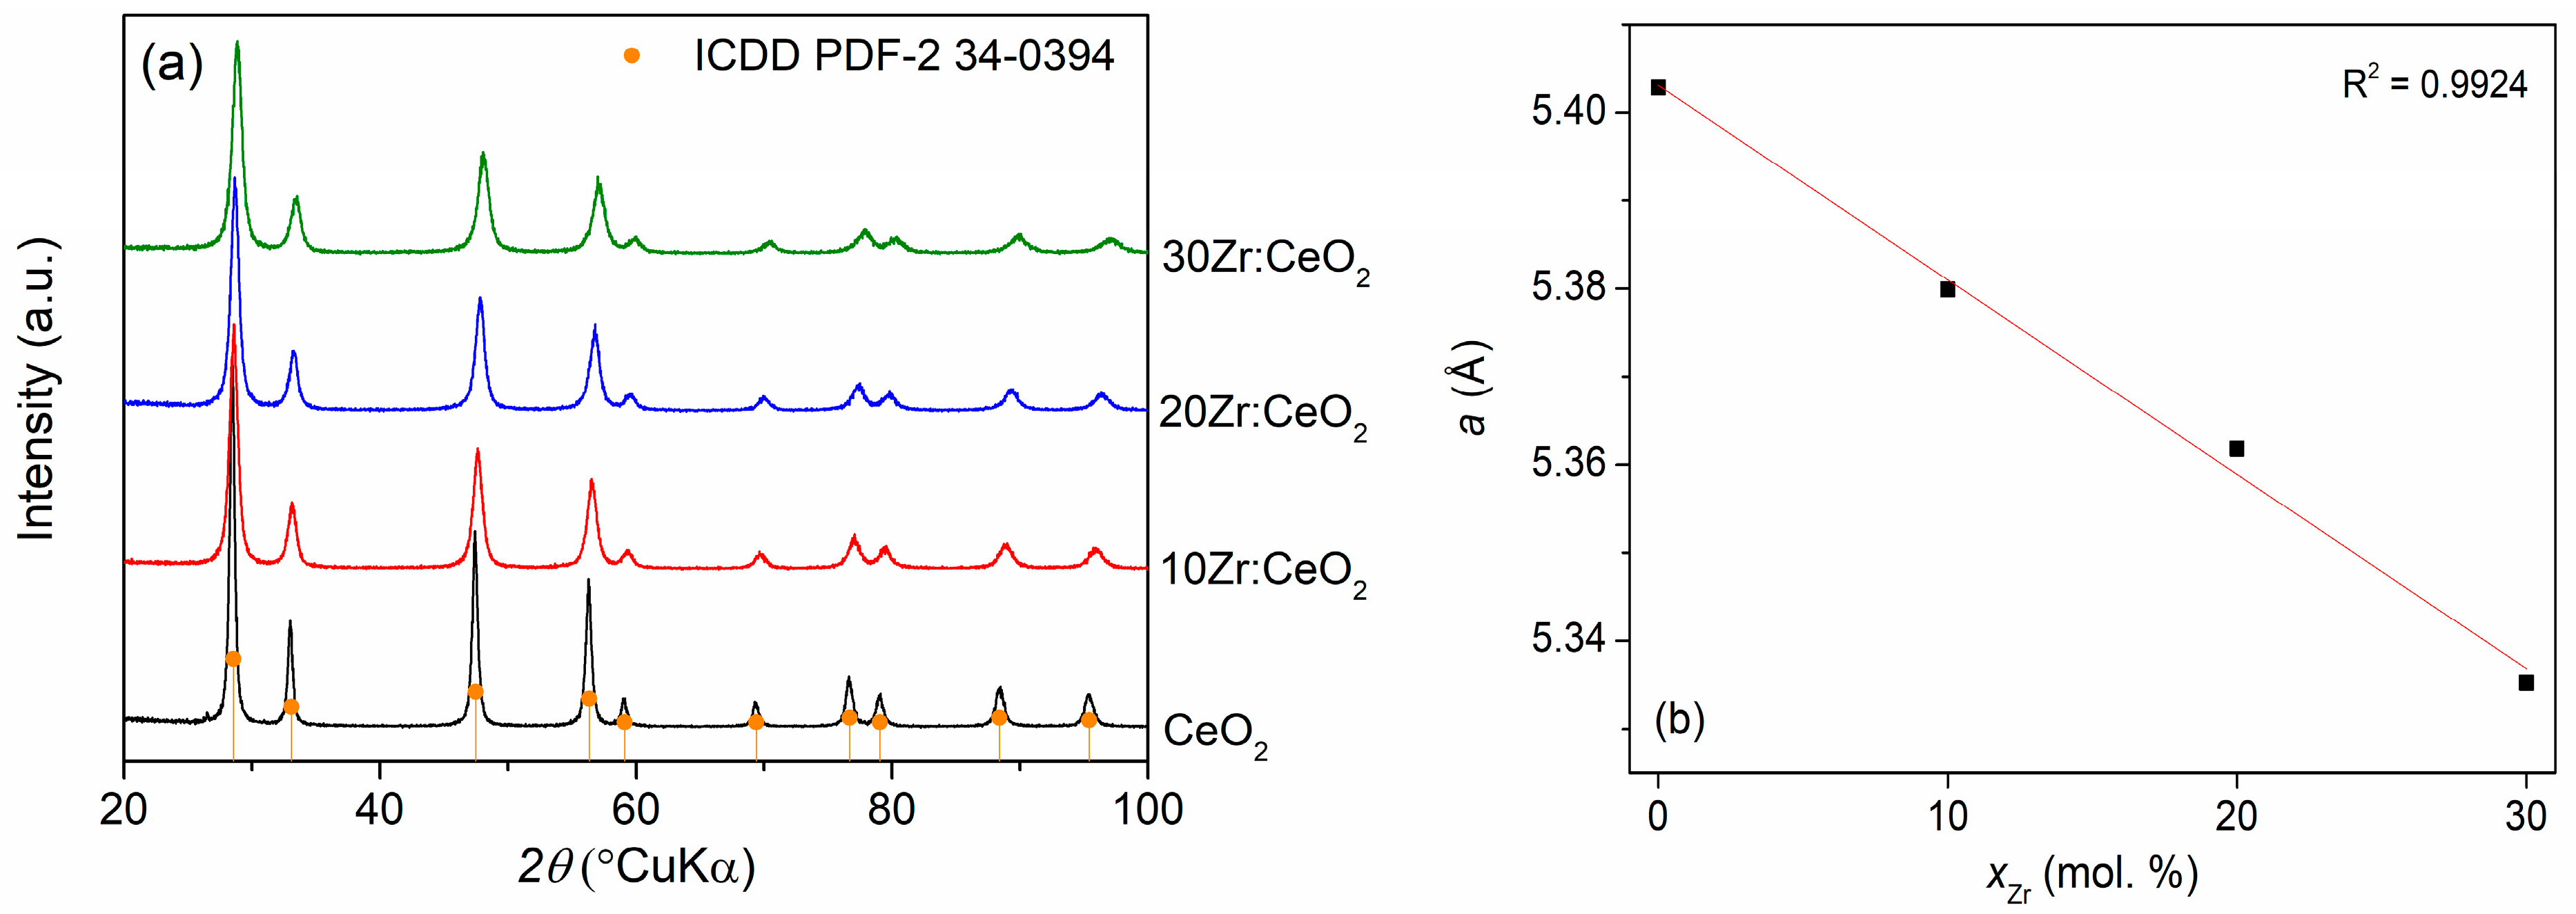
Due to the extreme similarity of XRD patterns of as-prepared and thermally treated samples, only XRD patterns of thermally treated samples are shown in
Figure 2a. It can be seen that they consist solely of ceria diffraction peaks (ICDD PDF-2 34-0394). No zirconium-based phases are visible, even at the highest doping amount, neither for the as-prepared nor thermally treated samples, indicating that zirconium is incorporated into the ceria crystal lattice, forming a solid solution. The crystallite sizes listed in
Table 1 show a clear decreasing trend with increasing zirconium doping amount, signifying a positive influence of zirconium on this property of ceria nanocatalysts. The reduction in crystallite size is particularly pronounced when comparing the undoped ceria sample with the 10 mol. % Zr-doped sample, while the differences between the doped samples are much smaller. This indicates that the increase in Zr amount after 10 mol. % does not dramatically affect the crystallite size.
Another occurrence observed on the XRD patterns is a small but noticeable shift in the peaks to higher angles with the increase in the zirconium doping amount, which indicates a change in unit cell constant values with the addition of zirconium.
Figure 2b shows the dependence of the unit cell constant (
a) of ceria cubic crystal structure, calculated based on the fitting results of all obtained peaks in the XRD spectra, on the zirconium doping amount. An almost-perfect linear dependence indicates that the obtained samples abide by Vegard’s law, an empirical rule according to which the unit cell constant of a solid solution of two components is approximately equal to the weight average of the unit cell constants of the specified components at the same temperature [
20]. This is a proof of a solid solution formation, or more precisely, of substitutional doping of Zr in the ceria crystal lattice, since the replacement of larger Ce
4+ (97 pm) with smaller Zr
4+ (84 pm) is expected to cause a reduction in the crystal lattice [
7].
The crystallite sizes of thermally treated samples are very similar to the as-prepared samples, pointing out the positive influence of zirconium on ceria thermal stability. This is especially true for the 30 mol. % Zr-doped sample, for which the crystallite size, when including the error of the Scherrer method, stays practically the same after thermal treatment. The thermal stability of a catalyst is a very important factor in catalytic processes, because it directly affects its catalytic activity and specific surface area; thus, these results are very auspicious.
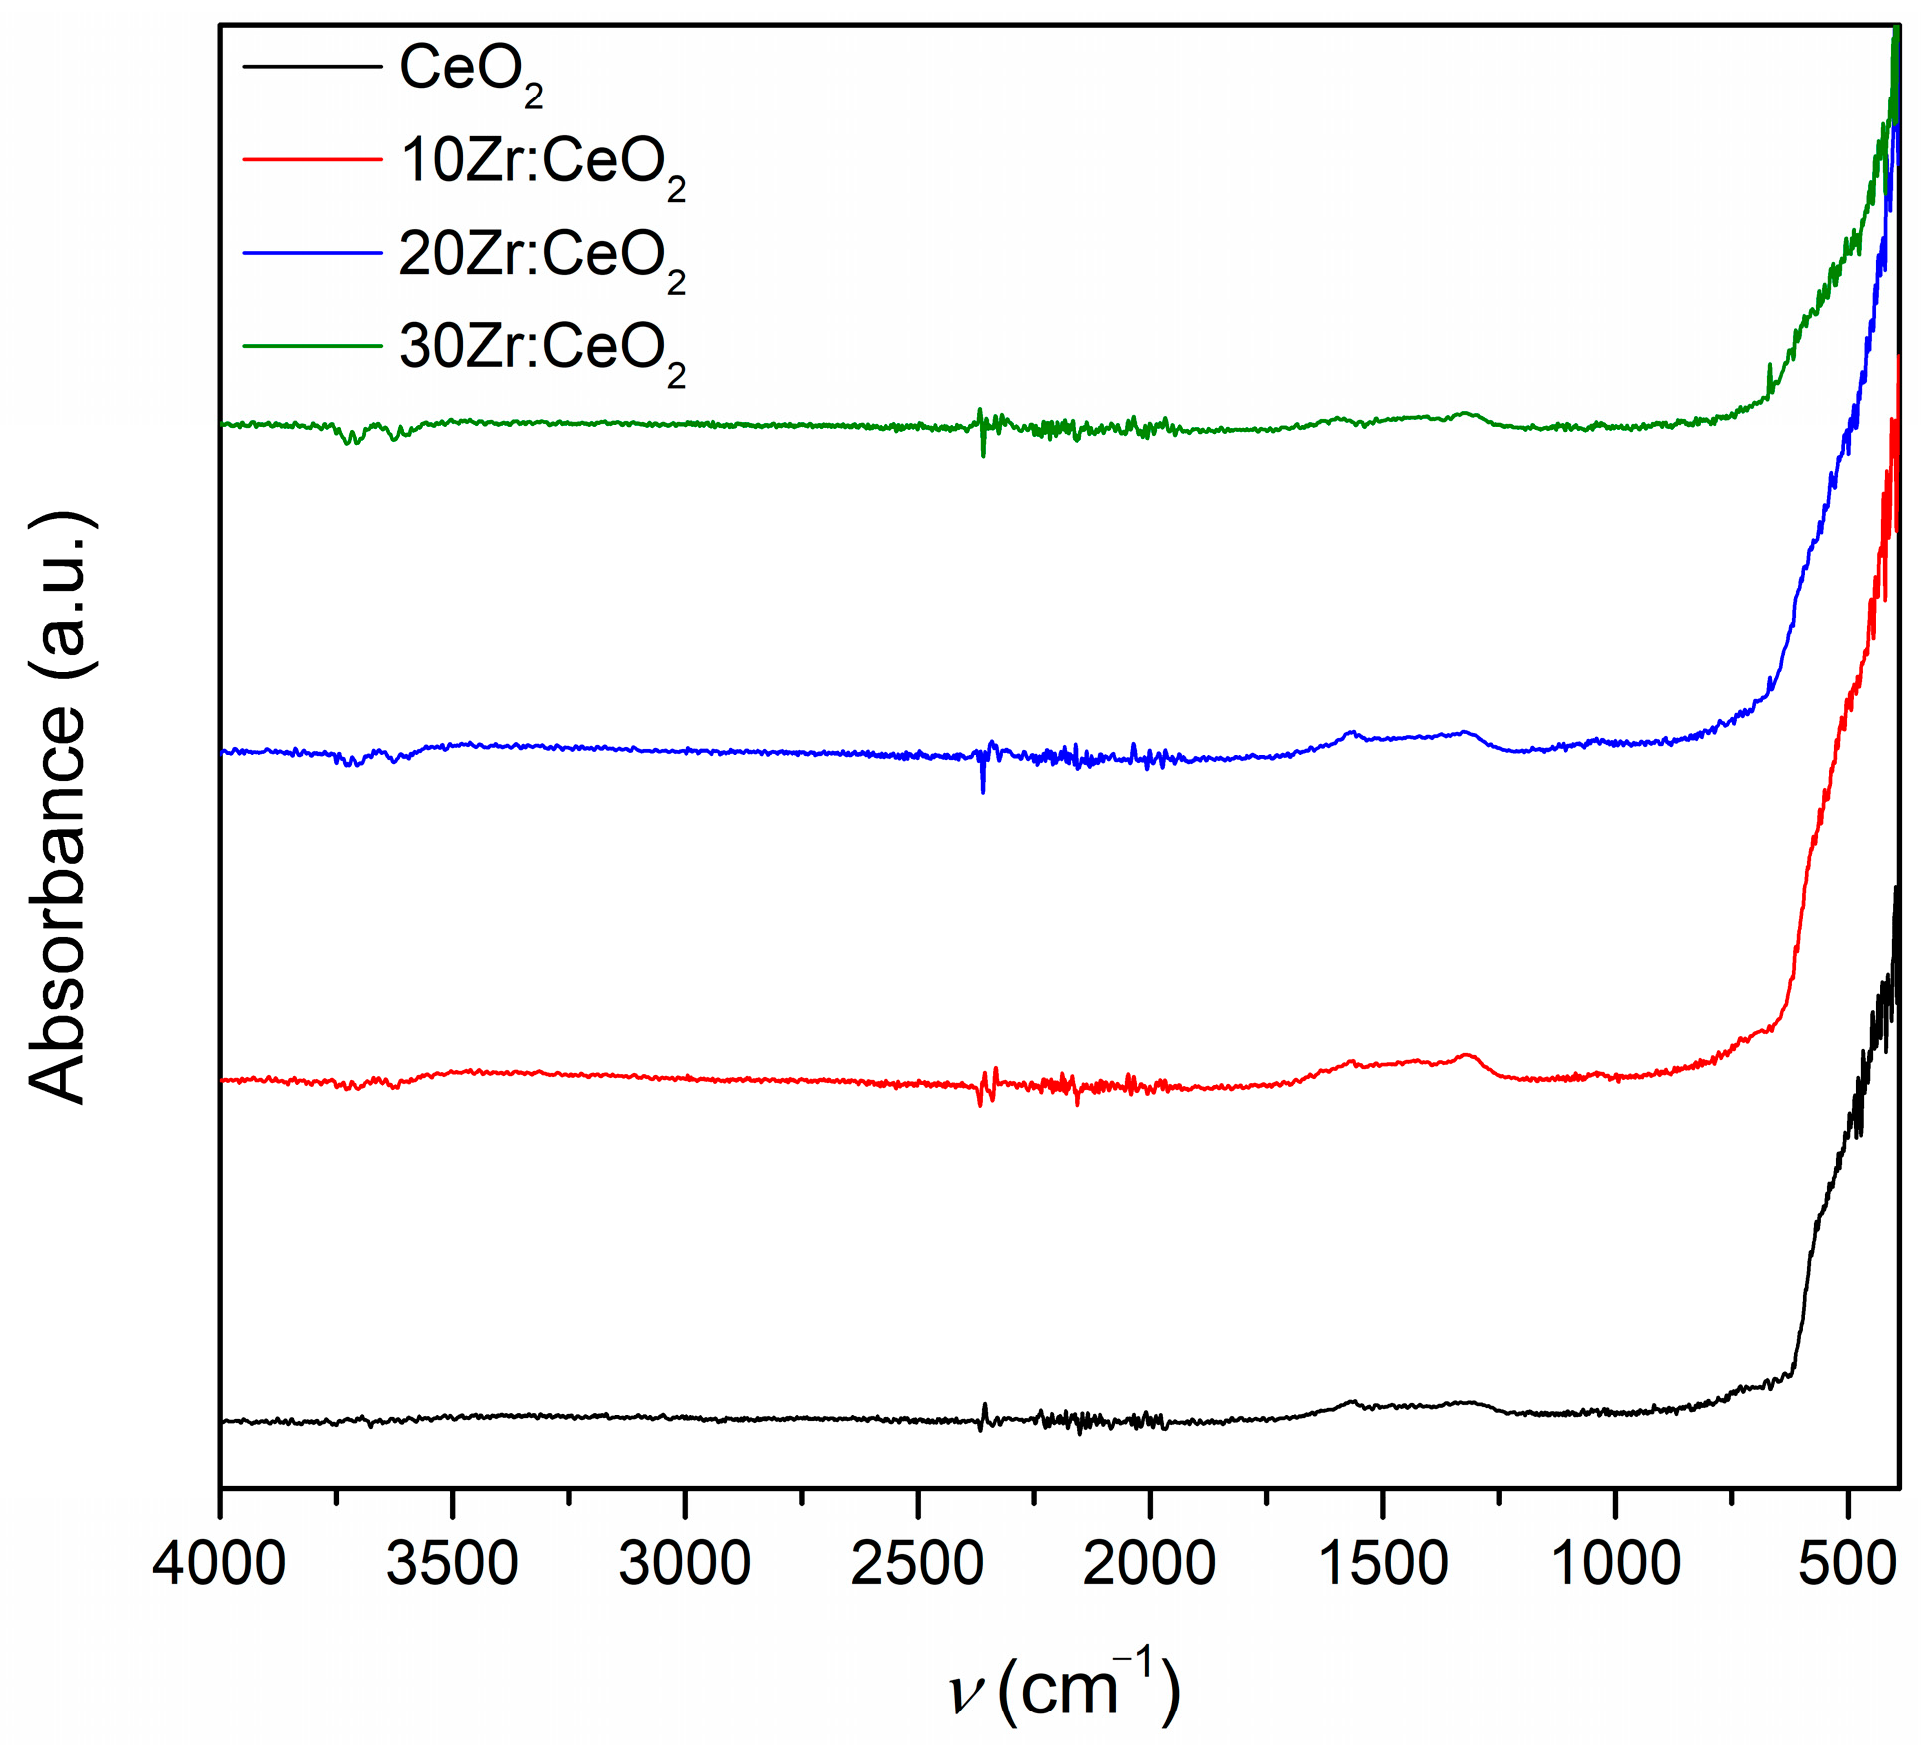
The FTIR spectroscopy results of as-prepared samples displayed in
Figure 3 show bands corresponding to vibrations in metal–oxygen bonds present in all samples in the fingerprint region to 600 cm
−1. The bands between 1300 and 1700 cm
−1 encompass the bands for nitrate residues, as well as glycine and organic residues, indicating that the reaction is not complete, i.e., that there are remnants of precursors and combustion products present in the samples. However, these bands are not pronounced, but rather broad and faint, which suggests that these remnants are present in a small amount. The indistinct band at around 2300 cm
−1 belongs to carbon dioxide adsorbed on the surface of the samples, while the faint, broad band between 3200 and 3700 cm
−1 is characteristic of the stretching of O-H bonds in water molecules [
21,
22]. Samples obtained through combustion synthesis usually have considerable specific surface area, so the presence of adsorbed species, such as water and carbon dioxide, is quite common. The FTIR spectra of thermally treated samples (not shown in this paper) are quite similar to the as-prepared samples, but with decreased intensity of nitrate, organic, and water-related bands, which is to be expected as a consequence of thermal treatment.
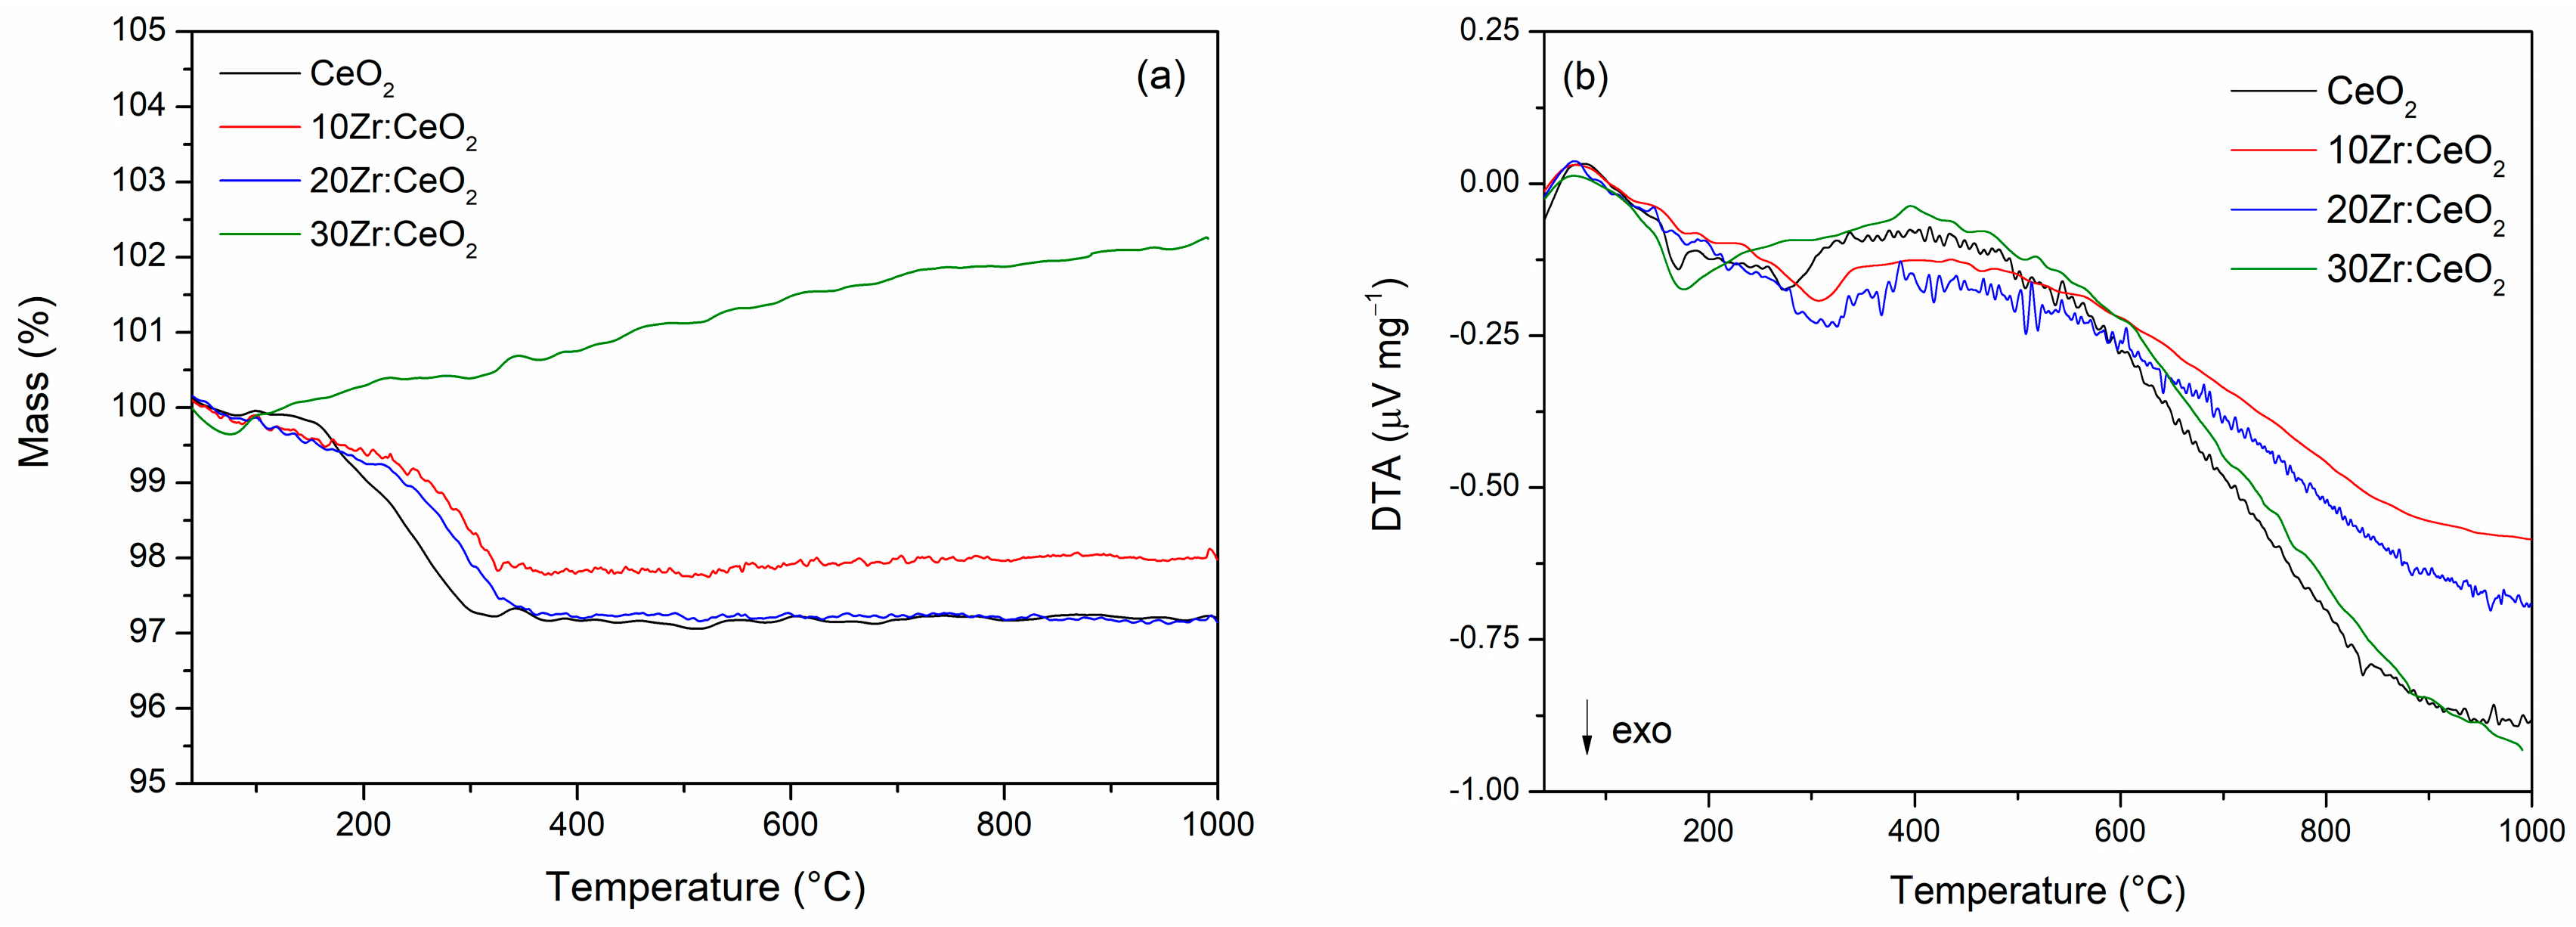
Differential thermal and thermogravimetric analyses were performed to shed light on thermal properties and stability of prepared samples. The results are presented in
Figure 4a,b. The pure ceria sample and 20Zr:CeO
2 sample show the largest total mass losses, of ~2.85%. The 10Zr:CeO
2 exhibits a slightly smaller total mass loss of 2%, while the sample 30Zr:CeO
2 exhibits a small mass loss (~0.37%) below 100 °C, which is followed by continuous mass gain (~2.25%) to 1000 °C. A small mass loss below 100 °C, present in all samples (
Figure 4a) and followed by a small endothermic peak on the DTA curve (
Figure 4b), corresponds to the loss of water and other volatile adsorbed species [
23,
24,
25]. All samples except 30Zr:CeO
2 show the greatest mass loss in the range between 150 and 350 °C, after which the mass remains unchanged. The pure ceria sample shows two exothermic peaks in this region centred at ~170 and ~274 °C, while 10 and 20 mol. % Zr-doped samples display only one peak at ~310 °C. According to literature [
24], this mass loss can be attributed to the decomposition of organic matter, the decomposition of reactants that did not react during combustion synthesis, and the burning of gaseous decomposition products.
The 30 mol. % Zr-doped ceria sample differs from pure and other doped samples. Namely, the combustion process of that sample was the least intense and resembled smouldering rather than burning. A powder of extremely low density was also obtained, and the very morphology of that sample is different compared to the others, as will be shown below. The preparation of the 30Zr:CeO
2 sample for thermal analysis was a problem precisely due to the low density, and the sample had to be well pressed into the crucible so that it would not fly out during the analysis. Mass increase during DTA-TGA analysis in the air atmosphere is most often a consequence of an oxidation process; however, in this case, the only possible process is the oxidation of Ce
3+ to Ce
4+, and the XPS analysis shows that the sample with 10 mol. % Zr has more Ce
3+ ions on the surface and still does not show an increase in mass. Therefore, a different explanation had to be sought. Repeated analyses showed that the more the sample is pressed into the crucible, the smaller the increase in mass, which indicates that the mass gain is most likely a consequence of buoyancy. When gas is introduced into the chamber, the sample experiences a buoyant lift according to Archimedes’ principle. As the temperature rises, the gas becomes less dense, making the buoyant lift less pronounced, and the sample starts moving downward, which is registered as weight gain [
26].
SEM images of all as-prepared samples are shown in
Figure 5. It can be observed that the samples CeO
2, 10Zr:CeO
2, and 20Zr:CeO
2 contain particle agglomerates with a sea-wave foam-like, extremely porous morphology. Sample 30Zr:CeO
2 also exhibits a porous morphology, but with sponge-like particle agglomerates. The porous microstructure is caused by the formation of gases during the synthesis.
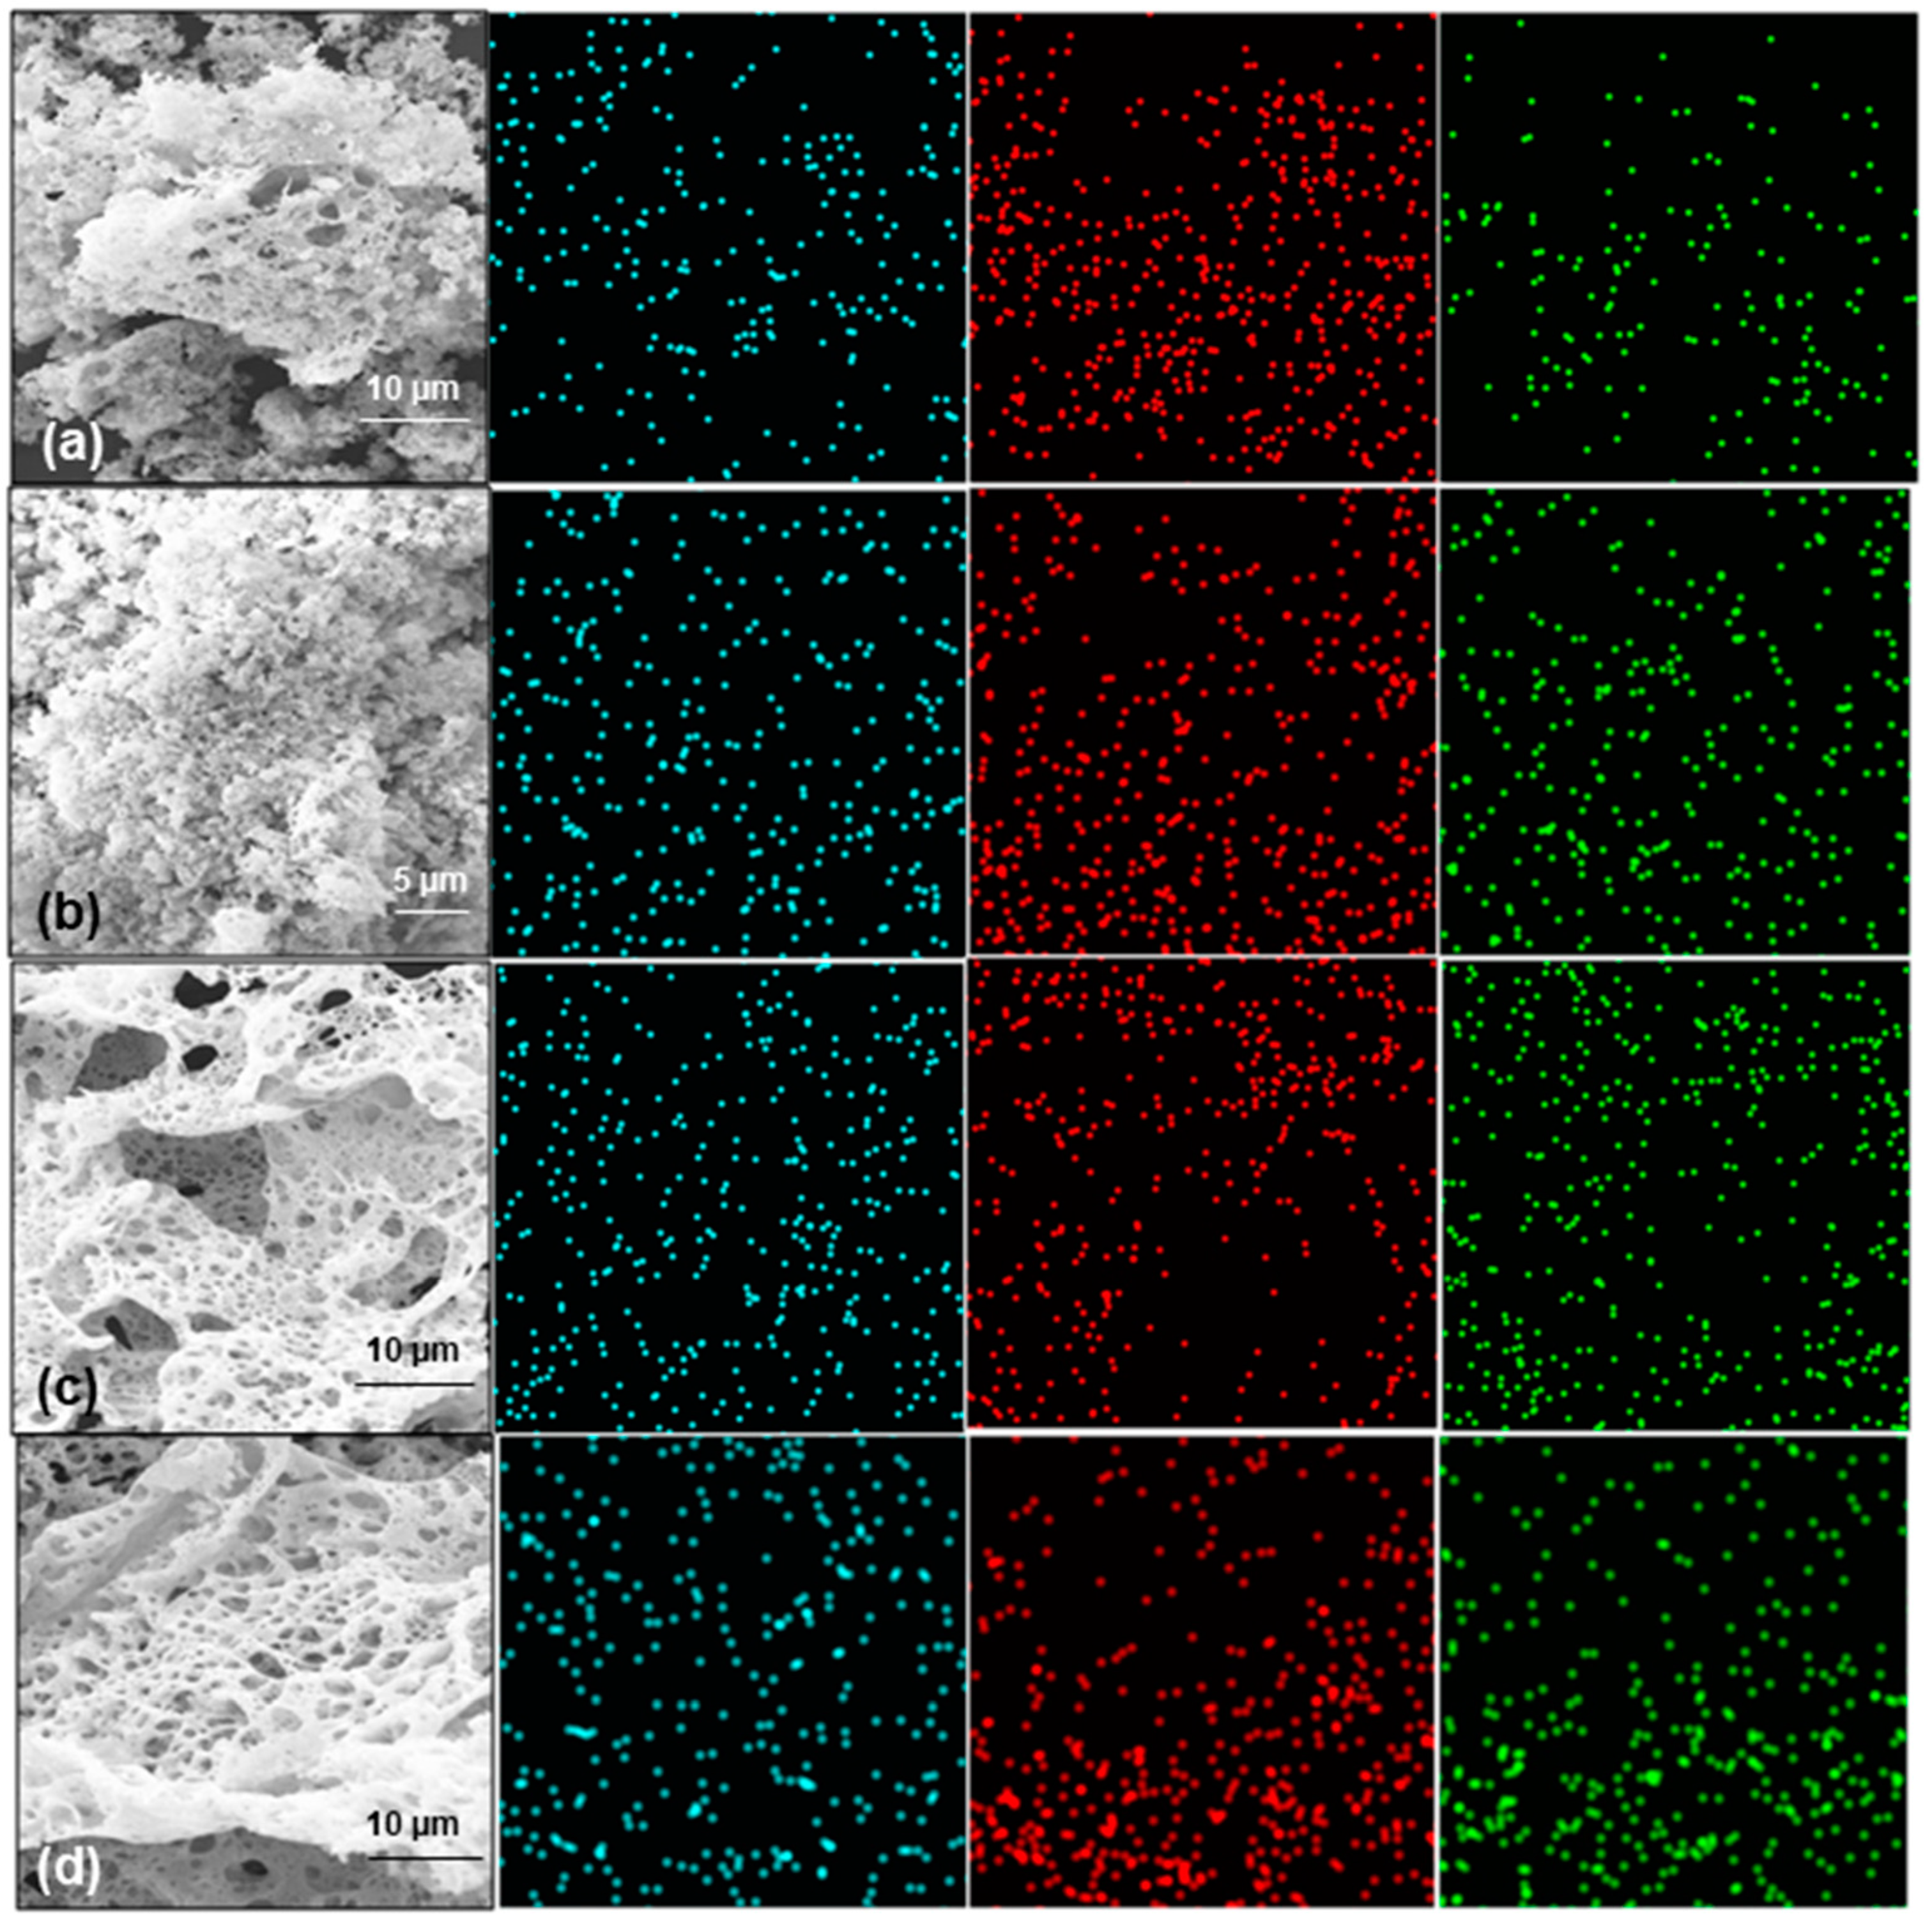
Figure 6 shows the distribution of individual elements in the zirconium-doped as-prepared samples, as well as sample 30Zr:CeO
2 that was thermally treated at 500 °C for 2 h. The distribution of Ce, O, and Zr ions is mostly homogeneous throughout the samples, especially taking into account the porosity of the samples, which makes the EDS map appear disordered. It can also be observed that the amount of Zr increases with the increase in the nominal amount.
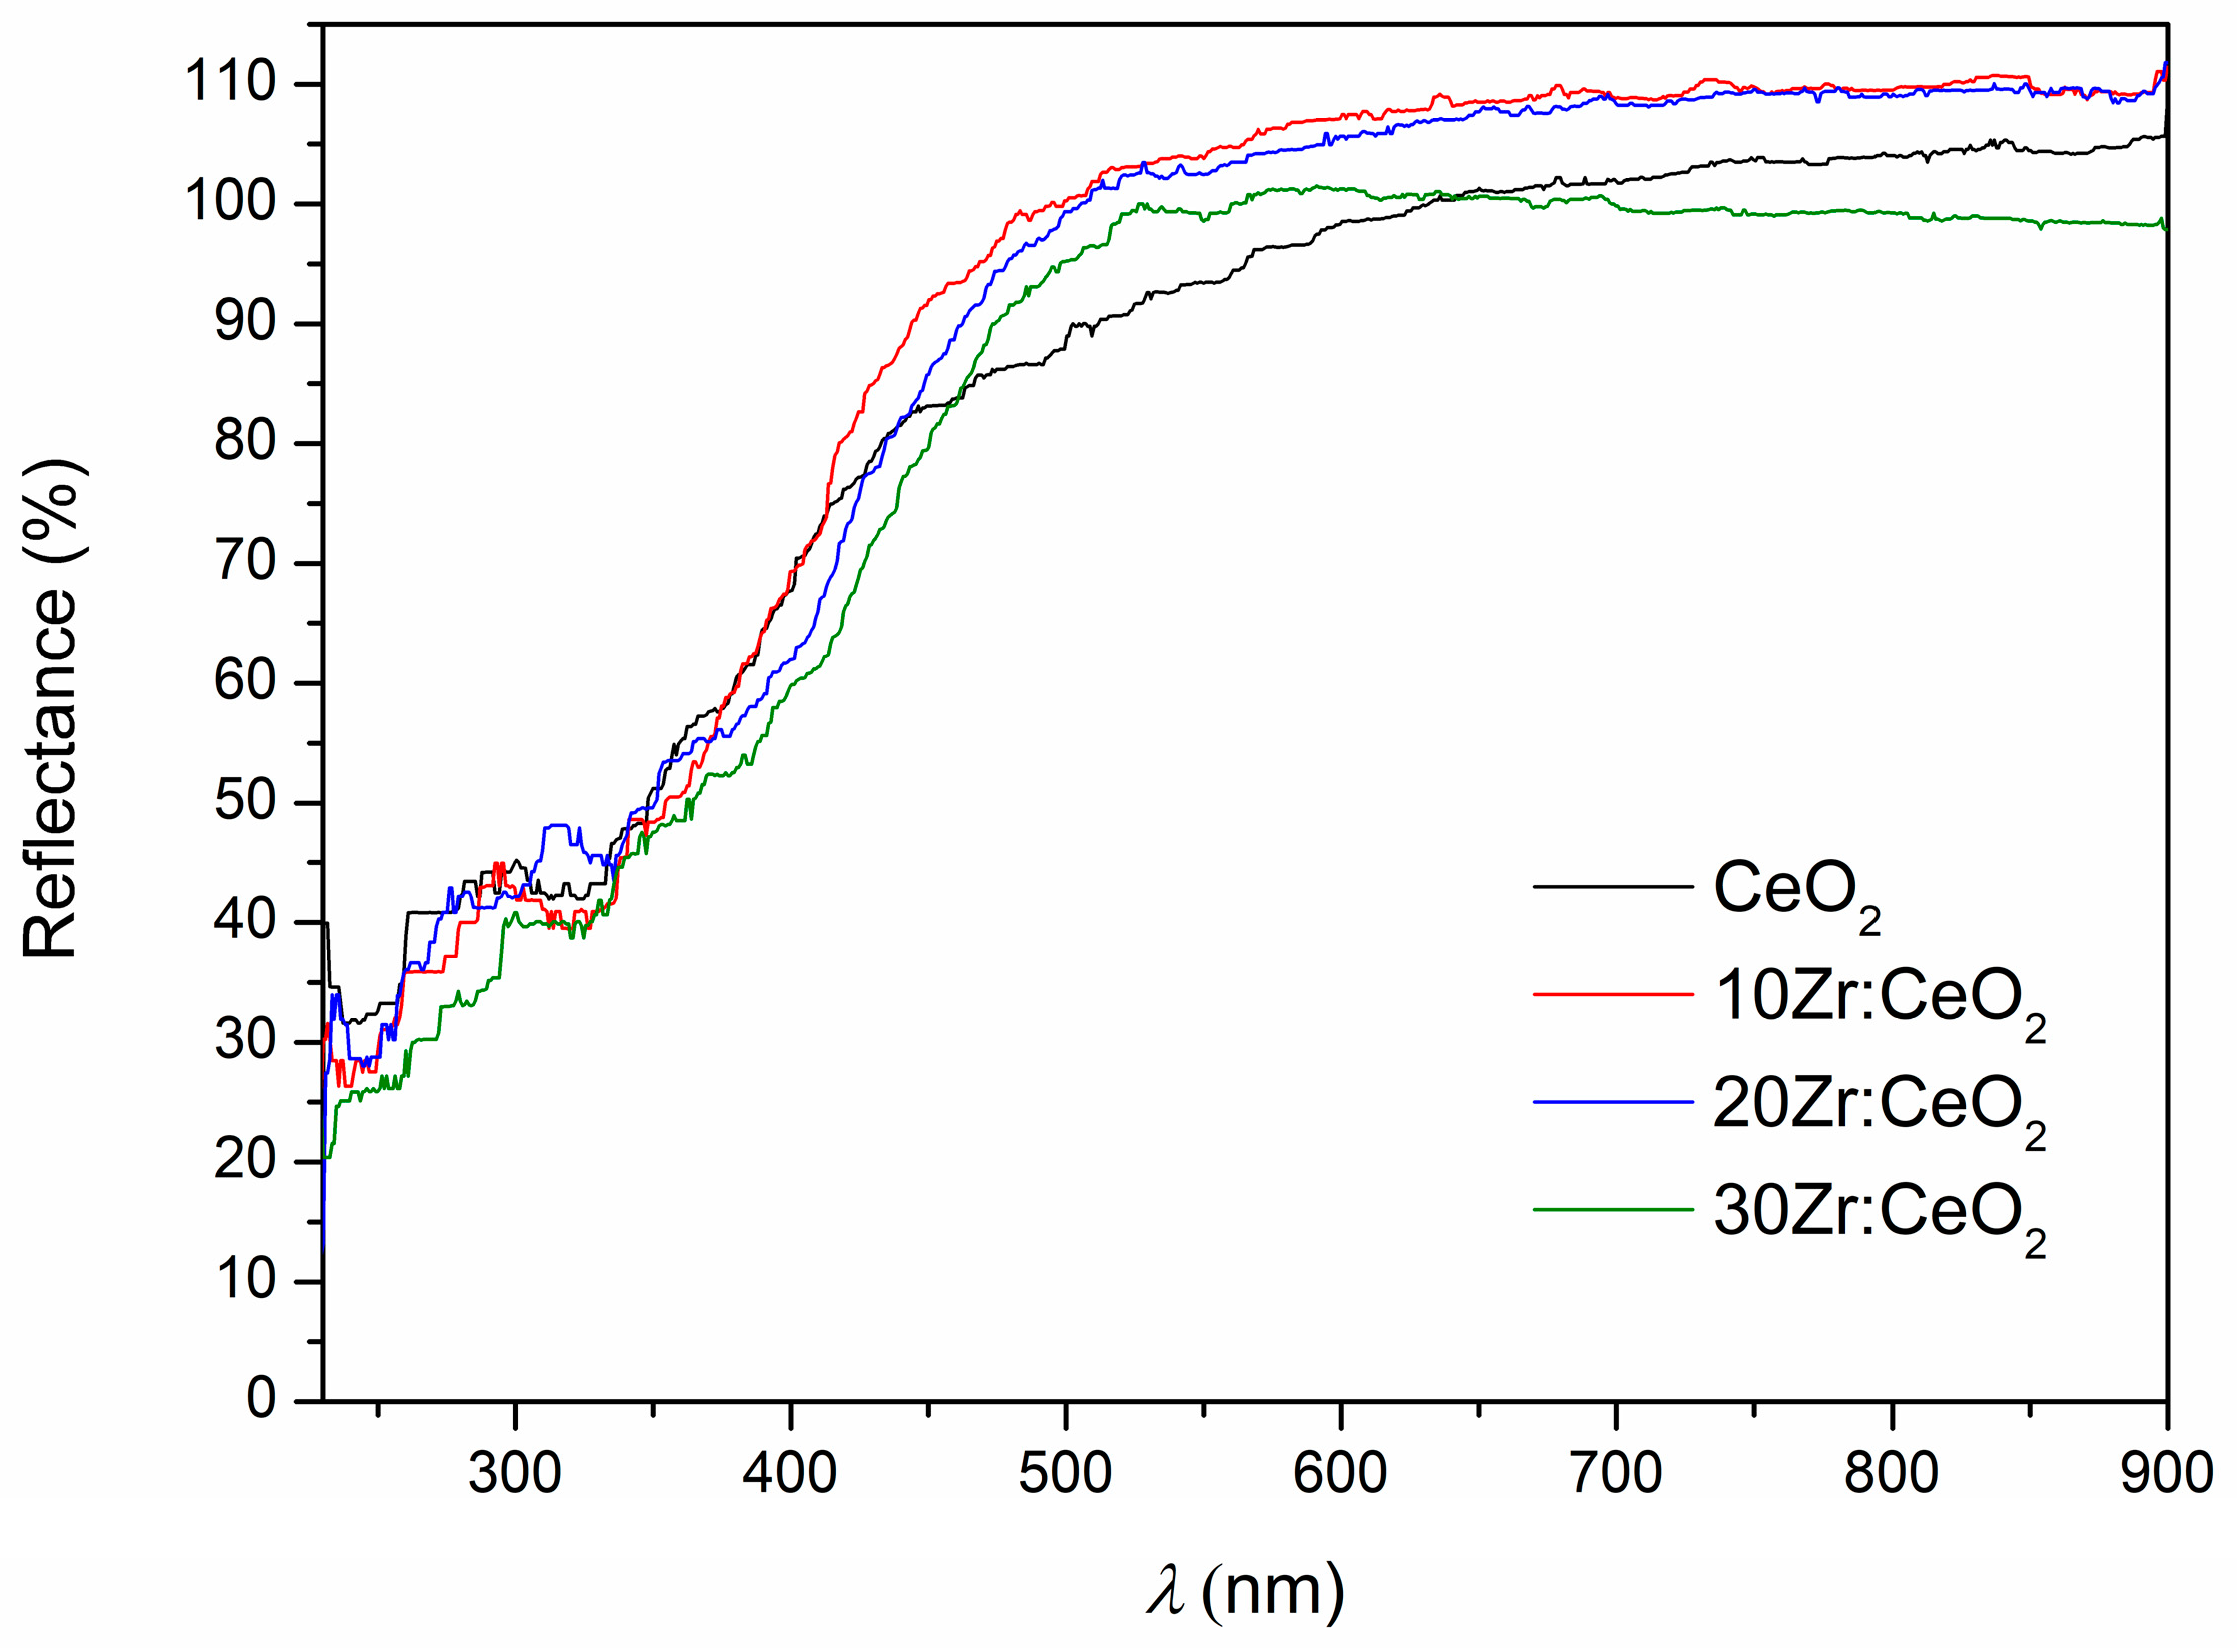
The UV-Vis DRS spectra (
Figure 7) show that all samples exhibit high reflectance in the visible region, a decrease in reflectance at the transition from the visible to the UV region, and high absorbance in the UV region. It can be seen that the reflectance values in the visible region exceed 100%, which should be impossible. There are several possible reasons: contamination of the standard, a too-smooth sample surface resulting in a noticeable proportion of specular reflection, and the fact that cerium is a lanthanide that can exhibit luminescence. In our case, the latter two reasons are the most likely.
Even though ceria is usually considered a direct semiconductor, the Tauc plot for direct transitions did not result in a linear region that could enable a valid determination of the band gap. Therefore, only indirect band gap values obtained from the Tauc plot are listed in
Table 1. The band gap value listed in the literature for both direct and indirect transitions is ~3.19 eV for bulk ceria and is slightly increased in the case of CeO
2 nanoparticles due to the quantum confinement effect [
27,
28]. The band gap values of all samples in this work are much smaller than the literature value (
Table 1): the band gaps of pure and 10 mol. % Zr-doped CeO
2 are very similar, and then a decline is observed with an increase in zirconium doping amount. The redshift instead of a blueshift in the band gap of pure ceria nanoparticles is most likely the consequence of Ce
3+ ions on the surface of the nanoparticles, as well as oxygen defects, which instil defect energy states between the valence and the conduction band [
29,
30]. In case of zirconium-doped samples, a decrease in band gap with an increase in zirconium doping is often reported in the literature and explained by the hybridization of empty Zr4d orbital with the Ce4f orbital, which results in a broadening of the conduction band and a narrowing of the band gap [
2,
7,
31]. Nevertheless, the band gap values of zirconium-doped ceria samples are unprecedentedly small, which is beneficial for a potential use in photocatalysis since visible light could be used for excitation. However, the activity of a photocatalyst depends on multiple factors, which is why further experiments are necessary to assess their suitability for photocatalytic application.
XPS analysis was performed on two representative samples (10Zr:CeO
2 and 30Zr:CeO
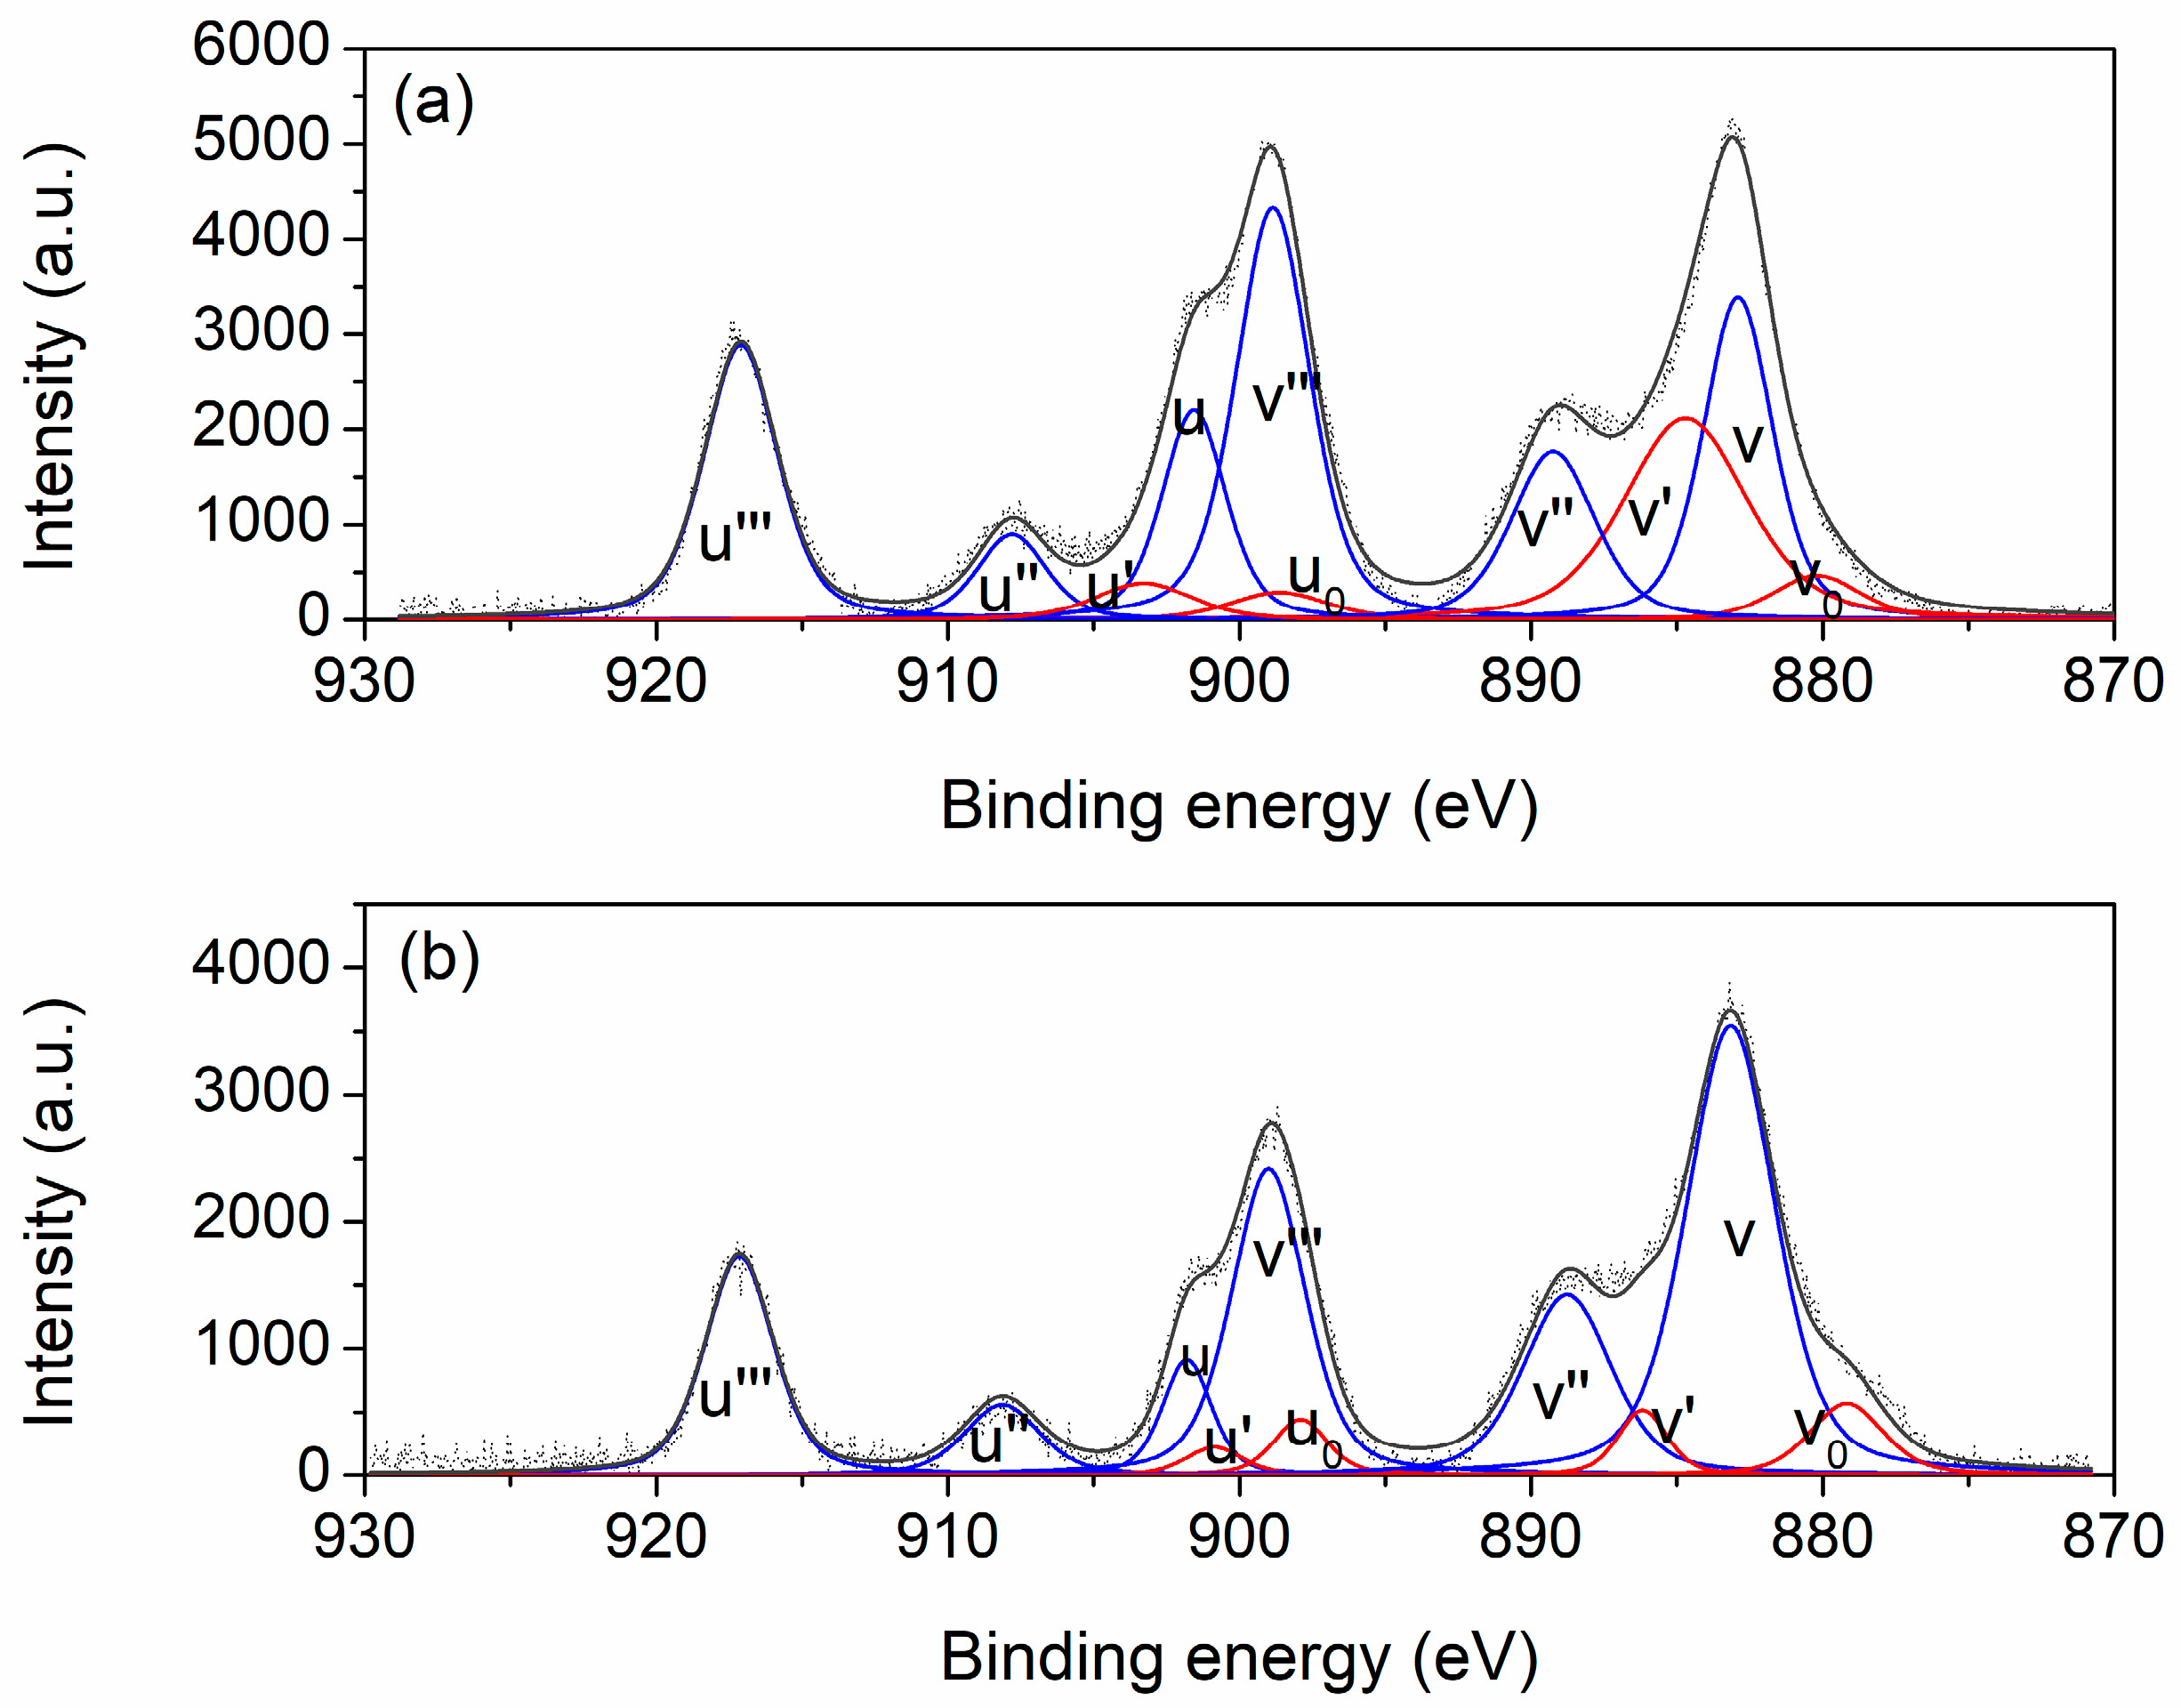
2) with the aim of determining the relative abundance of the elements on the surface of the samples, their chemical states, and surface oxygen species. The Ce 3d spectra of both samples with assigned deconvoluted peaks are displayed on
Figure 8. The spectra show the presence of cerium in two oxidation states: the peaks denoted as v
0, v′, u
0, and u′ belong to the Ce
3+ ion, while the peaks marked as v, v″, v‴, u, u″, and u‴ are associated with Ce
4+. The letters u and v designate the spin–orbit coupling 3d
3/2 and 3d
5/2, respectively [
32]. The intensity of Ce
3+ peaks is higher in the 10Zr:CeO
2 spectrum, which is reflected in the Ce
3+ and Ce
4+ shares calculated from the deconvoluted peaks areas (
Table 2). As can be seen in
Table 2, the Ce
3+ share in the sample with 10 mol. % Zr is twice as high as the share of the same ion in the sample with 30 mol. % Zr. This complements the DTA-TGA results well, because the final mass gain in the 10Zr:CeO
2 can be assigned to the oxidation of Ce
3+ into Ce
4+.
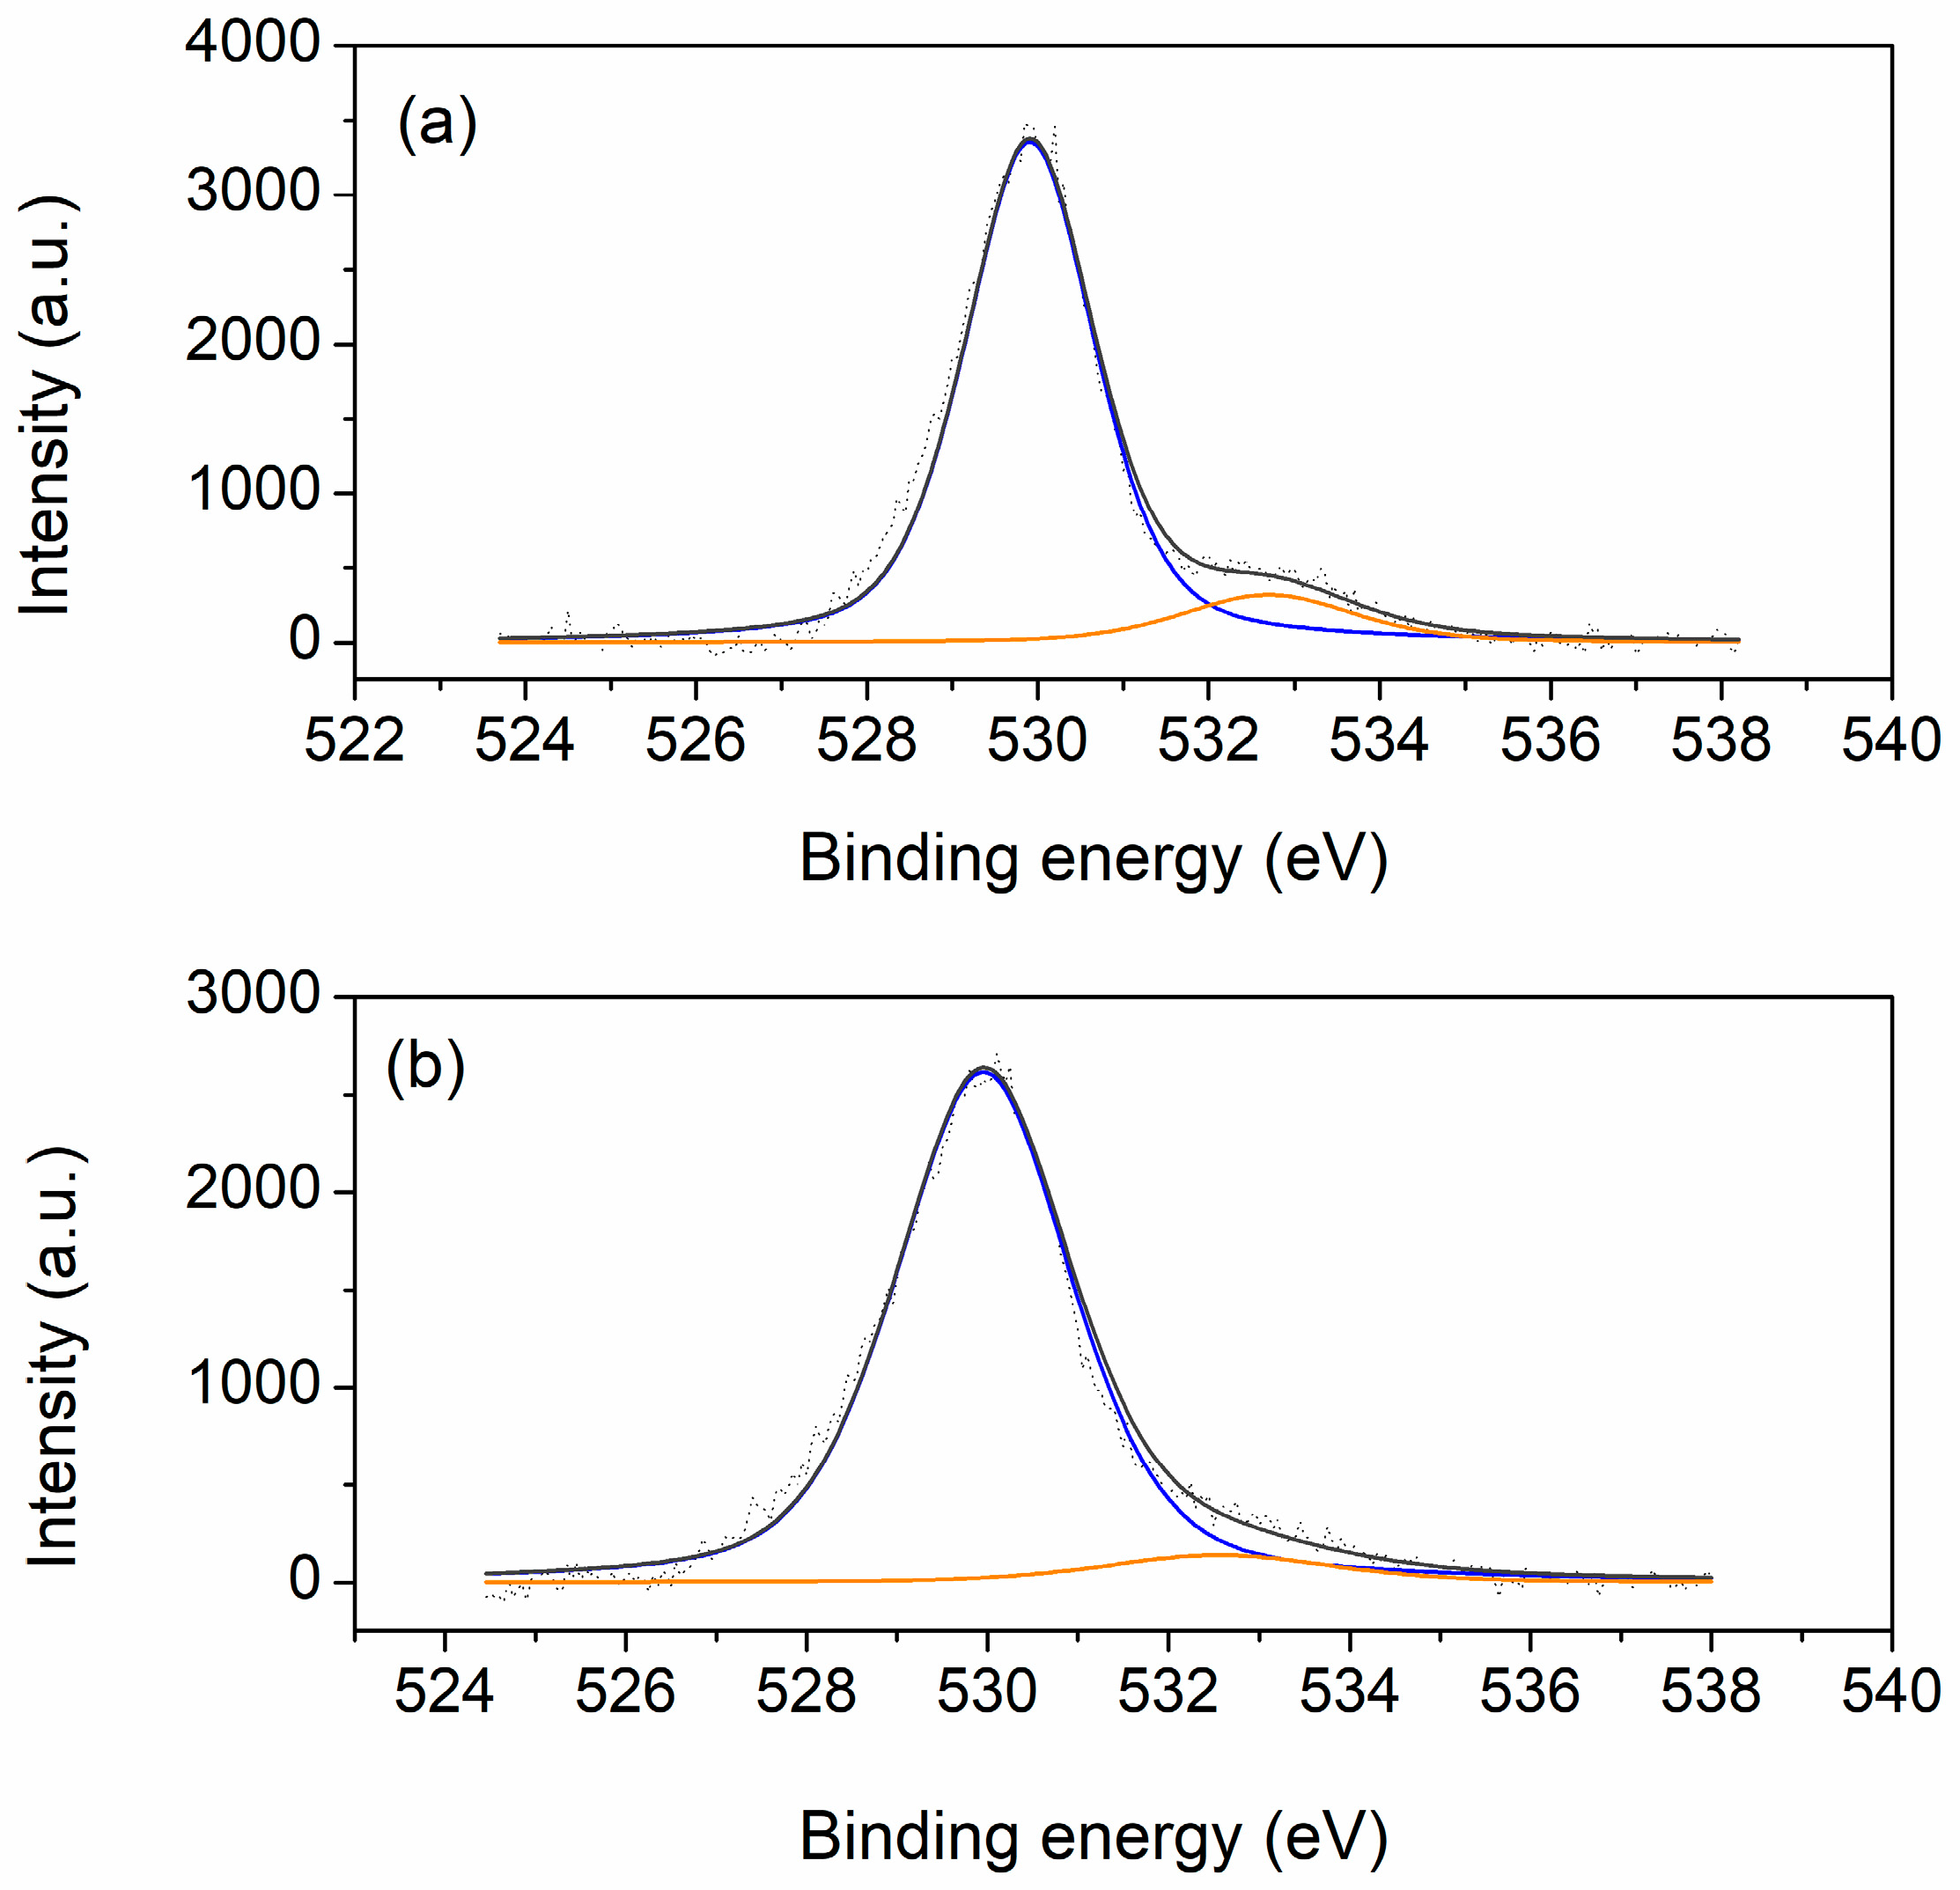
The O 1s XPS spectra of the analyzed samples are shown in
Figure 9. Two peaks can be observed on the spectra of both samples: the first, main peak at 530 eV and the second, shoulder peak at ~533 eV. The main peak is assigned to ceria lattice oxygen, while the shoulder is attributed to low coordination oxygen, i.e., oxygen adsorbed on the surface or present in surface hydroxyl groups or carbonate species, as well as oxygen ions in the oxygen-deficient regions near oxygen vacancies [
33,
34,
35]. The intensity of both peaks is again higher for the 10 mol. % Zr-doped ceria sample. The higher share of low coordination oxygen, as given in
Table 2 and calculated from respective peak areas, indicates a higher share of oxygen defects in this sample, which is beneficial from the point of view of potential catalytic applications.
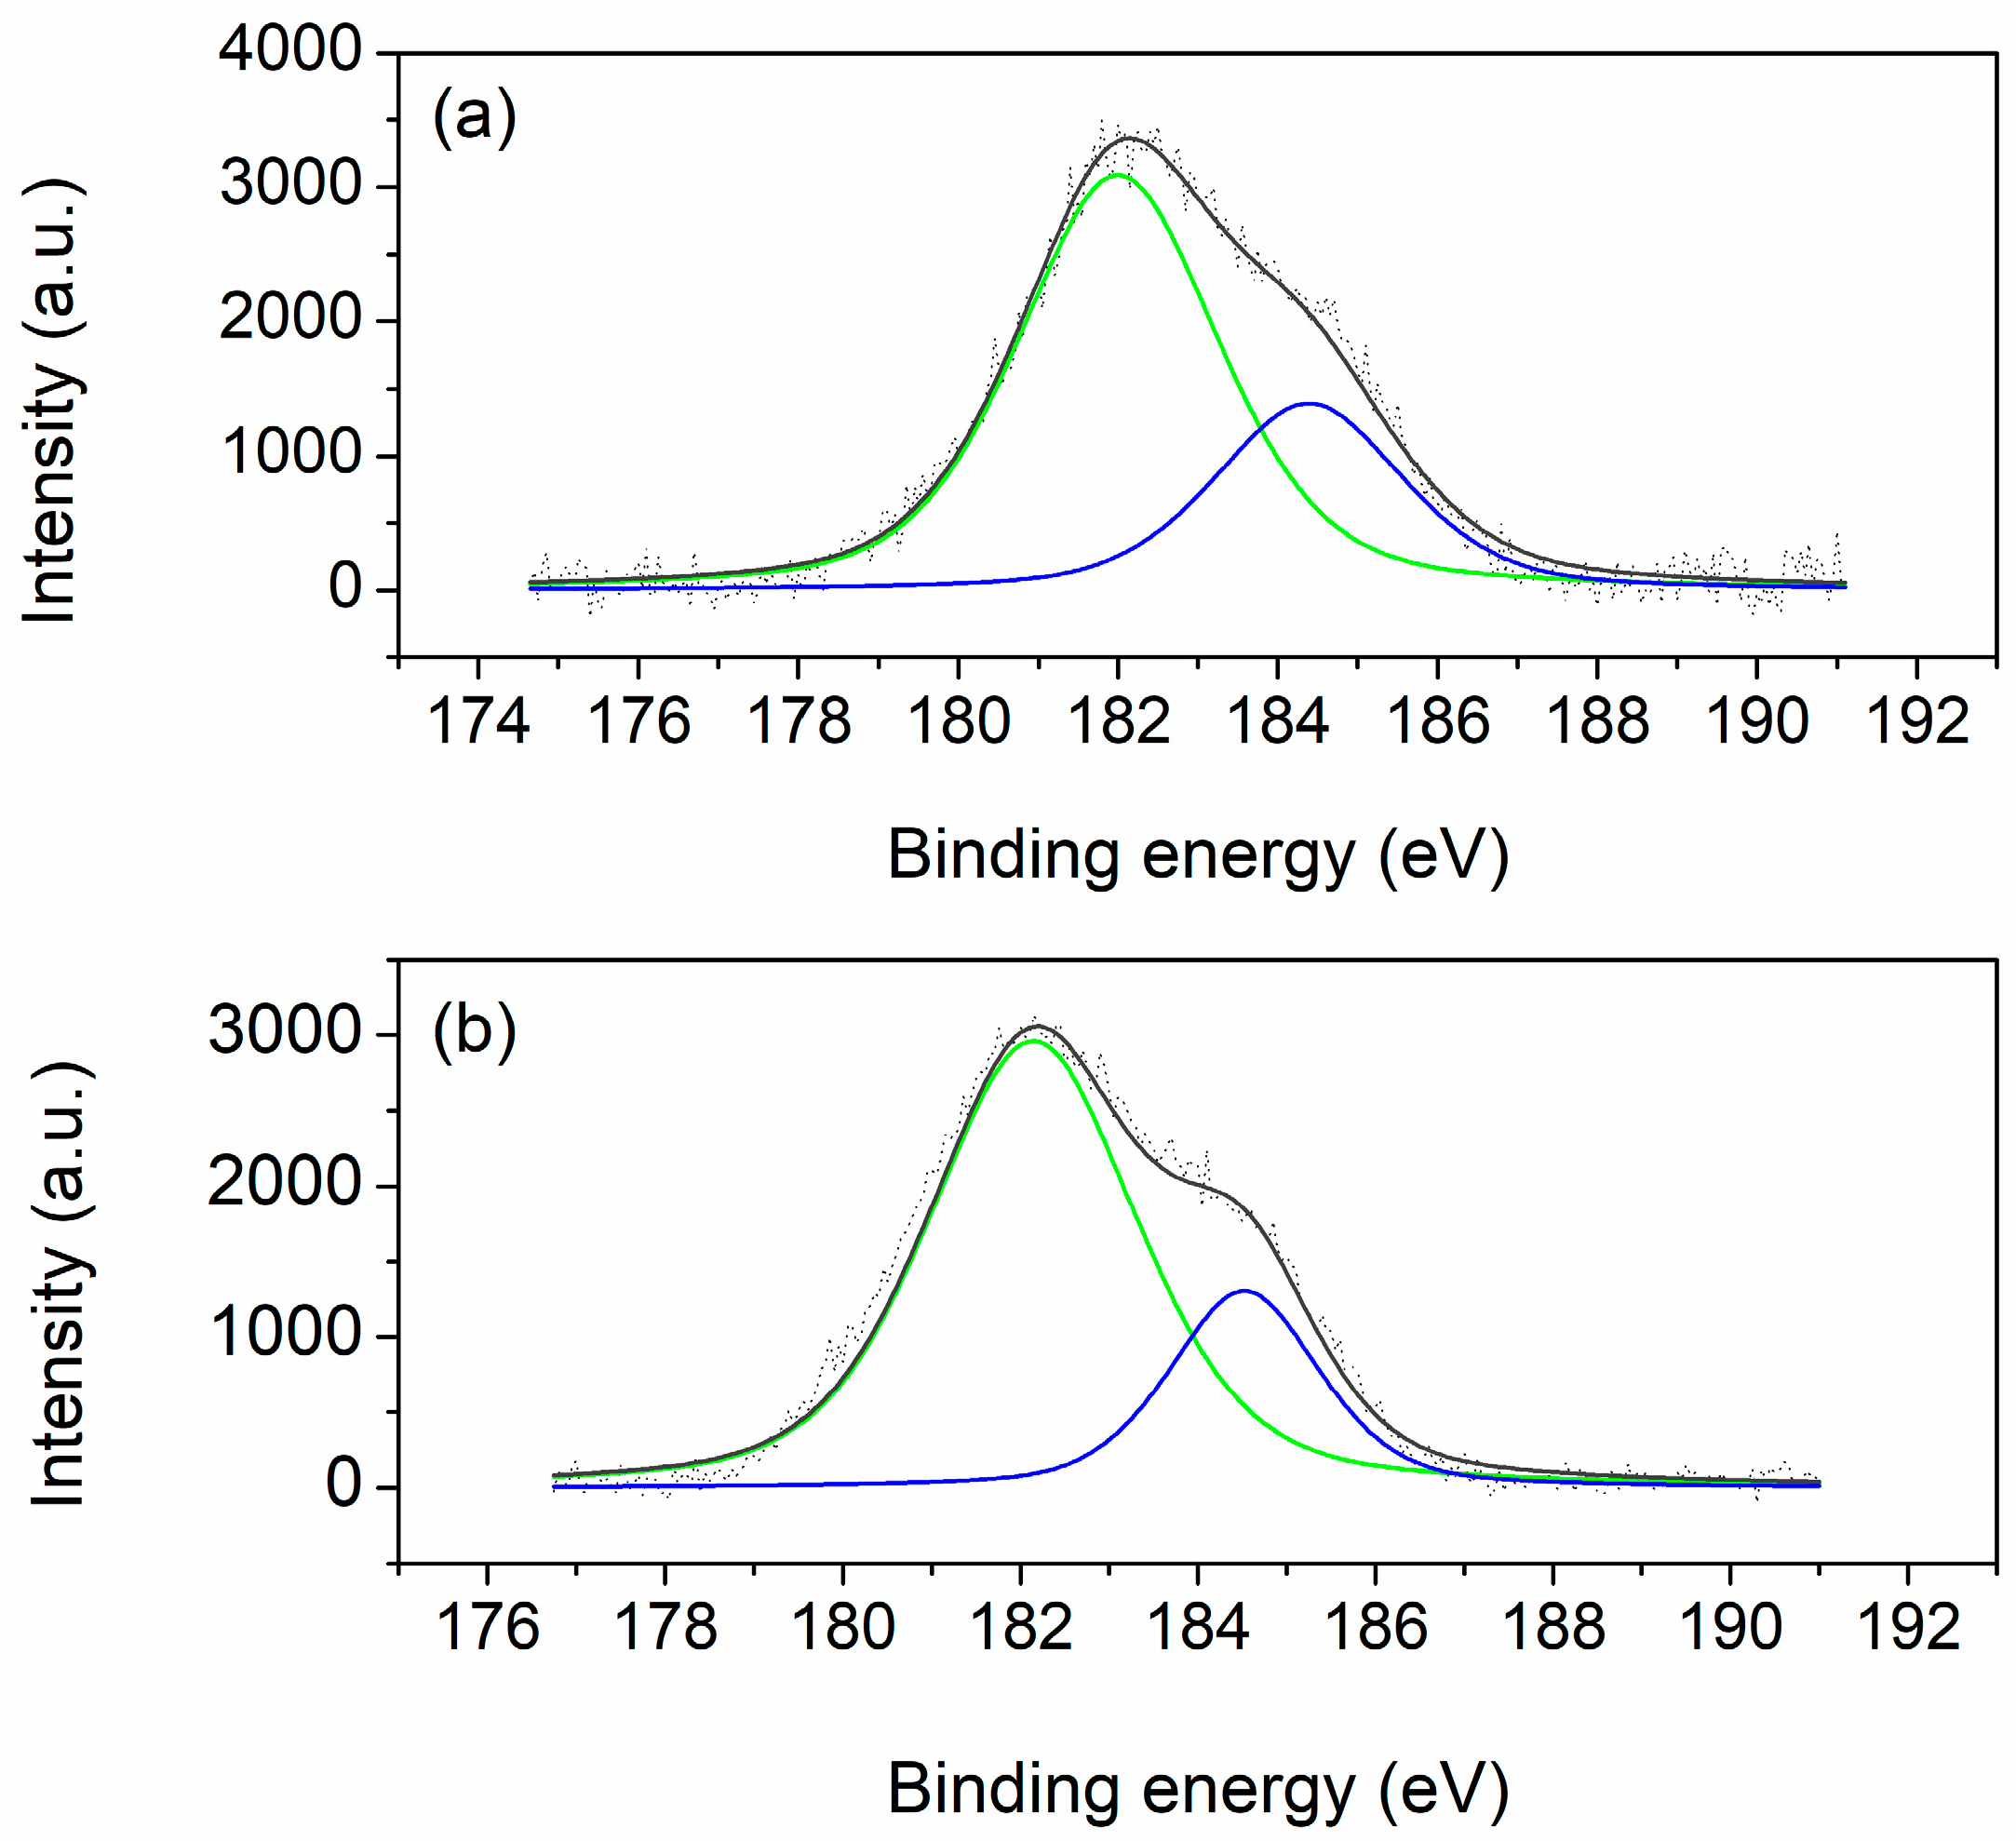
The Zr 3d spectra are presented in
Figure 10. Two peaks can be observed for both samples: the first at ~182 eV and the second at ~184.5 eV, which correspond to Zr 3d
5/2 and Zr 3d
3/2, respectively [
36]. Both peaks are attributed to Zr
4+ ions. The amount of zirconium on surface of the samples (
Table 2) is lower than nominal and amounts to about 40% of the nominal share for both analyzed samples. Such a discrepancy between the nominal and actual amount of Zr on the surface of the samples is proposed by Koleva et al. [
37] to be the consequence of the preference of zirconium ions to elude surface positions in ceria systems. This can originate from the difference in the ionic radius of Ce
4+ and Zr
4+ cations. The smaller Zr
4+ ions tend to avoid the outer layer of ceria nanoparticles and instead occupy inner positions in a manner similar to smaller metal atoms preferring internal positions in bimetallic alloys. Additionally, the smaller ionic radius of the zirconium cation results in a stronger electrostatic field around it, so the zirconium cations are preferentially located inside where they can be better saturated, while the cerium ions with a weaker electrostatic field prevail at the surface where they are less surrounded by oxygen ions [
37]. A similar effect arising from the difference in ionic radius was observed by Vari et al. in their study on the growth of cobalt on an ultrathin CeO
2(111) film; the results of the XPS analysis show that the diffusion of smaller Co
2+ ions into the ceria lattice occurs, and that it is even more pronounced at higher temperatures [
38].
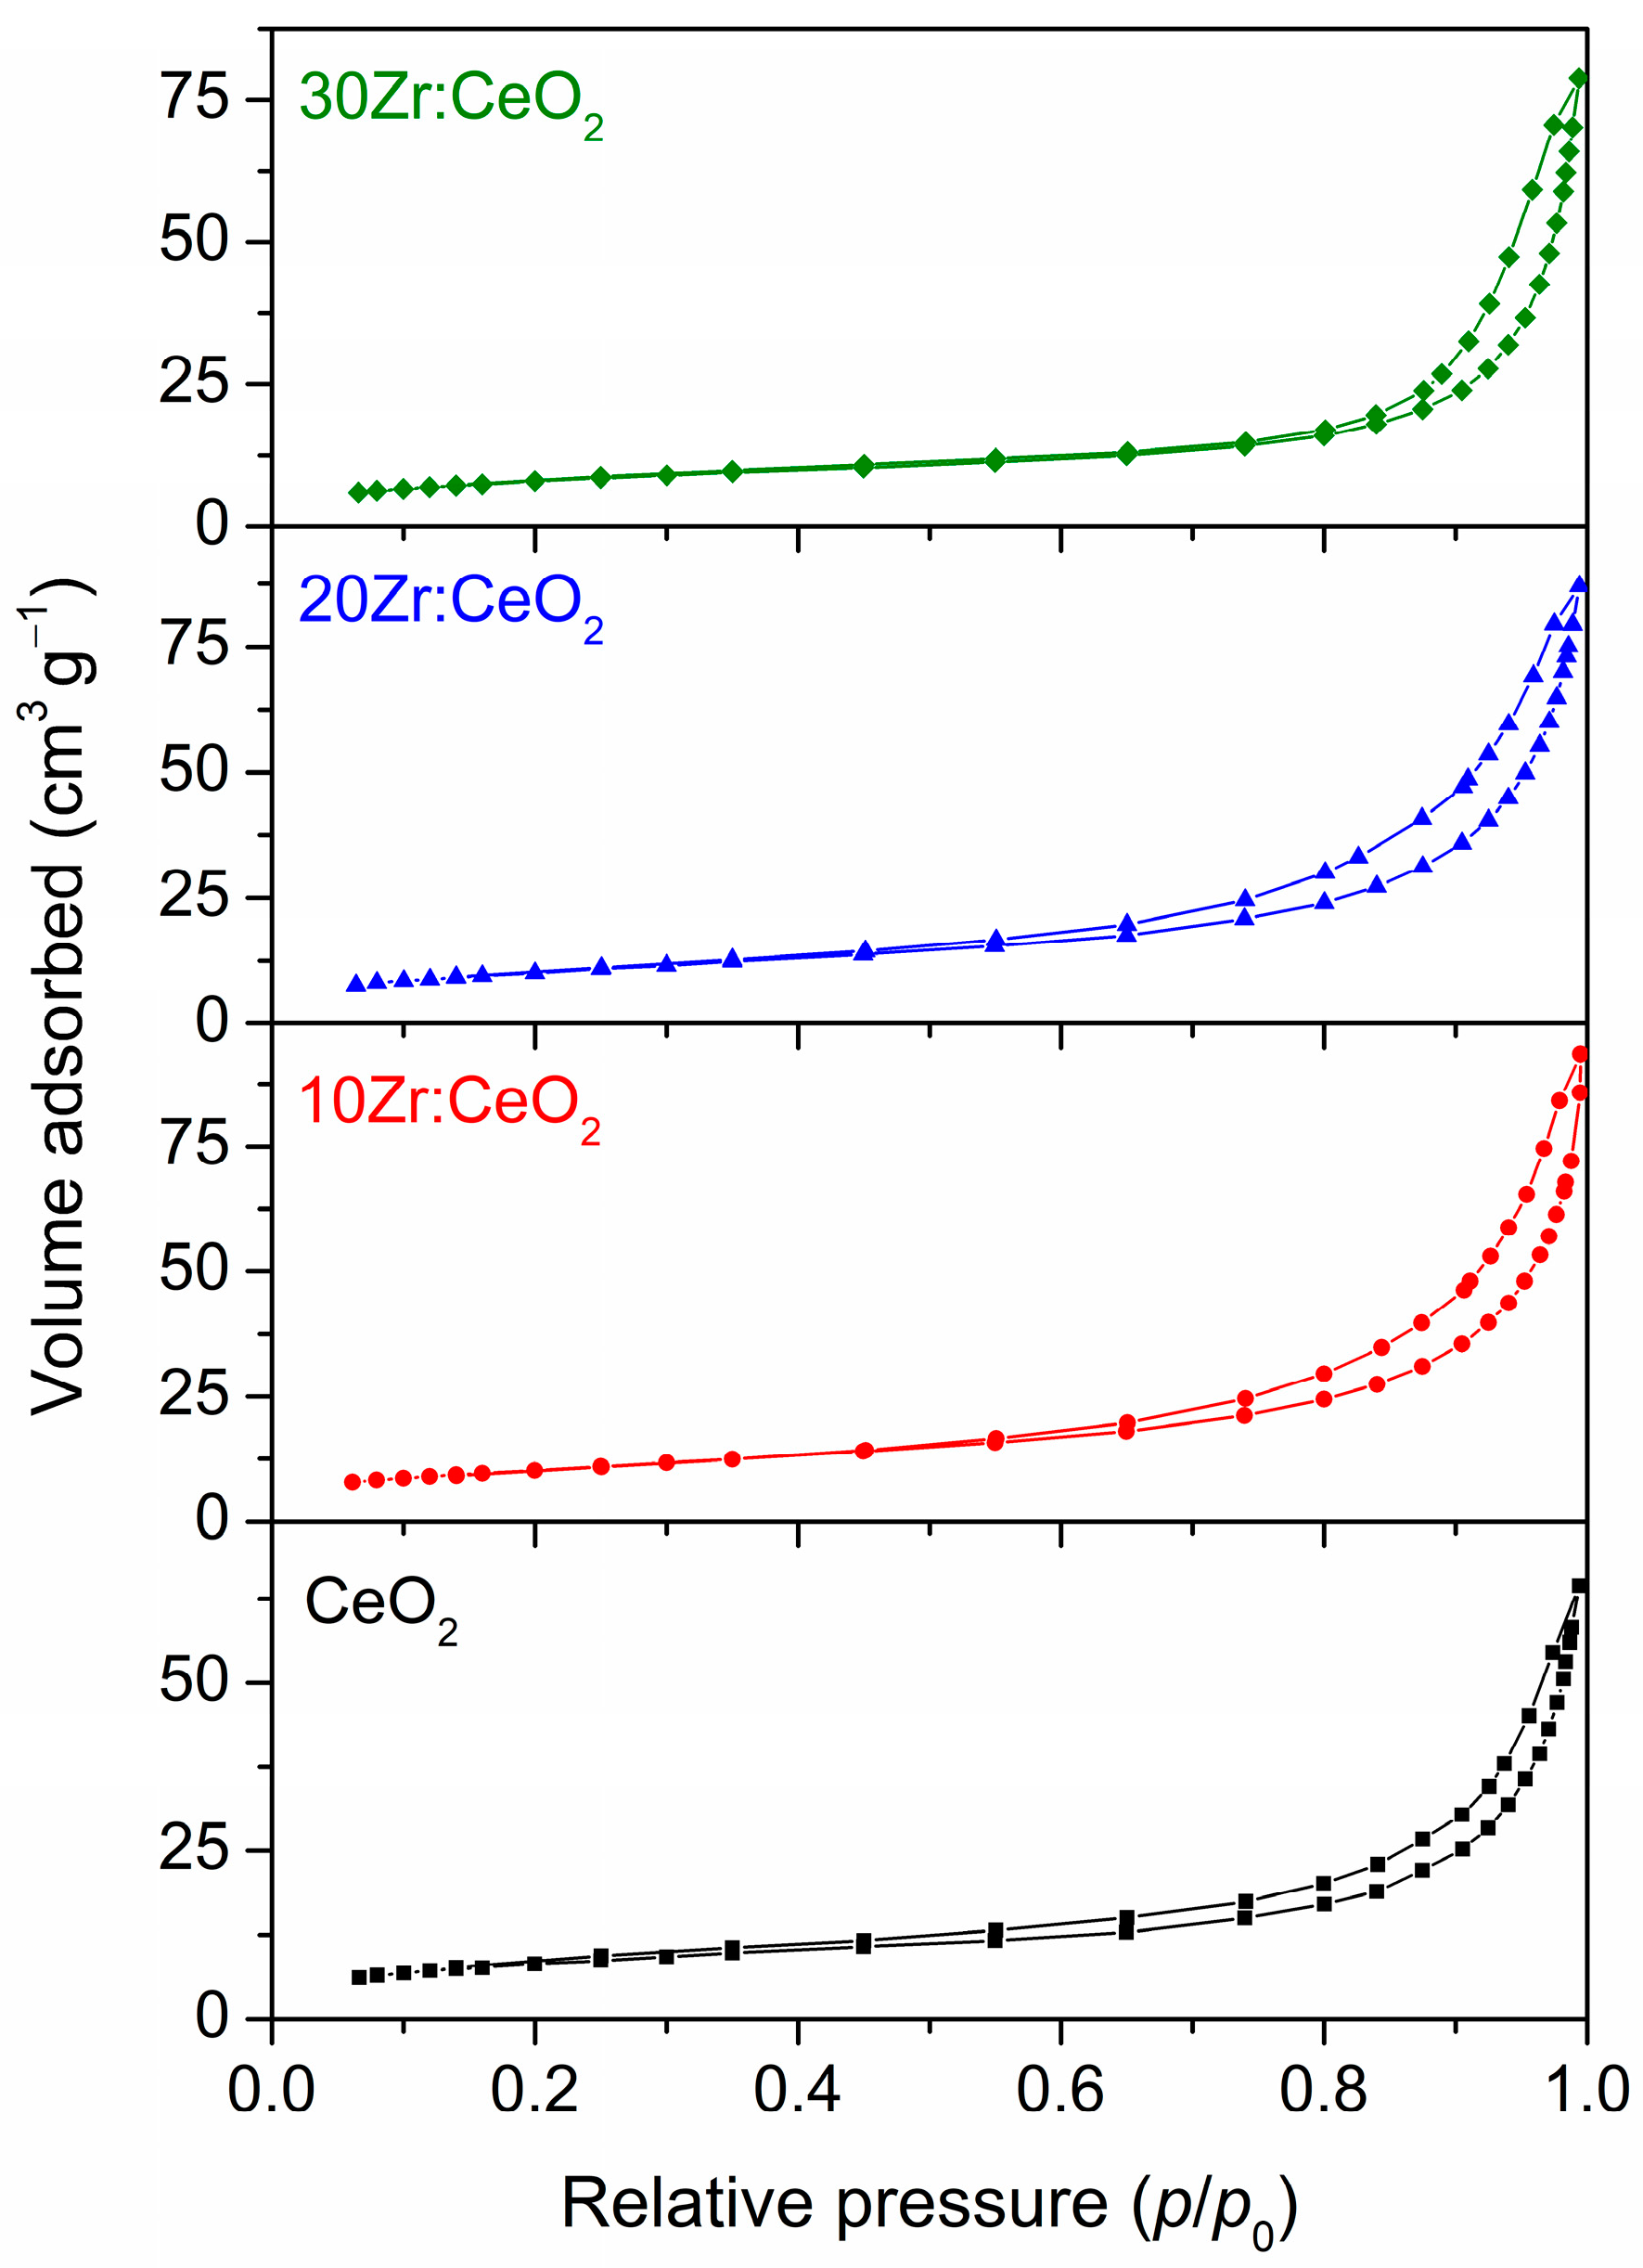
The nitrogen adsorption–desorption isotherms of all thermally treated samples are displayed in
Figure 11. According to IUPAC classification, the isotherms of all samples belong to type IV with H3 hysteresis loops, which are usually associated with mesoporous materials with pore sizes between 2 and 50 nm, implying the formation of particulate aggregates [
39,
40]. The average pore sizes listed in
Table 1 confirm that these are indeed mesoporous materials. The average pore diameter increases with an increase in the amount of the zirconium doping. Conversely, the specific surface area values do not follow a particular trend, but can rather be divided into two groups: samples CeO
2 and 30Zr:CeO
2 have similar, smaller
SBET values around 30.0 m
2 g
−1, while samples 10Zr:CeO
2 and 20Zr:CeO
2 have higher specific surface areas around 36.7 m
2 g
−1. The specific surface area values are in the typical range for metal oxides prepared by solution combustion synthesis [
41]. The cumulative pore volumes listed in
Table 1 might serve as an explanation to the unusual grouping of the samples regarding
SBET values. The cumulative pore volumes for samples 10Zr:CeO
2 and 20Zr:CeO
2 are noticeably higher than for samples CeO
2 and 30Zr:CeO
2, indicating a higher porosity of these samples, which results in a higher specific surface area. In turn, higher specific surface area signifies that there are more catalytically active sites available for reaction, so the catalytic activity of these samples should be higher [
42].
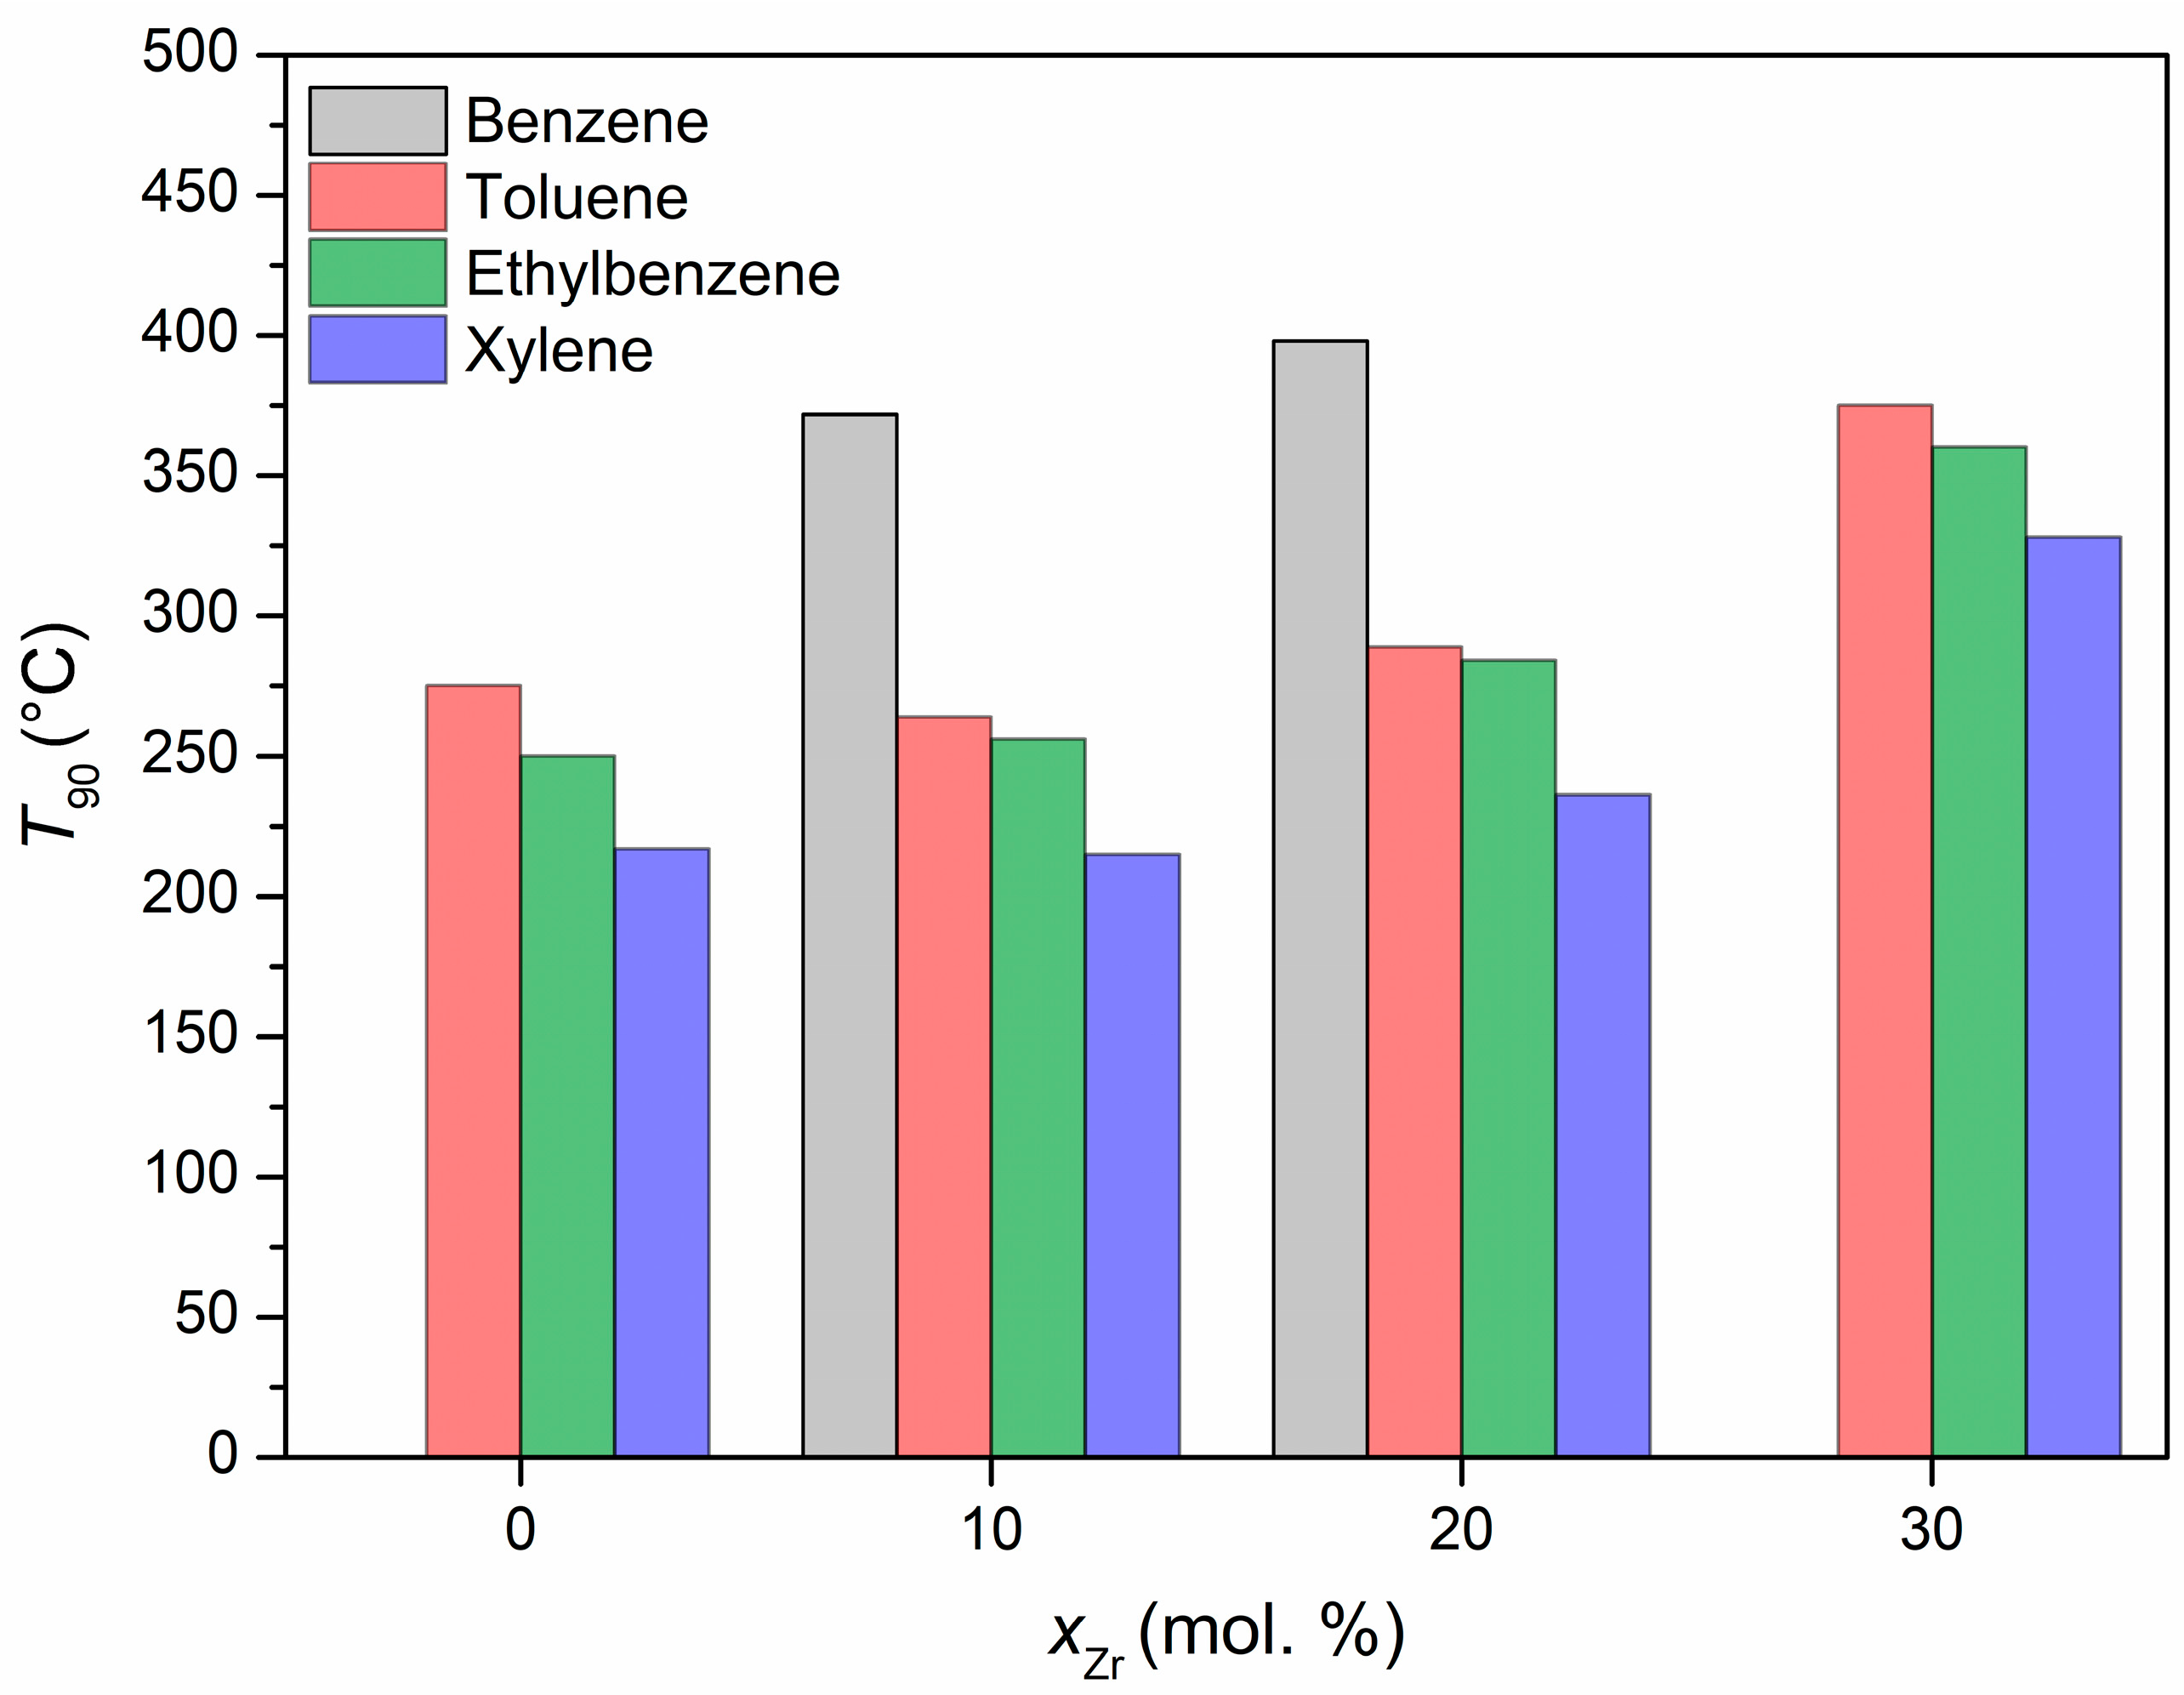
The thermally treated catalysts were tested in the process of the catalytic oxidation of VOCs. The mixture of benzene, toluene, ethylbenzene, and
o-xylene was chosen as a model of VOCs. The reaction was carried out up to a temperature of 400 °C. The temperatures corresponding to 90% conversion for each of the samples and volatile organic compounds are shown in
Figure 12. The 10Zr:CeO
2 sample is undoubtedly the most catalytically active, achieving 90% conversion of all volatile organic compounds at the lowest temperatures. It is followed by the 20Zr:CeO
2 sample, which also achieves the conversion of all analyzed compounds, but at higher temperatures. In the case of the undoped and 30 mol. % Zr-doped sample, 90% conversion of benzene could not be achieved in the studied temperature range. The undoped sample reaches 86% conversion at 400 °C, while the 30 mol. % Zr-doped sample barely reaches 40% conversion at the same temperature. Furthermore, the 30Zr:CeO
2 sample shows the lowest catalytic activity in the BTEX oxidation process, requiring significantly higher 90% conversion temperatures than for any other sample. As for the conversion of individual volatile organic compounds, the catalytic activity of the studied catalysts increases in the order of benzene < toluene < ethylbenzene <
o-xylene, which can be attributed to the decreasing stability of the benzene ring with the addition of substituents. Namely, the benzene ring is very difficult to oxidize due to its high symmetry and stability. The addition of substituents like methyl and ethyl groups has a considerable influence on the π electronic structure, as well as charge density distribution, thereby disrupting the aforementioned stability and symmetry, and facilitating the oxidation of such molecules at lower temperatures [
43]. The oxidation of volatile organic compounds is a complex process, with various possible intermediate phases, and would require measurements of the concentration of possible products in the output stream. Unfortunately, our system can only measure the concentration of the reactants in the output stream, so further discussion on this matter is futile. However, what can be discussed is the properties of the prepared catalysts in regards to their catalytic activity. The catalytic activity of a catalyst depends on multiple factors, such as its structure, chemical composition, specific surface area, porosity, presence of defects, etc. [
44]. Throughout this investigation, the 10Zr:CeO
2 sample has shown the most promising characteristics of a good catalyst: small crystallite size, good thermal stability, largest specific surface area, porous morphology, high share of Ce
3+ ions, and low coordination oxygen indicating the presence of oxygen vacancies, which indeed resulted in the best catalytic activity among all of the prepared catalysts. Ramos-Fernandez et al. studied the CO
2 reduction process on doped cerium oxide as a catalyst, and they found out that CeO
2 doped with 10 mol. % of Zr has a higher rate of oxygen release due to the lower activation energy of this process (162 kJ mol
−1) compared to pure CeO
2 (235 kJ mol
−1) [
45]. However, it would seem that a nominal Zr doping amount higher than 10 mol. % results in the gradual decrease in catalytic activity, meaning that 10 mol. % is the optimal zirconium doping amount.
