Article

Batch Cooling Crystallization of a Model System Using Direct Nucleation Control and High-Performance In Situ Microscopy

Department of Measurements and Process Control, Faculty of Chemical Engineering and Technology, University of Zagreb, 10000 Zagreb, Croatia
*
Author to whom correspondence should be addressed.
Crystals 2024, 14(12), 1079; https://doi.org/10.3390/cryst14121079
Submission received: 20 November 2024 / Revised: 6 December 2024 / Accepted: 12 December 2024 / Published: 13 December 2024
(This article belongs to the Special Issue Crystallization Process and Simulation Calculation, Third Edition)

Abstract

:
The aim of this study was to investigate the use of automated high performance in situ microscopy (HPM) for monitoring and direct nucleation control (DNC) during cooling crystallization. Compared to other techniques, HPM enables the detection of small crystals in the range of 1 to 10 μm. Therefore, a novel DNC-controlled variable was investigated to determine the potential improvement of the method. The laboratory system and process control software were developed in-house. A well-studied crystallization model system, the seeded batch cooling crystallization of α-glycine from water, was investigated under normal conditions and temperatures below 60 °C. It was postulated that length-weighted edge-to-edge counts in the range of 1 to 10 μm would be most sensitive to the onset of secondary nucleation and are therefore, used as a control variable. Linear cooling experiments were conducted to determine the initial setpoint for the DNC experiments. Three DNC experiments were then performed with different setpoints and an upper and lower counts limit. It was found that the DNC method can be destabilized with a low setpoint and narrow counts limits. In addition, the new controlled variable is highly sensitive to the formation of bubbles at the microscope window and requires careful evaluation. To address the advantages of the DNC method, an additional linear cooling experiment of the same duration was performed, and it was found that the DNC method resulted in a larger average crystal size. Overall, it can be concluded that the HPM method is suitable for DNC control and could be improved by modifying the image processing algorithm.

1. Introduction

Crystallization is one of the most intricate unit operations in chemical engineering, especially in pharmaceutical engineering. It is a thermal separation technique based on the differing solubility of substances in solvents at various temperatures [1]. Beyond its role as a separation process, crystallization plays a crucial role in purification, enabling the isolation of substances with a high degree of purity. Substances required in smaller quantities are typically produced through batch crystallization or its variants. These substances often have limited market potential but high added value, such as fine chemicals, pharmaceuticals, nanomaterials, semiconductors, and photochemicals. Regulatory agencies for pharmaceuticals, such as the FDA (Food and Drug Administration) and EMA (European Medicines Agency), encourage the adoption of Process Analytical Technology (PAT) as an alternative to conventional quality control [2]. PAT is generally defined as a framework for designing, analyzing, and controlling manufacturing processes by monitoring critical quality attributes in real-time [3]. This enables the development of advanced crystallization control techniques through the real-time measurement of critical variables. Crystallization control methods can be classified into two main categories: model-based methods and non-model-based methods [4,5]. Most advanced crystallization control methods are applied in research and development laboratories, where heating and cooling profiles are optimized for scaling up to pilot and industrial levels [6].
Modeling crystallization through theoretical frameworks is a challenging task with no universal approach or solution. A comprehensive model must account for nucleation, crystal growth and dissolution, agglomeration, crystal breakage, and other phenomena [1]. While these parameters can be studied under laboratory conditions, they often fail to provide reliable characterization during scale-up. Conducting kinetic experiments on production equipment is costly and time-intensive, leading to the infrequent industrial use of theoretical crystallization models and model-based control. Nevertheless, population balance and semi-empirical models have been successfully applied to describe some real-world crystallization systems. For example, Trampuž et al. [7] developed a theoretical model for the crystallization of a pharmaceutical active ingredient using population balances based on a limited number of laboratory experiments. Moraes et al. [8] used population balances to compute optimal cooling temperature profiles for crystallizers, while Rajagopalan et al. [9,10] implemented nonlinear predictive control based on multidimensional population balances for feedback-controlled crystallization processes.
The second category of crystallization control methods are non-model-based approaches. These methods offer simpler development, broader applicability across various systems, and shorter process development times [11]. They are particularly useful for determining suboptimal cooling and heating trajectories in laboratory-scale crystallizers. The most widely used non-model-based methods are supersaturation control (SSC) and direct nucleation control (DNC). Although these methods were conceptually developed two decades ago, their implementation became feasible only with the advent of advanced instrumentation [12]. The SSC method uses spectroscopic devices and calibration models to estimate the concentration of dissolved substances during the process. Based on simple calculations, a temperature controller adjusts the operating point to maintain a predetermined supersaturation level [13]. While the fundamental method has remained largely unchanged, significant advances have been made in instrumentation and calibration model development. For instance, Gavran et al. [14] utilized Raman spectroscopy and calibration models based on neural networks to improve solution concentration estimation. Recently, SSC has been applied in continuous and semi-batch crystallizers [15,16]. However, the presence of impurities during crystallization can shift the solubility curve, significantly reducing the method’s reliability. Additionally, spectroscopic devices are sensitive to vibrations and prone to optical fiber degradation, limiting their use in production environments.
The DNC method relies on detecting fine crystals formed by secondary nucleation and dissolving them by reheating the crystallizer [17]. This prevents the accumulation of fine crystals in the final product, facilitates faster filtration and drying, and reduces solvent inclusion within the crystals [18,19]. Also, the method has shown promising results for obtaining the desired polymorph and solid form [20,21]. In addition to being applied to model systems, DNC has also been utilized in the development of processes for certain real-world systems. Saleemi et al. successfully reduced solvent inclusion in the crystals of a cardiovascular drug [6]. Similarly, Simone et al. mitigated crystal agglomeration in pharmaceuticals [22] and enhanced the size distribution and purity of biopharmaceutical crystals [23]. The majority of DNC research has relied on focus beam reflectance measurement (FBRM) as a core technology, even though this approach does not provide a complete insight into the experimental process. Recently, the use of digital in situ microscopy for crystallization control has grown, driven by advances in image processing and artificial intelligence techniques [24,25]. The method has found use in both industrial crystallization [26] and academic research [27].

High-Performance In Situ Microscopy (HPM)

High-performance microscopy (HPM) offers significant advancements for in-process analysis by utilizing dark-field illumination to enhance the contrast, resolution, and dynamic range. This approach effectively addresses challenges posed by high dispersed phase concentrations, small particle sizes, and diverse particle compositions. Through advanced optical and pixel resolution, controlled depth-of-field, and exceptional sensitivity to particle concentration and size changes, HPM ensures precise imaging. Its extended dynamic range improves edge detection and image clarity, making it valuable for process monitoring and analysis in pharmaceutical, chemical, and other research applications. Several industrial projects have already used HPM for crystallization development. For example, Jørgensen et. all [28] have used HPM (Blaze Metrics) together with Raman spectroscopy to develop a soft sensor for non-classical protein crystallization. Pickles et al. [29] used Blaze Meso (along with other technologies) for rapid process development.
Furthermore, HPM reliably detects particles in the 1 to 10 micrometer range, making it particularly valuable for applications requiring early nucleation detection. Therefore, in this paper, a novel HPM technology will be implemented for DNC with an emphasis on an unexplored controlled variable.

2. Materials and Methods

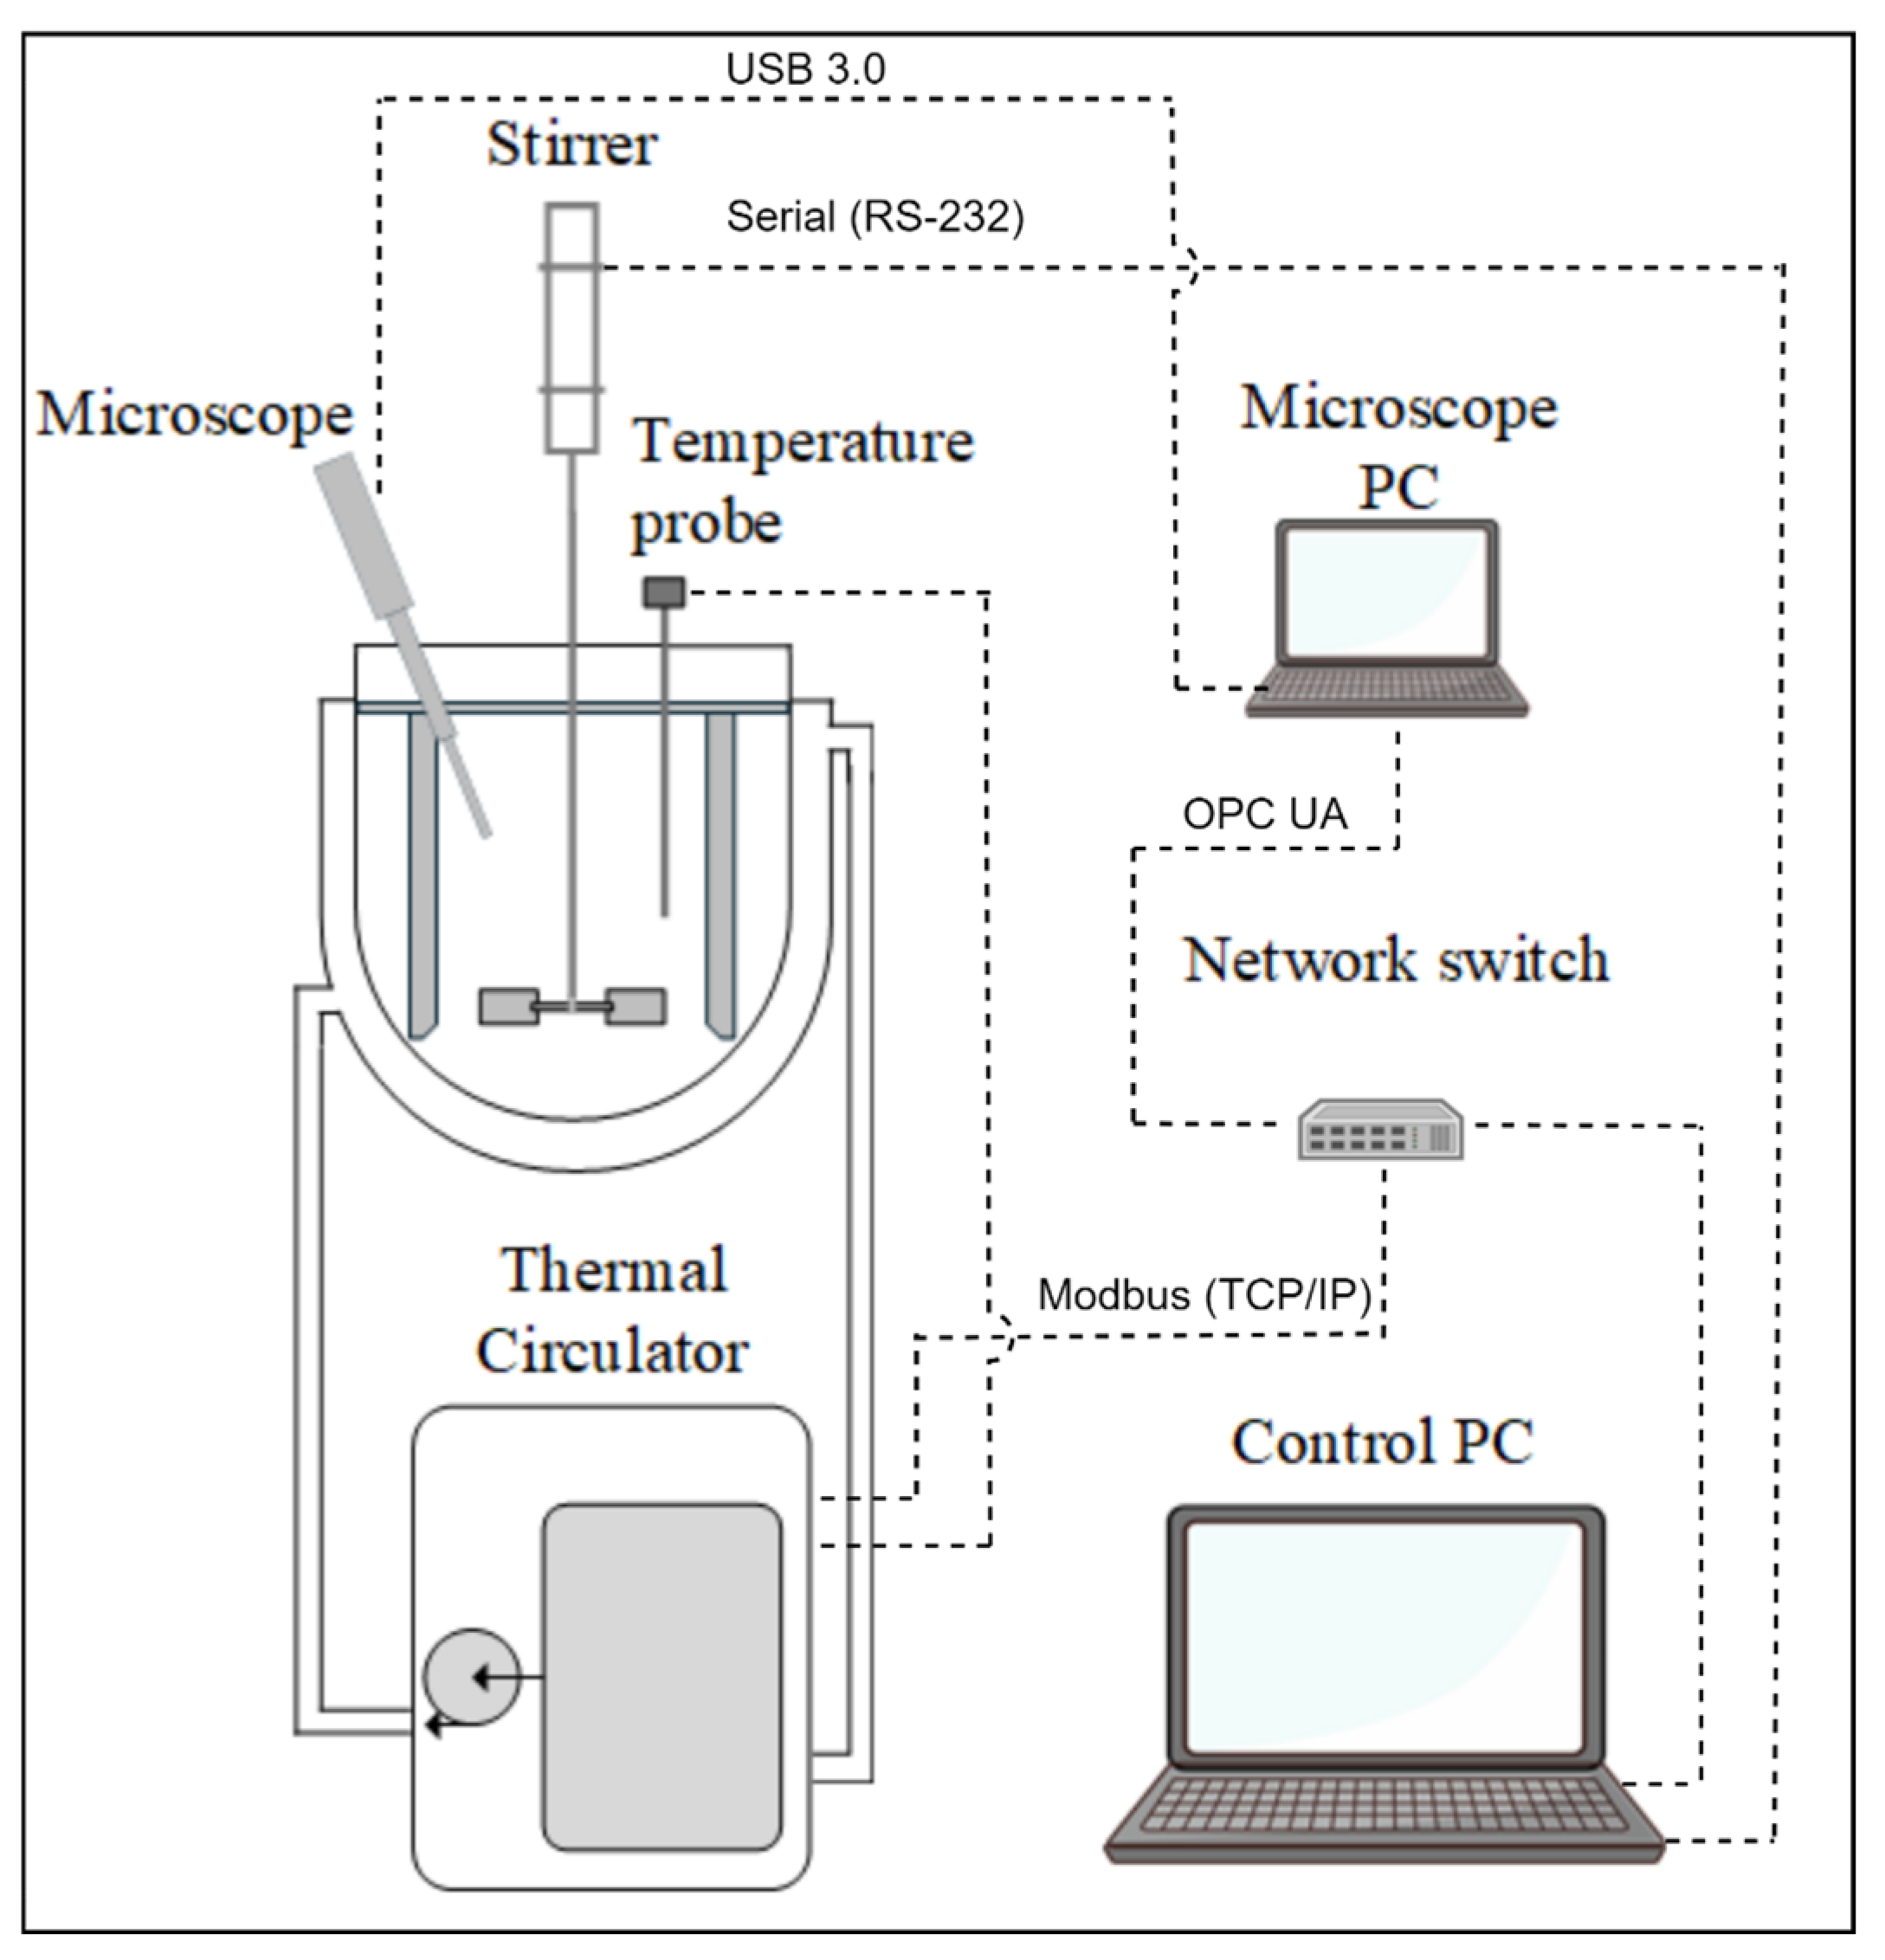
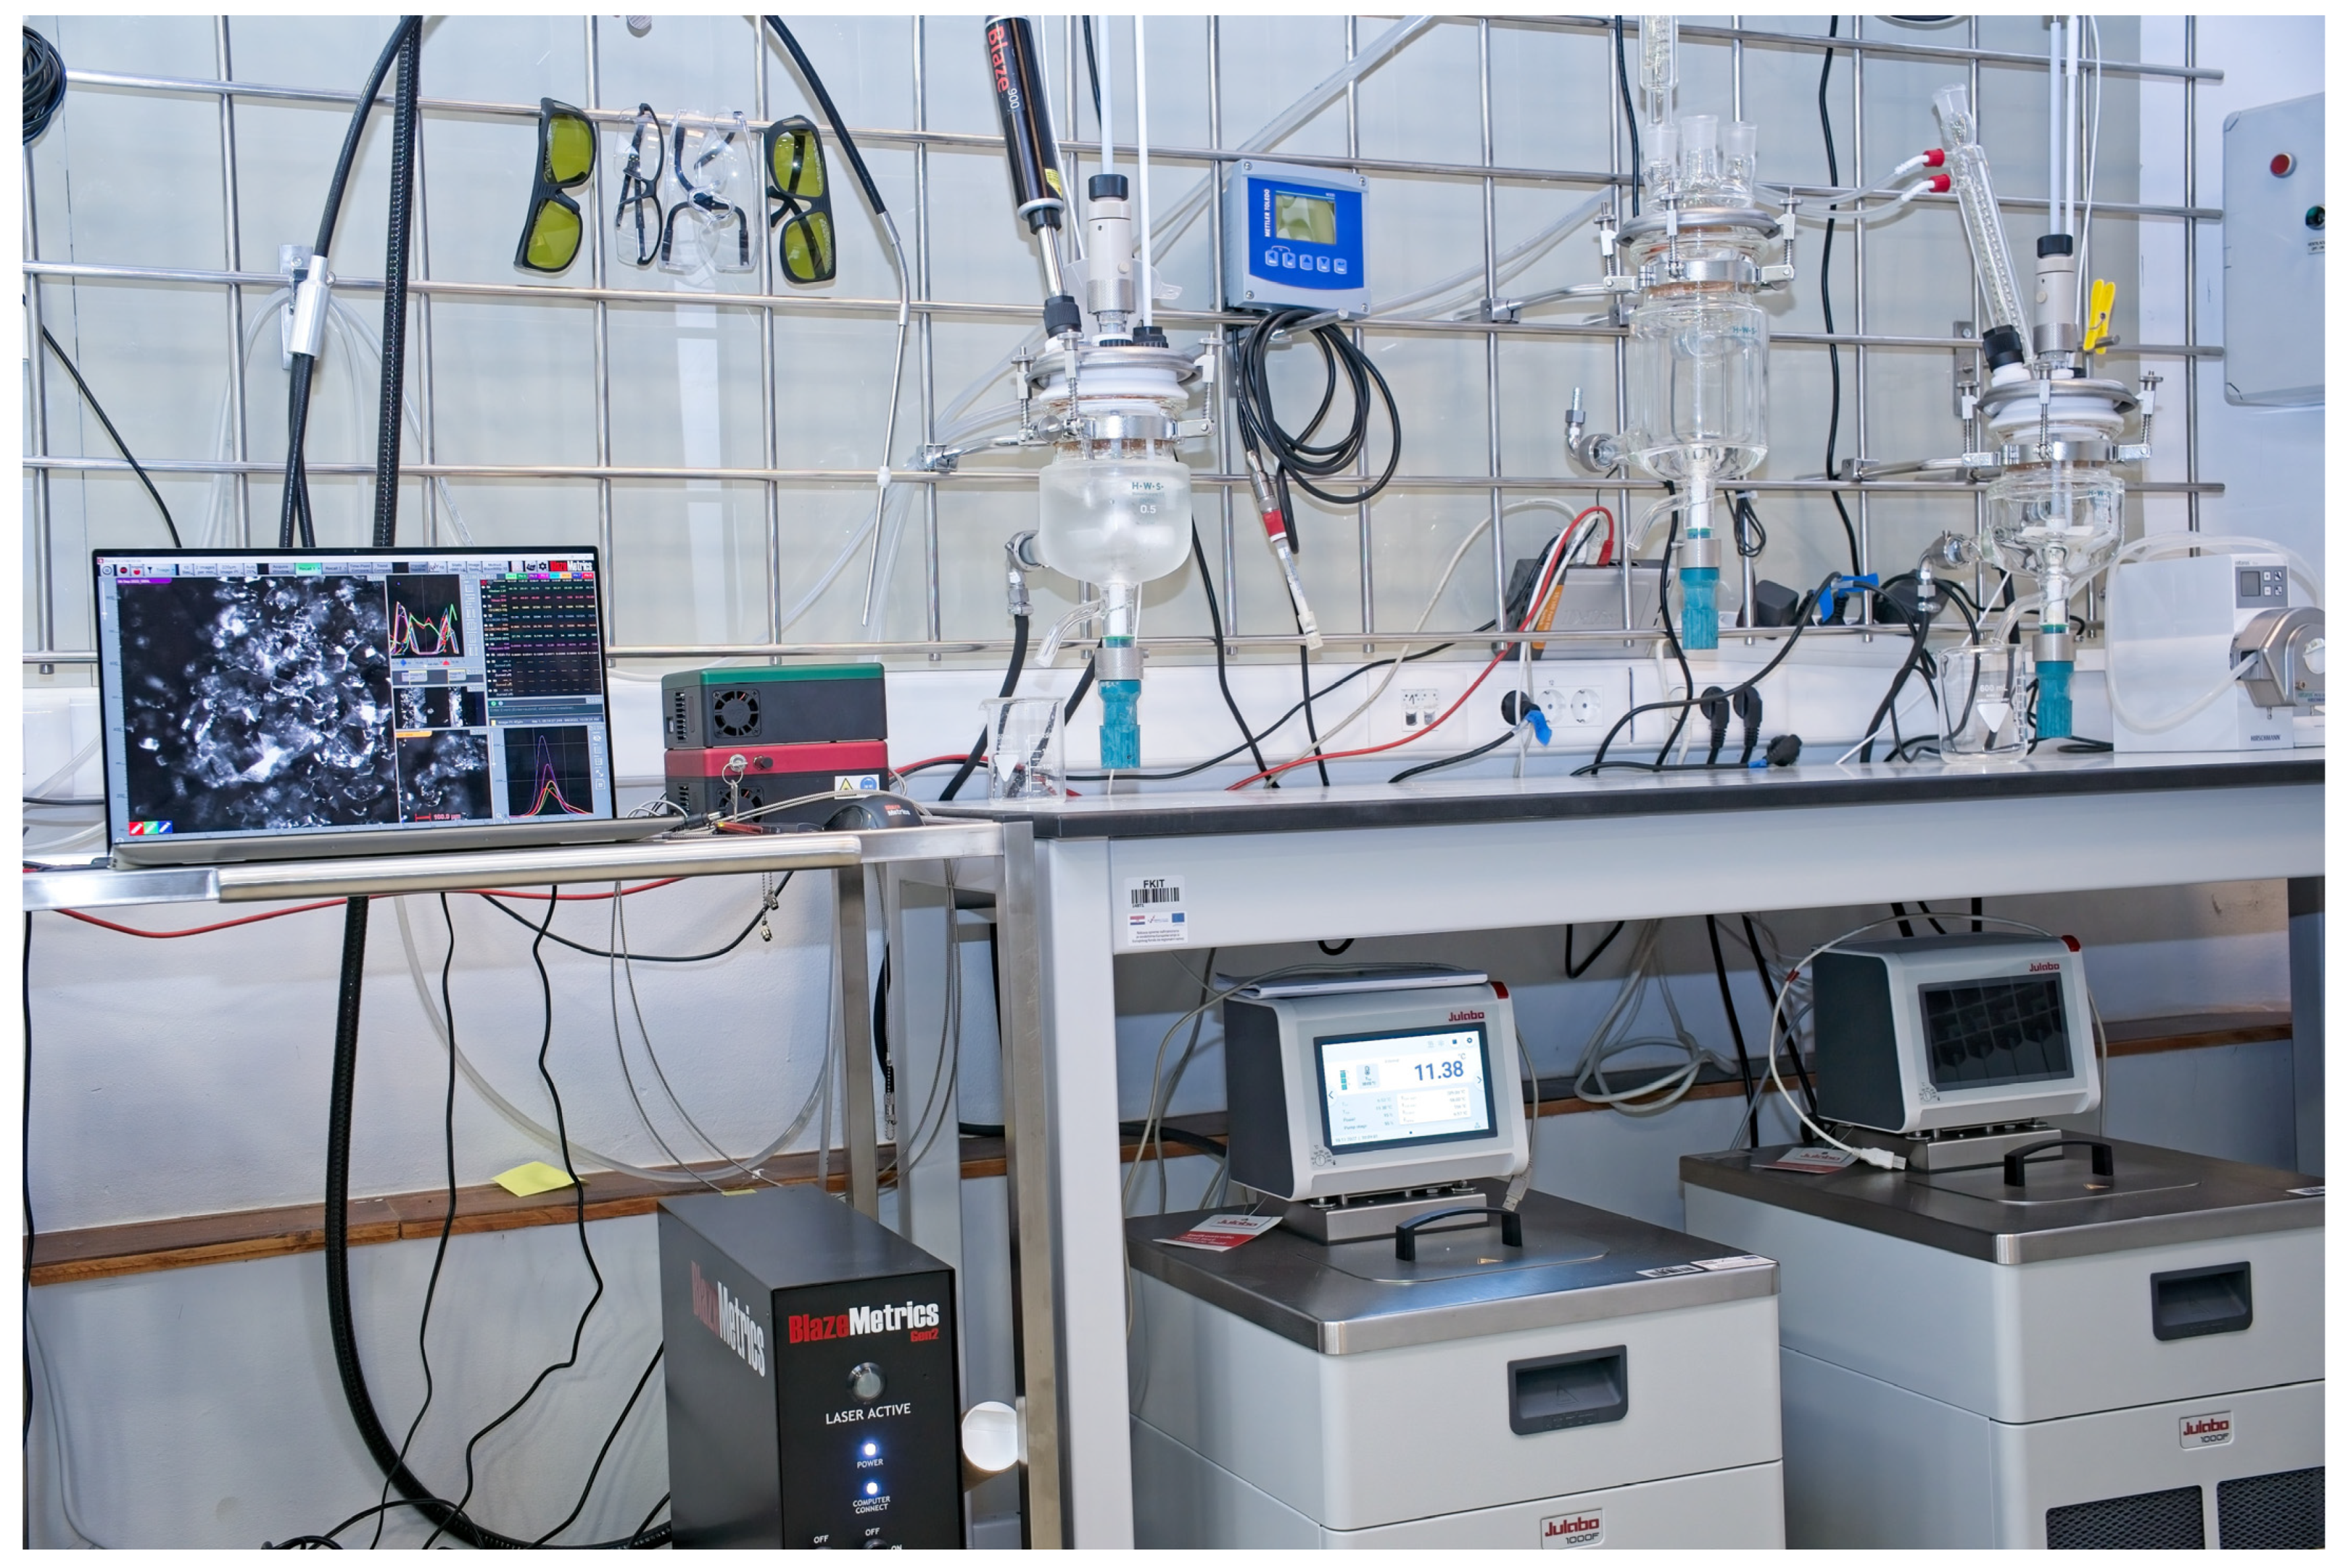
2.1. Laboratory System Configuration

The system was built from commercially available laboratory equipment and self-developed components. It consists of a thermostat (Julabo Maggio MS-1000F), a laboratory stirrer (Heidolph Hei-TORQUE 100), a jacketed batch reactor (HWS, 500 mL, borosilicate glass), a high-performance in situ microscope (Blaze 900 Micro, Blaze Metrics LLC, Marysville, Washington, United States), four 316L stainless steel baffles, a Rushton 3D-printed turbine impeller with six vertical blades (ABS filament, 60 mm diameter) and a control PC. The data acquisition and control software was developed in-house, using object-oriented programming and high-level languages together with a user-friendly graphical interface. The schematic representation of the experimental setup is shown in Figure 1 and the laboratory implementation in Figure 2.

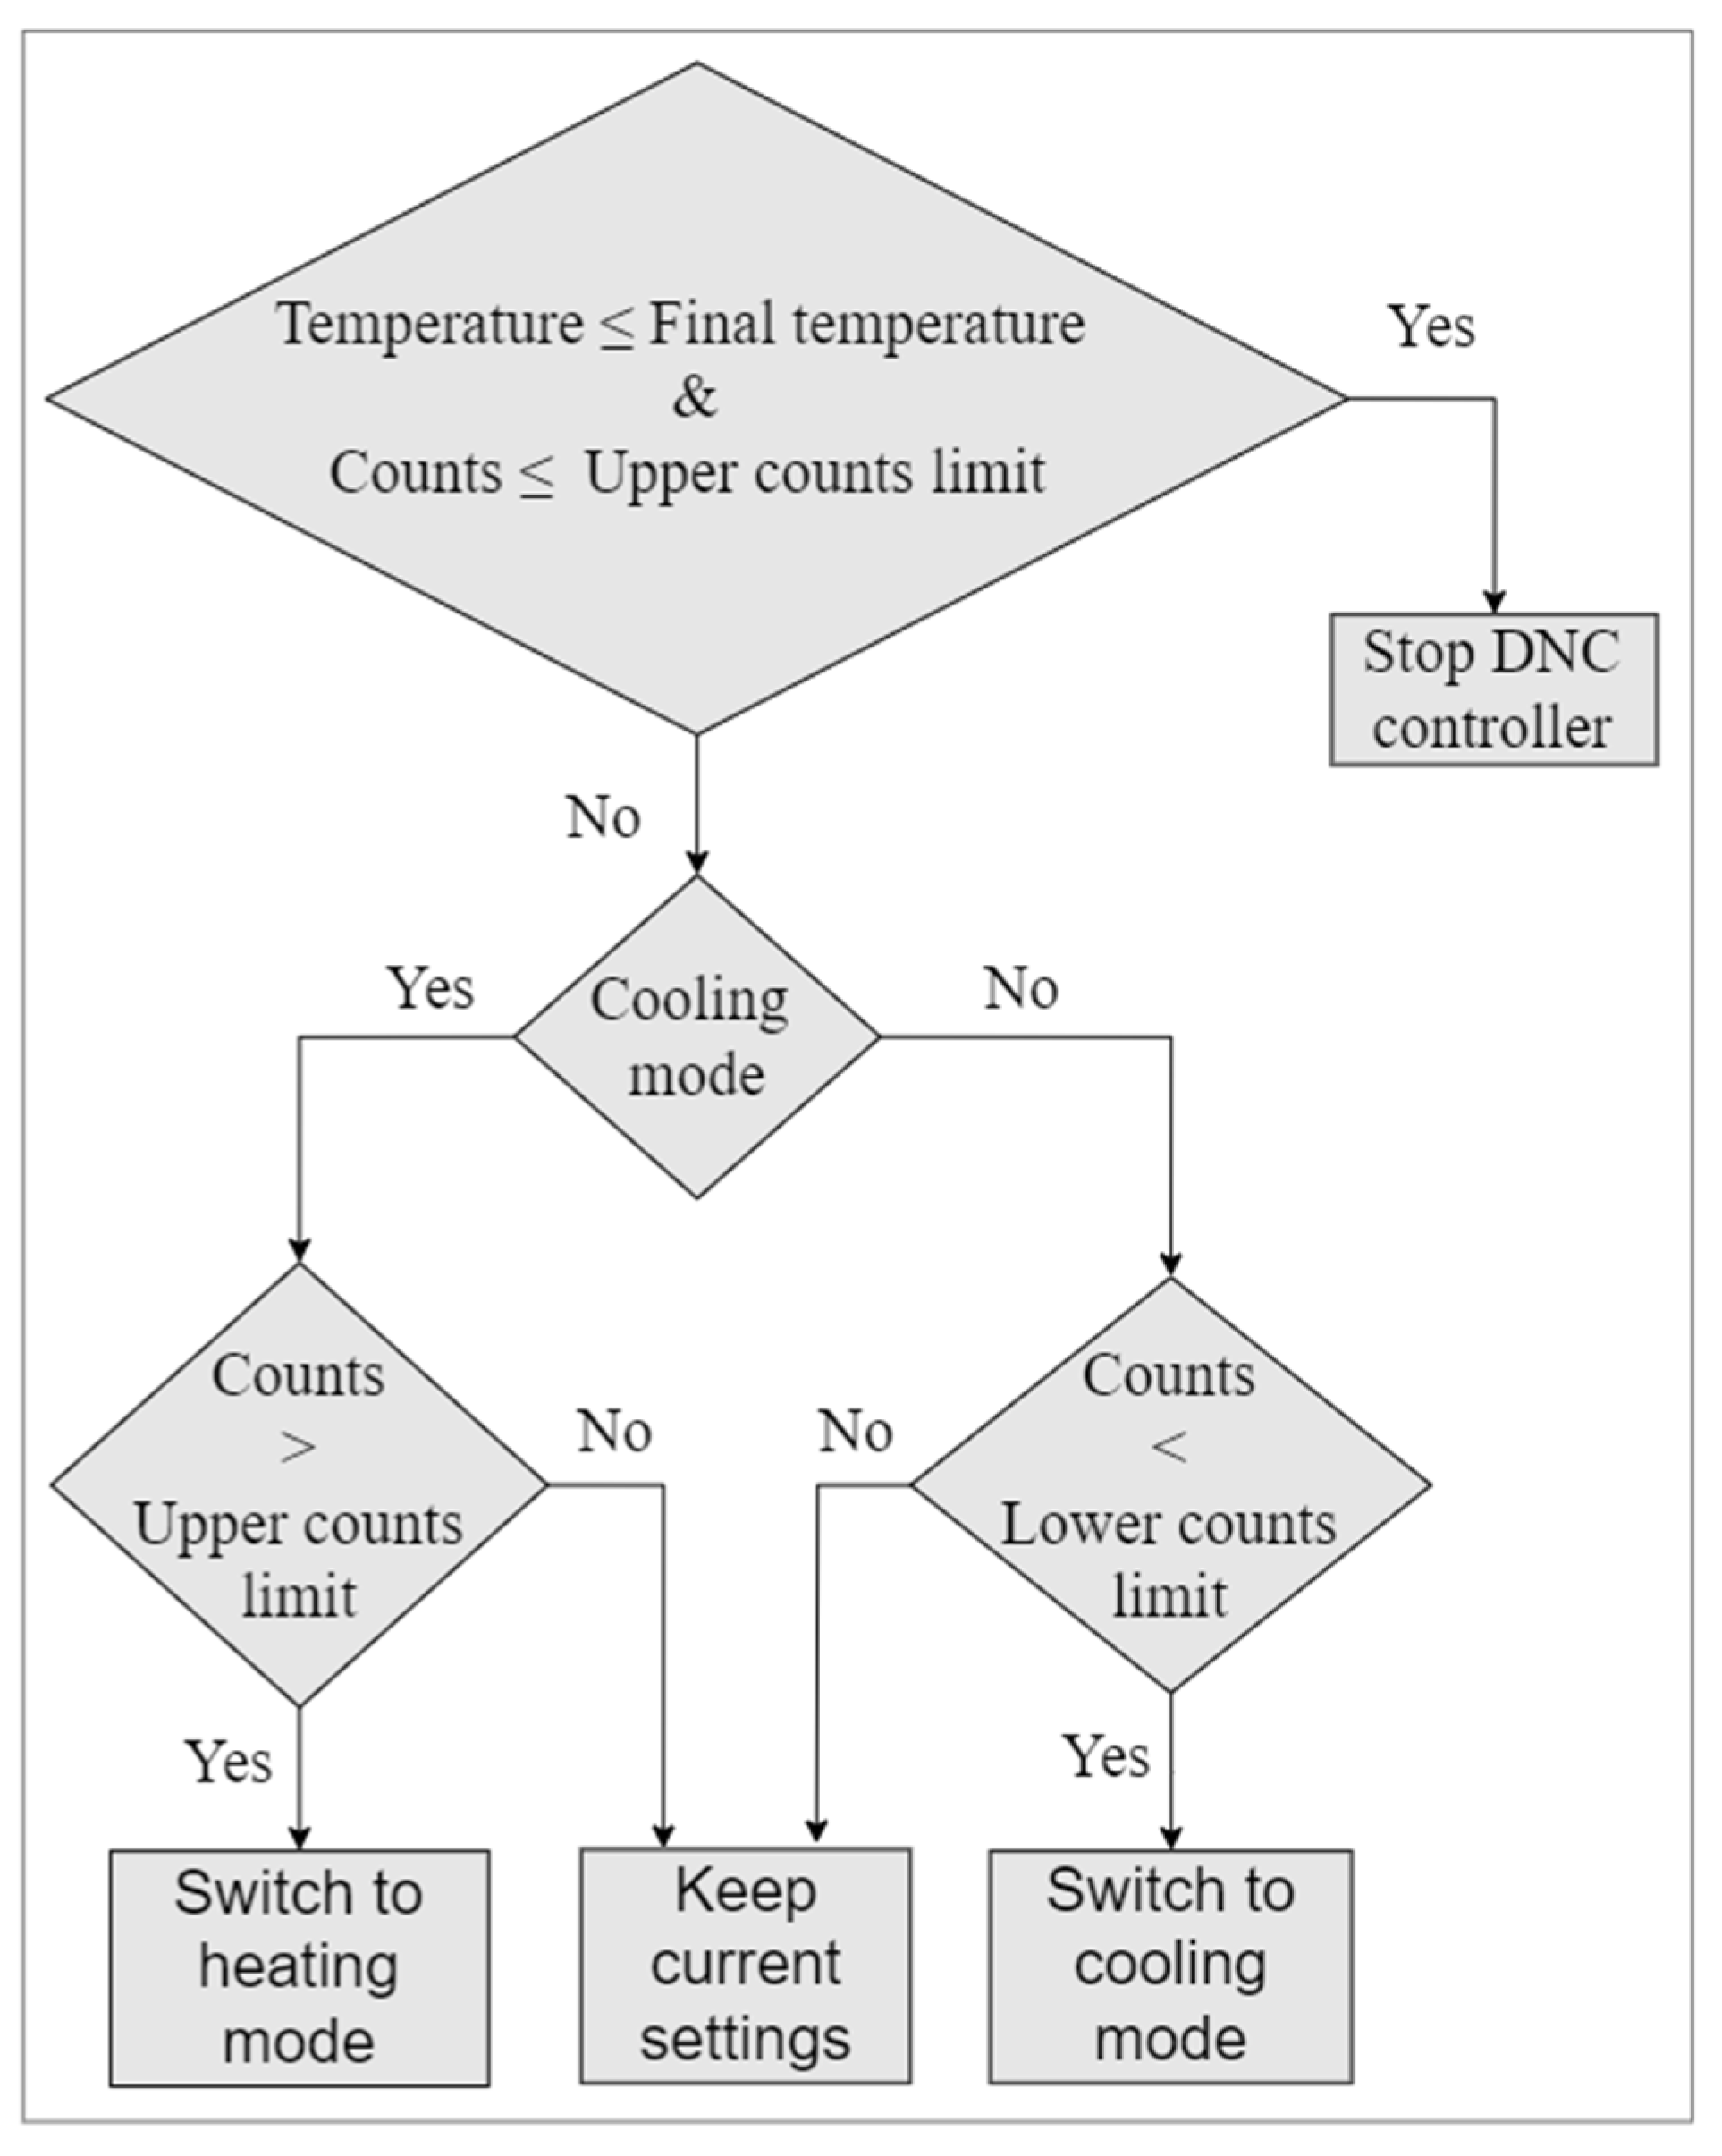
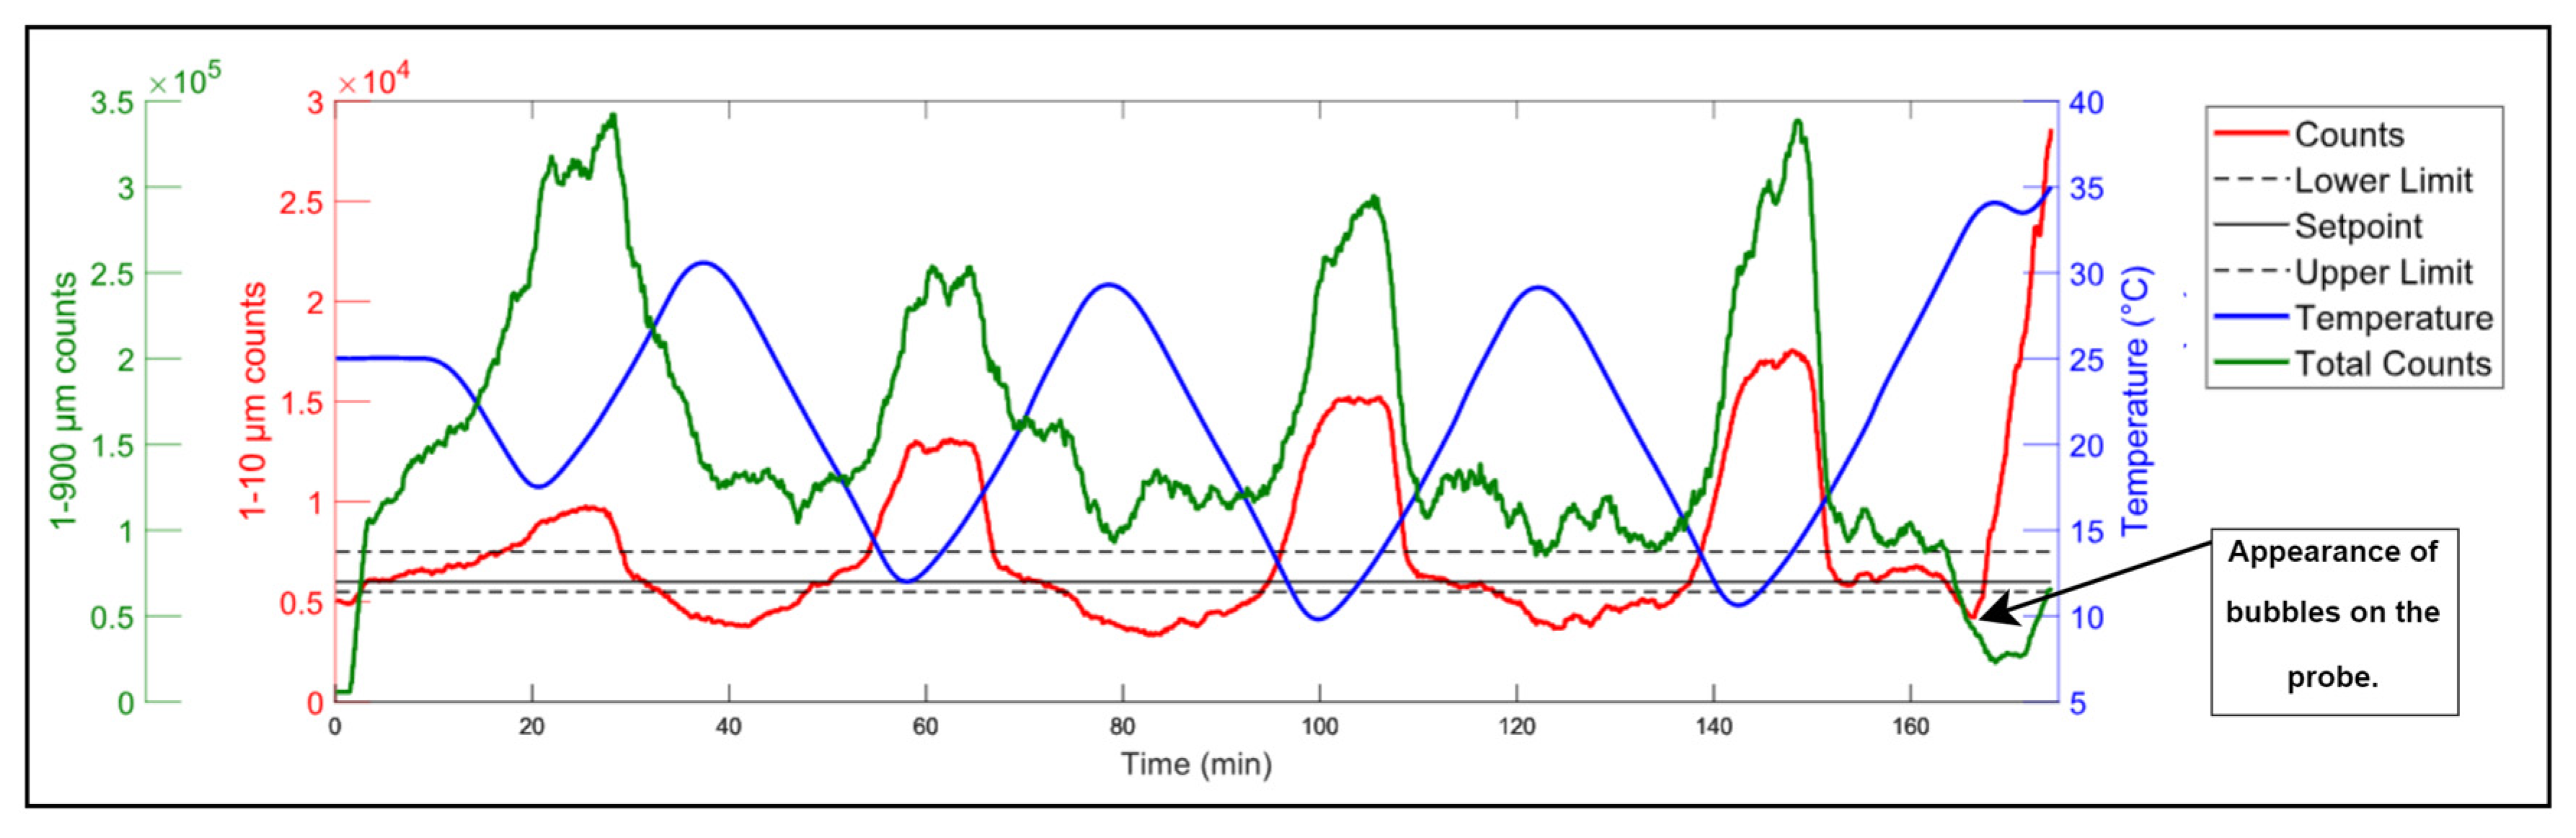
2.2. DNC Controller Algorithm and Controlled Variable Selection

The DNC controller measures the crystallizer temperature and counts and performs logical operations to determine the next step. The controller has three different states—idle mode, cooling mode and heating mode. When the system is started, the initial state of the controller must be defined and is normally set to cooling mode. When the counts reach the upper limit, heating mode is activated. If the heating mode is active and the counts reach the lower limit, the cooling mode is activated. In both modes, the DNC controller sends a predefined heating or cooling rate to the thermal circulator controller, which is a lower-level ramp-based cascade temperature controller. When the process temperature reaches the desired value and counts are below the upper limit, the controller is set to the idle state and the temperature setpoint is set to the final temperature. The flow chart of the algorithm is shown in Figure 3.
The most commonly used control variable for DNC is unweighted counts (or length-weighted counts) over the entire size range. However, this statistic is not only influenced by the occurrence of secondary nucleation but also by various phenomena during crystallization. Ideally, the control variable should only capture the formation of new nuclei, which would indicate excessive nucleation in the system. Therefore, the length-weighted edge-to-edge counts in the range of 1–10 μm were chosen as the control variable in this study. It is expected to respond mainly to the appearance of new small crystals and thus, stabilize the DNC. Furthermore, in this study, heating and cooling is performed at a predetermined rate rather than using a controller that adjusts the rate depending on the deviation from the set point.

2.3. Microscope Properties and Configuration Settings

A high-performance in situ microscope (Blaze 900 Micro, Blaze Metrics LLC, Marysville, Washington, United States) was used for this study. The microscope has a 900 micrometer diameter field of view, 400 nanometer detection limit, and a resolution smaller than 1 micrometer [30]. The instrument’s focal plane can be adjusted manually and was set to 2 μm. The focal plane is the distance from the microscope window, where particles appear sharp and clear in the image. As small particles tend to reach the microscope window more easily than large ones, this should contribute to better detection of small crystals formed by nucleation.
The microscope calculates the edge-to-edge chord length distribution derived from the image using a proprietary image processing algorithm not known to the public. On the one hand, the algorithm might not be suitable for a specific case; on the other hand, the image processing parameters do not have to be set manually, which is a step toward standardization and automation of experiments. However, the results should be taken cum grano salis.

2.4. Experimental Procedure

The model system studied was the seeded batch cooling crystallization of glycine from water, and it was expected that the prevailing crystallization mechanisms are secondary nucleation and crystal growth. Glycine (pro analysis, CARLO ERBA Reagents S.r.l., Cornaredo, Italy) was identified as an α-polymorph by Raman spectroscopy, compared to that in the literature [31,32]. Purified distilled water was used as the solvent and the solubility curve was approximated by polynomial regression of the solubility data found in the literature [33]. The seeds were prepared by sieving and isolating the fraction between 100 and 150 μm. A total of 106 g of glycine corresponding to saturation solubility at 35 °C, was dissolved in 400 mL of water and heated to 40 °C to ensure the complete dissolution of the solids. The stirring rate was 250 rpm for all experiments. The solution was then cooled to 25 °C and the seed crystals were added. The solution was then cooled with linear cooling or the DNC until it reached 5 °C and counts range (for the DNC). The cooling and heating rates were 1 °C/min. At the end of the experiment, the suspension was kept at 5 °C for a while, and then filtered using a vacuum filtration system. The crystals were dried overnight at room temperature and sieved the next day.

3. Results and Discussion

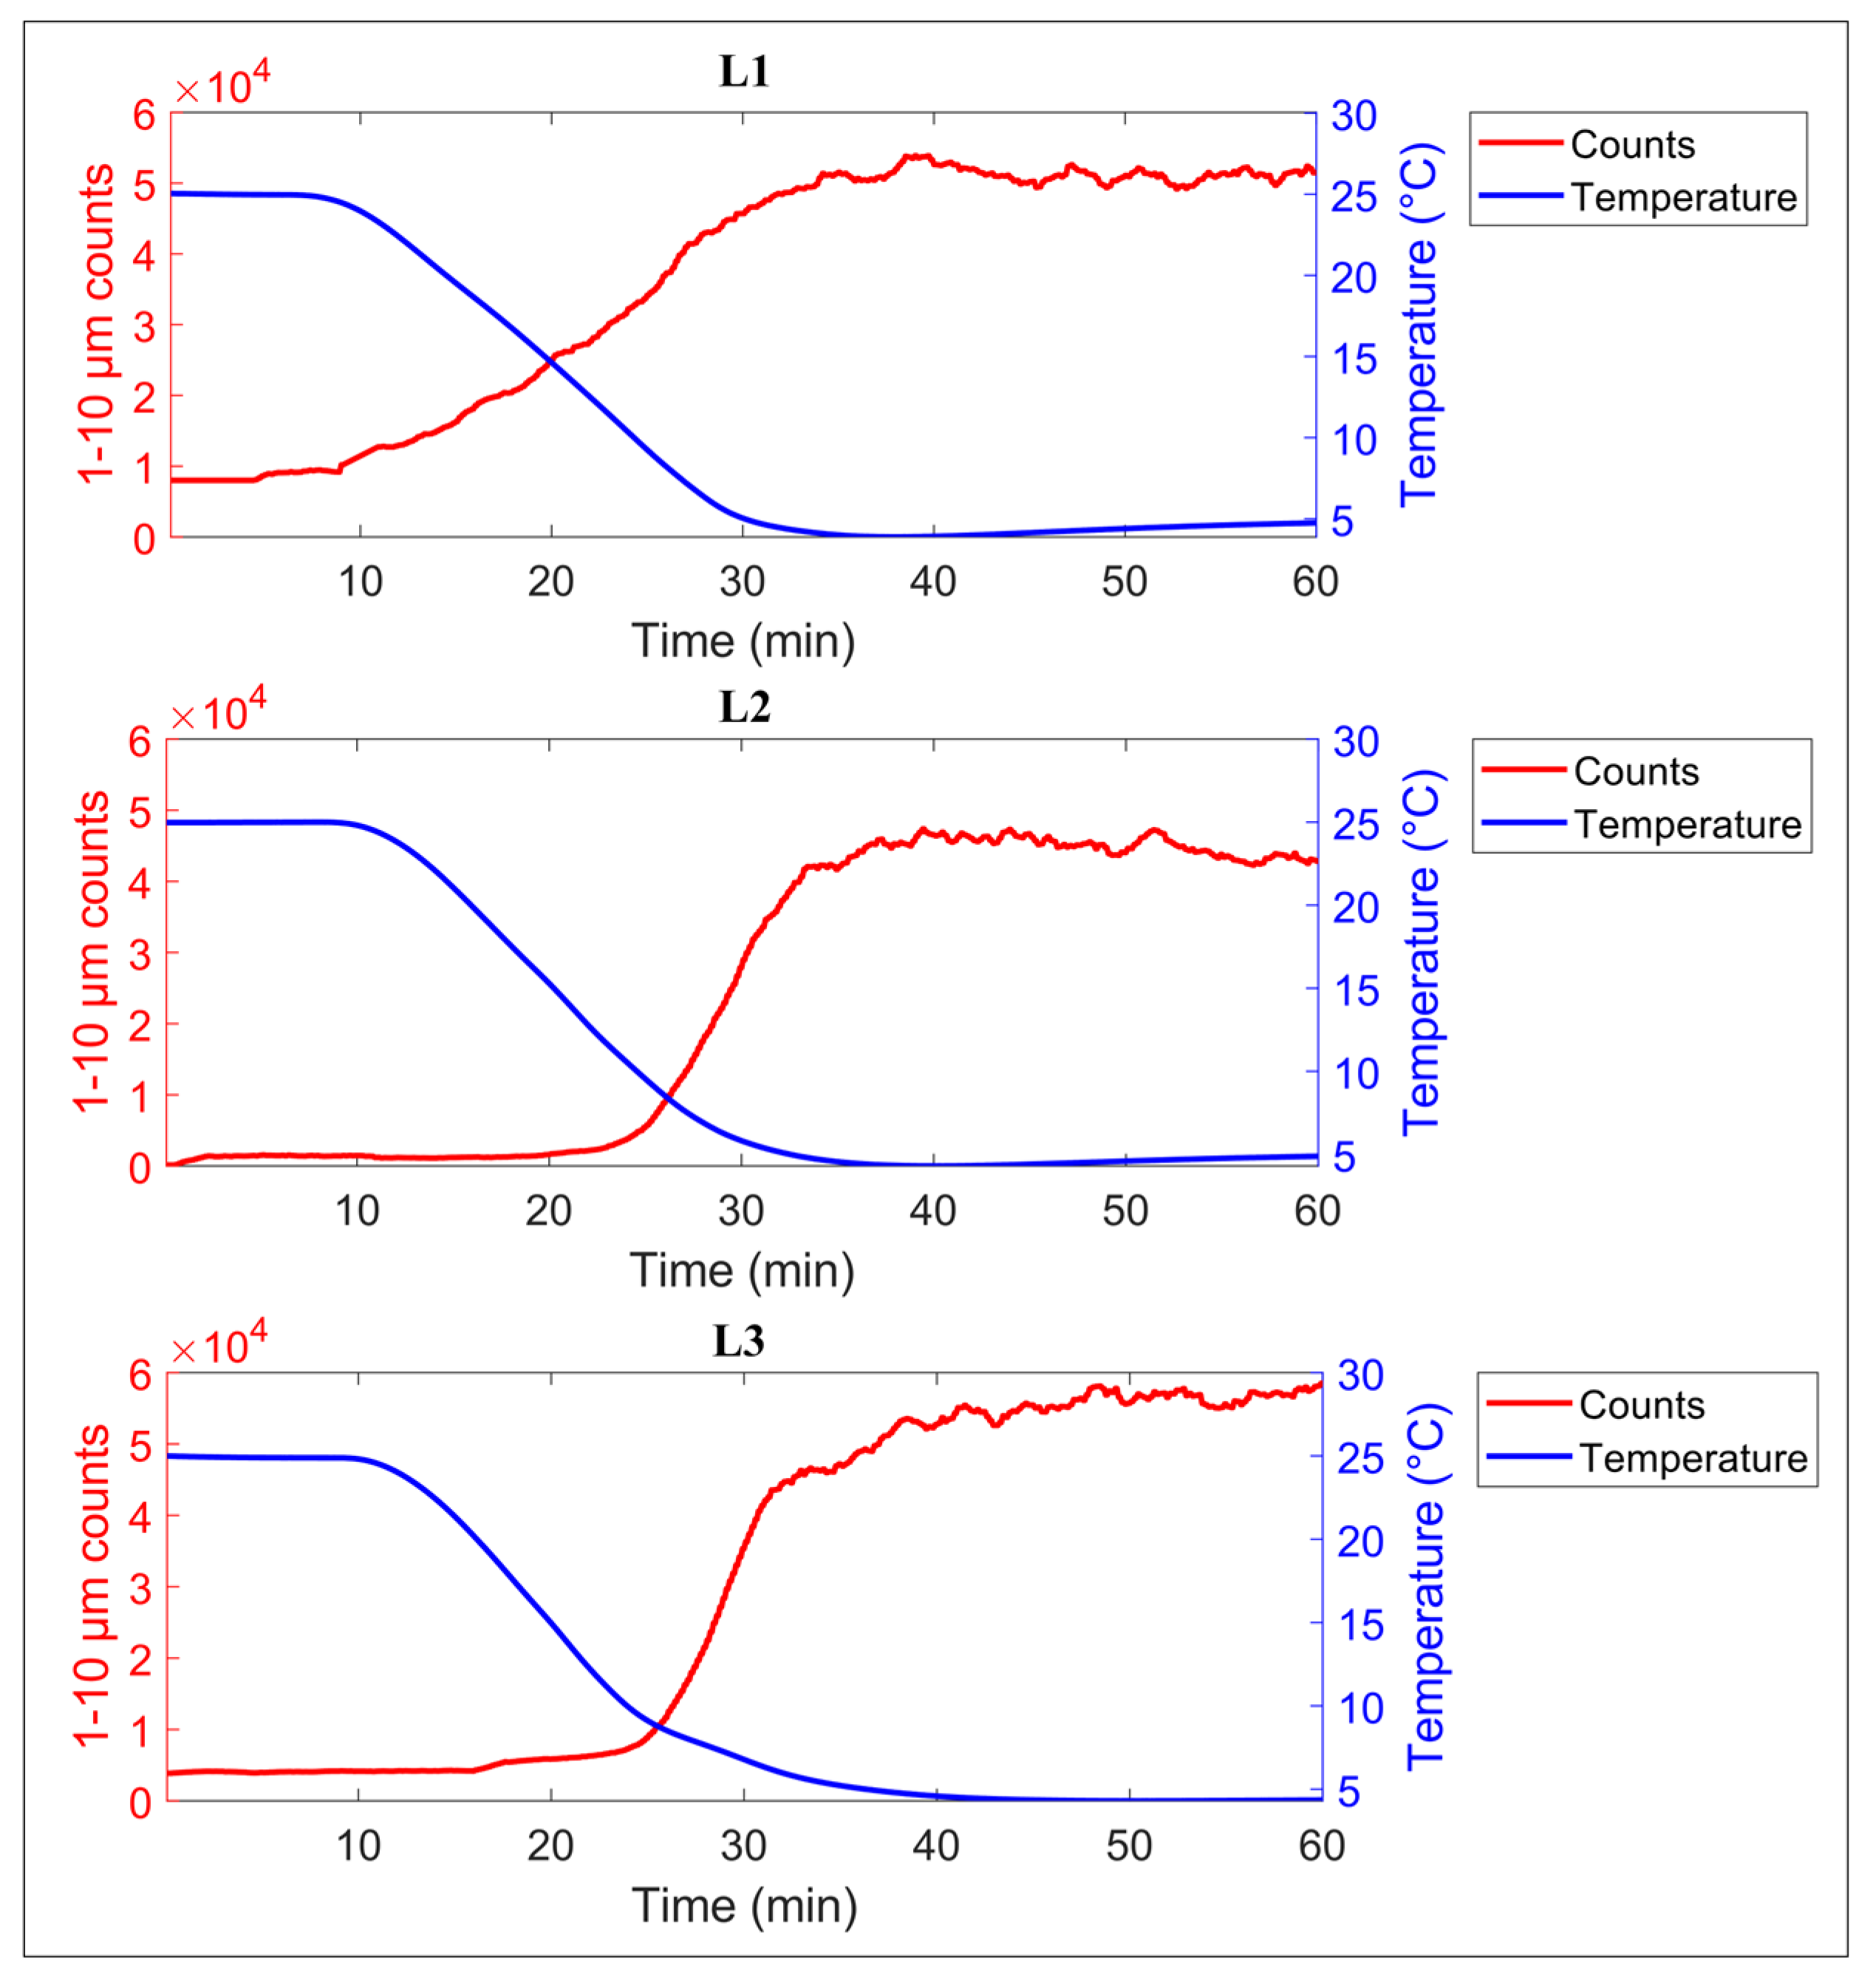
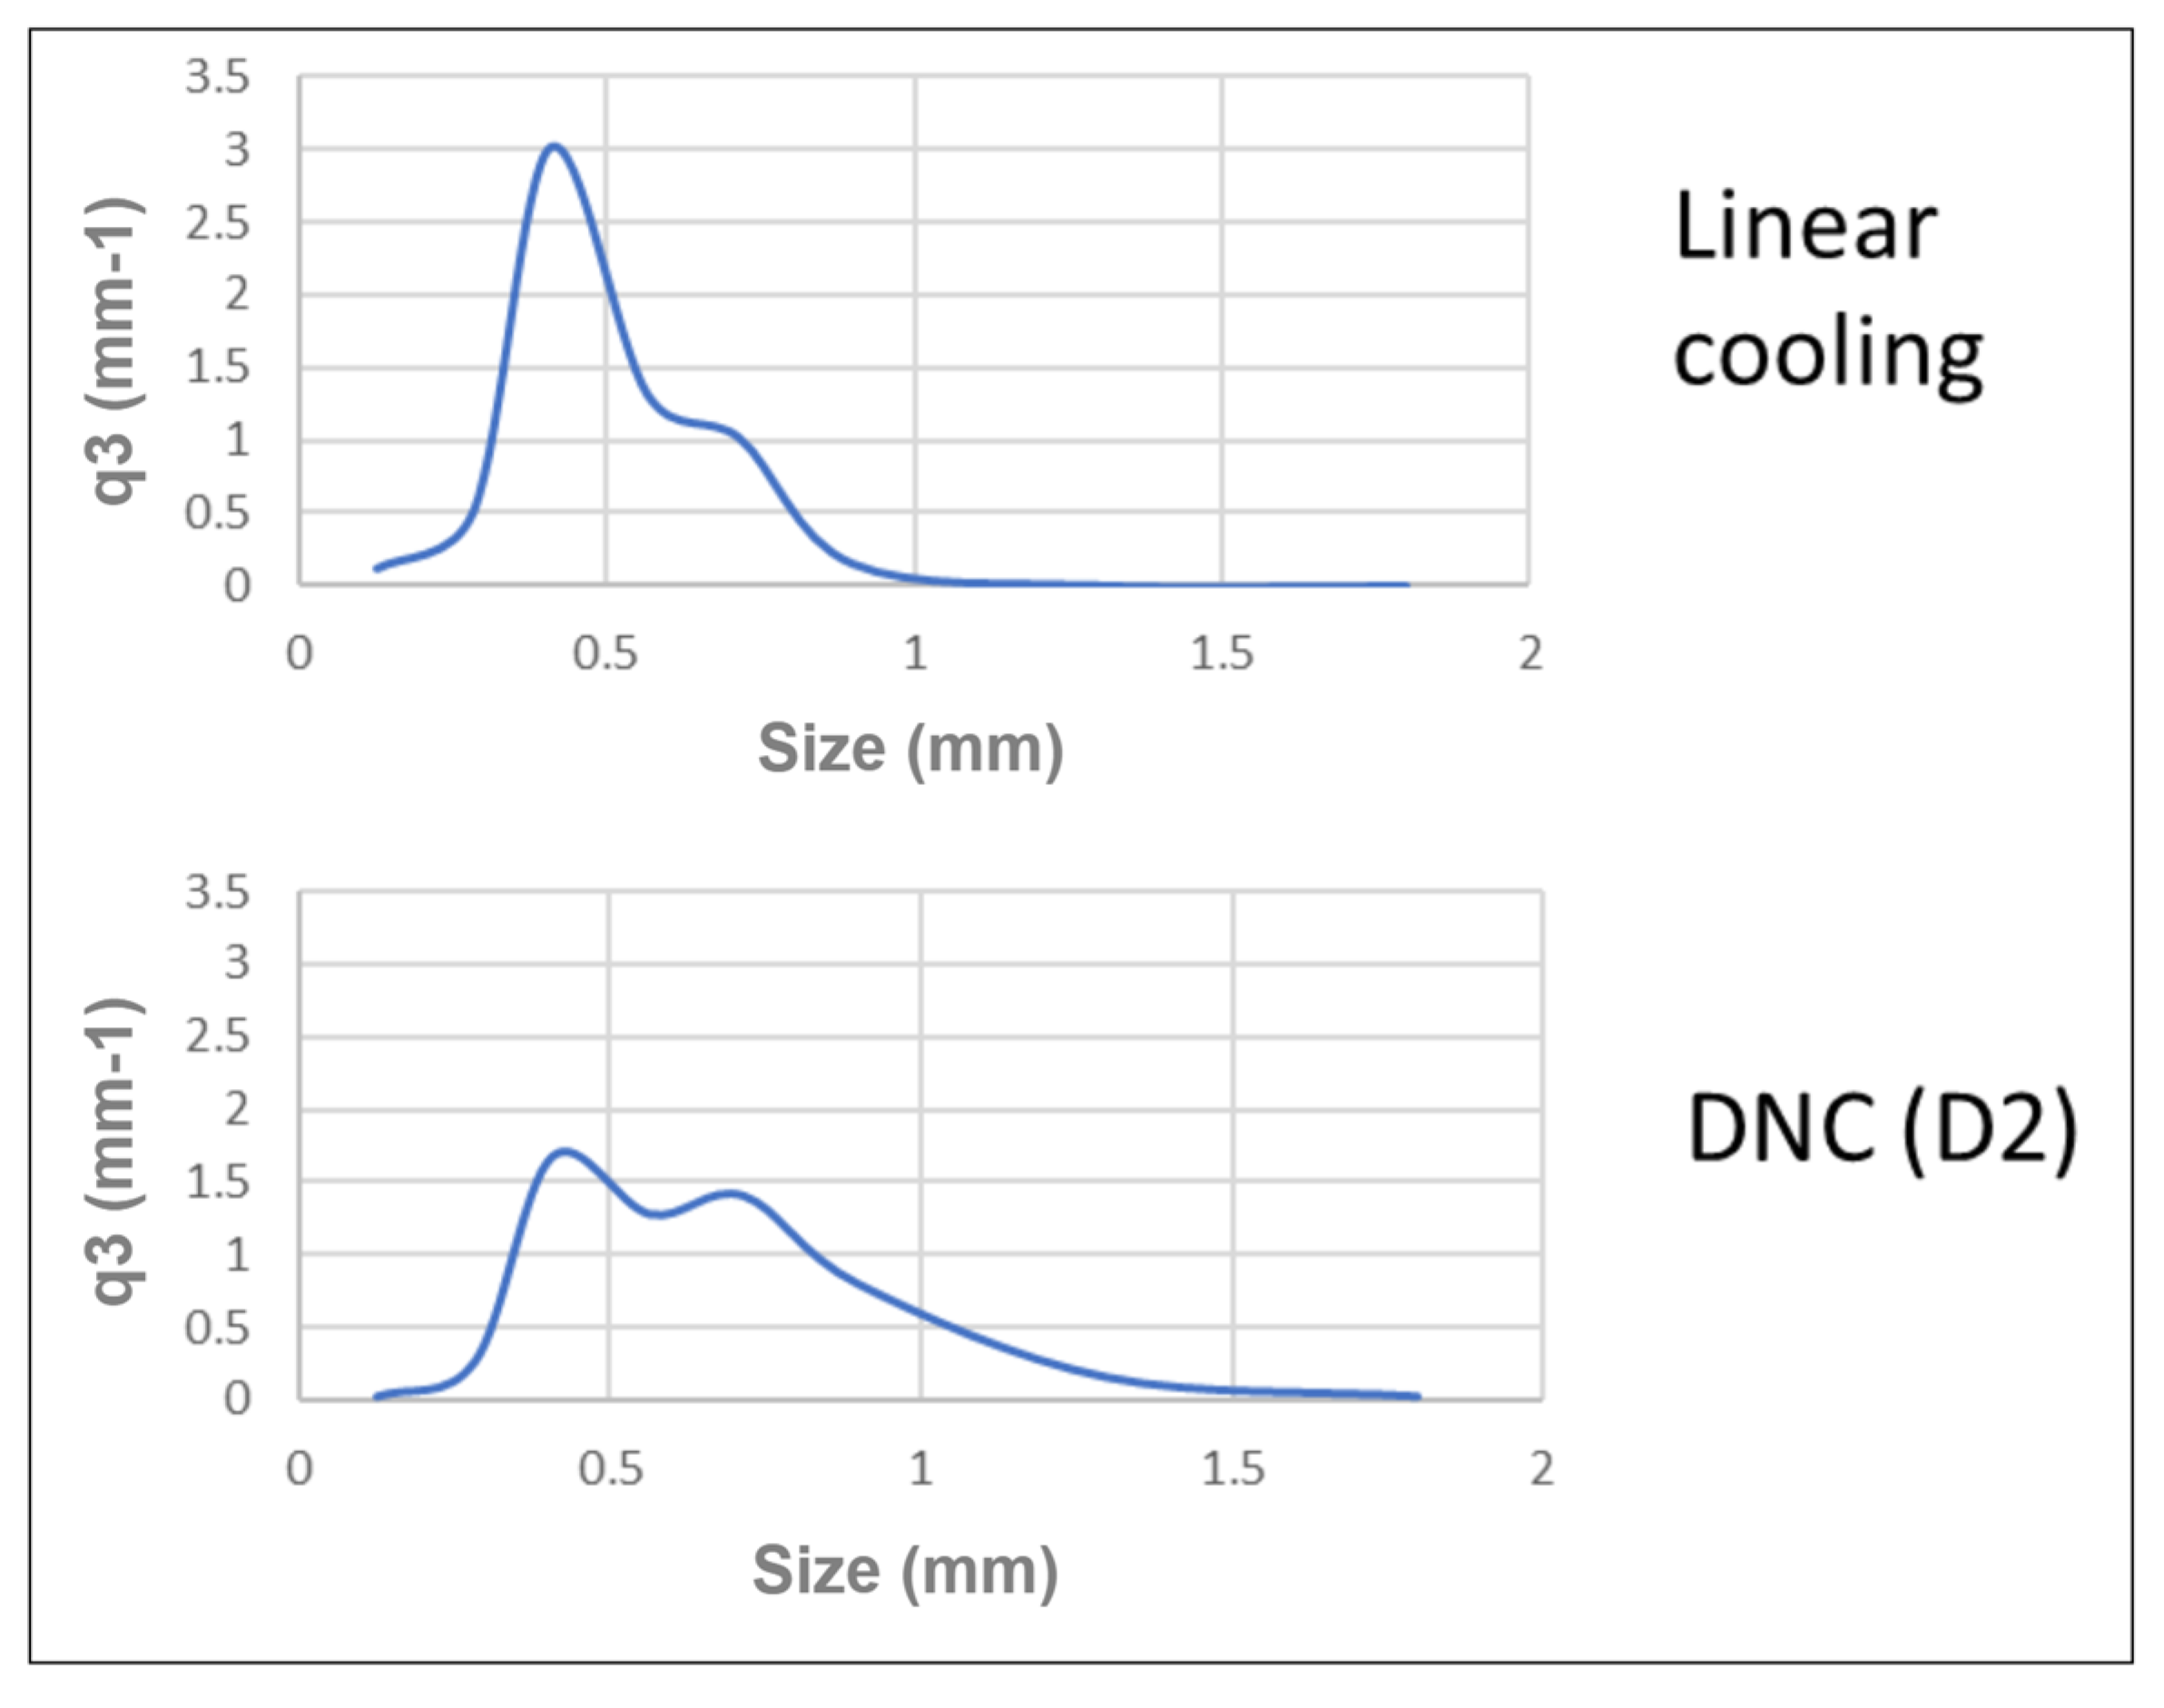
3.1. Linear Cooling Experiments

Three linear cooling experiments have been conducted with a slight variation in the amount of seed crystals. Uncertainty was intentionally introduced to test whether significant changes in counts would occur. The amount of seeds was kept low to promote secondary nucleation at the beginning of the experiment and can be found in Table 1.
Due to the use of a new controlled variable and a new method (HPM), linear cooling experiments are required to determine the initial set point for DNC experiments. The results of the linear cooling experiments are shown in Figure 4.
Experiment L3 had the smallest amount of seeds, and counts reached the highest value (60,000) compared to the other experiments. This is probably due to the insufficient crystal growth surface leading to a higher supersaturation and nucleation rate. Since the counts across all linear experiments remained within the same order of magnitude (about 50,000), we concluded that the setup is sufficiently reliable to proceed with the DNC experiments.

3.2. DNC Experiments

The initial counts setpoint in the first DNC experiment was arbitrarily chosen and set at 25,000, with an upper limit of 29,000 and a lower limit of 22,000. In experiments D2 and D3, the setpoint and limits were adjusted to obtain better results. The seed loading was constant for all DNC experiments and was set to 1 percent of the dissolved mass. Data acquisition was started shortly after the seeding. A summary of the conditions for the DNC experiments can be found in Table 2 and the results of the DNC experiments are shown in Figure 5.
In experiment D1, the counts setpoint was set to a relatively high value (25,000). Once the upper limit was exceeded, the controller initiated a heating cycle. However, due to the inertia of the heating and cooling system, a considerable amount of time passed before the crystallizer warmed up, resulting in the counts significantly exceeding the upper limit. This thermal inertia is the reason why recent adaptations of the DNC method recommend the use of an external heat exchanger to speed up the response of the system [34]. After the heating cycle, cooling could no longer increase the counts, which is probably due to the lower nucleation rate at lower temperatures.
In experiment D2, the setpoint was lowered to 10,000 and the upper and lower limits were tightened compared to experiment D1. This procedure was chosen in order to prevent the sharp overshooting of the upper limit observed in D1 and thus to avoid excessive reheating of the crystallizer. Experiment D2 proved to be successful and showed that the new control variable and HPM can deliver effective results after just a few trials.

Experiment D3 Analysis

In experiment D3, the setpoint for the counts was lowered further and the upper and lower limits for the counts were narrowed asymmetrically. The lower limit was set tighter than the upper limit because previous observations indicated that the heating cycle often drives counts below the lower threshold. Although this setting was expected to end the heating cycle earlier, it, instead, led to temperature oscillations that caused instability in the control system. Towards the end of the experiment, a sudden spike in counts triggered the heating cycle. Although the contents of the crystallizer clearly dissolved, the heating did not reduce the counts. The microscopic image in Figure 6 shows the presence of air bubbles that significantly disturb the control variable. To investigate whether another control variable is less sensitive to bubble formation at the probe, a common DNC control variable (1–900 LW counts) is plotted against the 1–10 LW counts. The detailed comparison can be seen in Figure 7.
A comparison of the two control variables reveals that the total counts (1–900 LW counts) are less sensitive to the appearance of bubbles at the microscope window than the counts (1–10 LW counts). Only when most of the crystals have dissolved does the total count increase. The HPM image processing algorithm should take into account the possible formation of bubble at the probe window and possibly exclude the affected area from the analysis.

3.3. Comparison of DNC and Linear Cooling

In order to evaluate the advantages of DNC, a further experiment with linear cooling was carried out, the total duration of which corresponded to that of the successful DNC experiment D2. After the experiment, the crystals obtained by linear cooling and DNC were analyzed by sieving. A comparison of the particle size distributions is shown in Figure 8.
The distribution reveals that the crystals obtained by DNC contain significantly fewer fine crystals, which is typical of the DNC method. However, the crystals produced by DNC also show a slightly broader particle size distribution, which is unusual for DNC. This phenomenon is probably due to the agglomeration tendency of glycine and the fact that the cooling rate with DNC was higher than that with linear cooling of the same duration. The HPM image taken shortly before the end of experiment D2, just prior to vacuum filtration, reveals the presence of agglomerated crystals and is shown in Figure 9.

4. Conclusions

This study demonstrates the potential of automated high performance in situ microscopy as a tool for monitoring and implementing direct nucleation control in cooling crystallization processes. The research focused on a novel control variable: length-weighted edge-to-edge counts in the range of 1–10 μm to increase the sensitivity for the onset of nucleation. The experiments revealed that the new control variable was effective for the DNC process, but also exhibited sensitivity to bubble formation on the microscope window, indicating the need for a better image processing algorithm. Comparative experiments with linear cooling and DNC showed that the latter produced crystals with fewer fines, but also resulted in a broader particle size distribution, likely due to the agglomeration behavior of glycine at high cooling rates. Despite these challenges, HPM proves to be a promising tool for the design and optimization of crystallization processes and marks a significant advancement in process analytical technology.

5. Future Work

Our future work will prioritize the implementation of an external heat exchanger that can significantly speed up the heating cycle. This improvement would help overcome the challenges posed by the inherent inertia of heating and could make DNC feasible for industrial crystallization.

Author Contributions

Conceptualization, J.B.S.; methodology, N.B.; software, M.S.; formal analysis, J.B.S.; writing—original draft preparation, J.B.S.; writing—review and editing, N.B.; visualization, M.S.; supervision, N.B. All authors have read and agreed to the published version of the manuscript.

Funding

This research has received funding from the European Structural and Investment Funds under grant number KK.01.1.1.07.0017 (CrystAPC—Crystallization Advanced Process Control).

Data Availability Statement

The raw data supporting the conclusions of this article will be made available by the authors on request.

Acknowledgments

We greatly acknowledge Botond Szilágyi, from the Budapest University of Technology and Economics, whose kind and friendly advice helped to foster the research capabilities of our laboratory.

Conflicts of Interest

The authors declare no conflicts of interest.

References

  1. Tung, H.-H. Crystallization of Organic Compounds: An Industrial Perspective; Wiley: Hoboken, NJ, USA, 2009. [Google Scholar]
  2. Swami, A.; Hatolkar, S.; Patil, A.; Dhumal, K.; Shastri, A. Process analytical technology (PAT): Enhancing quality and efficiency in pharmaceutical development and production. Korean J. Physiol. Pharmacol. 2023, 27, 394–408. [Google Scholar]
  3. Bhavin, S.E.; Anuradha, G. Process analytical technology (PAT) in quality assurance: A detailed review. Int. J. Pharm. Sci. Nanotechnol. 2022, 15, 5763–5770. [Google Scholar]
  4. Chianese, A.; Kramer, H.J. Industrial Crystallization Process Monitoring and Control; Wiley: Hoboken, NJ, USA, 2012. [Google Scholar]
  5. Szilagyi, B.; Eren, A.; Quon, J.L.; Papageorgiou, C.D.; Nagy, Z.K. Application of model-free and model-based quality-by-control (QbC) for the efficient design of pharmaceutical crystallization processes. Cryst. Growth Des. 2020, 20, 3979–3996. [Google Scholar] [CrossRef]
  6. ASaleemi, N.; Steele, G.; Pedge, N.I.; Freeman, A.; Nagy, Z.K. Enhancing crystalline properties of a cardiovascular active pharmaceutical ingredient using a process analytical technology based crystallization feedback control strategy. Int. J. Pharm. 2012, 430, 56–64. [Google Scholar] [CrossRef]
  7. Trampuž, M.; Teslić, D.; Likozar, B.; Dejanović, I. Batch crystallization of active pharmaceutical ingredient: Kinetics and equilibrium modelling. Kem. Ind. 2018, 67, 43–48. [Google Scholar] [CrossRef]
  8. de Moraes, M.G.F.; Grover, M.A.; de Souza, M.B.; Lage, P.L.C.; Secchi, A.R. Optimal control of crystal size and shape in batch crystallization using a bivariate population balance modeling. IFAC-PapersOnLine 2021, 54, 653–660. [Google Scholar] [CrossRef]
  9. Bötschi, S.; Rajagopalan, A.K.; Morari, M.; Mazzotti, M. Feedback control for the size and shape evolution of needle-like crystals in suspension I Concepts and simulation studies. Cryst. Growth Des. 2018, 18, 4470–4483. [Google Scholar] [CrossRef]
  10. Rajagopalan, A.K.; Bötschi, S.; Morari, M.; Mazzotti, M. Feedback control for the size and shape evolution of needle-like crystals in suspension II Cooling crystallization experiments. Cryst. Growth Des. 2018, 18, 6185–6196. [Google Scholar] [CrossRef]
  11. Gao, Y.; Zhang, T.; Ma, Y.; Xue, F.; Gao, Z.; Hou, B.; Gong, J. Application of pat-based feedback control approaches in pharmaceutical crystallization. Crystals 2021, 11, 221. [Google Scholar] [CrossRef]
  12. Nagy, Z.K.; Fevotte, G.; Kramer, H.; Simon, L.L. Recent advances in the monitoring, modelling and control of crystallization systems. Chem. Eng. Res. Des. 2013, 91, 1903–1922. [Google Scholar] [CrossRef]
  13. Liotta, V.; Sabesan, V. Monitoring and feedback control of supersaturation using ATR-FTIR to produce an active pharmaceutical ingredient of a desired crystal size. Org. Process Res. Dev. 2004, 8, 488–494. [Google Scholar] [CrossRef]
  14. Gavran, M.; Andrijić, Ž.U.; Bolf, N.; Rimac, N.; Sacher, J.; Šahnić, D. Development of a calibration model for real-time solute concentration monitoring during crystallization of ceritinib using raman spectroscopy and in-line process microscopy. Processes 2023, 11, 3439. [Google Scholar] [CrossRef]
  15. Zhang, T.; Nagy, B.; Szilágyi, B.; Gong, J.; Nagy, Z.K. Simulation and experimental investigation of a novel supersaturation feedback control strategy for cooling crystallization in semi-batch implementation. Chem. Eng. Sci. 2020, 225, 115807. [Google Scholar] [CrossRef]
  16. Zhang, T.; Szilágyi, B.; Gong, J.; Nagy, Z.K. Novel semibatch supersaturation control approach for the cooling crystallization of heat-sensitive materials. AIChE J. 2020, 66, 16955. [Google Scholar] [CrossRef]
  17. Bakar, M.R.A.; Nagy, Z.K.; Saleemi, A.N.; Rielly, C.D. The impact of direct nucleation control on crystal size distribution in pharmaceutical crystallization processes. Cryst. Growth Des. 2009, 9, 1378–1384. [Google Scholar] [CrossRef]
  18. Saleemi, A.N.; Rielly, C.D.; Nagy, Z.K. Comparative investigation of supersaturation and automated direct nucleation control of crystal size distributions using ATR-UV/vis spectroscopy and FBRM. Cryst. Growth Des. 2012, 12, 1792–1807. [Google Scholar] [CrossRef]
  19. Saleemi, A.; Rielly, C.; Nagy, Z.K. Automated direct nucleation control for in situ dynamic fines removal in batch cooling crystallization. CrystEngComm 2012, 14, 2196–2203. [Google Scholar] [CrossRef]
  20. Ostergaard, I.; Szilagyi, B.; De Diego, H.L.; Qu, H.; Nagy, Z.K. Polymorphic Control and Scale-Up Strategy for Antisolvent Crystallization Using a Sequential Supersaturation and Direct Nucleation Control Approach. Cryst. Growth Des. 2020, 20, 5538–5550. [Google Scholar] [CrossRef]
  21. Ostergaard, I.; Szilagyi, B.; De Diego, H.L.; Qu, H.; Nagy, Z.K. Polymorphic Control and Scale-Up Strategy for Antisolvent Crystallization Using Direct Nucleation Control. Cryst. Growth Des. 2020, 20, 2683–2697. [Google Scholar] [CrossRef]
  22. Simone, E.; Othman, R.; Vladisavljević, G.T.; Nagy, Z.K. Preventing crystal agglomeration of pharmaceutical crystals using temperature cycling and a novel membrane crystallization procedure for seed crystal generation. Pharmaceutics 2018, 10, 17. [Google Scholar] [CrossRef]
  23. Simone, E.; Zhang, W.; Nagy, Z.K. Application of process analytical technology-based feedback control strategies to improve purity and size distribution in biopharmaceutical crystallization. Cryst. Growth Des. 2015, 15, 2908–2919. [Google Scholar] [CrossRef]
  24. Yao, T.; Liu, J.; Wan, X.; Li, B.; Rohani, S.; Gao, Z.; Gong, J. Deep-learning based in situ image monitoring crystal polymorph and size distribution: Modeling and validation. AIChE J. 2024, 70, 18279. [Google Scholar] [CrossRef]
  25. Barhate, Y.; Boyle, C.; Salami, H.; Wu, W.L.; Taherimakhsousi, N.; Rabinowitz, C.; Bommarius, A.; Cardona, J.; Nagy, Z.K.; Rousseau, R.; et al. OpenCrystalData: An open-access particle image database to facilitate learning, experimentation, and development of image analysis models for crystallization processes. Digit. Chem. Eng. 2024, 11, 100150. [Google Scholar] [CrossRef]
  26. Wu, W.L.; Chappelow, C.; Hanspal, N.; Larsen, P.; Patton, J.; Shinkle, A.; Nagy, Z.K. Implementation and application of image analysis-based turbidity direct nucleation control for rapid agrochemical crystallization process design and scale-up. Ind. Eng. Chem. Res. 2022, 61, 14561–14572. [Google Scholar] [CrossRef]
  27. Borsos, Á.; Szilágyi, B.; Agachi, P.Ş.; Nagy, Z.K. Real-Time Image Processing Based Online Feedback Control System for Cooling Batch Crystallization. Org. Process Res. Dev. 2017, 21, 511–519. [Google Scholar] [CrossRef]
  28. Jul-Jørgensen, I.; Oliver, R.; Gernaey, K.V.; Hundahl, C.A. Modernizing non-classical protein crystallization through industry 4.0: Advanced monitoring and modelling utilizing process analytical technology. Chem. Eng. Res. Des. 2024, 204, 382–389. [Google Scholar] [CrossRef]
  29. Pickles, T.; Svoboda, V.; Marziano, I.; Brown, C.J.; Florence, A.J. Integration of a model-driven workflow into an industrial pharmaceutical facility: Supporting process development of API crystallisation. CrystEngComm 2024, 26, 4678–4689. [Google Scholar] [CrossRef]
  30. BlazeMetrics. Available online: https://www.blazemetrics.com/ (accessed on 2 December 2024).
  31. Rabesiaka, M.; Sghaier, M.; Fraisse, B.; Porte, C.; Havet, J.L.; Dichi, E. Preparation of glycine polymorphs crystallized in water and physicochemical characterizations. J. Cryst. Growth 2010, 312, 1860–1865. [Google Scholar] [CrossRef]
  32. Surovtsev, N.V.; Adichtchev, S.V.; Malinovsky, V.K.; Ogienko, A.G.; Drebushchak, V.A.; Manakov, A.Y.; Ancharov, A.I.; Yunoshev, A.S.; Boldyreva, E.V. Glycine phases formed from frozen aqueous solutions: Revisited. J. Chem. Phys. 2012, 137, 065103. [Google Scholar] [CrossRef]
  33. Yang, X.; Wang, X.; Ching, C.B. Solubility of form α and form γ of glycine in aqueous solutions. J. Chem. Eng. Data 2008, 53, 1133–1137. [Google Scholar] [CrossRef]
  34. Szilágyi, B. External fine particle removal for crystallization processes: Introduction and systematic comparison with the temperature cycling-based fines removal. Chem. Eng. Process. 2022, 179, 109074. [Google Scholar] [CrossRef]
Figure 1. Experimental setup and communication protocol.
Crystals 14 01079 g001
Figure 2. Laboratory system set-up.
Crystals 14 01079 g002
Figure 3. DNC algorithm logic flow diagram.
Crystals 14 01079 g003
Figure 4. Counts and temperature trends during linear cooling experiments.
Crystals 14 01079 g004
Figure 5. Counts and temperature trends during DNC experiments.
Crystals 14 01079 g005
Figure 6. Bubble formation on microscope window toward the end of the experiment D3.
Crystals 14 01079 g006
Figure 7. Control variable comparison for experiment D3.
Crystals 14 01079 g007
Figure 8. Sieving particle size distribution comparison between DNC and linear cooling.
Crystals 14 01079 g008
Figure 9. Agglomerated crystals at the end of experiment D2.
Crystals 14 01079 g009
Table 1. Seeding conditions for linear cooling experiments.
ExperimentL1L2L3
Seed loading (percent of dissolved mass)1.0410.910.85
Table 2. Counts setpoint and bounds for DNC experiments.
ExperimentD1D2D3
Upper counts limit29,00010,0007500
Counts setpoint25,00080006000
Lower counts limit22,00060005500
Disclaimer/Publisher’s Note: The statements, opinions and data contained in all publications are solely those of the individual author(s) and contributor(s) and not of MDPI and/or the editor(s). MDPI and/or the editor(s) disclaim responsibility for any injury to people or property resulting from any ideas, methods, instructions or products referred to in the content.

