
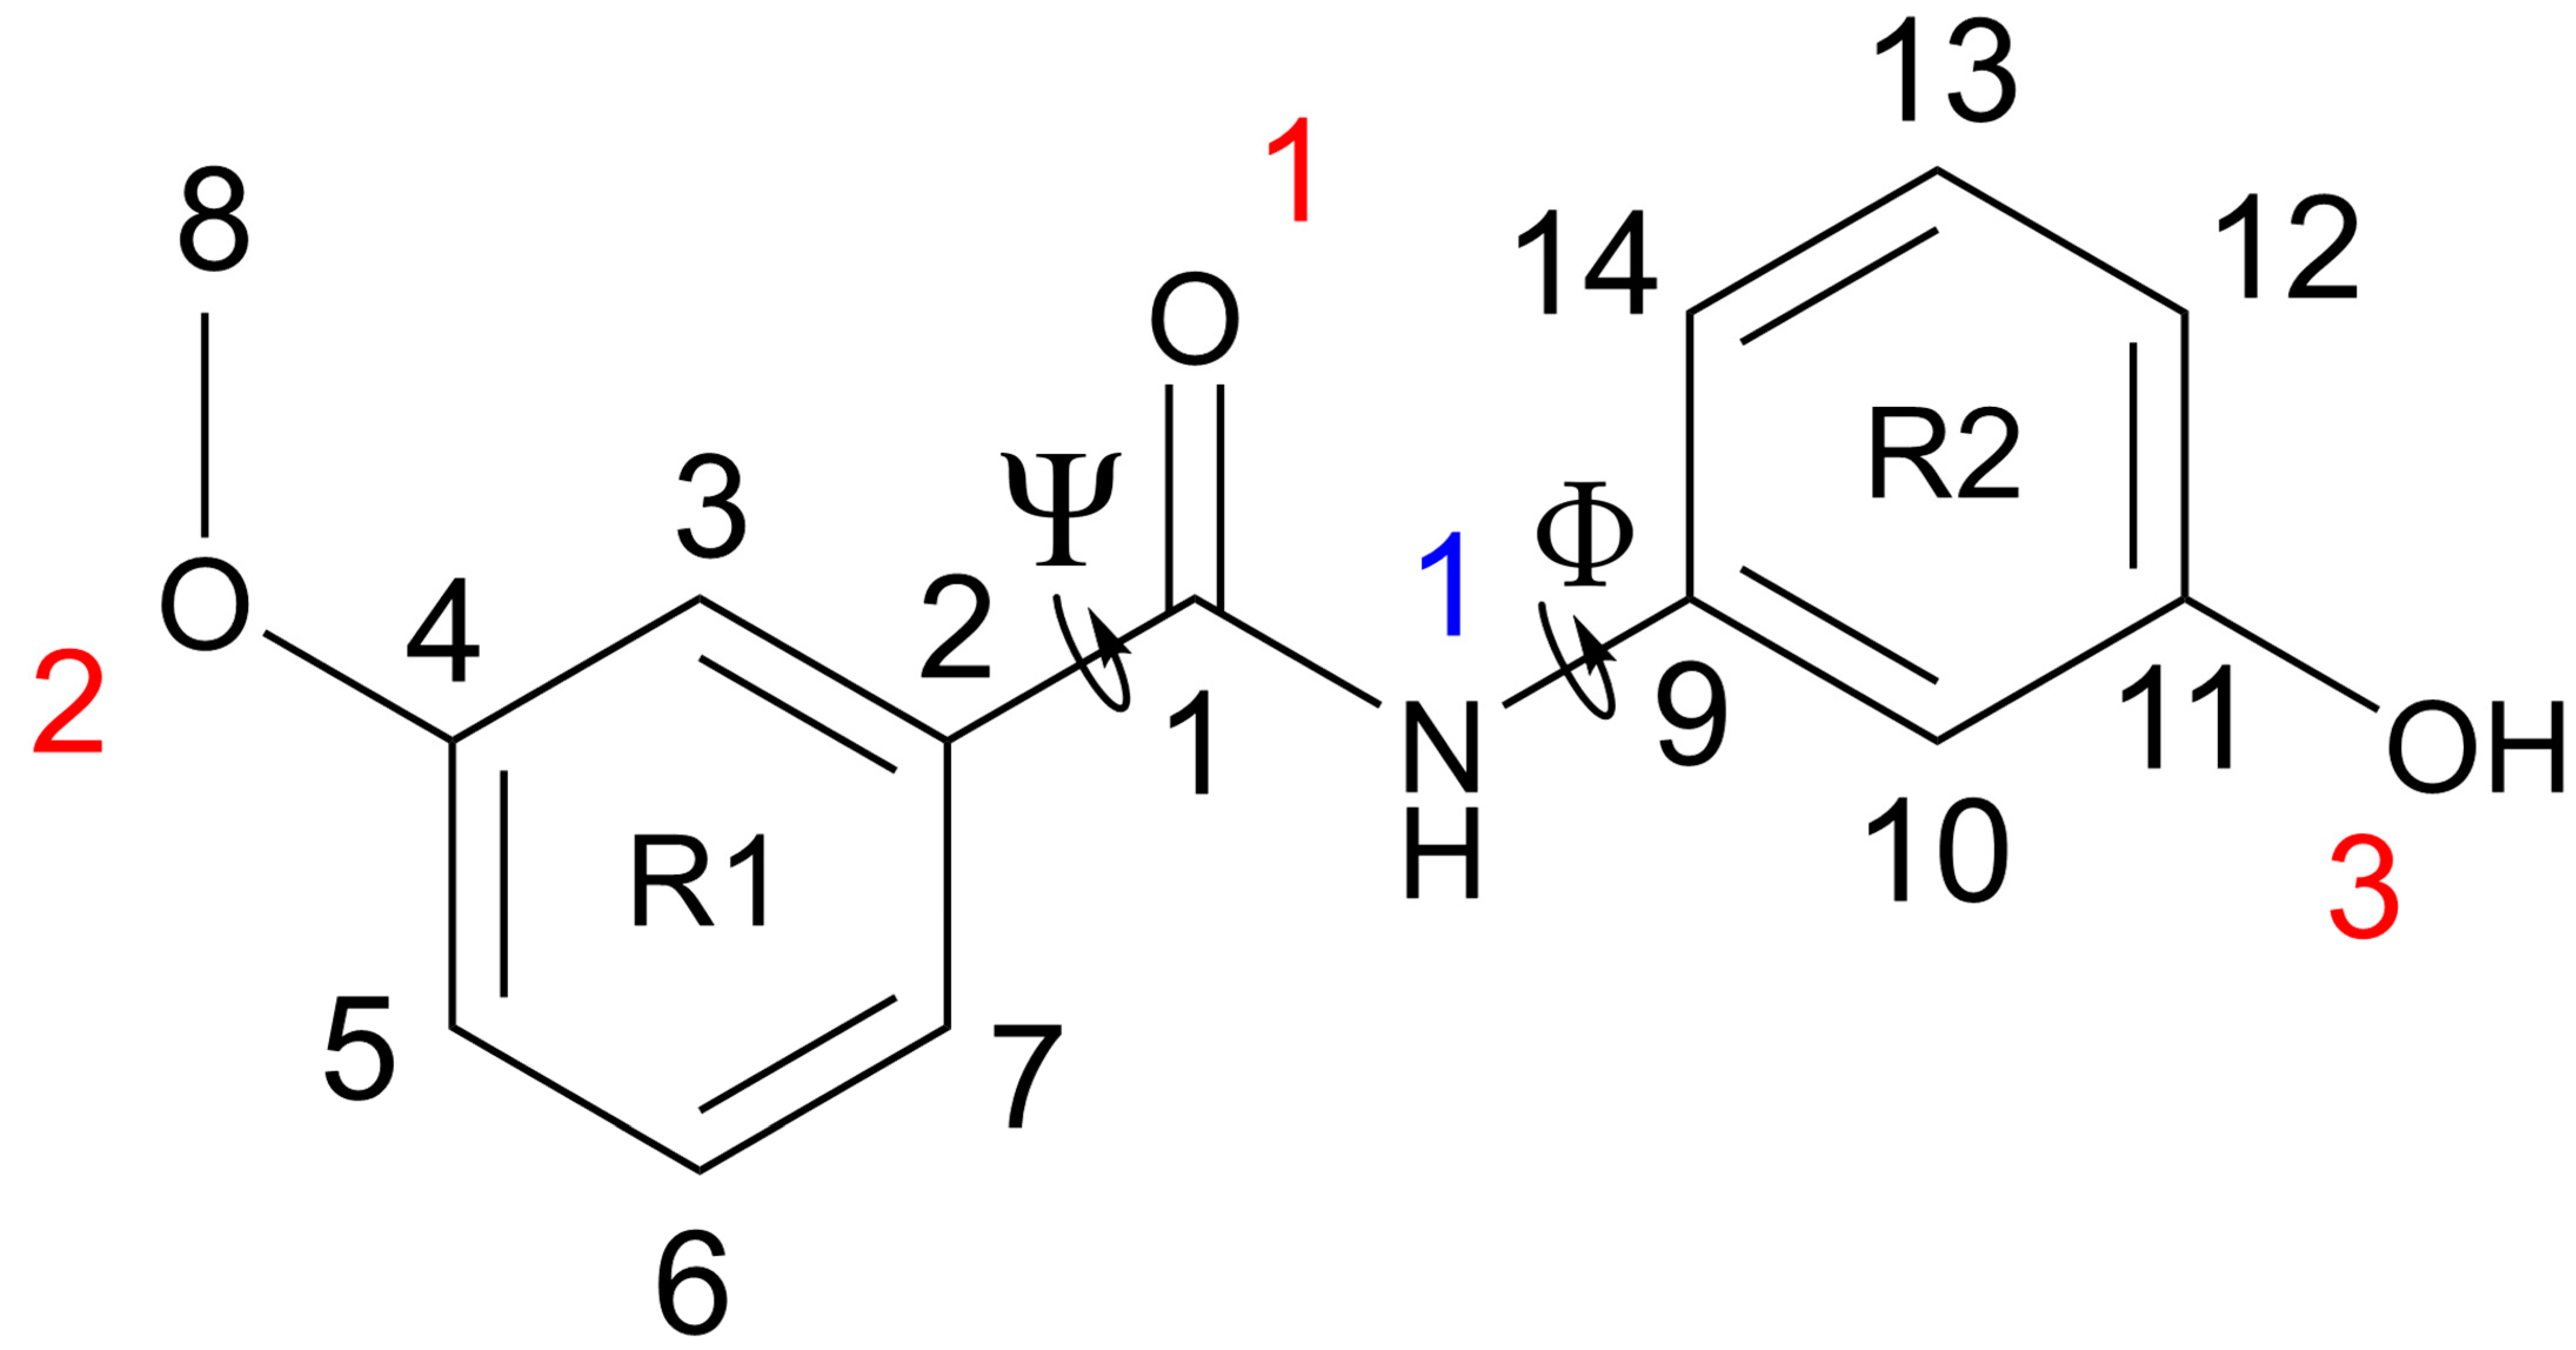
Polymorphism in N-(3-Hydroxyphenyl)-3-methoxybenzamide

 ,
,  ,
,  , and
, and
Abstract

1. Introduction
2. Experimental
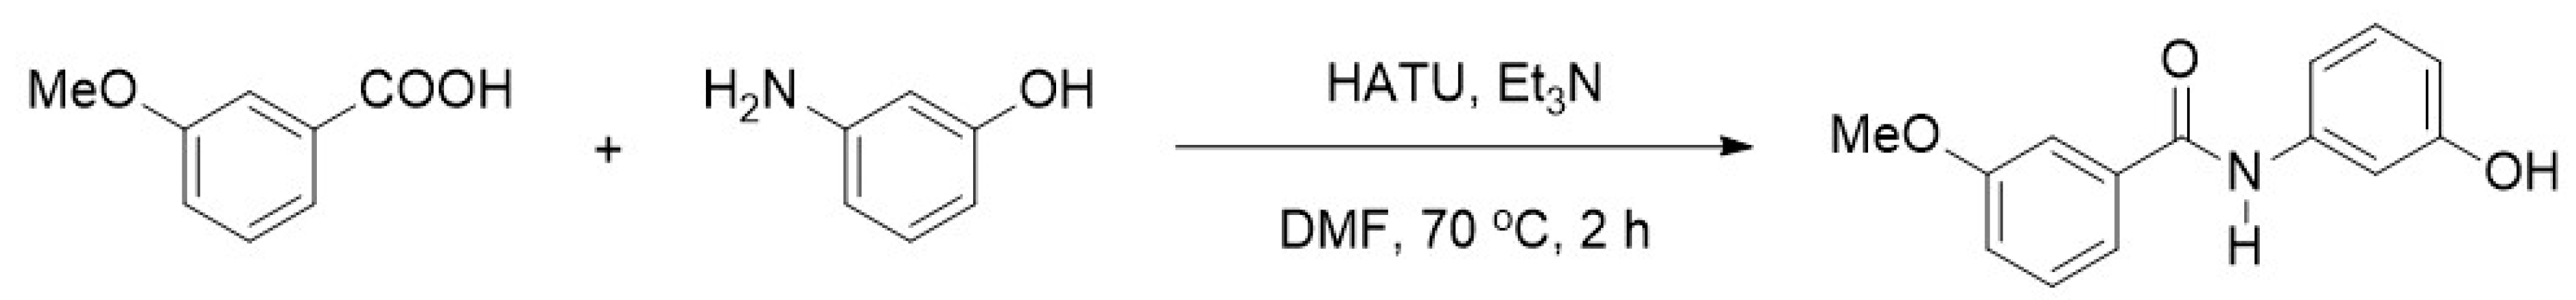
2.1. Synthesis
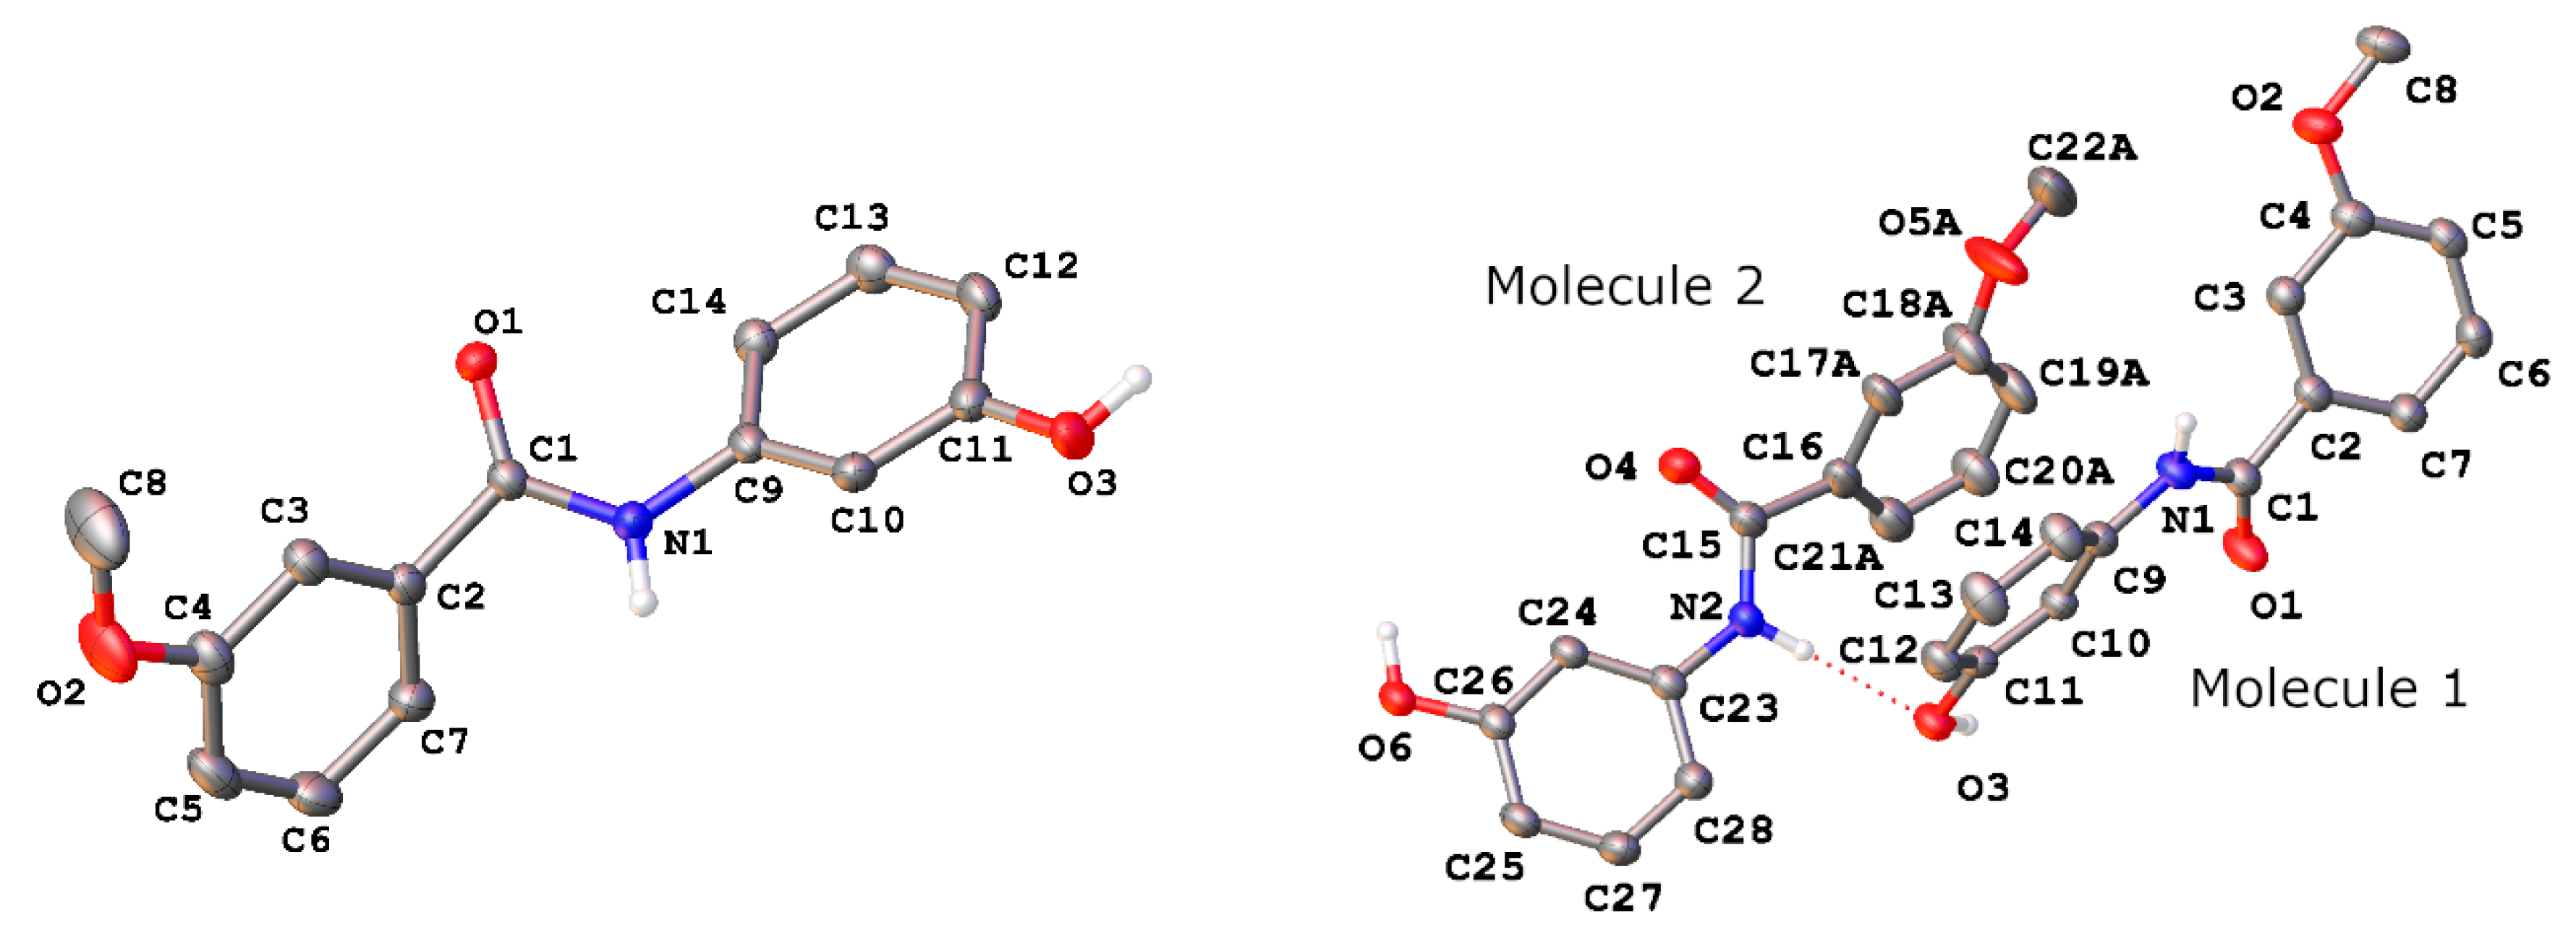
2.2. X-Ray Crystallography
2.3. Molecular Dynamics Simulations
2.4. Metadynamics
3. Results and Discussion
4. Conclusions
Supplementary Materials
Author Contributions
Funding
Data Availability Statement
Acknowledgments
Conflicts of Interest
References
- Murakami, K.; Sakamoto, K.; Nishimur, T. Enantioselective C–H alkylation of N-arylbenzamides with vinyl ethers catalyzed by an iridium/chiral phosphoramidite–olefin complex. Synthesis 2022, 54, 4753–4763. [Google Scholar]
- Urlam, M.K.; Pireddu, R.; Ge, Y.; Zhang, X.; Sun, Y.; Lawrence, H.R.; Guida, W.C.; Sebti, S.M.; Lawrence, N.J. Development of new N-arylbenzamides as STAT3 dimerization inhibitors. Med. Chem. Commun. 2013, 4, 932–941. [Google Scholar] [CrossRef] [PubMed]
- Caldarelli, A.; Minazzi, P.; Canonico, P.L.; Genazzani, A.A.; Giovenzana, G.B. N-Arylbenzamides: Extremely simple scaffolds for the development of novel estrogen receptor agonists. J. Enzym. Inhib. Med. Chem. 2013, 28, 148–152. [Google Scholar] [CrossRef] [PubMed]
- Islam, T.; Sarker, M.Z.I.; Uddin, A.B.M.H.; Rashid, S.S.; Bin, L.K. Evaluation of safe mixed solvents in N-phenylbenzamide synthesis for alteration of hazardous dipolar aprotic solvents in amide drug syntheses. Tetrahedron 2023, 131, 1332120. [Google Scholar] [CrossRef]
- Urban, B.; Szabo, P.; Sranko, D.; Safran, G.; Kollar, L.; Skoda-Folds, R. Double carbonylation of iodoarenes in the presence of reusable palladium catalysts immobilised on supported phosphonium ionic liquid phases. Mol. Catal. 2018, 445, 195–205. [Google Scholar] [CrossRef]
- Sharma, P.; Jain, N. Chemoselective Synthesis of N-arylbenzamides and benzoyloxyacetanilides from aryl isocyanides: Styrene as aryl and arylcarboxymethylene source. Adv. Synth. Catal. 2018, 360, 1932–1937. [Google Scholar] [CrossRef]
- Xu, T.; Alper, H. Pd-Catalyzed Chemoselective Carbonylation of Aminophenols with iodoarenes: Alkoxycarbonylation vs Aminocarbonylation. J. Am. Chem. Soc. 2014, 136, 16970–16973. [Google Scholar] [CrossRef]
- Cruz-Cabeza, A.J.; Feeder, N.; Davey, R.J. Open questions in organic crystal polymorphism. Commun. Chem. 2020, 3, 142. [Google Scholar] [CrossRef]
- Clark, R.C.; Reid, J.S. The analytical calculation of absorption in multifaceted crystals. Found. Crystallogr. 1995, 51, 887–897. [Google Scholar] [CrossRef]
- CrysAlisPro; Rigaku Oxford Diffraction, Tokyo, Japan. Available online: https://rigaku.com/products/crystallography/x-ray-diffraction/crysalispro (accessed on 9 December 2024).
- Sheldrick, G.M. Crystal structure refinement with SHELXL. Acta Crystallogr. Sect. C Struct. Chem. 2015, 71, 3–8. [Google Scholar] [CrossRef]
- Sheldrick, G.M. A short history of SHELX. Acta Crystallogr. Sect. A Found. Crystallogr. 2008, 64, 112–122. [Google Scholar] [CrossRef]
- Dolomanov, O.V.; Bourhis, L.J.; Gildea, R.J.; Howard, J.A.K.; Puschmann, H. OLEX2: A complete structure solution, refinement and analysis program. J. Appl. Cryst. 2009, 42, 339–341. [Google Scholar] [CrossRef]
- Berendsen, H.J.C.; van der Spoel, D.; van Drunen, R. GROMACS: A Message-Passing Parallel Molecular Dynamics Implementation. Comput. Phys. Commun. 1995, 91, 43–56. [Google Scholar] [CrossRef]
- Wang, J.; Wolf, R.M.; Caldwell, J.W.; Kollman, P.A.; Case, D.A. Development and testing of a general Amber force field. J. Comput. Chem. 2004, 25, 1157–1174. [Google Scholar] [CrossRef] [PubMed]
- Lindorff-Larsen, K.; Piana, S.; Palmo, K.; Maragakis, P.; Klepies, J.L.; Dror, R.O.; Shaw, D.E. Improved side-chain torsion potentials for the Amber ff99SB protein force field. Proteins Struct. Funct. Bioinform. 2010, 78, 1950–1958. [Google Scholar] [CrossRef]
- Jakalian, A.; Jack, D.B.; Bayly, C.I. Fast, efficient generation of high-quality atomic charges. AM1-BCC model: II. Parameterization and validation. J. Comput. Chem. 2002, 23, 1623–1641. [Google Scholar] [CrossRef] [PubMed]
- Silva, D.; Vranken, B.F. ACPYPE-AnteChamber PYthon Parser interfacE. BMC Res. Notes 2012, 5, 367. [Google Scholar]
- Jorgensen, W.L.; Chandrasekhar, J.; Madura, J.D.; Impey, R.W.; Klein, M.L. Comparison of simple potential functions for simulating liquid water. J. Chem. Phys. 1983, 79, 926–935. [Google Scholar] [CrossRef]
- Darden, T.; York, D.; Pedersen, L. Particle mesh Ewald: An N·log(N) method for Ewald sums in large systems. J. Chem. Phys. 1993, 98, 10089–10092. [Google Scholar] [CrossRef]
- Bussi, G.; Donadio, D.; Parrinello, M. Canonical sampling through velocity rescaling. J. Chem. Phys. 2007, 126, 014101. [Google Scholar] [CrossRef]
- Hess, B.; Bekker, H.; Berendsen, H.J.C.; Fraaije, J.G.E.M. LINCS: A Linear Constraint Solver for molecular simulations. J. Comput. Chem. 1997, 18, 1463–1472. [Google Scholar] [CrossRef]
- Parrinello, M.; Rahman, A. Polymorphic transitions in single crystals: A new molecular dynamics method. J. Appl. Phys. 1981, 52, 7182–7190. [Google Scholar] [CrossRef]
- Bonomi, M.; Branduardi, D.; Bussi, G.; Camilloni, C.; Provasi, D.; Raiteri, P.; Donadio, D.; Marinelli, F.; Pietrucci, F.; Broglia, R.A.; et al. PLUMED: A portable plugin for free-energy calculations with molecular dynamics. Comput. Phys. Commun. 2009, 180, 1961–1972. [Google Scholar] [CrossRef]
- d’Agostino, S.; Braga, D.; Grepioni, F.; Taddei, P. Intriguing Case of Pseudo-Isomorphism between Chiral and Racemic Crystals of rac-and (S)/(R)2-(1,8-Naphthalimido)-2-quinuclidin-3-yl, and Their Reactivity Toward I2 and Br2. Cryst. Growth Des. 2014, 14, 821–829. [Google Scholar] [CrossRef]
- Potter, Z.E.; Hill, M.; Sellars, J.D.; Waddell, P.G. A New Polymorph of tert-Butyl (2-Aminophenyl)Carbamate. J. Chem. Cryst. 2024, 54, 285–290. [Google Scholar] [CrossRef]
- Etter, M.C. Encoding and Decoding Hydrogen-Bond Patterns of Organic Compounds. Acc. Chem. Res. 1990, 23, 121–126. [Google Scholar] [CrossRef]
- Brock, C.P. High-Z′ structures of organic molecules: Their diversity and organizing principles. Acta Crystallogr. Sect. B Struct. Sci. Cryst. Eng. Mater. 2016, 72, 807–821. [Google Scholar] [CrossRef]
- Brock, C.P. Pseudosymmetric layers in high-Z′ and P1 structures of organic molecules. CrystEngComm 2020, 22, 7371–7379. [Google Scholar] [CrossRef]
- Brock, C.P. Pervasive approximate periodic symmetry in organic P1 structures. Acta Crystallogr. Sect. B Struct. Sci. Cryst. Eng. Mater. 2022, 78, 576–588. [Google Scholar] [CrossRef]
- Avasthi, K.; Shukla, L.; Kant, R.; Pavikumar, K. Folded conformations due to arene interactions in dissymmetric and symmetric butylidene-linker models based on pyrazolo[3,4-d]pyrimidine, purine and 7-deazapurine. Acta Crystallogr. Sect. C Struct. Chem. 2014, 70, 555–561. [Google Scholar] [CrossRef]
- Steed, K.M.; Steed, J.W. Packing Problems: High Z′ Crystal Structures and Their Relationship to Cocrystals, Inclusion Compounds, and Polymorphism. Chem. Rev. 2015, 115, 2895–2933. [Google Scholar] [CrossRef] [PubMed]


| Polymorph I | Polymorph II | |
|---|---|---|
| Empirical formula | C14H13NO3 | C14H13NO3 |
| Formula weight | 243.25 | 243.25 |
| Temperature/K | 150.0(2) | 150.0(2) |
| Crystal system | Orthorhombic | Triclinic |
| Space group | Pna21 | P-1 |
| a/Å | 8.73890(10) | 9.0055(4) |
| b/Å | 12.1817(2) | 11.8889(5) |
| c/Å | 11.6805(2) | 12.4615(3) |
| α/° | 90 | 75.317(3) |
| β/° | 90 | 73.306(3) |
| γ/° | 90 | 71.143(4) |
| Volume/Å3 | 1243.44(3) | 1190.23(9) |
| Z | 4 | 4 |
| ρcalcg/cm3 | 1.299 | 1.357 |
| μ/mm−1 | 0.757 | 0.790 |
| F(000) | 512.0 | 512.0 |
| Crystal size/mm3 | 0.14 × 0.12 × 0.10 | 0.19 × 0.10 × 0.03 |
| Radiation | CuKα (λ = 1.54184) | CuKα (λ = 1.54184) |
| 2Θ range for data collection/° | 10.492 to 154.536 | 7.526 to 154.482 |
| Index ranges | −10 ≤ h ≤ 10, −14 ≤ k ≤ 14, −13 ≤ l ≤ 14 | −11 ≤ h ≤ 11, −12 ≤ k ≤ 14, −14 ≤ l ≤ 15 |
| Reflections collected | 11,271 | 22,322 |
| Independent reflections | 2328 [Rint = 0.0349, Rsigma = 0.0237] | 4748 [Rint = 0.0286, Rsigma = 0.0234] |
| Data/restraints/parameters | 2328/1/171 | 4748/532/403 |
| Goodness-of-fit on F2 | 1.033 | 1.043 |
| Final R indexes [I ≥ 2σ (I)] | R1 = 0.0275, wR2 = 0.0712 | R1 = 0.0395, wR2 = 0.1020 |
| Final R indexes [all data] | R1 = 0.0281, wR2 = 0.0718 | R1 = 0.0456, wR2 = 0.1068 |
| Largest diff. peak/hole/e Å−3 | 0.17/−0.14 | 0.35/−0.27 |
| Flack parameter | −0.19(11) | n/a |
| H-A/Å | D-A/Å | D-H···A/° | |
|---|---|---|---|
| Polymorph I | |||
| O3-H3···O1 1 | 1.86(3) | 2.728(2) | 170(3) |
| N1-H1···O1 2 | 2.13(3) | 2.965(2) | 167(2) |
| Polymorph II | |||
| O3-H3···O1 3 | 1.721(18) | 2.6405(14) | 171.9(15) |
| O6-H6···O4 4 | 1.759(19) | 2.6627(14) | 177.6(16) |
| N1-H1···O6 5 | 2.238(17) | 3.0845(15) | 163.0(14) |
| N2-H2···O3 | 2.016(18) | 2.8731(15) | 164.4(15) |
| C13-H13···Mol. 1(R1centroid) 4 | 2.8810(7) | 3.593(2) | 132.62(9) |
| C28-H28···Mol. 1(R2centroid) 5 | 3.4542(6) | 4.2202(13) | 139.31(9) |
Disclaimer/Publisher’s Note: The statements, opinions and data contained in all publications are solely those of the individual author(s) and contributor(s) and not of MDPI and/or the editor(s). MDPI and/or the editor(s) disclaim responsibility for any injury to people or property resulting from any ideas, methods, instructions or products referred to in the content. |
© 2024 by the authors. Licensee MDPI, Basel, Switzerland. This article is an open access article distributed under the terms and conditions of the Creative Commons Attribution (CC BY) license (https://creativecommons.org/licenses/by/4.0/).
Share and Cite
Al-Rawe, S.K.; Baranov, D.; Bronowska, A.K.; Cano, C.; Carroll, M.A.; Waddell, P.G. Polymorphism in N-(3-Hydroxyphenyl)-3-methoxybenzamide. Crystals 2024, 14, 1070. https://doi.org/10.3390/cryst14121070
Al-Rawe SK, Baranov D, Bronowska AK, Cano C, Carroll MA, Waddell PG. Polymorphism in N-(3-Hydroxyphenyl)-3-methoxybenzamide. Crystals. 2024; 14(12):1070. https://doi.org/10.3390/cryst14121070
Chicago/Turabian StyleAl-Rawe, Sumaya K., Daniil Baranov, Agnieszka K. Bronowska, Celine Cano, Michael A. Carroll, and Paul G. Waddell. 2024. "Polymorphism in N-(3-Hydroxyphenyl)-3-methoxybenzamide" Crystals 14, no. 12: 1070. https://doi.org/10.3390/cryst14121070
APA StyleAl-Rawe, S. K., Baranov, D., Bronowska, A. K., Cano, C., Carroll, M. A., & Waddell, P. G. (2024). Polymorphism in N-(3-Hydroxyphenyl)-3-methoxybenzamide. Crystals, 14(12), 1070. https://doi.org/10.3390/cryst14121070