Article

High-Pressure Gas Adsorption on Covalent Organic Framework CTF-1

by
Gregory S. Deyko
1,
Valery N. Zakharov
2,
Lev M. Glukhov
1,
Dmitry O. Charkin
2,
Dmitry Yu. Kultin
2,
Vladimir V. Chernyshev
2,3,
Leonid A. Aslanov
2 and
Leonid M. Kustov
1,2,*
1
N.D. Zelinsky Institute of Organic Chemistry, Russian Academy of Sciences, Leninsky Prospect 47, 119991 Moscow, Russia
2
Chemistry Department, Moscow State University, Leninskie Gory 1, bldg. 3, 119992 Moscow, Russia
3
A.N. Frumkin Institute of Physical Chemistry and Electrochemistry, Russian Academy of Sciences, Leninsky Prospect 29, 119991 Moscow, Russia
*
Author to whom correspondence should be addressed.
Crystals 2024, 14(12), 1066; https://doi.org/10.3390/cryst14121066
Submission received: 14 November 2024 / Revised: 3 December 2024 / Accepted: 5 December 2024 / Published: 10 December 2024
(This article belongs to the Section Macromolecular Crystals)

Abstract

:
Triazine-based covalent organic framework CTF-1 was synthesized via polymerization of 1,4-dicyanobenzene in the presence of zinc chloride. Two different methods of the post-synthesis treatment of the obtained material were compared. It was demonstrated that ultrasonication effectively removes impurities from CTF-1. Adsorption of hydrocarbon gases (methane and ethane) and carbon dioxide was measured at 298 K in a wide pressure range for the first time. Ideal selectivity and IAST values for methane/ethane and methane/CO2 pairs were calculated from the obtained isotherms.

1. Introduction

Metal–organic frameworks (MOFs) and their completely organic analogs—covalent organic frameworks (COFs)—are a new class of highly tunable porous materials. MOFs consist of a polyfunctional organic linker (e.g., terephthalic or trimesic acid) and a metal node (e.g., Cu2+ or Ni2+). Their framework is formed by ionic bonds between the metal and linker, whereas the framework of COFs is formed entirely from organic building blocks connected via covalent bonds. In both cases, adjustment of the structure of the starting molecules (e.g., via introducing new functional groups) in principle leads to an infinite number of possible COF structures and thus allows one to synthesize a framework with properties necessary for a specific task [1]. The building blocks in COFs are, however, directly connected providing the topology with permanent porosity. In the past 25 years, a wide range of MOF (>70,000 known unique structures) [2] and COF (>600 unique frameworks) [3] materials were synthesized with a wide array of unique properties.
Triazine-based COFs (designated as CTFs in the literature) were first obtained in 2008 by Kuhn [4] via polymerization of various aromatic dinitriles (e.g., 1,4-dicyanobenzene) in the presence of an excessive amount of molten zinc chloride. In these reactions, zinc chloride melt simultaneously acts as a solvent and a catalyst. Recent advances in the synthesis of CTF structures were reported [5,6]. In principle, an infinite number of CTF-like structures can be constructed by connecting various rigid aromatic moieties (e.g., benzene, carbazole, biphenyl, etc.) with triazine rings [5]. Noteworthy, variety of synthesis strategies besides the original Kuhn’s approach of polymerization of dicyano compounds were proposed: super-acid catalyzed synthesis, aromatic amide condensation, Friedel–Crafts reaction, and so on. The CTF-1 material itself possesses a rather broad range of textural properties—the specific surface areas is in the range of 500–2000 m2/g [7] with a pore volume of 0.5–1 cm3/g and pore size of around 1 nm. According to [7], such a broad range of textural property variation could be attributed to different carbonization degrees of CTF-1 samples. So, under mild polymerization conditions (e.g., in the presence of P2O5 instead of molten ZnCl2), one could obtain the product with a lower carbonization degree compared to the sample obtained by the original method (450 °C, zinc chloride melt). It should be also noted that in case of synthesis with ZnCl2, its traces in the obtained material could also affect the resulting surface area. For example, the CTF-1 sample obtained in [4] contained ca. 5% of zinc according to the mass of the residual solids after the TGA experiment in the atmosphere of oxygen. One could assume that the decrease in the zinc content would also lead to an improvement in textural properties.
A lot of interest is currently dedicated to the natural gas and biogas separation process. Biogas consists of a roughly 1:1 mixture of methane and CO2. Natural gas consists mainly of methane (up to 95%), ethane (1–10%), propane (1–5%), carbon dioxide (around 1–2%), and inert gases (mainly He). The exact composition of natural gas depends on its natural origin [8,9]. Ethane is a particularly valuable component of natural gas as it can be directly converted into ethylene, which is a major feedstock in the polymer industry. At present, natural gas separation in industry is usually performed via cryogenic processes. However, such processes are not energy and cost effective [10]. Thus, the main challenge at present is to develop alternative more cost-effective strategies for natural gas separation. One of the main alternative methods is the use of solid adsorbents, which allows the separation process to be carried out at near-ambient temperatures and at moderately high pressures (5–10 bar). Moreover, adsorption is more preferred due to higher separation coefficient in terms of methane/ethane ratios. Many classes of materials are explored in the methane/ethane separation processes. These adsorbents include activated carbons [11], zeolites [12], MOFs [13], mesoporous silicas [14], and organic polymers [15]. However, COFs which are similar to MOFs in terms of adsorption efficiency for some processes (i.e., carbon dioxide/methane separation) are rather unexplored in methane/ethane separation. Furthermore, unlike many MOF materials, COFs are more thermally stable.
To date, there are very limited data on the efficiency of COF structures for separating hydrocarbons [16]. For example, a family of mesoporous (500–1000 m2/g and 10–100 Å pore radius) COFs (mesoPOF-1, 2 or 3) synthesized using cetylpyridinium bromide as a template demonstrate rather high IAST selectivity values for the separation of methane/ethane at 1 bar and 273 K (35:1 for the equimolar ethane/methane mixture for mesoPOF-1) [17]. Microporous COFs (e.g., MCOF family) also show potential for C2H6/CH4 separation. For instance, 3D MCOF-1 (874 m2/g, 6.4 Å pore radius) demonstrates a very high IAST selectivity value for an equimolar mixture of C2H6/CH4 (1000:1 at 298 K and 1 bar), which is explained by the pore size limitation factor for competitive adsorption of CH4 in the presence of C2H6 or C3H8 [18]. Such a value is comparable to the known values for MOFs (e.g., HKUST-1 [19] and SBMOF-2 [20]) in the literature. It should be noted that adsorption data for methane or ethane at higher pressures are not known for most COF materials. However, it seems that the computational study of COF performance in hydrocarbon gas separation is more widely explored in the literature compared to the experimental data on methane and ethane adsorption [21,22,23,24].
Thus, taking into account the lack of experimental data on methane and ethane adsorption on COFs, the aim of this work is to study the adsorption of methane, ethane, and CO2 on CTF-1 in a wide pressure range, assess the impact of zinc impurities on the adsorption properties, and calculate the selectivity parameters from the experimental adsorption isotherms.

2. Materials and Methods

2.1. Materials

The reagents used to prepare CTF-1, i.e., 1,4-dicyanobenzene (DCB, purity 99%), zinc chloride (98%), and ethanol rectified (96%), were all purchased from Sigma Aldrich. Solvents and reagents were purified according to standard procedures [25].

2.2. Instruments

Hygroscopic compounds were handled in a SPECS GBVK sealed vacuum glove box (Russia) with a control unit and one gateway; the pressure during pumping was 10−2 Torr.
The synthesized CTF-1 samples were ultrasonicated using a UZDN-A ultrasonic generator (Russia). Precipitates were separated with a Multi Centrifuge CM 6 M (Elmi Ltd., Riga, Latvia) at 3500 rpm.
Elemental analysis was conducted using a CE1106 CHN analyzer (Carlo Erba, Milano, Italy).
X-ray powder diffraction patterns of the CTF-1 samples were recorded in the 2θ angle range of 3–40° at room temperature on the EMPYREAN diffractometer equipped with an X’celerator linear detector using Ni-filtered CuKα radiation.
Nitrogen adsorption isotherms were measured using a Micromeritics Gemini VII 2390 surface area analyzer (Micromeritics, Norcross, GA, USA). All samples were degassed at 120 °C for 8 h before analysis.
Methane, ethane, and carbon dioxide adsorption was measured using the classical Sieverts method; the setup and the experiment are described in detail elsewhere [19].
Infrared (IR) spectra of samples were recorded using a Tensor 27 Fourier transform infrared (FTIR) spectrometer (Bruker, Billerica, MA, USA) in the attenuated total reflection (ATR) mode with a resolution of 1 cm−1 and signal averaging over 32 scans.
The crystal size was estimated by scanning electron microscopy on a SEM-69-LV electron microscope from BioOptik (New Taipei City, Taiwan) with an accelerating voltage of 30 kV. A layer of gold was applied to the sample using vacuum plasma discharge deposition. The holder with the deposited sample was placed in the working chamber of the microscope. Images were taken after vacuuming the working chamber in automatic mode in accordance with the algorithm of the device software. Processing was performed in the AztecLiveOne version 6 program.

2.3. CTF-1 Synthesis

The CTF-1 and CTF-1us samples were synthesized by the catalyzed ionothermal cyclotrimerization method using molten ZnCl2. 1,4-Dicyanobenzene (5 g, 39.0 mmol) and ZnCl2 (5 g, 36.7 mmol) were thoroughly mixed in a mortar in an argon-filled glovebox. Then, the resulting mixture was loaded into a quartz glass ampoule (i.d. 20 mm; length 200 mm). The ampoule was previously dried at 200 °C for 1 h. The ampoule was evacuated to a residual pressure of 2.5 × 10⁻² Torr for 20 min, sealed, and then heated in a vertical muffle furnace to 400 °C at a heating rate of 2°C/min and maintained at 400 °C for 40 h. After that, the ampoule was cooled to room temperature and carefully opened under a fume hood using a diamond cutter. The resulting monolith-like black substance was ground in a porcelain cup and then consequentially treated with 0.5 M hydrochloric acid (40 mL), distilled water (2 × 40 mL), and ethanol (2 × 40 mL) for 15 h, respectively. The sample CTF-1us was additionally ultrasonicated in water (4 × 10 min) to enhance the zinc chloride removal. The resulting black powder was dried at 130 °C under a vacuum for 5 h. The reaction yield was 86% based on the initial DCB weight.

2.4. Adsorption Studies

Adsorption values were calculated using high-precision empirical equations of state for all studied gases. For hydrocarbon gases, the models were taken from [26,27], whereas for carbon dioxide, the Span–Wagner equation of state was used [28]. More details about adsorption experiments and the scheme of the experimental setup are presented in the Supplementary Information (Figure S1).
IAST selectivity values for ethane/methane and carbon dioxide/methane pairs were calculated using the Ideal Adsorbed Solution Theory (IAST) according to [29,30]. The calculations were performed for a mixture of methane with 10 mol. % of ethane ( y C 2 H 6 = 0.1 and y C H 4 = 0.9) and, similarly, for a mixture of methane with 10 mol. % of carbon dioxide ( y C O 2 = 0.1 and y C H 4 = 0.9).
The ideal selectivity for the C2H6/CH4 and CO2/CH4 pairs was determined as
S i d e a l P , T = a g a s P , T a C H 4 P , T
where a g a s ( P , T ) and a C H 4 ( P , T ) are adsorption values obtained from experimental isotherms using B-spline interpolation.

3. Results and Discussion

3.1. Composition of CTF-1

The CTF-1 preparation method including the post-synthesis treatment procedure was taken from the original work of Kuhn et al. [4]. As was previously mentioned, the obtained sample of CTF-1 described in [4] contained around 5% of zinc chloride, which the authors were not able to remove even by a prolonged washing. Hence, to solve this problem, we decided to employ an additional ultrasound treatment (sample CTF-1us) to compare the adsorption properties of these samples.
The elemental analysis data for both samples are presented in Table 1. The chemical composition of the CTF-1us sample washed under ultrasonication is closer to the calculated values for the «ideal» C8N2H4 composition than the composition of the sample prepared by the original method.
The difference in the nitrogen content can be apparently explained by the hydrolysis of non-polymerized nitrile groups on the periphery of CTF-1 layers during washing with water and dilute hydrochloric acid, which was added to prevent hydrolysis of zinc chloride. Hydrolysis of the nitrile groups resulted in the formation of carboxyl groups and ammonium ions, which leads to a slight decrease in the nitrogen content and raised the fraction of hydrogen and oxygen. The greater difference in the carbon content in CTF-1 and CTF-1us compared to an “ideal” CTF-1 is explained by the possible presence of zinc chloride residues in both samples. The CTF-1 sample has an even greater carbon content difference, which could be attributed to the higher residual zinc chloride content. This discrepancy in elemental analysis data due to the presence of impurity elements other than CHN designated in [31] as “residual mass” (see the last column of Table 1) is apparent between the obtained samples. So, the CTF-1us sample has much less impurities of the other elements (Zn, O, and Cl) than the CTF-1 sample. Noteworthy, the “residual mass” for the CTF-1us sample obtained in this work (4.26%) is very close to the value (4.23%) reported in [31].

3.2. Characterization of CTF-1

Both powder patterns (Figure 1) correspond well to the XRD powder pattern of CTF-1 presented by Kuhn and coauthors in 2008 [4]. In spite of poor crystallinity of the samples, the Pawley [32] fit with the program MRIA [33] in the space group P6/mmm allowed us to obtain approximate values of the hexagonal unit cell parameters (Table 2) and the calculated positions of the main peaks (Table 3) for each sample.
The CTF-1 crystallites are formed by polymer layers superimposed on each other according to the AA law. The intensity of the (001) reflection in the XRD pattern of the ultrasonicated sample is significantly greater than the intensity of the same reflection for the other sample, which indicates a greater ordering of the atoms inside the layer in the sample washed with ultrasonication. Distortions in the flatness of the polymer layers can be created by some impurity (zinc compounds or oligomers) particles located between the layers, generating convexities (or concavities) of the layers. The atoms of the polymer layers located on these convexities do not participate in the coherent scattering of X-rays, which leads to the same result when the crystallite volume decreases: the reflection intensity drops.
Both samples show nearly identical FTIR spectra (see Figure S2), and the obtained data are in good correspondence with the spectra provided in the literature [34]. The peak attribution for the CTF-1 sample is presented in Table S1. When comparing the obtained IR spectral data of the sample CTF-1 (Figure S2) with the initially used DCB (Figure S3), it is evident that the corresponding triazine ring (mainly, the bands at 1347 and 1405 cm−1, which are also present in the spectrum of 1,3,5-triazine, as can be seen in the spectra presented in Figure S4) was formed in the obtained compound, which indicates the formation of a stable framework.
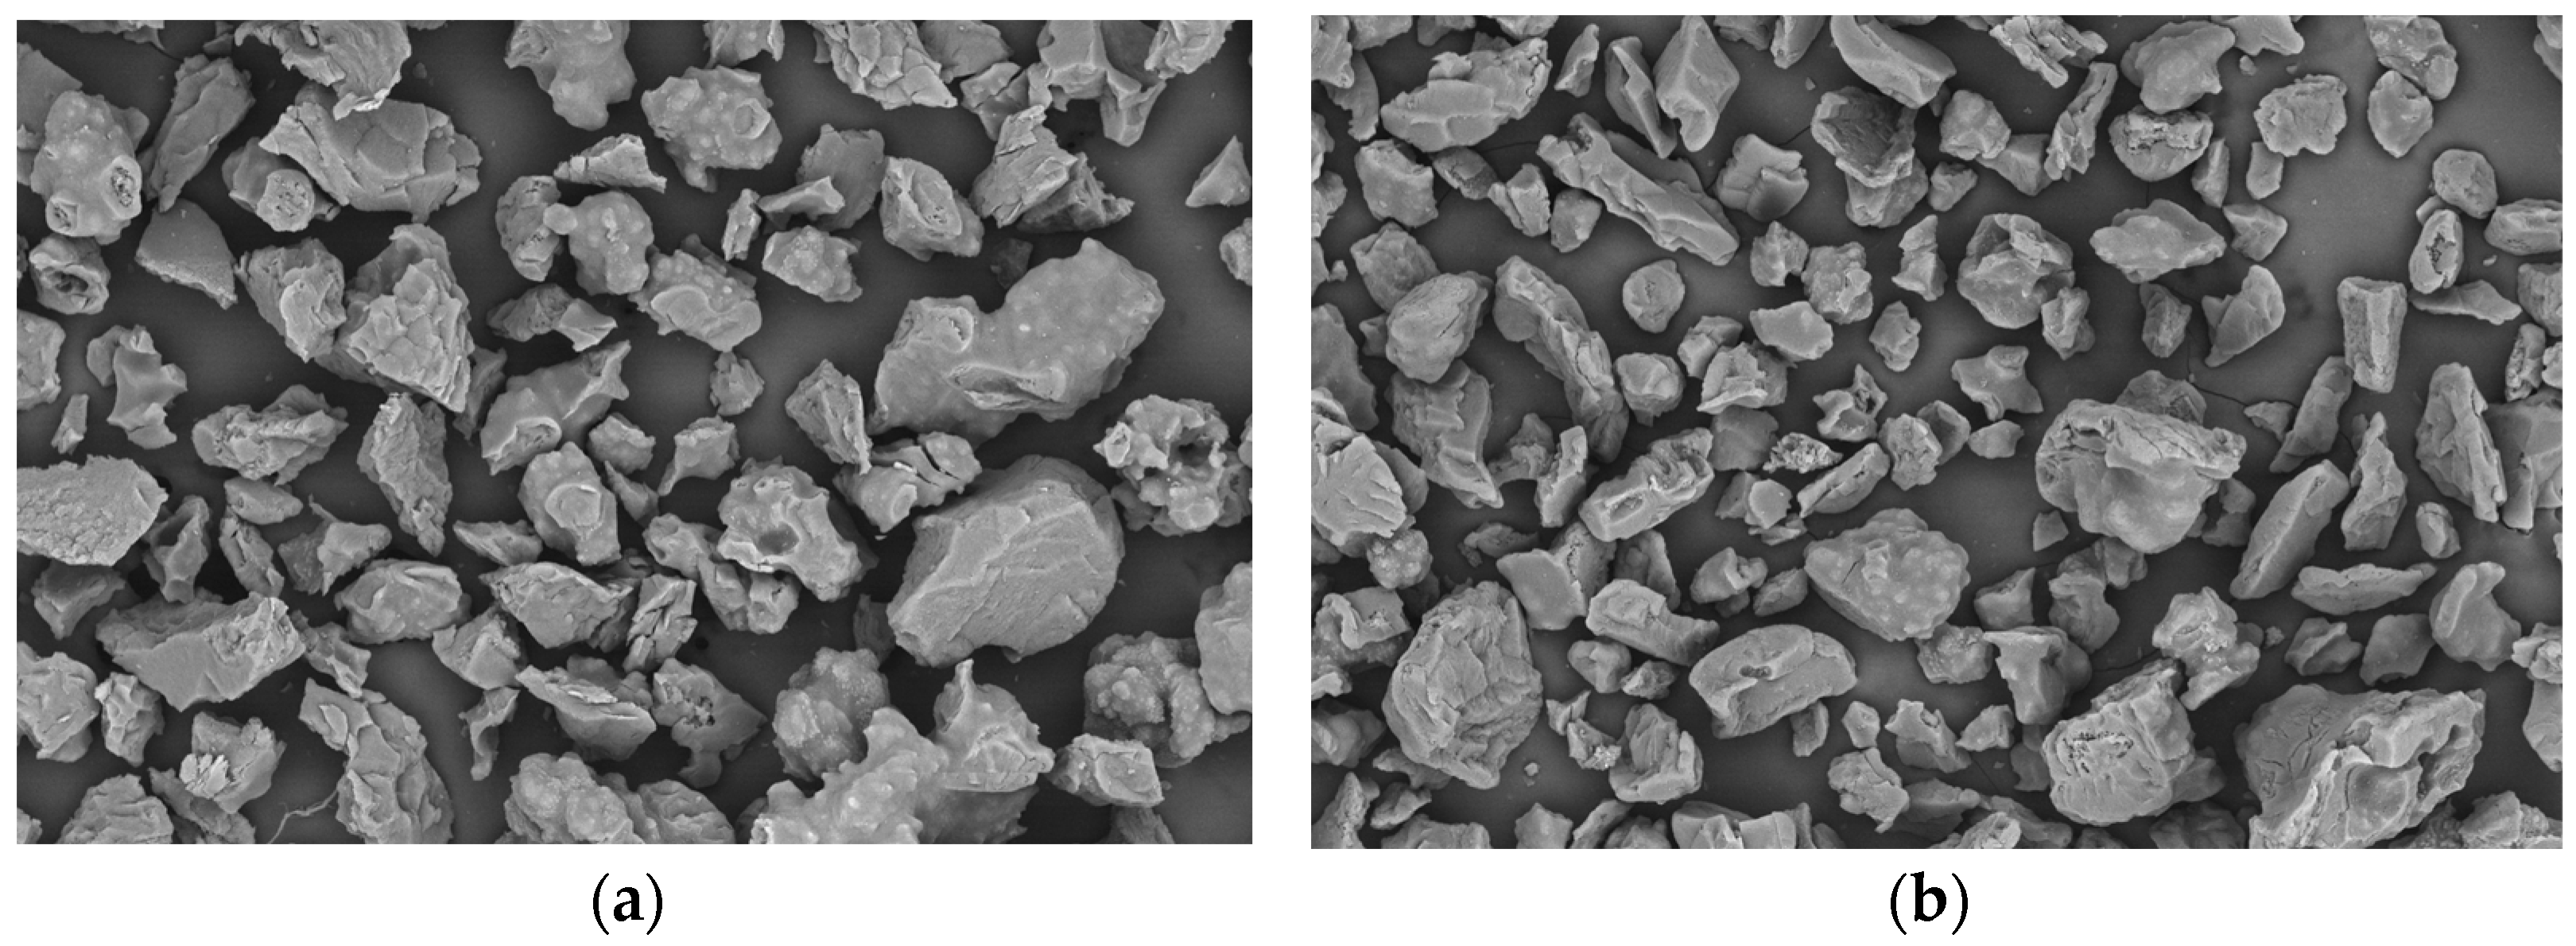
According to the obtained SEM data (Figure 2), both samples are almost identical and consist of particles of irregular shape with some degree of a laminated structure with an average size of 25–150 μm.
Apparently, the presence of zinc chloride in the sample not treated with ultrasound is indicated by the lower surface area (SBET = 451 m2/g) compared to the specific surface area (SBET = 550 m2/g) of the sample washed with ultrasonication. Both samples are also purely microporous without any mesopores according to BJH calculations (Table 4).

3.3. Adsorption on CTF-1

All adsorption isotherms for CH4, C2H6, or CO2 measured on the obtained CTF-1 and CTF-1us samples exhibit type I shapes according to the IUPAC classification (Figure 3). Noteworthy, the adsorption of carbon dioxide and methane at elevated pressures (2–30 atm) and the adsorption of ethane was measured in this work on a CTF-1 material for the first time.
It was found that the CTF-1us sample shows a ~10% higher adsorption capacity for hydrocarbons (CH4 and C2H6) and around a 20% higher adsorption value for CO2. This correlates well with their specific surface area values, where the CTF-1us sample exhibits a 20% higher value (550 m2/g vs. 450 m2/g for the CTF-1 sample). Apparently, the removal of zinc chloride via additional washing with ultrasonication greatly enhances the adsorption properties of CTF-1. Noteworthy, the obtained CTF-1us sample with the surface area of 550 m2/g demonstrates comparable adsorption values for methane and carbon dioxide (1 bar; 298 K) to the values of the reported CTF-1 material with a greater surface area (850 m2/g) [31]. The obtained methane adsorption value (0.35 mmol/g at 298 K and 1 bar) for the CTF-1us sample is close to the values found for the other known COFs (for example, at 298 K and 1 bar, MCOF-1 adsorbs 0.4 mmol/g [18]; sPI-M-H polyimide COF adsorbs 0.3 mmol/g [35] of methane). The same trend is observed for ethane adsorption: the CTF-1us sample demonstrates a higher ethane adsorption (1.71 mmol/g) than sPI-M-H COF (1.35 mmol/g), but a lower value than MCOF-1 (1.96 mmol/g) at 298 K. The obtained carbon dioxide adsorption values for CTF-1us (6.55 mmol/g at 35 bar and 298 K; 1.32 mmol/g at 1 bar and 298 K) are comparable to the values observed for the known boron-based COFs (e.g., COF-1: 4.77 mmol/g [36] and COF-6: 6.77 mmol/g [36] at 35 bar and 298 K) and to other known triazine COFs (CTF-1—1.33 mmol/g [37]; cCTF-400—1.85 mmol/g [38]).
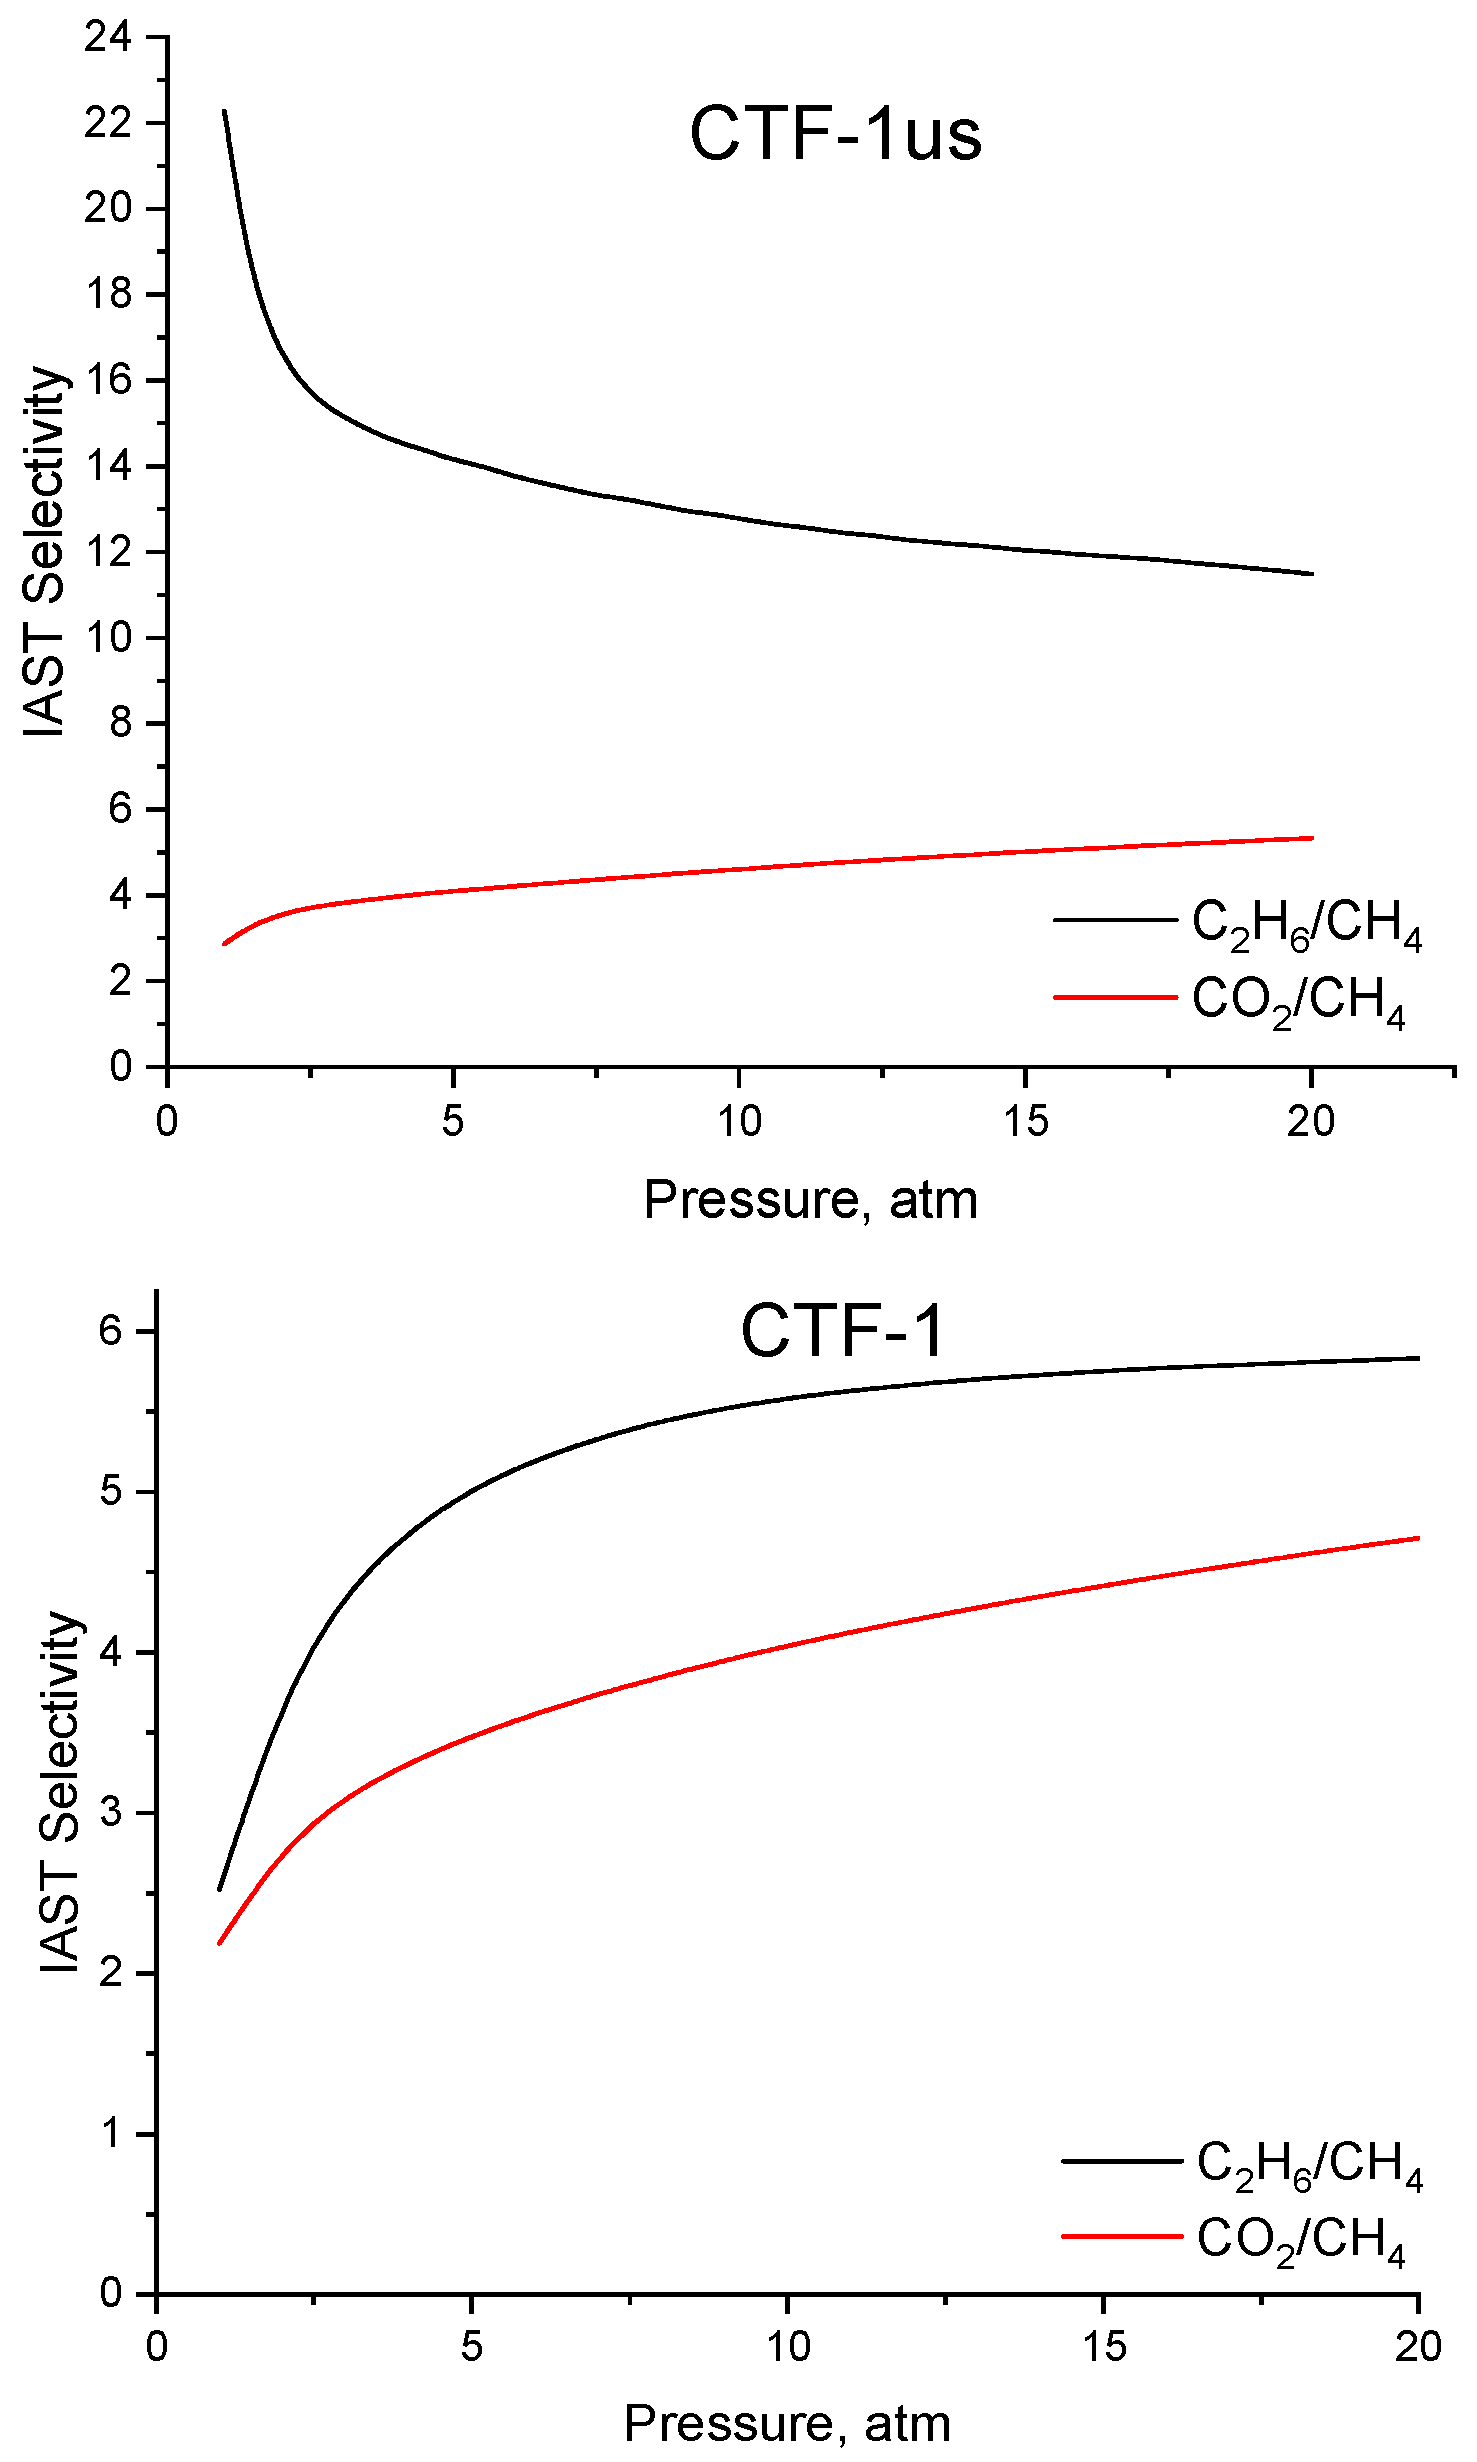
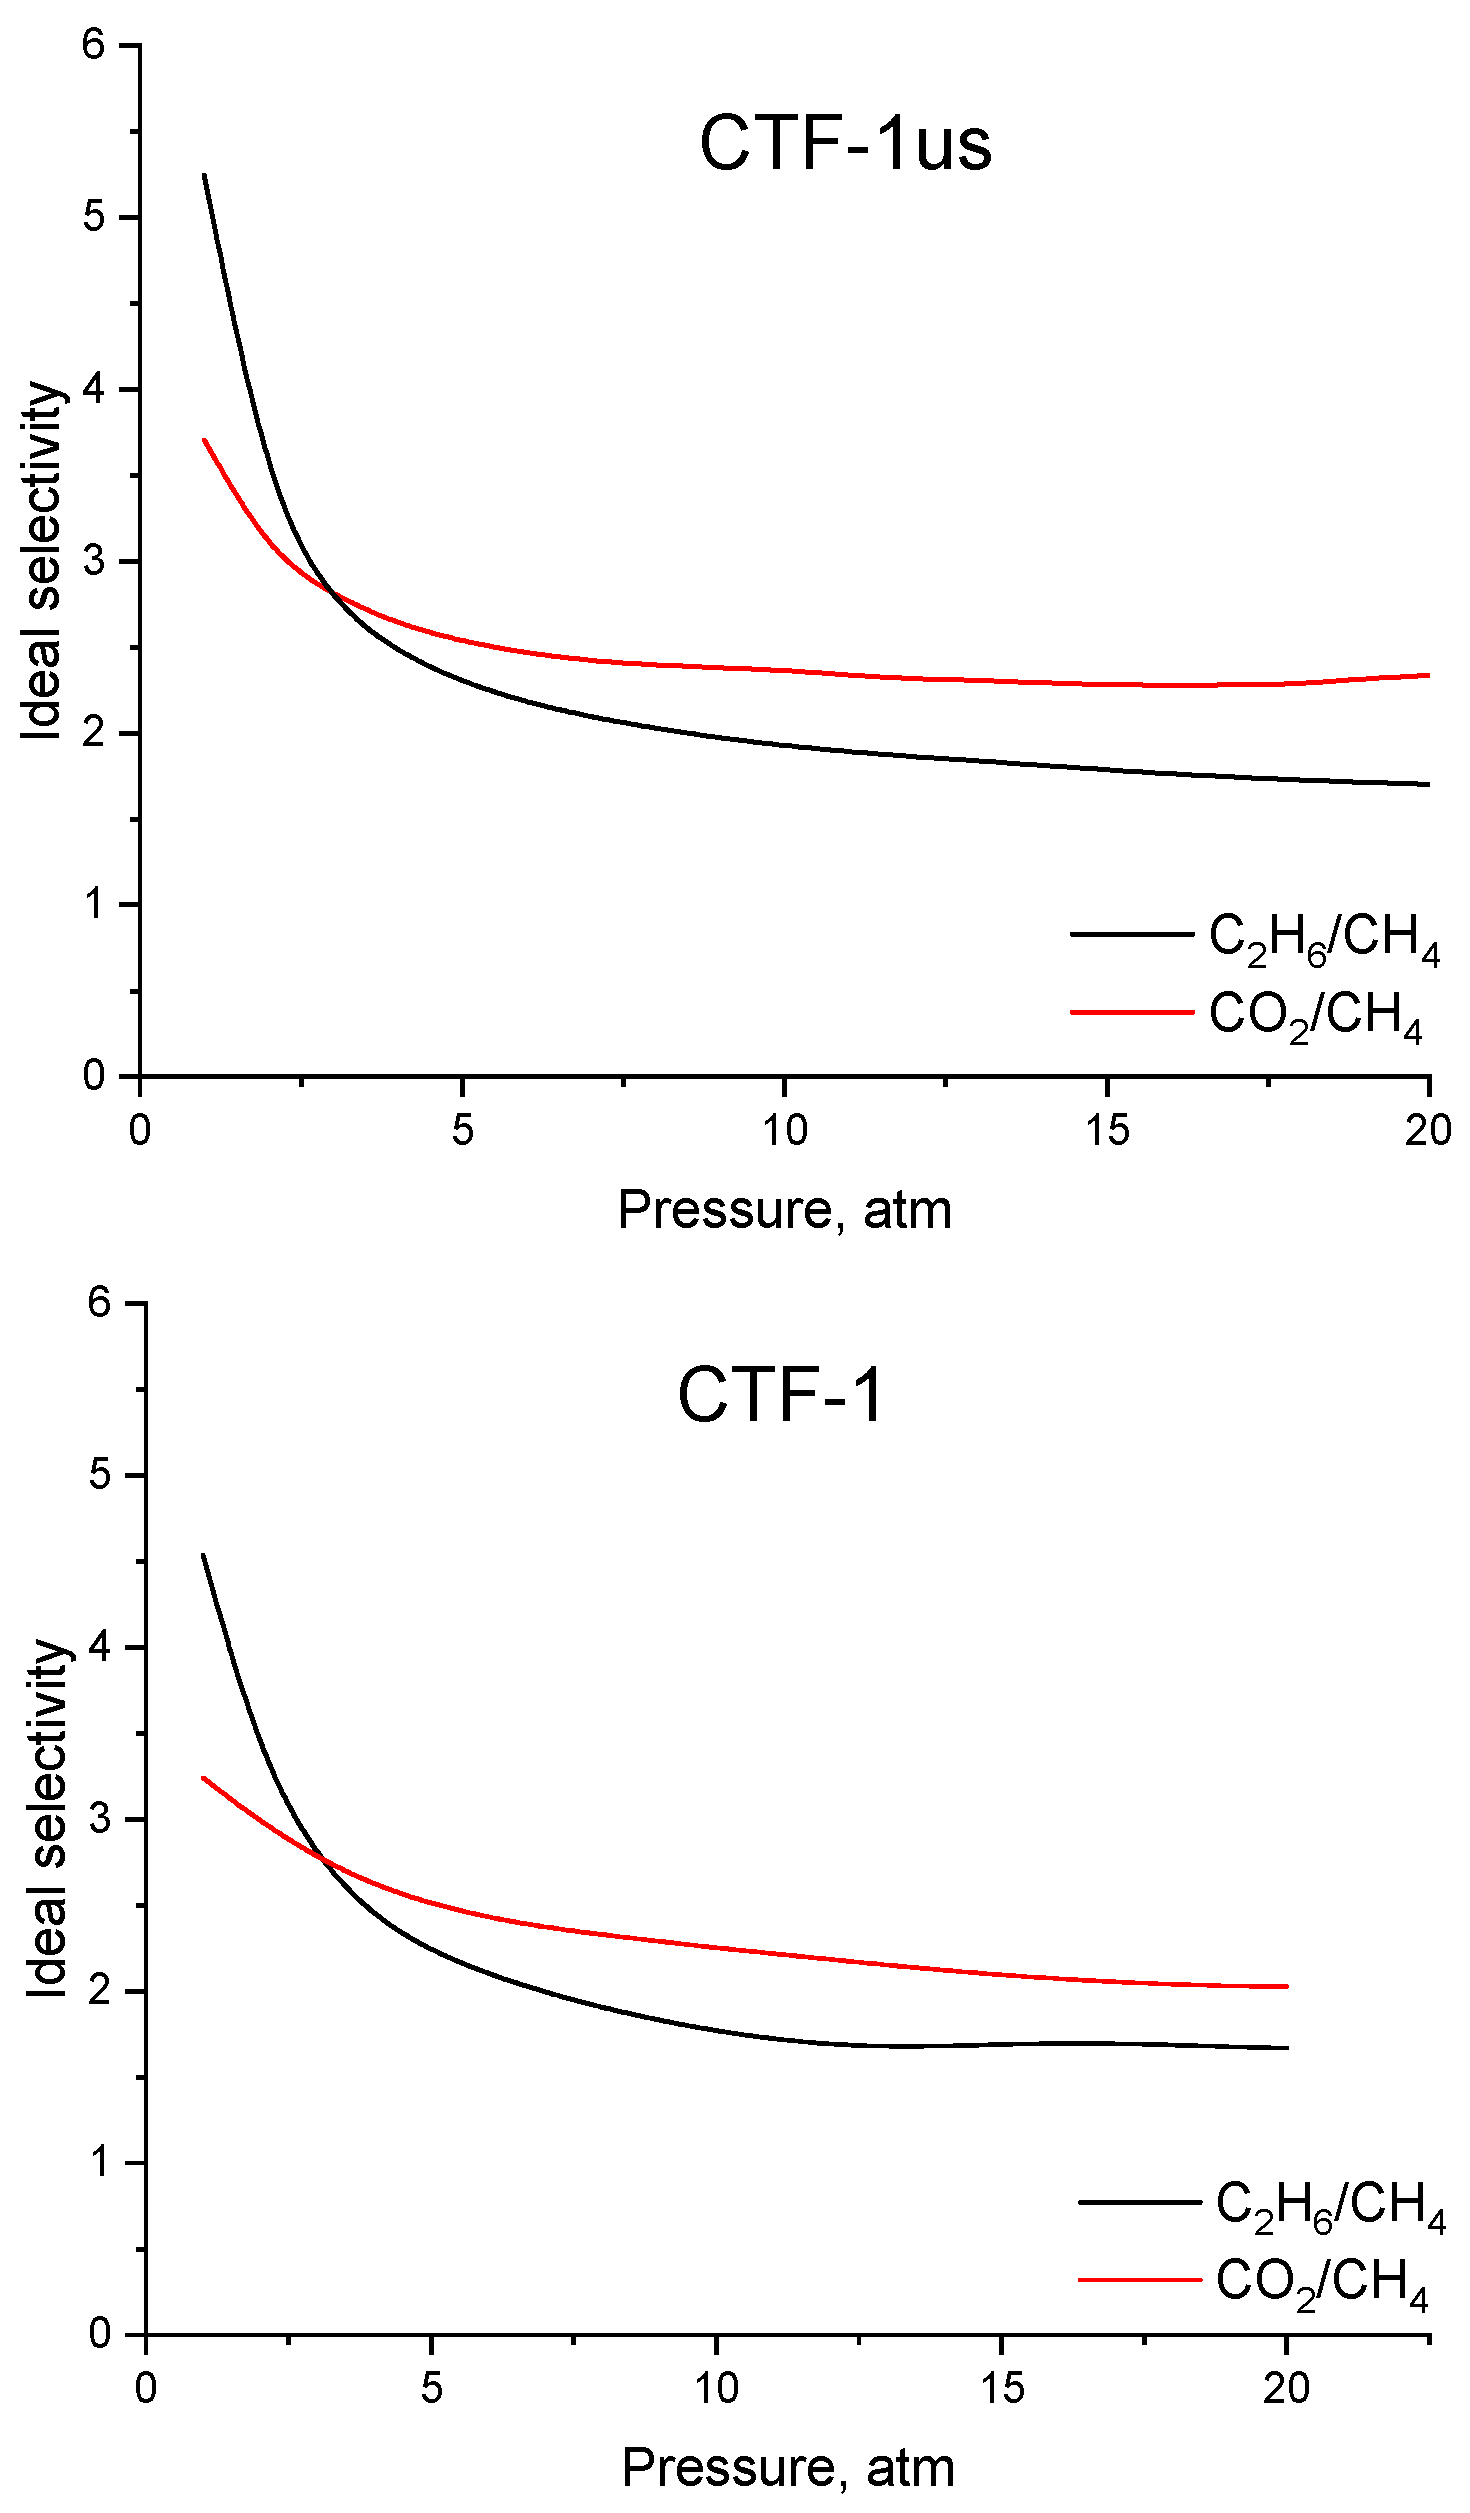
For the synthesized CTF-1 materials, the values of the ideal and IAST selectivity for ethane/methane and carbon dioxide/methane pairs were calculated for a wide range of pressures (Figure 4 and Figure 5 and Table 5).
In the case of the IAST selectivity (Figure 3), the CTF-1us sample demonstrates a noticeably higher IAST selectivity in the pressure range of 1–20 atm both for ethane and carbon dioxide than the CTF-1 sample. This phenomenon could be explained by the enhanced adsorption properties of the CTF-1us sample as can be seen from the obtained isotherms for all studied gases due to a reduced amount of impurities (Figure 2). The obtained IAST selectivity values for C2H6/CH4 gas pairs for the CTF-1us sample (22.7 at 298 K and 1 atm) exceed the corresponding IAST values of several known COFs and MOFs for the same conditions: N-COF (18.8) [39], P-COF (12.1) [39], T-COF (10.0) [39], PAF-40 (15.2) [40], PAF-40-Fe (16.2) [40], UTSA-38a (10.1) [41], UTSA-36a (16.6) [42], UTSA-33a (16.0) [42], UTSA-34b (17.0) [42], ZIF-8 (10.0) [42], and HKUST-1 (16.3) [19].
Regarding the ideal selectivity for the equimolar mixture of C2H6:CH4 or CO2:CH4 in the pressure range of 1–20 atm, both materials demonstrate quite similar selectivity values; although, the CTF-1us sample is still around 5–10% more selective towards ethane or carbon dioxide.

4. Conclusions

Thus, two methods of the post-synthesis treatment of the triazine-based covalent organic framework CTF-1 were compared. Adsorption of hydrocarbons (methane and ethane) and carbon dioxide was measured in a wide pressure range (up to 30 atm) for the first time at 298 K on the synthesized CTF-1 samples. It was shown that ultrasonication allows one to effectively remove traces of zinc and other possible impurities from the obtained material. This greatly improves the adsorption capacities towards hydrocarbons (up to 20% for ethane) and also significantly increases the IAST selectivity towards ethane (almost 10-times more selective) and carbon dioxide (a 20% selectivity improvement) compared to the non-ultrasonicated sample of CTF-1.

Supplementary Materials

The following supporting information can be downloaded at: https://www.mdpi.com/article/10.3390/cryst14121066/s1: Figure S1. The schematic of the Sieverts-type volumetric adsorption apparatus. Figure S2. FTIR spectra of obtained CTF-1 samples. Figure S3. IR spectrum of 1,3,5-triazine. Figure S4. IR spectrum of 1,4-dicyanobenzene. Table S1. Observed IR bands in IR spectrum of CTF-1 sample.

Author Contributions

Conceptualization, L.M.K., V.N.Z. and L.A.A.; methodology, G.S.D. and D.Y.K.; formal analysis, L.M.G. and D.O.C.; investigation, G.S.D., V.N.Z. and V.V.C.; writing—original draft preparation, G.S.D., L.M.K. and V.N.Z.; writing—review and editing, L.M.K.; supervision, L.M.K.; project administration, L.M.K.; funding acquisition, L.M.K. All authors have read and agreed to the published version of the manuscript.

Funding

This research was funded by a grant from the Ministry of Science and Higher Education of the Russian Federation for large scientific projects in priority areas of scientific and technological development (075-15-2024-547).

Data Availability Statement

Data are available upon request from the authors.

Acknowledgments

The analysis of sample morphology was performed with the financial support of the national program “Science and Universities”.

Conflicts of Interest

The authors declare no conflicts of interest.

References

  1. Freund, R.; Zaremba, O.; Arnauts, G.; Ameloot, R.; Skorupskii, G.; Dincă, M.; Bavykina, A.; Gascon, J.; Ejsmont, A.; Goscianska, J.; et al. The Current Status of MOF and COF Applications. Angew. Chem. Int. Ed. 2021, 60, 23975–24001. [Google Scholar] [CrossRef] [PubMed]
  2. Chung, Y.G.; Haldoupis, E.; Bucior, B.J.; Haranczyk, M.; Lee, S.; Zhang, H.; Vogiatzis, K.D.; Milisavljevic, M.; Ling, S.; Camp, J.S.; et al. Advances, Updates, and Analytics for the Computation-Ready, Experimental Metal–Organic Framework Database: CoRE MOF 2019. J. Chem. Eng. Data 2019, 64, 5985–5998. [Google Scholar] [CrossRef]
  3. Ongari, D.; Yakutovich, A.V.; Talirz, L.; Smit, B. Building a Consistent and Reproducible Database for Adsorption Evaluation in Covalent–Organic Frameworks. ACS Cent. Sci. 2019, 5, 1663–1675. [Google Scholar] [CrossRef]
  4. Kuhn, P.; Antonietti, M.; Thomas, A. Porous, Covalent Triazine-Based Frameworks Prepared by Ionothermal Synthesis. Angew. Chem. Int. Ed. 2008, 47, 3450–3453. [Google Scholar] [CrossRef]
  5. Liao, L.; Li, M.; Yin, Y.; Chen, J.; Zhong, Q.; Du, R.; Liu, S.; He, Y.; Fu, W.; Zeng, F. Advances in the Synthesis of Covalent Triazine Frameworks. ACS Omega 2023, 8, 4527–4542. [Google Scholar] [CrossRef]
  6. Zakharov, V.N.; Kudryavtsev, I.K.; Dunaev, S.F.; Paseshnichenko, K.A.; Aslanov, L.A. Triazine 2D Nanosheets as a New Class of Nanomaterials: Crystallinity, Properties and Applications. Colloids Interfaces 2022, 6, 20. [Google Scholar] [CrossRef]
  7. Yu, S.; Mahmood, J.; Noh, H.; Seo, J.; Jung, S.; Shin, S.; Im, Y.; Jeon, I.; Baek, J. Direct Synthesis of a Covalent Triazine-Based Framework from Aromatic Amides. Angew. Chem. Int. Ed. 2018, 57, 8438–8442. [Google Scholar] [CrossRef] [PubMed]
  8. Gold, T. The Origin of Natural Gas and Petroleum, and the Prognosis for Future Supplies. Annu. Rev. Energy 1985, 10, 53–77. [Google Scholar] [CrossRef]
  9. Faramawy, S.; Zaki, T.; Sakr, A.A.-E. Natural Gas Origin, Composition, and Processing: A Review. J. Nat. Gas. Sci. Eng. 2016, 34, 34–54. [Google Scholar] [CrossRef]
  10. Zhang, R.; Wang, Z.; Wei, X.; Peng, X.; Chen, W.; Deng, C.; Liu, B.; Sun, C.; Chen, G. Modelling and Optimization of Ethane Recovery Process from Natural Gas via ZIF-8/Water-Glycol Slurry with Low Energy Consumption. Energy 2023, 263, 125645. [Google Scholar] [CrossRef]
  11. Siddiqi, K.S.; Thomas, W.J. The Adsorption of Methane-Ethane Mixtures on Activated Carbon. Carbone 1982, 20, 473–479. [Google Scholar] [CrossRef]
  12. Triebe, R.W.; Tezel, F.H.; Khulbe, K.C. Adsorption of Methane, Ethane and Ethylene on Molecular Sieve Zeolites. Gas. Sep. Purif. 1996, 10, 81–84. [Google Scholar] [CrossRef]
  13. Lin, R.-B.; Xiang, S.; Zhou, W.; Chen, B. Microporous Metal-Organic Framework Materials for Gas Separation. Chem 2020, 6, 337–363. [Google Scholar] [CrossRef]
  14. Deyko, G.S.; Glukhov, L.M.; Isaeva, V.I.; Vergun, V.V.; Chernyshev, V.V.; Kapustin, G.I.; Kustov, L.M. Adsorption of Methane and Ethane on HKUST-1 Metal–Organic Framework and Mesoporous Silica Composites. Mendeleev Commun. 2023, 33, 817–820. [Google Scholar] [CrossRef]
  15. Koyama, R.; Tsunoda, F.; Ichinose, I.; Kanoh, H. Adsorption Properties of Methane, Ethane, and Hexane on Mesoporous Organic Polymers Prepared by the Flash Freezing Method. Langmuir 2020, 36, 2184–2190. [Google Scholar] [CrossRef]
  16. Wang, H.; Liu, Y.; Liu, Y.; Wang, Z.; Li, C.; Sun, S.; Lyu, Q.; Hu, S. Two-Dimensional Imine Covalent Organic Frameworks for Methane and Ethane Separation: A GCMC Simulation Study. Microporous Mesoporous Mater. 2021, 326, 111386. [Google Scholar] [CrossRef]
  17. Katsoulidis, A.P.; Kanatzidis, M.G. Mesoporous Hydrophobic Polymeric Organic Frameworks with Bound Surfactants. Selective Adsorption of C2H6 versus CH4. Chem. Mater. 2012, 24, 471–479. [Google Scholar] [CrossRef]
  18. Ma, H.; Ren, H.; Meng, S.; Yan, Z.; Zhao, H.; Sun, F.; Zhu, G. A 3D Microporous Covalent Organic Framework with Exceedingly High C3H8/CH4 and C2 Hydrocarbon/CH4 Selectivity. Chem. Commun. 2013, 49, 9773. [Google Scholar] [CrossRef]
  19. Deyko, G.S.; Glukhov, L.M.; Isaeva, V.I.; Chernyshev, V.V.; Vergun, V.V.; Archipov, D.A.; Kapustin, G.I.; Tkachenko, O.P.; Nissenbaum, V.D.; Kustov, L.M. Modifying HKUST-1 Crystals for Selective Ethane Adsorption Using Ionic Liquids as Synthesis Media. Crystals 2022, 12, 279. [Google Scholar] [CrossRef]
  20. Zhang, S.; Taylor, M.K.; Jiang, L.; Ren, H.; Zhu, G. Light Hydrocarbon Separations Using Porous Organic Framework Materials. Chem.—A Eur. J. 2020, 26, 3205–3221. [Google Scholar] [CrossRef] [PubMed]
  21. Wang, Y.; Li, J.; Yang, Q.; Zhong, C. Two-Dimensional Covalent Triazine Framework Membrane for Helium Separation and Hydrogen Purification. ACS Appl. Mater. Interfaces 2016, 8, 8694–8701. [Google Scholar] [CrossRef] [PubMed]
  22. Deeg, K.S.; Damasceno Borges, D.; Ongari, D.; Rampal, N.; Talirz, L.; Yakutovich, A.V.; Huck, J.M.; Smit, B. In Silico Discovery of Covalent Organic Frameworks for Carbon Capture. ACS Appl. Mater. Interfaces 2020, 12, 21559–21568. [Google Scholar] [CrossRef] [PubMed]
  23. Lan, J.; Cao, D.; Wang, W.; Smit, B. Doping of Alkali, Alkaline-Earth, and Transition Metals in Covalent-Organic Frameworks for Enhancing CO2 Capture by First-Principles Calculations and Molecular Simulations. ACS Nano 2010, 4, 4225–4237. [Google Scholar] [CrossRef] [PubMed]
  24. Yang, Z.; Cao, D. Effect of Li Doping on Diffusion and Separation of Hydrogen and Methane in Covalent Organic Frameworks. J. Phys. Chem. C 2012, 116, 12591–12598. [Google Scholar] [CrossRef]
  25. Zakharov, V.; Kardasheva, Y.; Chernyshev, V.; Terenina, M.; Kalmykov, K.; Ovsyannikov, D.; Savilov, S.; Filippova, S.; Karakhanov, E.; Dunaev, S.; et al. Hydroformylation of Olefins over a Novel Active Rhodium Catalyst Supported on a Melamine–Cyanuric Acid Co-Crystal. Mol. Catal. 2023, 550, 113598. [Google Scholar] [CrossRef]
  26. Sychev, V.; Vasserman, A.; Zagoruchenko, V.; Kozlov, A.; Spiridonov, G.; Tsymarny, V. Thermodynamic Properties of Methane; Izdatel’stvo Standartov: Moscow, Russia, 1979. [Google Scholar]
  27. Sychev, V.; Wasserman, A.; Zagoruchenko, V.; Kozlov, A.; Spiridonov, G.; Tsymarnyi, V. Thermodynamic Properties of Ethane; Izdatel’stvo Standartov: Moscow, Russia, 1982; ISBN 9780891166115. [Google Scholar]
  28. Span, R.; Wagner, W. A New Equation of State for Carbon Dioxide Covering the Fluid Region from the Triple-Point Temperature to 1100 K at Pressures up to 800 MPa. J. Phys. Chem. Ref. Data 1996, 25, 1509–1596. [Google Scholar] [CrossRef]
  29. Myers, A.L.; Prausnitz, J.M. Thermodynamics of Mixed-Gas Adsorption. AIChE J. 1965, 11, 121–127. [Google Scholar] [CrossRef]
  30. Fraux, G.; Boutin, A.; Fuchs, A.H.; Coudert, F.-X. On the Use of the IAST Method for Gas Separation Studies in Porous Materials with Gate-Opening Behavior. Adsorption 2018, 24, 233–241. [Google Scholar] [CrossRef]
  31. Pourebrahimi, S.; Pirooz, M.; Kazemeini, M.; Vafajoo, L. Synthesis, Characterization, and Gas (SO2, CO2, NO2, CH4, CO, NO, and N2) Adsorption Properties of the CTF-1 Covalent Triazine Framework-Based Porous Polymer: Experimental and DFT Studies. J. Porous Mater. 2024, 31, 643–657. [Google Scholar] [CrossRef]
  32. Pawley, G.S. Unit-Cell Refinement from Powder Diffraction Scans. J. Appl. Crystallogr. 1981, 14, 357–361. [Google Scholar] [CrossRef]
  33. Zlokazov, V.B.; Chernyshev, V.V. MRIA—A Program for a Full Profile Analysis of Powder Neutron-Diffraction Time-of-Flight (Direct and Fourier) Spectra. Mater. Sci. Forum 1991, 79–82, 283–288. [Google Scholar] [CrossRef]
  34. Li, Z.; Han, Y.; Guo, Y.; Xu, S.; Chen, F.; Ye, L.; Luo, Z.; Liu, X.; Zhou, H.; Zhao, T. Evolution of the Formation of a Covalent Triazine-Based Framework Catalyzed by p-Toluenesulfonic Acid Monohydrate. RSC Adv. 2017, 7, 45818–45823. [Google Scholar] [CrossRef]
  35. Yan, J.; Zhang, B.; Wang, Z. Highly Selective Separation of CO2, CH4, and C2–C4 Hydrocarbons in Ultramicroporous Semicycloaliphatic Polyimides. ACS Appl. Mater. Interfaces 2018, 10, 26618–26627. [Google Scholar] [CrossRef] [PubMed]
  36. Furukawa, H.; Yaghi, O.M. Storage of Hydrogen, Methane, and Carbon Dioxide in Highly Porous Covalent Organic Frameworks for Clean Energy Applications. J. Am. Chem. Soc. 2009, 131, 8875–8883. [Google Scholar] [CrossRef] [PubMed]
  37. Zhao, Y.; Yao, K.X.; Teng, B.; Zhang, T.; Han, Y. A Perfluorinated Covalent Triazine-Based Framework for Highly Selective and Water–Tolerant CO2 Capture. Energy Environ. Sci. 2013, 6, 3684. [Google Scholar] [CrossRef]
  38. Buyukcakir, O.; Je, S.H.; Talapaneni, S.N.; Kim, D.; Coskun, A. Charged Covalent Triazine Frameworks for CO2 Capture and Conversion. ACS Appl. Mater. Interfaces 2017, 9, 7209–7216. [Google Scholar] [CrossRef]
  39. Dong, J.; Wang, Y.; Liu, G.; Cheng, Y.; Zhao, D. Isoreticular Covalent Organic Frameworks for Hydrocarbon Uptake and Separation: The Important Role of Monomer Planarity. CrystEngComm 2017, 19, 4899–4904. [Google Scholar] [CrossRef]
  40. Meng, S.; Ma, H.; Jiang, L.; Ren, H.; Zhu, G. A Facile Approach to Prepare Porphyrinic Porous Aromatic Frameworks for Small Hydrocarbon Separation. J. Mater. Chem. A 2014, 2, 14536–14541. [Google Scholar] [CrossRef]
  41. Das, M.C.; Xu, H.; Wang, Z.; Srinivas, G.; Zhou, W.; Yue, Y.-F.; Nesterov, V.N.; Qian, G.; Chen, B. A Zn4O-Containing Doubly Interpenetrated Porous Metal–Organic Framework for Photocatalytic Decomposition of Methyl Orange. Chem. Commun. 2011, 47, 11715. [Google Scholar] [CrossRef]
  42. He, Y.; Zhou, W.; Krishna, R.; Chen, B. Microporous Metal–Organic Frameworks for Storage and Separation of Small Hydrocarbons. Chem. Commun. 2012, 48, 11813. [Google Scholar] [CrossRef]
Figure 1. XRD powder patterns of CTF-1 (blue) and CTF-1us (red).
Crystals 14 01066 g001
Figure 2. SEM images of obtained CTF-1 (a) and CTF-1us (b) samples, magnification is 100 times.
Crystals 14 01066 g002
Figure 3. Adsorption isotherms of CO2, CH4, and C2H6 on the obtained samples at 298 K. Hollow symbols—CTF-1us sample after ultrasound treatment; solid symbols—CTF-1 sample without ultrasound treatment.
Crystals 14 01066 g003
Figure 4. IAST selectivity values for C2H6/CH4 (1:9 mol) and CO2/CH4 (1:9 mol) gas pairs at 298 K.
Crystals 14 01066 g004
Figure 5. Ideal selectivity values for C2H6/CH4 and CO2/CH4 gas pairs for CTF-1 samples at 298 K.
Crystals 14 01066 g005
Table 1. Elemental analysis data for the obtained CTF-1 samples.
Elemental Composition of CTF-1, C8N2H4C, %N, %H, %Ratio of C/N100- ΣCHN, %
Theoretical values74.9921.863.153.43-
CTF-1us71.8820.683.183.474.26
CTF-169.1016.583.574.1710.75
Table 2. The unit cell dimensions.
Sample NameCTF-1CTF-1us
a = b, Å 13.79(2)13.91(2)
c, Å3.377(14)3.399(13)
Table 3. Calculated positions (2θ, °) of the main peaks.
hklZK225ZK225-UZ
1 0 07.387.32
1 1 012.8012.70
2 0 014.7914.66
0 0 126.3626.19
Table 4. Textural characteristics of obtained CTF-1-based materials.
SampleSBET, m2/gVtot.,
cm3/g
Vmicro,
cm3/g
Vmeso,
cm3/g
Pore Diameter, nm
CTF-14510.260.26-1.9–2.6
CTF-1us5500.300.30-1.9–2.6
Table 5. Ideal and IAST selectivities for the obtained CTF-1 adsorbents (25 °C).
SampleIdeal SelectivityIAST Selectivity at y(CH4) = 0.9
C2H6:CH4, P = 1 atmC2H6:CH4, P = 5 atmC2H6:CH4, P = 20 atmC2H6:CH4, P = 1 atmC2H6:CH4, P = 5 atmC2H6:CH4, P = 20 atm
CTF-14.532.231.672.525.025.84
CTF-us5.242.291.7022.714.211.49
CO2:CH4,
P = 1 atm
CO2:CH4,
P = 5 atm
CO2:CH4,
P = 20 atm
CO2:CH4,
P = 1 atm
CO2:CH4, P = 5 atmCO2:CH4, P = 20 atm
CTF-13.242.502.032.193.484.71
CTF-us3.712.532.342.874.145.33
Disclaimer/Publisher’s Note: The statements, opinions and data contained in all publications are solely those of the individual author(s) and contributor(s) and not of MDPI and/or the editor(s). MDPI and/or the editor(s) disclaim responsibility for any injury to people or property resulting from any ideas, methods, instructions or products referred to in the content.