Article

Surface Cladding of Mild Steel Coated with Ni Containing TiO2 Nanoparticles Using a High-Temperature Arc from TIG Welding

by
Kavian O. Cooke
*,
Ayesha Mirza
,
Junlin Chen
and
Alaa Al Hausone
Faculty of Engineering and Digital Technologies, University of Bradford, Richmond Road, Bradford BD71DP, UK
*
Author to whom correspondence should be addressed.
Crystals 2024, 14(12), 1048; https://doi.org/10.3390/cryst14121048
Submission received: 9 November 2024 / Revised: 25 November 2024 / Accepted: 26 November 2024 / Published: 30 November 2024
(This article belongs to the Special Issue Advances in Surface Modifications of Metallic Materials)

Abstract

:
This study explores the use of a high-temperature arc generated during tungsten inert gas (TIG) welding to enhance the mechanical properties of the surface of AISI 1020 steel. An innovative two-step process involves using the high-temperature arc as an energy source to fuse a previously electrodeposited Ni/TiO2 coating to the surface of the substrate. The cladded surface is characterised by a scanning electron microscope (SEM) equipped with energy dispersive spectroscopy (EDS), an optical microscope (O.M.) equipped with laser-induced breakdown spectroscopy (LIBS), Vicker’s microhardness testing, and pin-on-plate wear testing. The treated surface exhibits a unique amalgamation of hardening mechanisms, including nanoparticle dispersion strengthening, grain size reduction, and solid solution strengthening. The thickness of the electrodeposited layer appears to strongly influence the hardness variation across the width of the treated layer. The hardness of the treated layer when the Ni coating contains 30 nm TiO2 particles was found to be 451 VHN, validating an impressive 2.7-fold increase in material hardness compared to the untreated substrate (165 VHN). Similarly, the treated surface exhibits a twofold improvement in wear resistance (9.0 × 102 µm3/s), making it substantially more durable in abrasive environments than the untreated surface. Microstructural and EDS analysis reveal a significant reduction in grain size and the presence of high concentrations of Ni and TiO2 within the treated region, providing clear evidence for the activation of several strengthening mechanisms.

1. Introduction

Mild steel finds extensive applications across diverse industrial engineering sectors, including transportation, automotive, and aerospace sectors. However, mild steel’s low hardness and poor corrosion resistance are inevitable limitations [1]. The intrinsic vulnerability of mild steel underscores the necessity for innovative surface modification strategies [2]. Over the past three decades, researchers have explored several innovative techniques for augmenting the surface properties of mild steel [3,4]. One such technique is cladding. This process involves depositing a layer of material that contains the desired properties onto a substrate. A heat source, such as a laser [5] or electric arc [6], is used to melt metal powders or wires onto the surface of the substrate, creating a metallurgical bond. Surface cladding has been shown to enhance wear [7] and corrosion resistance [8], increasing the component’s durability and reliability.
Laser cladding has also been shown to significantly enhance the mechanical and corrosion properties of mild steel surfaces. Hu et al. [9] demonstrated laser-cladding of a surface layer containing Al-Fe-Cr-C onto 316 L stainless steel substrate to study the effects of Al content on the elemental distribution, physical phase composition, and properties of the cladded layer. Al flow and compositional homogenisation of the molten pool, leading to a more dispersed carbide distribution with improved stability of ferrite, fine-grain, load-transfer, dislocation, and Orowan strengthening, thereby improves the hardness and wear resistance of the Fe-Cr-C hard-facing alloys. The equipment cost and setup, however, are often prohibitive.
Similarly, Kong et al. [10] used a double-wire arc direct energy deposition to modify the mild steel surface. The main finding of this study is that a heterogeneous double-wire arc-directed energy deposition (DED) technique can be used to manufacture a martensitic stainless steel cladding layer on the surface of mild steel. This cladding layer exhibits significantly improved mechanical properties and corrosion resistance compared to the mild steel substrate. The microstructure of the cladding layer is composed of martensite and austenite and a 170% increase in microhardness, a 160% increase in strength, and a 1070% increase in corrosion resistance compared to the mild steel substrate. This method offers a promising approach for enhancing the performance of mild steel components in harsh service environments.
Other techniques that have also shown some success include case hardening (carburising, nitriding, and carbonitriding), which stands out as another promising method for enhancing the surface hardness of steel substrate. This method involves the diffusion of carbon or nitrogen into the material’s surface, thereby modifying its microstructure to a depth contingent on the duration of exposure to the diffusion process [10,11,12,13,14,15,16,17].
Microalloying of the surfaces using lasers has also shown some promise. This technique involved the addition of trace amounts of alloying elements like niobium, vanadium, and titanium to steel and has witnessed several advancements in surface hardening over the past five years [18]. These innovations include the development of micro-alloyed steels tailored for surface hardening, featuring higher concentrations of microalloying elements compared to traditional steels, thus imparting superior surface hardening properties [18]. Additionally, novel surface hardening processes customised for micro-alloyed steels have emerged, capable of achieving higher hardness and wear resistance levels than conventional methods.
One notable example is niobium–vanadium steel, engineered explicitly for surface hardening. This variant boasts elevated niobium and vanadium concentrations, enhancing hardenability and enabling higher hardness levels post-surface hardening. Another breakthrough involves laser surface hardening [19], a precise and efficient technique wherein a laser heats the steel surface to high temperatures, followed by rapid cooling [5]. This method is particularly well-suited for micro-alloyed steels as it achieves remarkable hardness without distorting the steel, a crucial aspect in precision applications.
These advancements in surface hardening have facilitated the production of components with improved properties, including increased hardness, wear resistance, fatigue strength, reduced friction, improved corrosion resistance, and extended service life [7,20]. Consequently, surface-hardened micro-alloyed steel components are now increasingly applicable in various sectors, encompassing machine tools, automotive components, aerospace parts, medical devices, oil and gas equipment, and power generation machinery [18].
In practice, surface-hardened micro-alloyed steel components have made significant inroads [21]. For instance, micro-alloyed steel gears are employed in high-performance transmissions and gearboxes, while micro-alloyed steel bearings are crucial in demanding applications such as aircraft engines. In the automotive industry, high-performance engines utilise micro-alloyed steel camshafts and crankshafts. The trajectory of advancements in surface hardening using microalloying is expected to continue, driven by the growing demand for components with elevated hardness, wear resistance, and fatigue strength, poised to meet the ever-increasing demands of various industries.
Various materials have been explored; stainless steel is frequently used for cladding due to its superior corrosion resistance and mechanical strength [22]. Recent studies have demonstrated that stainless steel cladding can significantly enhance the wear resistance of mild steel components subjected to abrasive environments. However, the relatively high cost and complex processing methods may hinder the widespread adoption of applications.
Coatings have also been used extensively to enhance surface properties. Recent studies have developed electrodeposited nanocomposite coatings in which nanoparticles such as Al2O3 TiO2 have been co-deposited with a metallic matrix [23,24,25,26,27,28]. The synergistic effects of nanoparticles within the matrix contribute to significant improvements in wear performance compared to conventional cladding methods. Incorporating other nanoparticles, such as graphene and silicon carbide, can enhance wear resistance by providing additional hardness and reducing friction. The main challenge, however, is that coatings increase the wear resistance of the surface onto which they are deposited. Poor adhesive strength also limits their application to those with low contact forces.
This study proposes a novel two-step process that involves the co-deposition of nanoparticles into a Ni matrix onto the steel surface, followed using a high-temperature arc produced during TIG welding to melt and incorporate the coating constituents into the surface of the steel substrate. The new technique provides a low-cost method for improving mild steel substrate’s hardness and wear resistance. Given the prevalence of TIG welding plants in many workshops, using a TIG heat source increases the accessibility and flexibility of the proposed process. The TIG cladding of the treated layer modifies the microstructural features, composition, and mechanical properties of the cladded surface.

2. Materials and Methods

The composition of the steel samples was measured using EDS and is presented in Table 1.
A band saw was used to cut samples 20 mm × 10 mm from a steel bar. The surface of the steel samples was prepared by grinding progressively from 240 grit to 1200 grit abrasive paper. Each sample was polished using 6 µm to 1 µm diamond paste and finished with 0.3 µm Al2O3 aqueous suspension. The polished samples were immersed in a modified Watts nickel bath containing nano-sized TiO2. Figure 1 shows a schematic of the coating process and a flow chart of the steps involved in the processes covered during the study.
The cross-section and microstructure of the coated steel substrate are presented in Figure 2A. The coating appears to contain two distinct regions that can be identified by a colour variation in the coating microstructure presented in Figure 2A. The light grey areas are believed to be the Ni-matrix, while the small dark grey dots are believed to be the nano TiO2 particles distributed throughout the thickness of the coating. Image analysis using ImageJ suggests that the TiO2 particle composition was 18.42 wt%. The coating/substrate interface consisted of dark spots along the interface, which can be attributed to poor bonding between the substrate and the coating, leading to the formation of pores. The scientific literature suggests that porosity along the interface can negatively impact the bond strength between the substrate and the coating. For a coating time of 30 min, the thickness of the resulting coating was approximately 50 µm. The dark spots coincide with the Mn-rich region of the material. The EDS spectrum confirms that the particles are TiO2 and appear uniformly distributed throughout the coating matrix. The dark spots labelled (oxides) were identified as oxide inclusions deposited during the coating process. Figure 2C presents the microstructure of the as-received steel substrate, which contains two distinct phases, ferrite and pearlite, having an average grain size of 50 µm and 20 µm, respectively. The composition of the substrate was confirmed and measured using energy dispersive spectroscopy (EDS) (see Figure 2D,E).

Modification of the Surface of the Mild Steel

Three sets of polished samples were coated from bath containing the following constituents: 250 g/L NiSO4·6H2O, 45 g/LNiCl2·6H2O, 35 g/L H3BO3, 1-g/L Saccharin, and 1 L H2O 18. Bath 1: nanoparticles were not added; Bath 2 (20 g/L): 250 nm TiO2 nanoparticle; and Bath 3 (20 g/L): 30 nm TiO2 nanoparticle. A schematic of the coating process is shown in Figure 1A. The electrodeposition was carried out in a 250 mL glass beaker (see Table 2). The coating parameters, such as a current density of 5 A/dm2 and a deposition temperature of 50 °C, were optimised in a previous study [29]. The scientific literature shows that while electroplating has many advantages in protecting the surfaces on which the coating is deposited, the strength of the coating/substrate interface often limits the application to low-load-bearing surfaces. The application of a second step using the high-temperature arc generated during TIG welding is expected to melt and fuse the coating to the surface of the steel substrate.
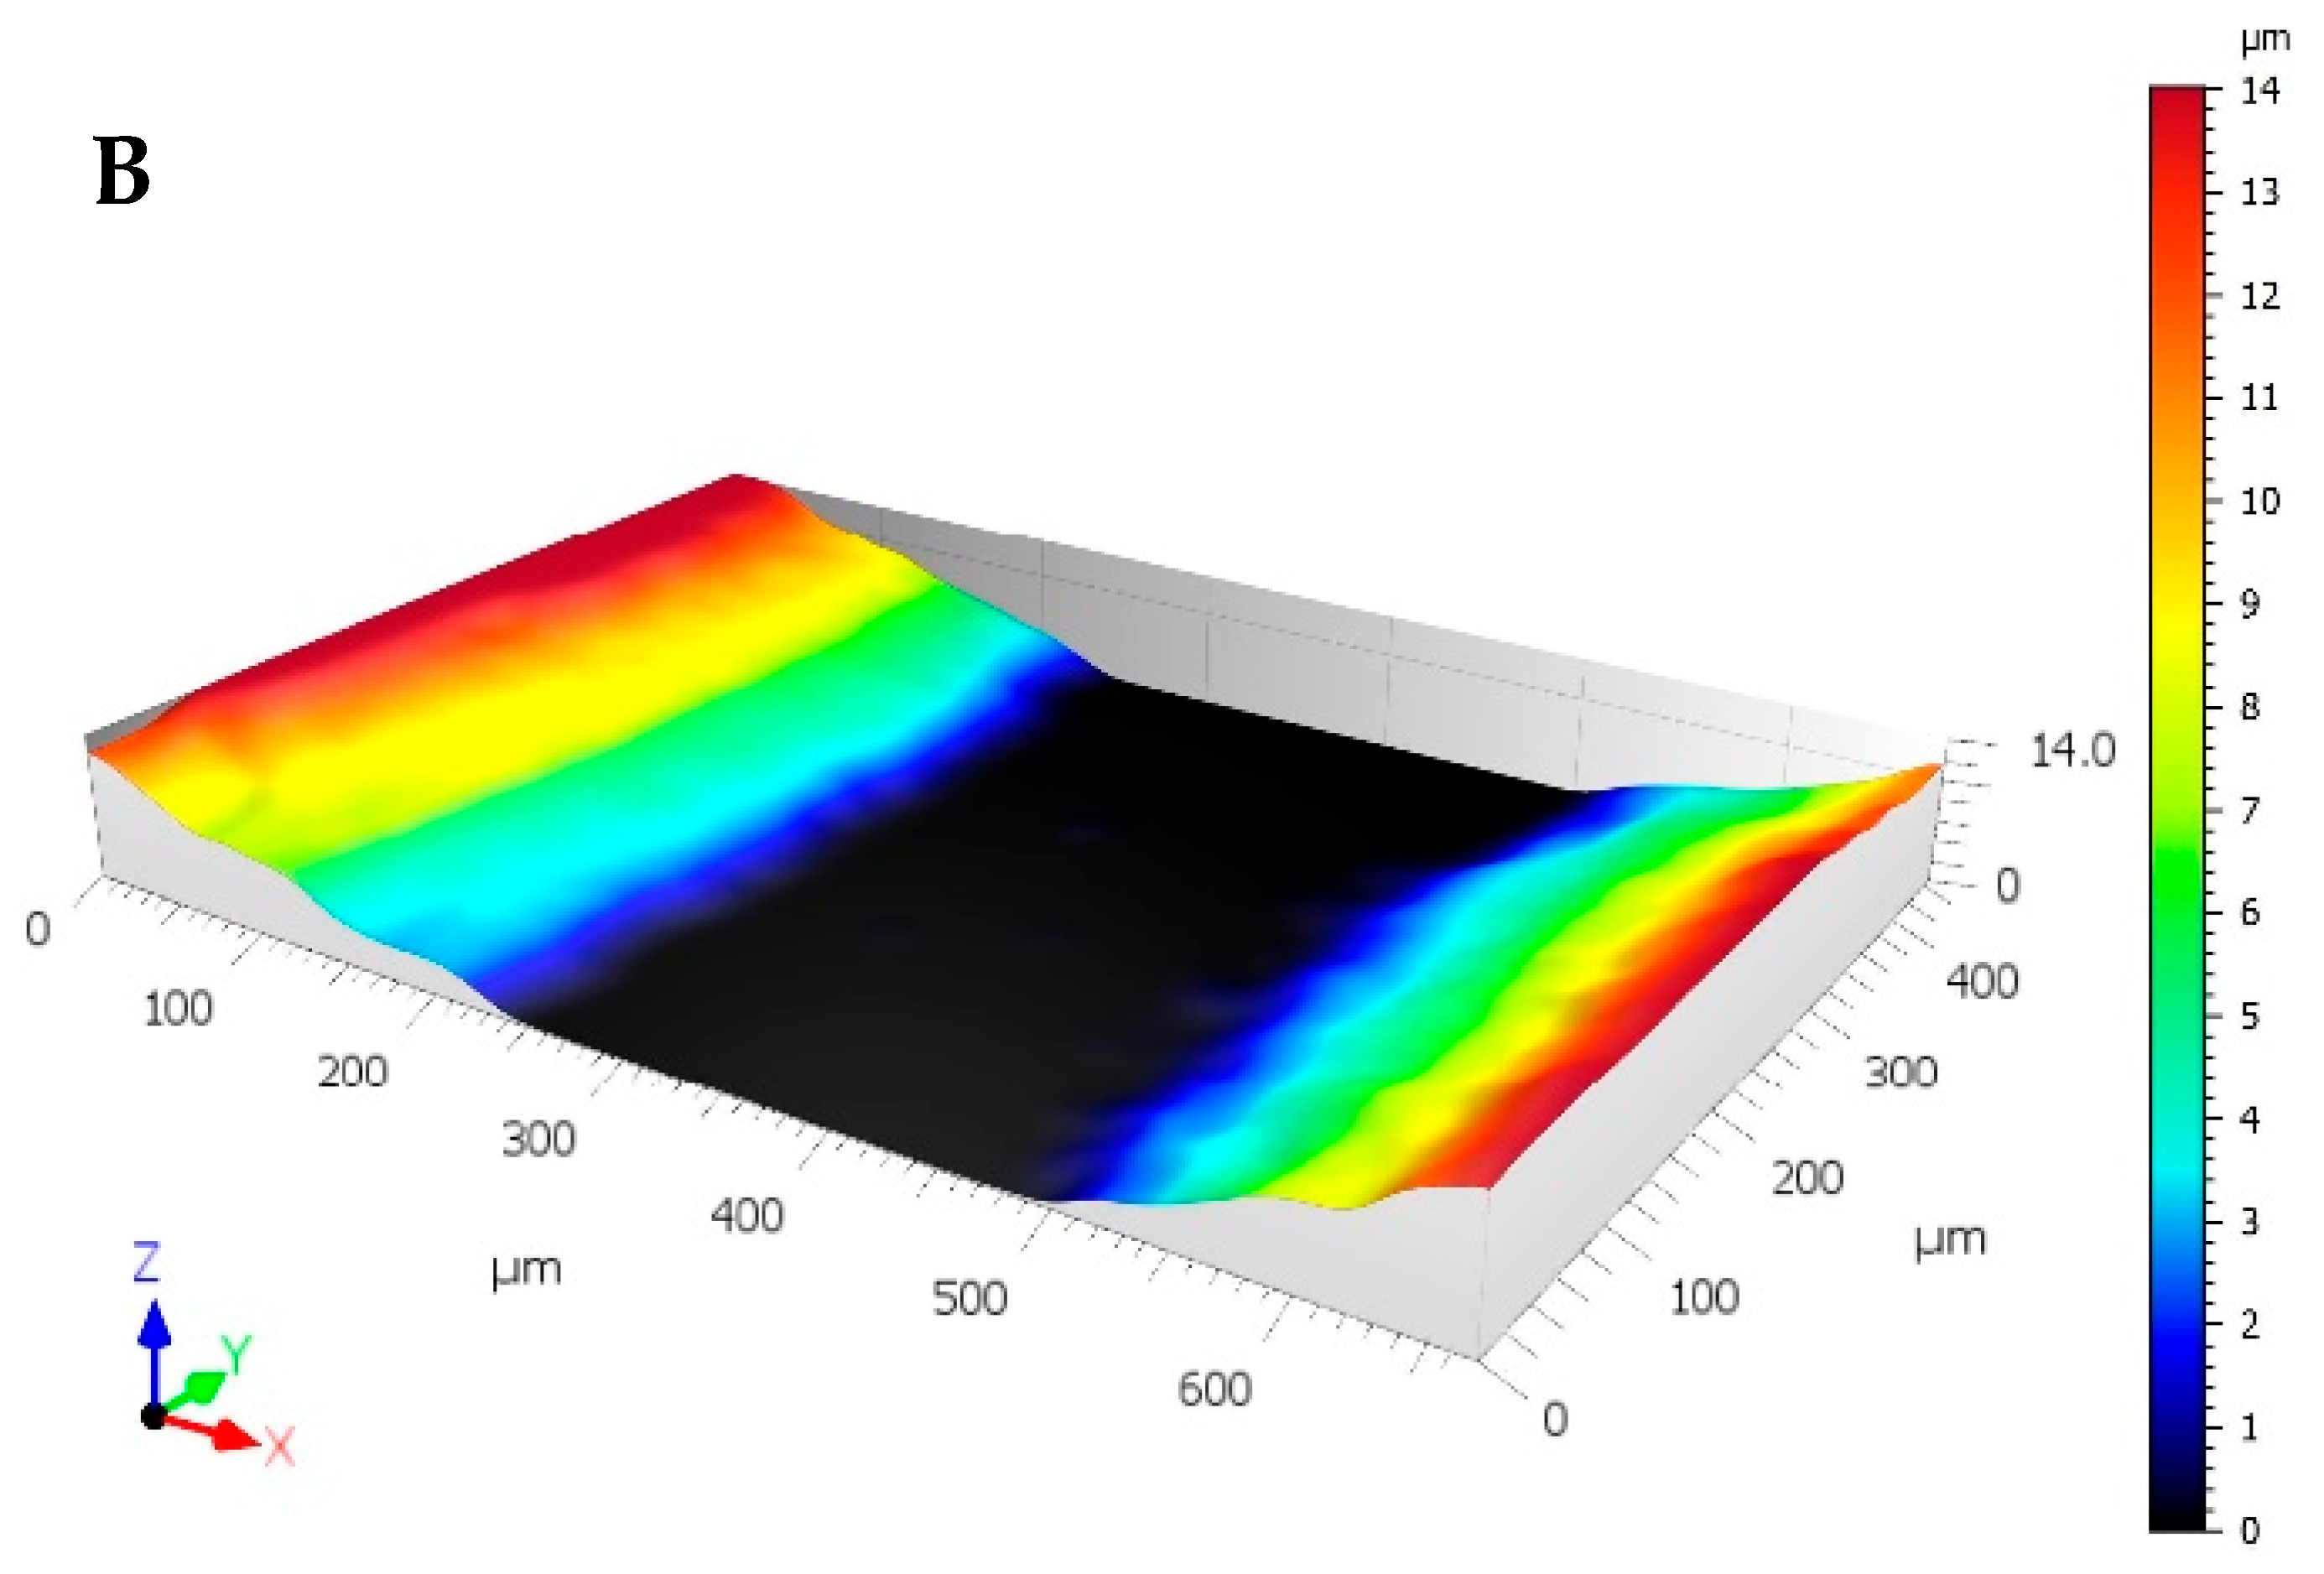
The surface of the coated samples was melted using a tungsten electrode with a voltage of 100 V, a traverse speed of 2 mm/s, and Argon (99.98% purity) as the shielding gas (see Table 3). The electrode was positioned at 45° to the workpiece and 3 mm above the steel surface to be melted. Each sample was prepared by three passes to ensure complete melting of the sample surface. The specimen’s surfaces were melted using a 2% thoriated electrode at 75 Amp. The samples were fixed to a steel platform to ensure all samples were the same distance away from the torch, which was 3 mm. Table 3 summarises the testing parameters that were used in the study. Microstructural analysis and hardness testing samples were cut transverse to the melted surface and mounted in Bakelite. The surfaces were prepared as outlined above and etched with 5% Nital. Figure 3 shows a topographical map of the surface cladded with Ni containing 30 nm TiO2 particles. The surface appears rough, with asperities ranging from 0 to 55 µm. The micro-hardness of the treated region was evaluated using a Vickers micro-hardness tester with a 0.2 kg load, according to ASTM E384. A dry sliding wear test was also performed at room temperature using a reciprocating pin-on-plate machine, according to the ASTM G133 standard. The steel surfaces were tested against a diamond pin used as the counter-face material under a constant load of 50 N and a sliding velocity of 0.75 m/s for 30 min. The resulting wear scar depth was measured using a Leica DM6 LIBS microscope, and the wear rate was calculated. The heat input into the sample during the Tig surface treatment process can be calculated using the following equation [6]:
H e a t   i n p u t = 0.45 I V v .
I is the current (A), V is the voltage (V), and v is the electrode traverse speed in mm/s. Using welding parameters of 75 A, 100 V, and a traverse speed of 2 mm/s would produce a heat input of 1.69 kJ/mm. Given the heat input, multiple passes on the sample surface may result in unintended surface annealing, which could reduce the surface’s hardness.

3. Results and Discussion

3.1. Microstructural Changes During the Hardening Process

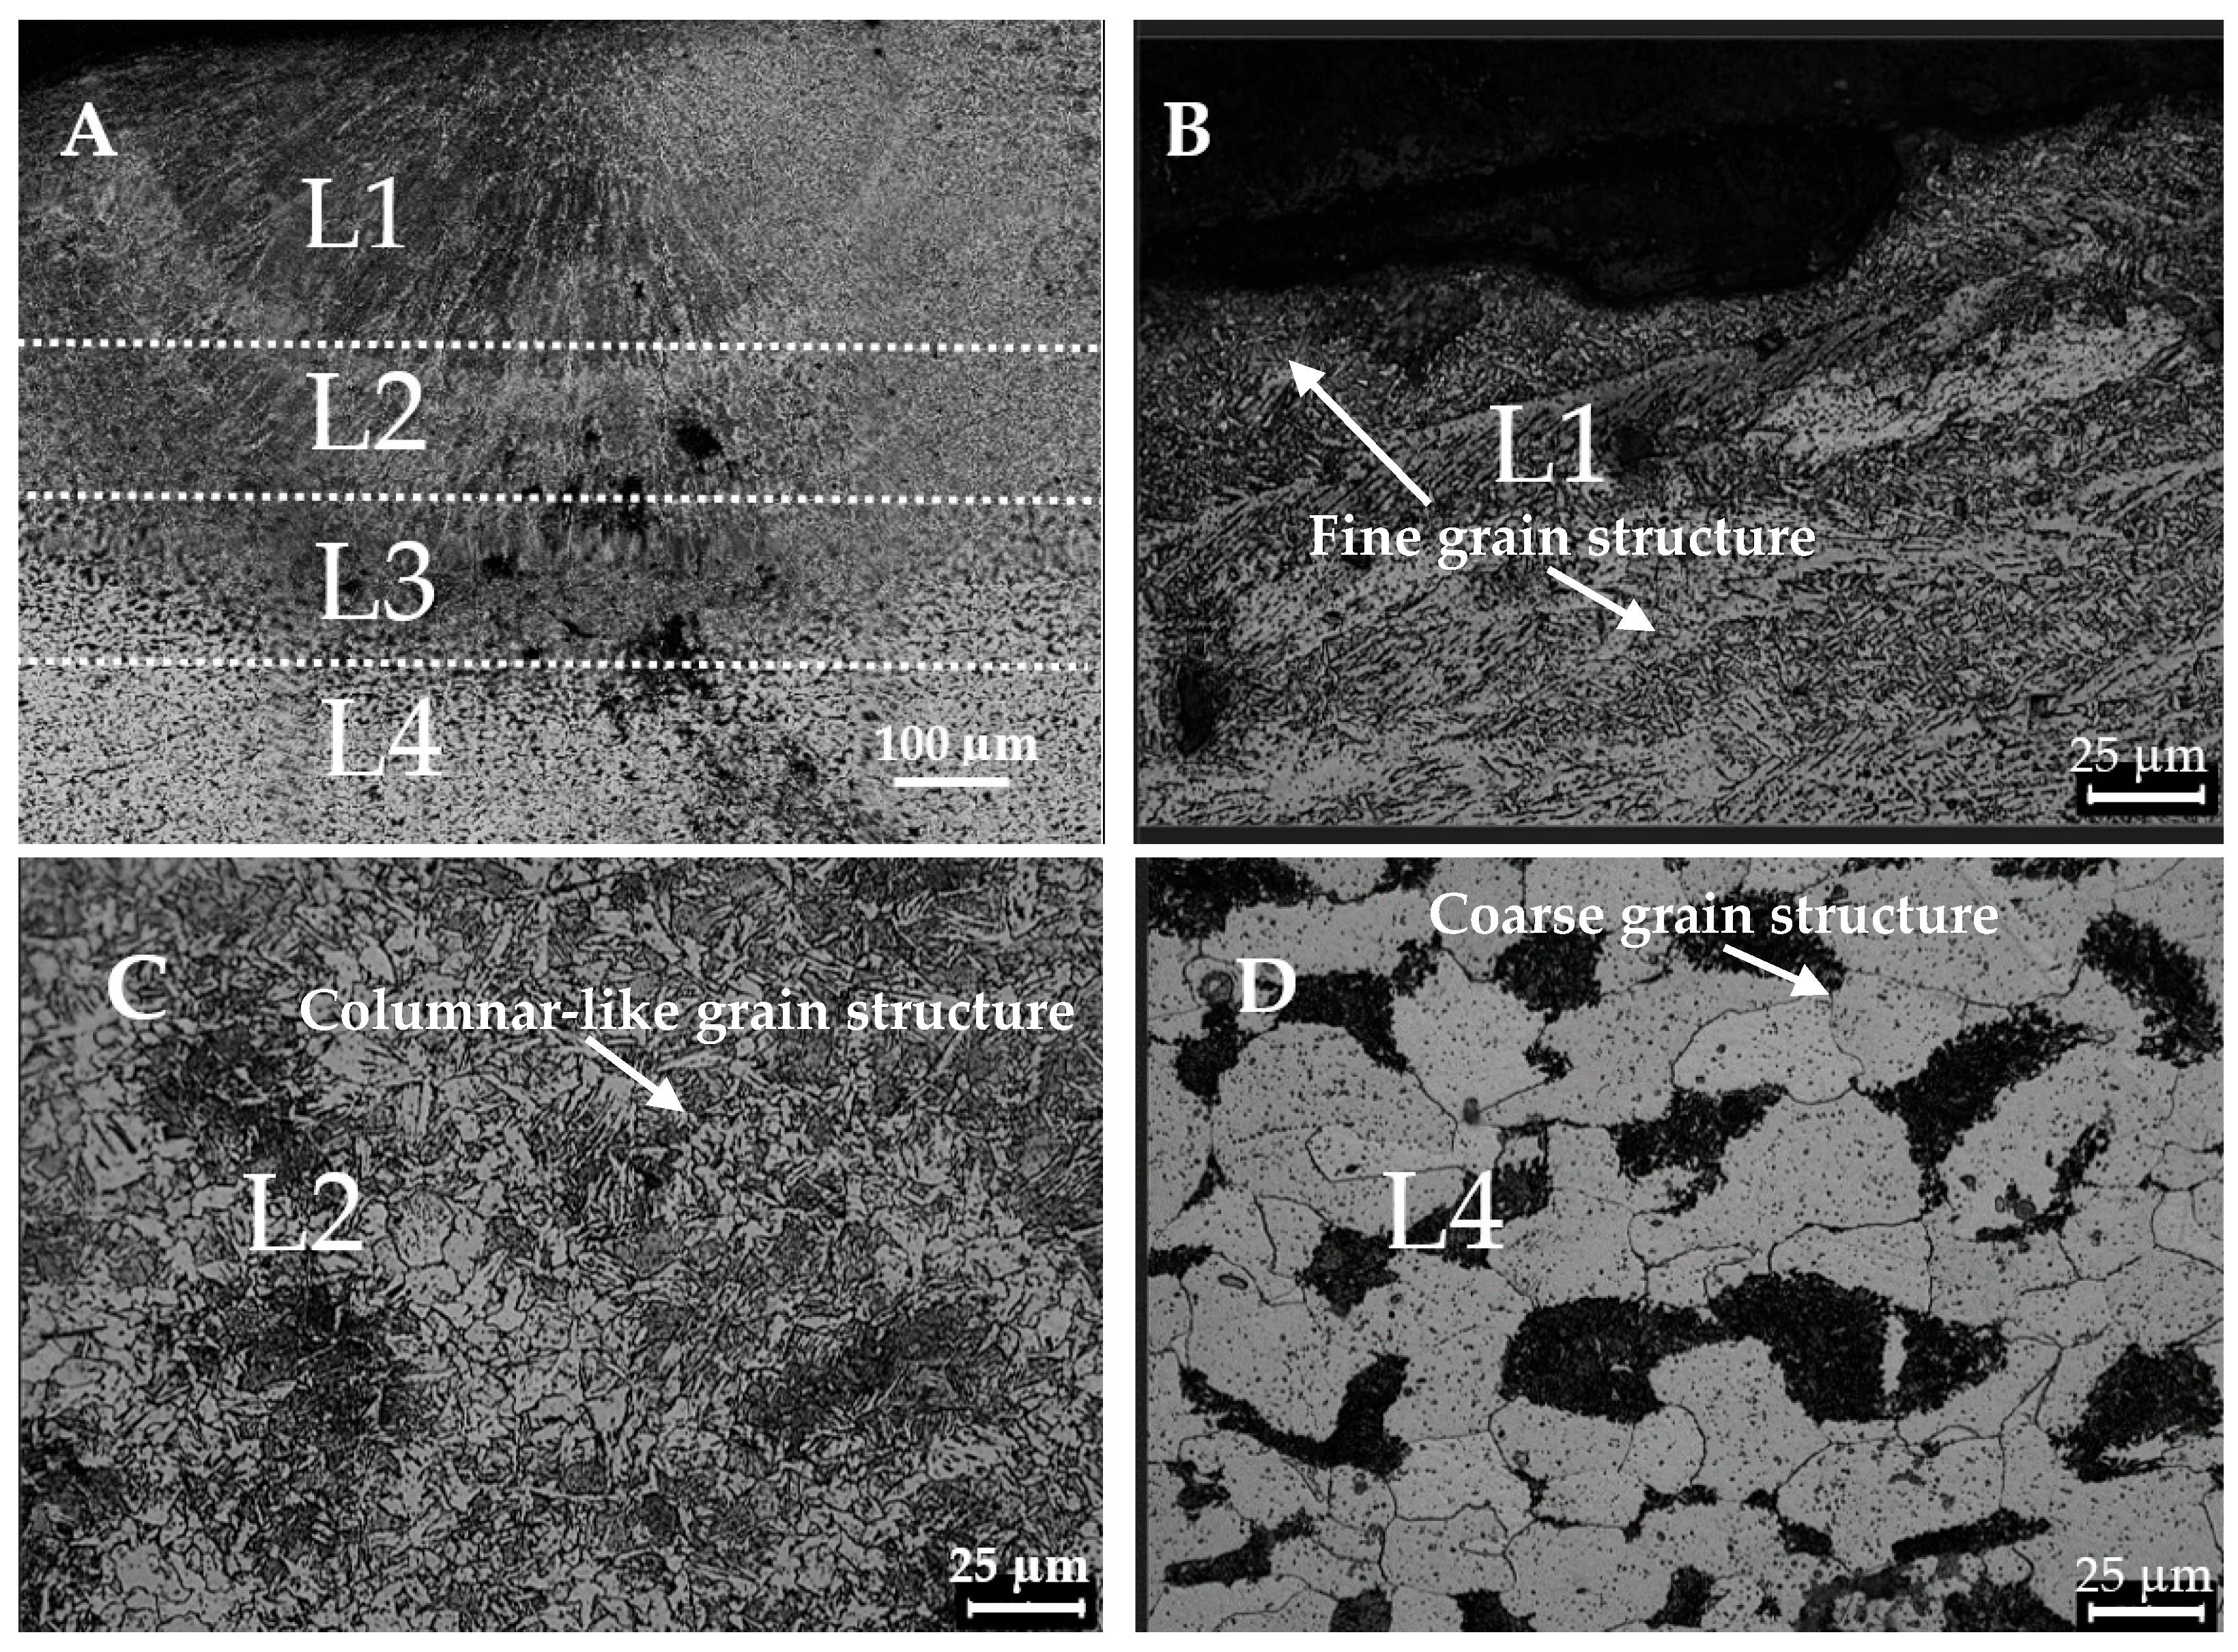
A cross-section of a sample coated with Ni containing 30 µm TiO2 particles is shown in Figure 4. The dimensions of the treated region on each pass were measured to be approximately 350 µm wide and 1200 µm wide. The treated region’s microstructure appears to contain four distinct layers, with variations in colour and grain structure. The micrograph reveals a four-layer cladded structure. The outermost layer (L1) exhibits a fine-grained plate-like microstructure, indicative of a rapid solidification process. The second layer (L2) displays a columnar grain structure with elongated grains perpendicular to the interface, suggesting a slower solidification rate. The third layer (L3) presents a mixed microstructure with equiaxed and columnar grains, indicating a transition zone. Finally, the innermost layer (L4) exhibits a coarse-grained equiaxed microstructure, consistent with a slower solidification rate and potential thermal cycling effects. This layer is similar to the parent material’s microstructure, which comprises two distinct phases with equiaxed grains of ferrite and pearlite. The microstructure present in L1 is consistent with the microstructure observed in the as-received steel substrate. The distinct microstructural variations across the layers likely arise from differences in solidification conditions, such as cooling rates and thermal gradients, during the cladding process.
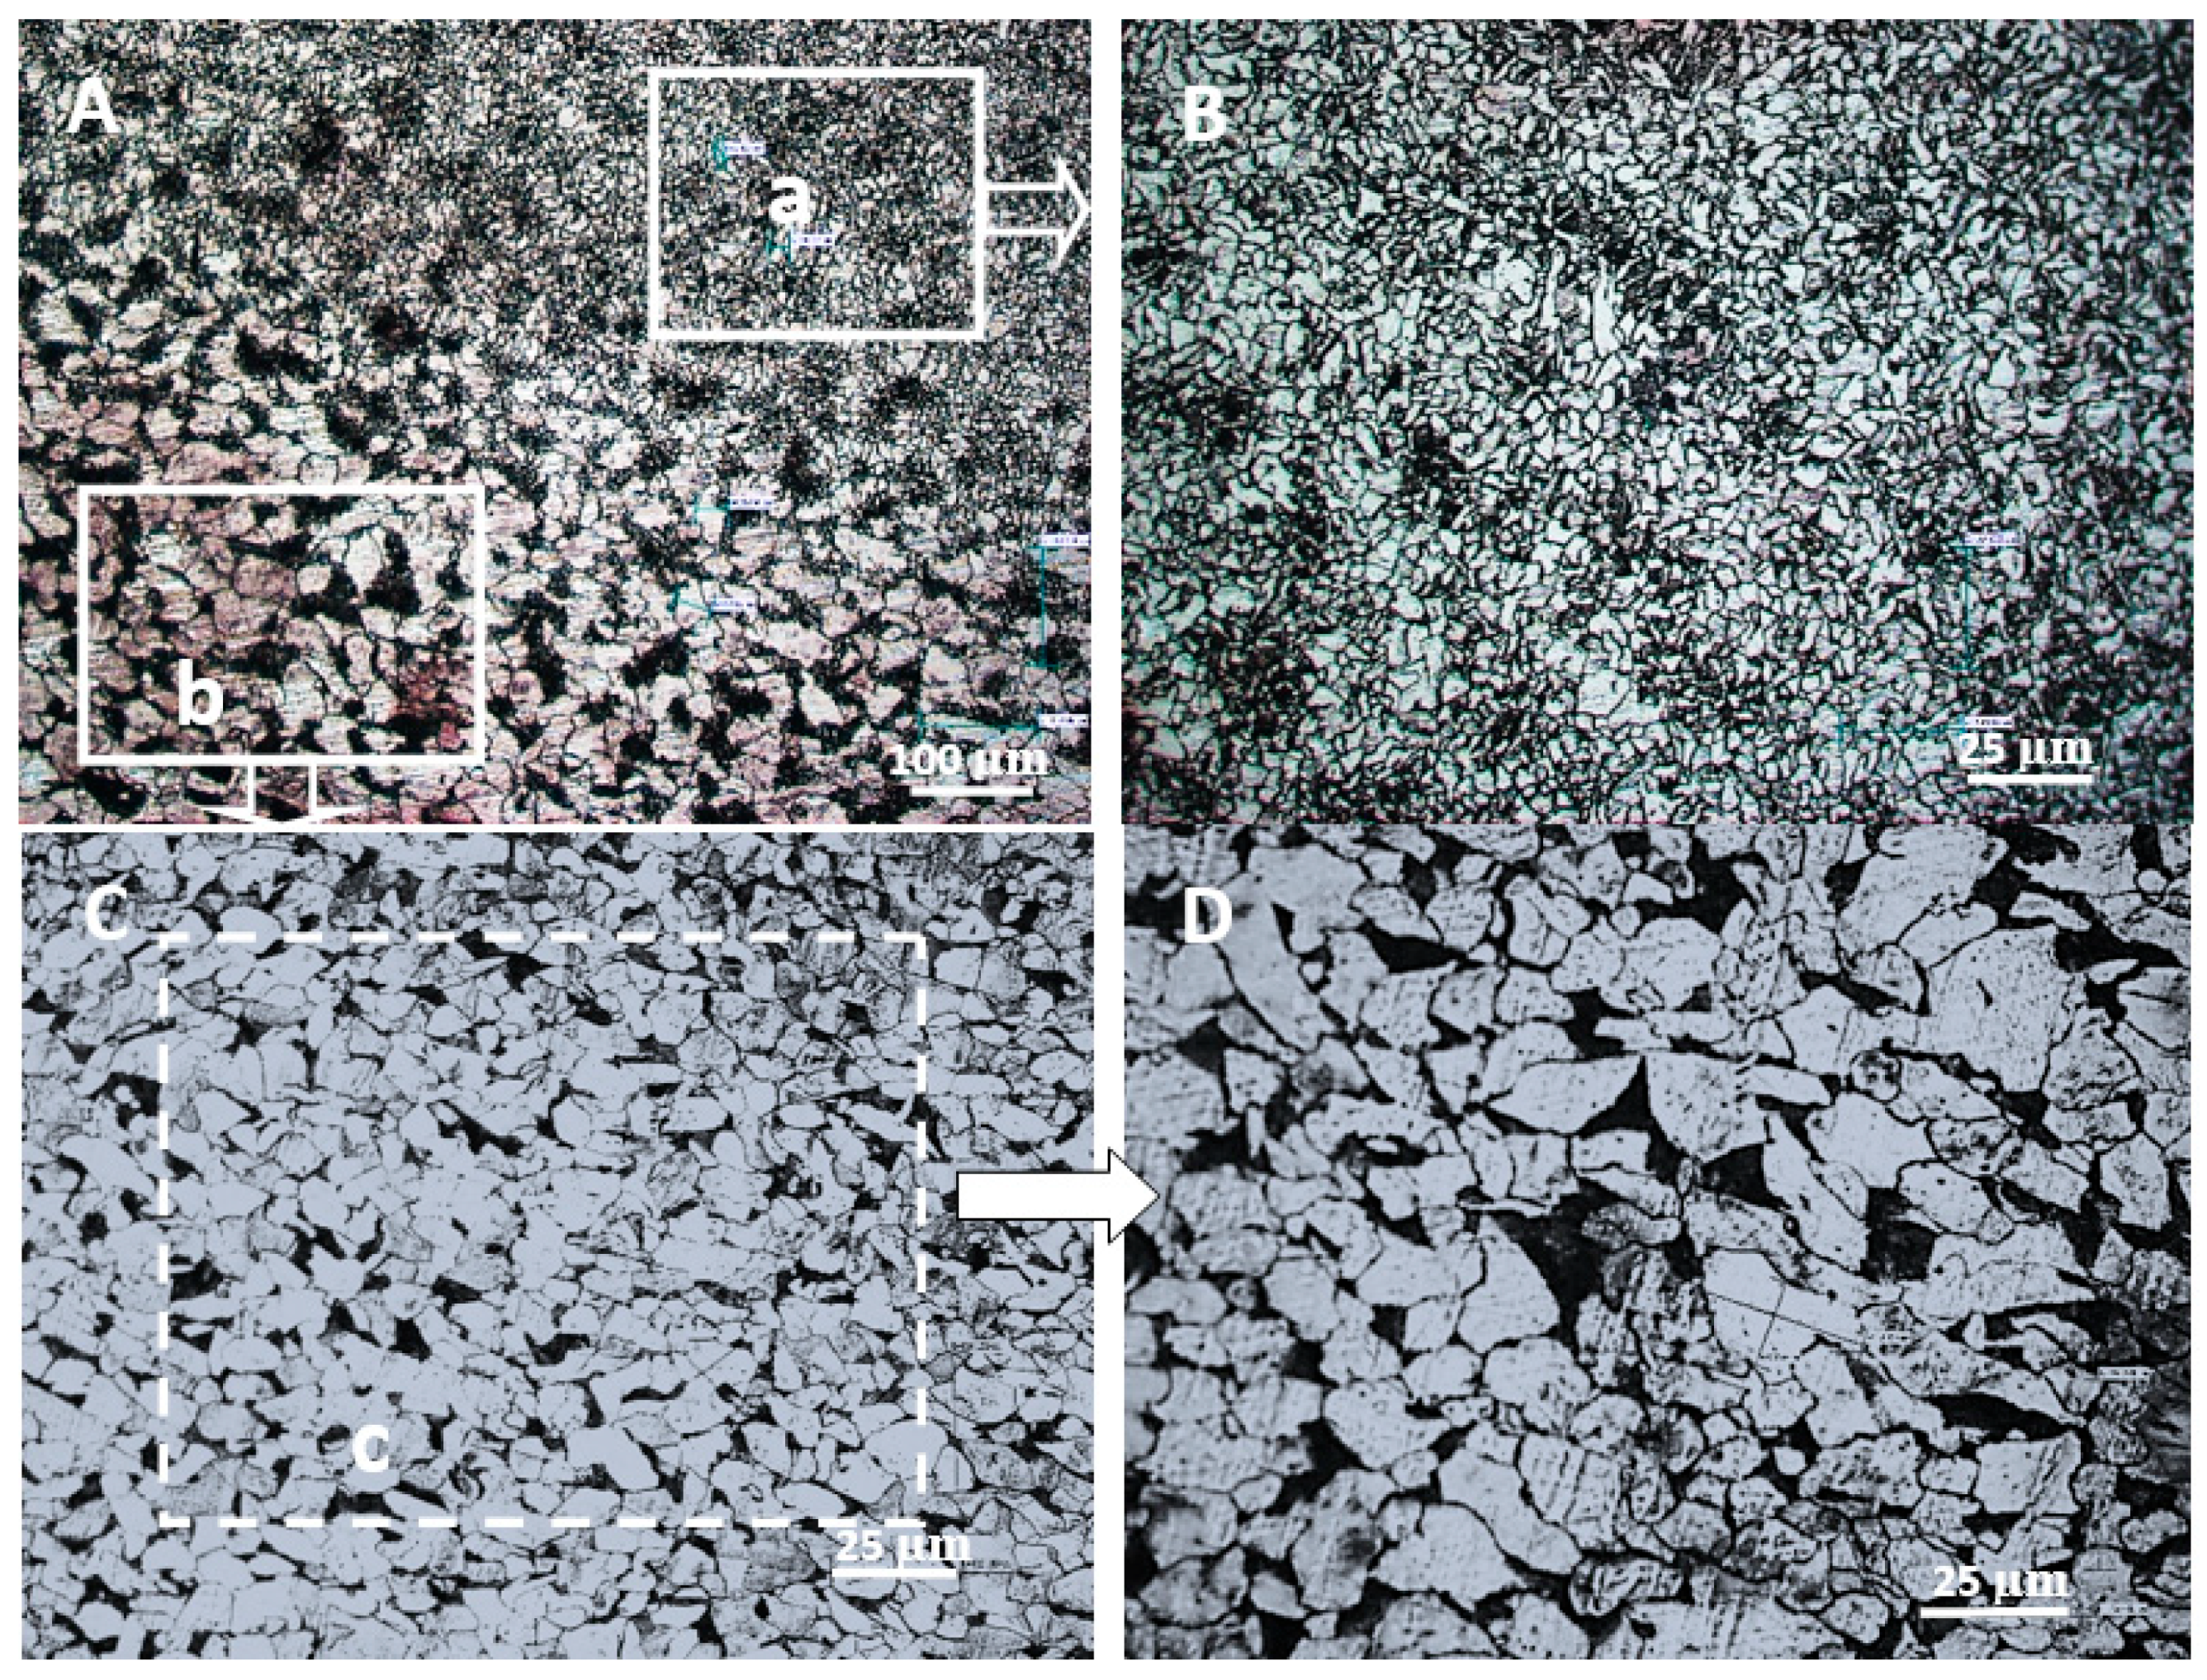
Figure 5 shows a cross-section of a sample coated with Ni containing 250 µm TiO2 particles. The micrograph reveals a cladded structure comprising two distinct layers labelled a and b. The top layer exhibits a fine-grained, equiaxed microstructure, indicative of a rapid solidification process. The bottom layer, in contrast, displays a coarser-grained, equiaxed microstructure, suggesting a slower solidification rate. The distinct microstructural variations between the layers likely arise from differences in solidification conditions, such as cooling rates and thermal gradients, during the Tig cladding process, as well as compositional changes due to the solid solution and the dispersion strengthening of the layers closest to the surface by the Ni and TiO2 particles. The interface between the two layers appears relatively sharp, suggesting minimal intermixing between the materials.
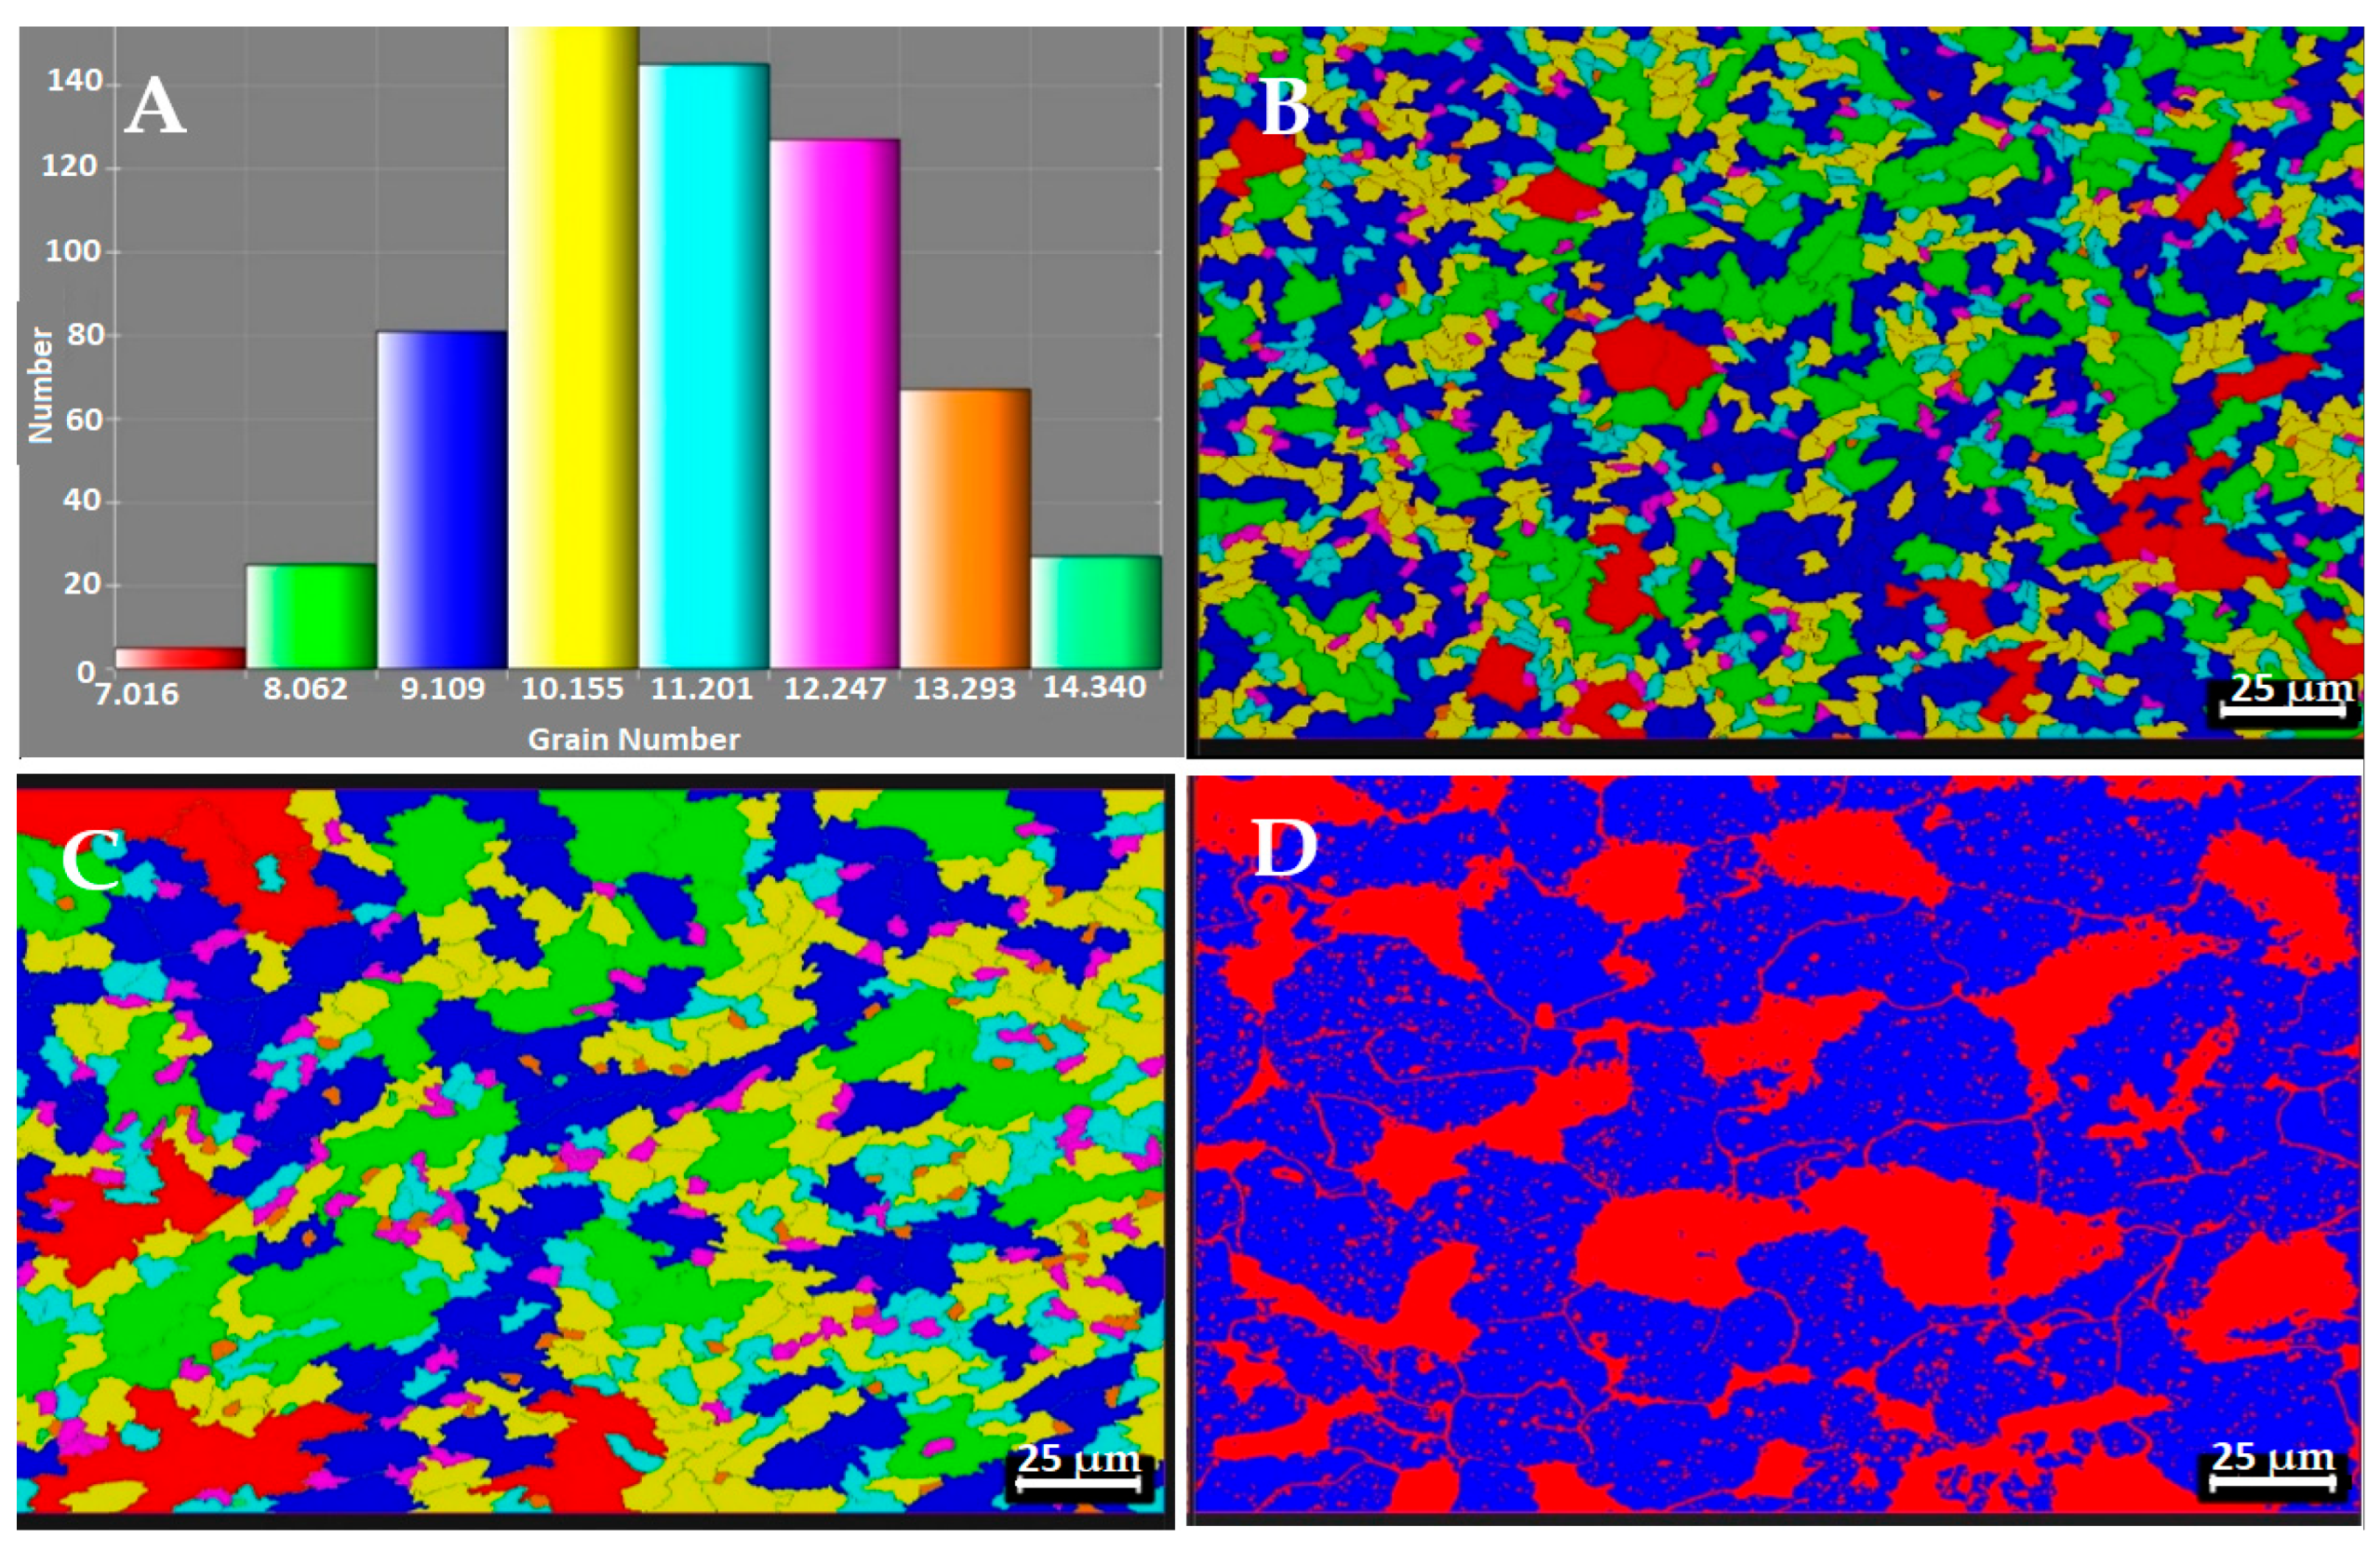
The microstructure shows a variation in the grain structure of the sample, moving from the immediately treated surface towards the sample’s centre. Several distinct regions were identified in both samples coated with Ni containing 30 µm TiO2 particles and those coated with Ni containing 250 µm TiO2 particles. The variation in the grain size from the bulk material to the treated layer shows a significant reduction in grain size in all samples treated. However, the samples containing 30 µm TiO2 particles experienced the most significant grain size reduction. The high temperature reached and the melting and mixing of the coating constituents into the base metal leads to the formation of fine microstructure. As the depth from the surface layer increases, the size of the grains increases, as illustrated in Figure 6B–D, which are closer in size and shape to the base metal microstructure. The results are consistent with the expected temperature profile generated across the samples treated. The grain size variation across the treated sample is summarised in the frequency chart provided in Figure 6A. Grain refinement is a key strengthening mechanism in steel’s surface treatment. The solid solution elements from the Ni coating and TiO2 nanoparticles can also promote grain refinement by inhibiting grain growth during processing. This results in a finer grain size, strengthening the steel through the Hall–Petch effect, which shows that the change in the hardness of a material is inversely proportional to the square root of the grain size. This means that a finer grain size results in a higher hardness [30,31,32].
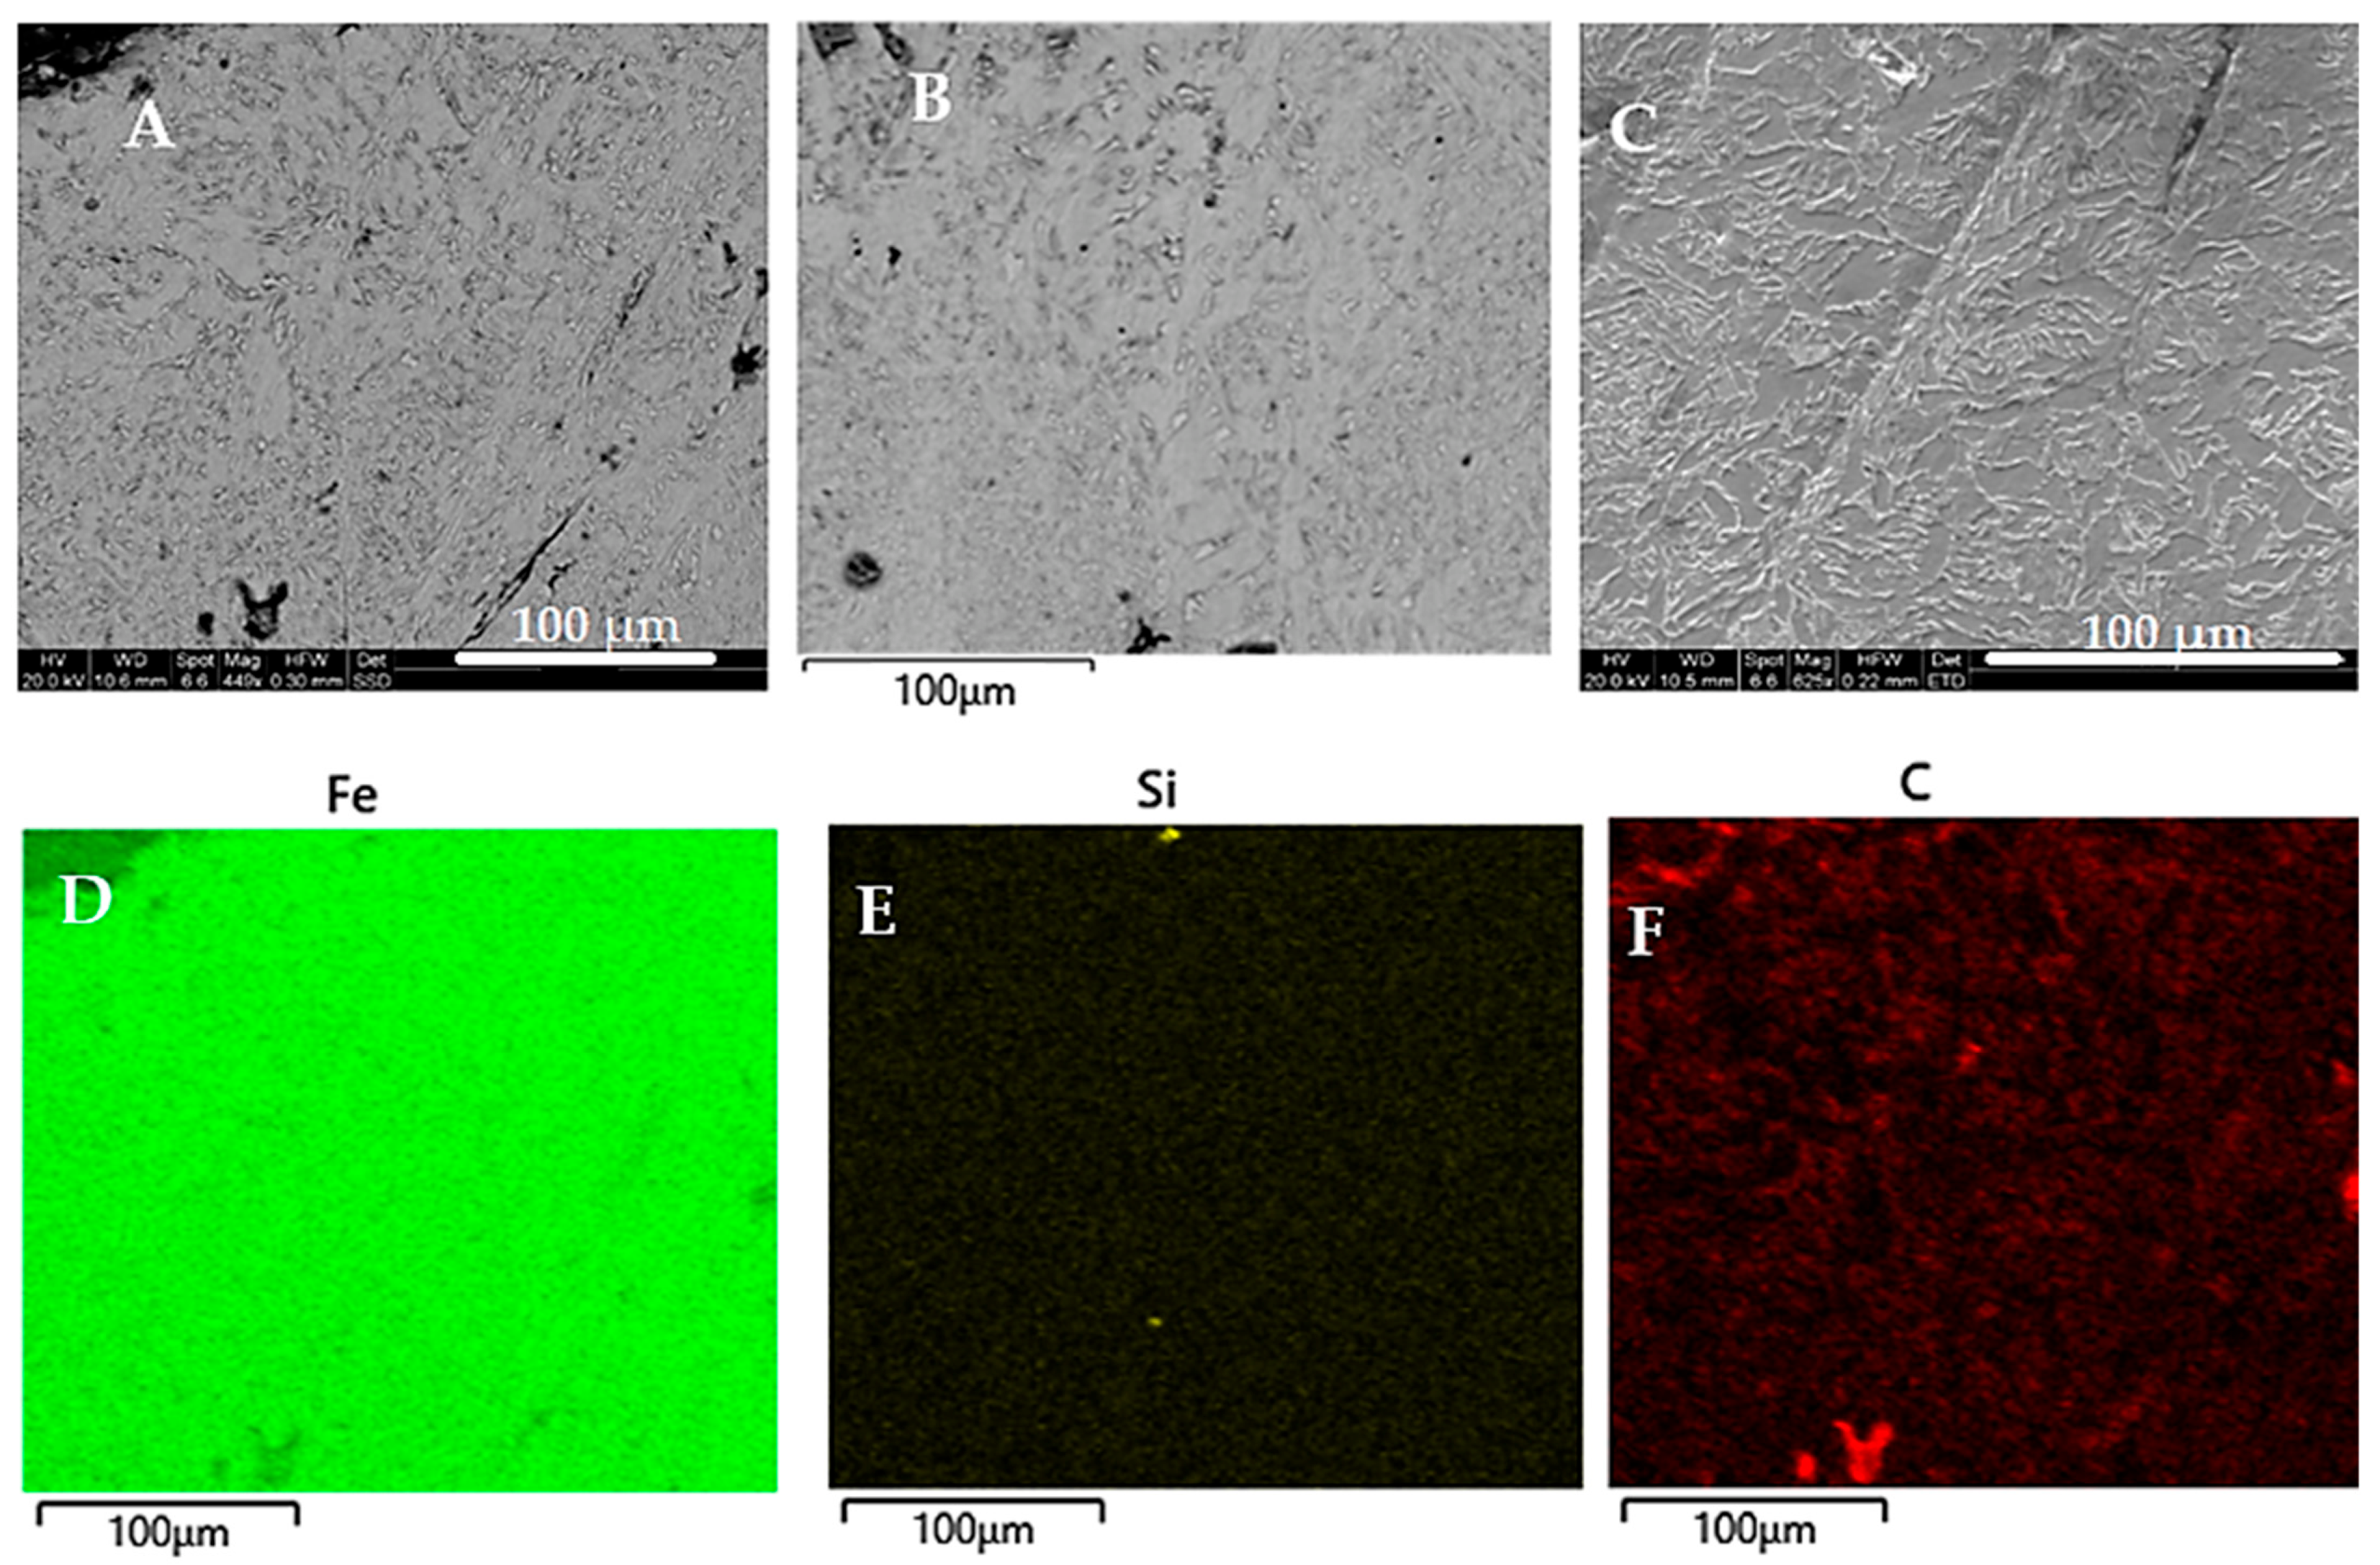
The composition of the treated steel surface was characterised by laser-induced breakdown spectroscopy (LIBS), and the spectrum is shown in Figure 7. The results of the LIBS analysis show that in addition to the elements present in the base metal, as shown in Table 1, there were also strong peaks for Ni and Ti. Further analysis of the samples coated with Ni containing 30 nm TiO2 particles using a scanning electron microscope (SEM) revealed a fine plate-like grain structure throughout the treated region, as shown in Figure 8A–C. Small grain size may improve mechanical properties such as strength and toughness. EDS mapping of the treated surface confirms that in addition to the elements, such as C, Fe, Si, and Mn, present in the base metal, the EDS maps also highlight the presence of silicon (Si) in the sample. The distribution appears uneven, with higher concentrations in certain regions. Silicon can improve the mechanical properties of steel, such as strength and hardness. However, uneven distribution may lead to localised variations in properties.
This map also shows a relatively uniform distribution of Ni and Ti in the coating layer, with some areas exhibiting higher concentrations. Nickel is a strong alloying element that improves the properties of steel. The presence of Ni and Ti throughout the treated layer suggests that the coating was completely mixed into the metal surface. The microstructural changes can be attributed to the integration of Ni and TiO2 into the treated layer, consistent with the coating’s decomposition.
The Ni from the coating is expected to strengthen steel by forming a solid solution within the bilk material. This distorts the crystal lattice, making it more difficult for dislocations to move. The relative importance of each of these strengthening mechanisms depends on the specific microalloying elements used, the processing conditions, and the steel composition. The amount of solid solution strengthening depends on the concentration and size of the micro-alloying elements [33].

3.2. Hardness Testing

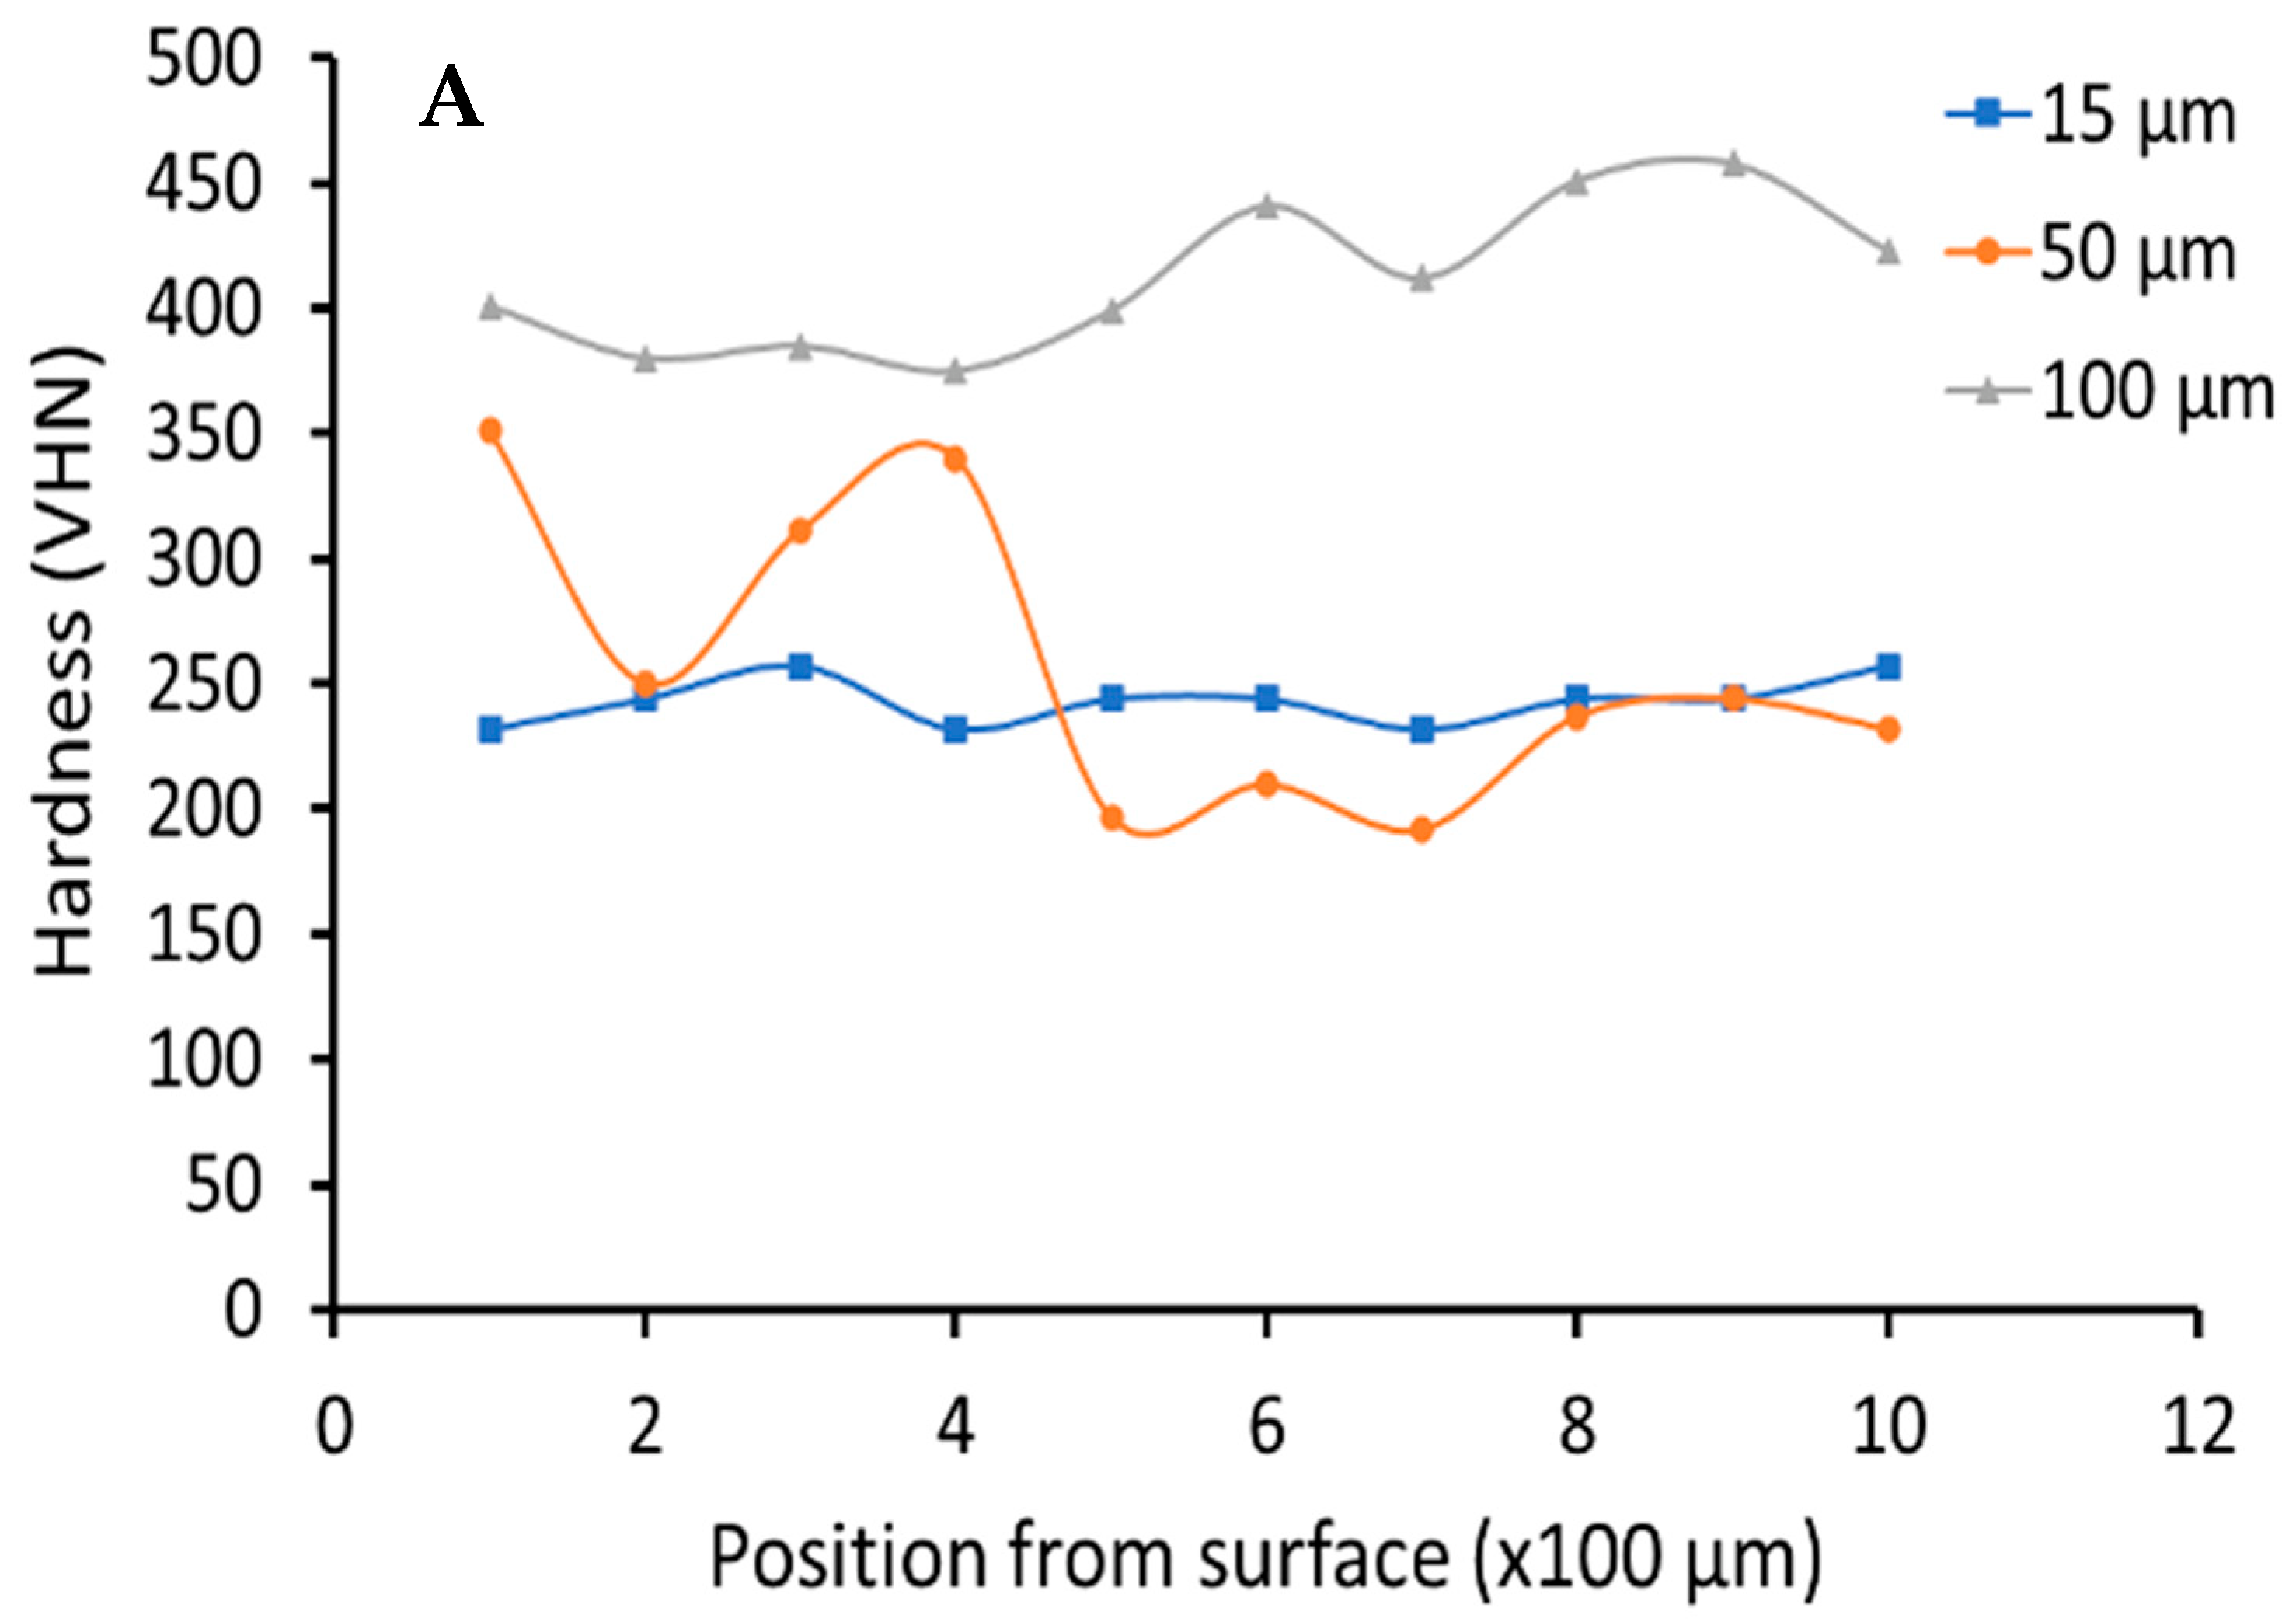
The mechanical changes due to modification of the composition within the treated layer as a function of the thickness of the electrodeposited coating are presented in Figure 9A. The graph shows the hardness profile along the cross-section perpendicular to the treated surface of the sample. The sample coated with Ni had a maximum hardness of 250 VHN, which reduced to 240 VHN at 0.5 mm depth and continued reduction to 220 VHN at 1 mm. When 30 nm TiO2 particles were co-deposited into the coating and impregnated into the treated surface, the hardness of the treated surface fluctuated between 375 VHN and 451 VHN. The hardness profiles demonstrate a clear trend of decreasing hardness with increasing depth from the surface. The sample coated with the 100 µm thick coating exhibits the highest hardness, indicating a surface treatment or layer with enhanced mechanical properties. When the coating thickness was increased to 15 µm and 50 µm, profiles showed a more gradual decrease in hardness, suggesting a potential transition zone between the surface layer and the bulk material (see Figure 9B).
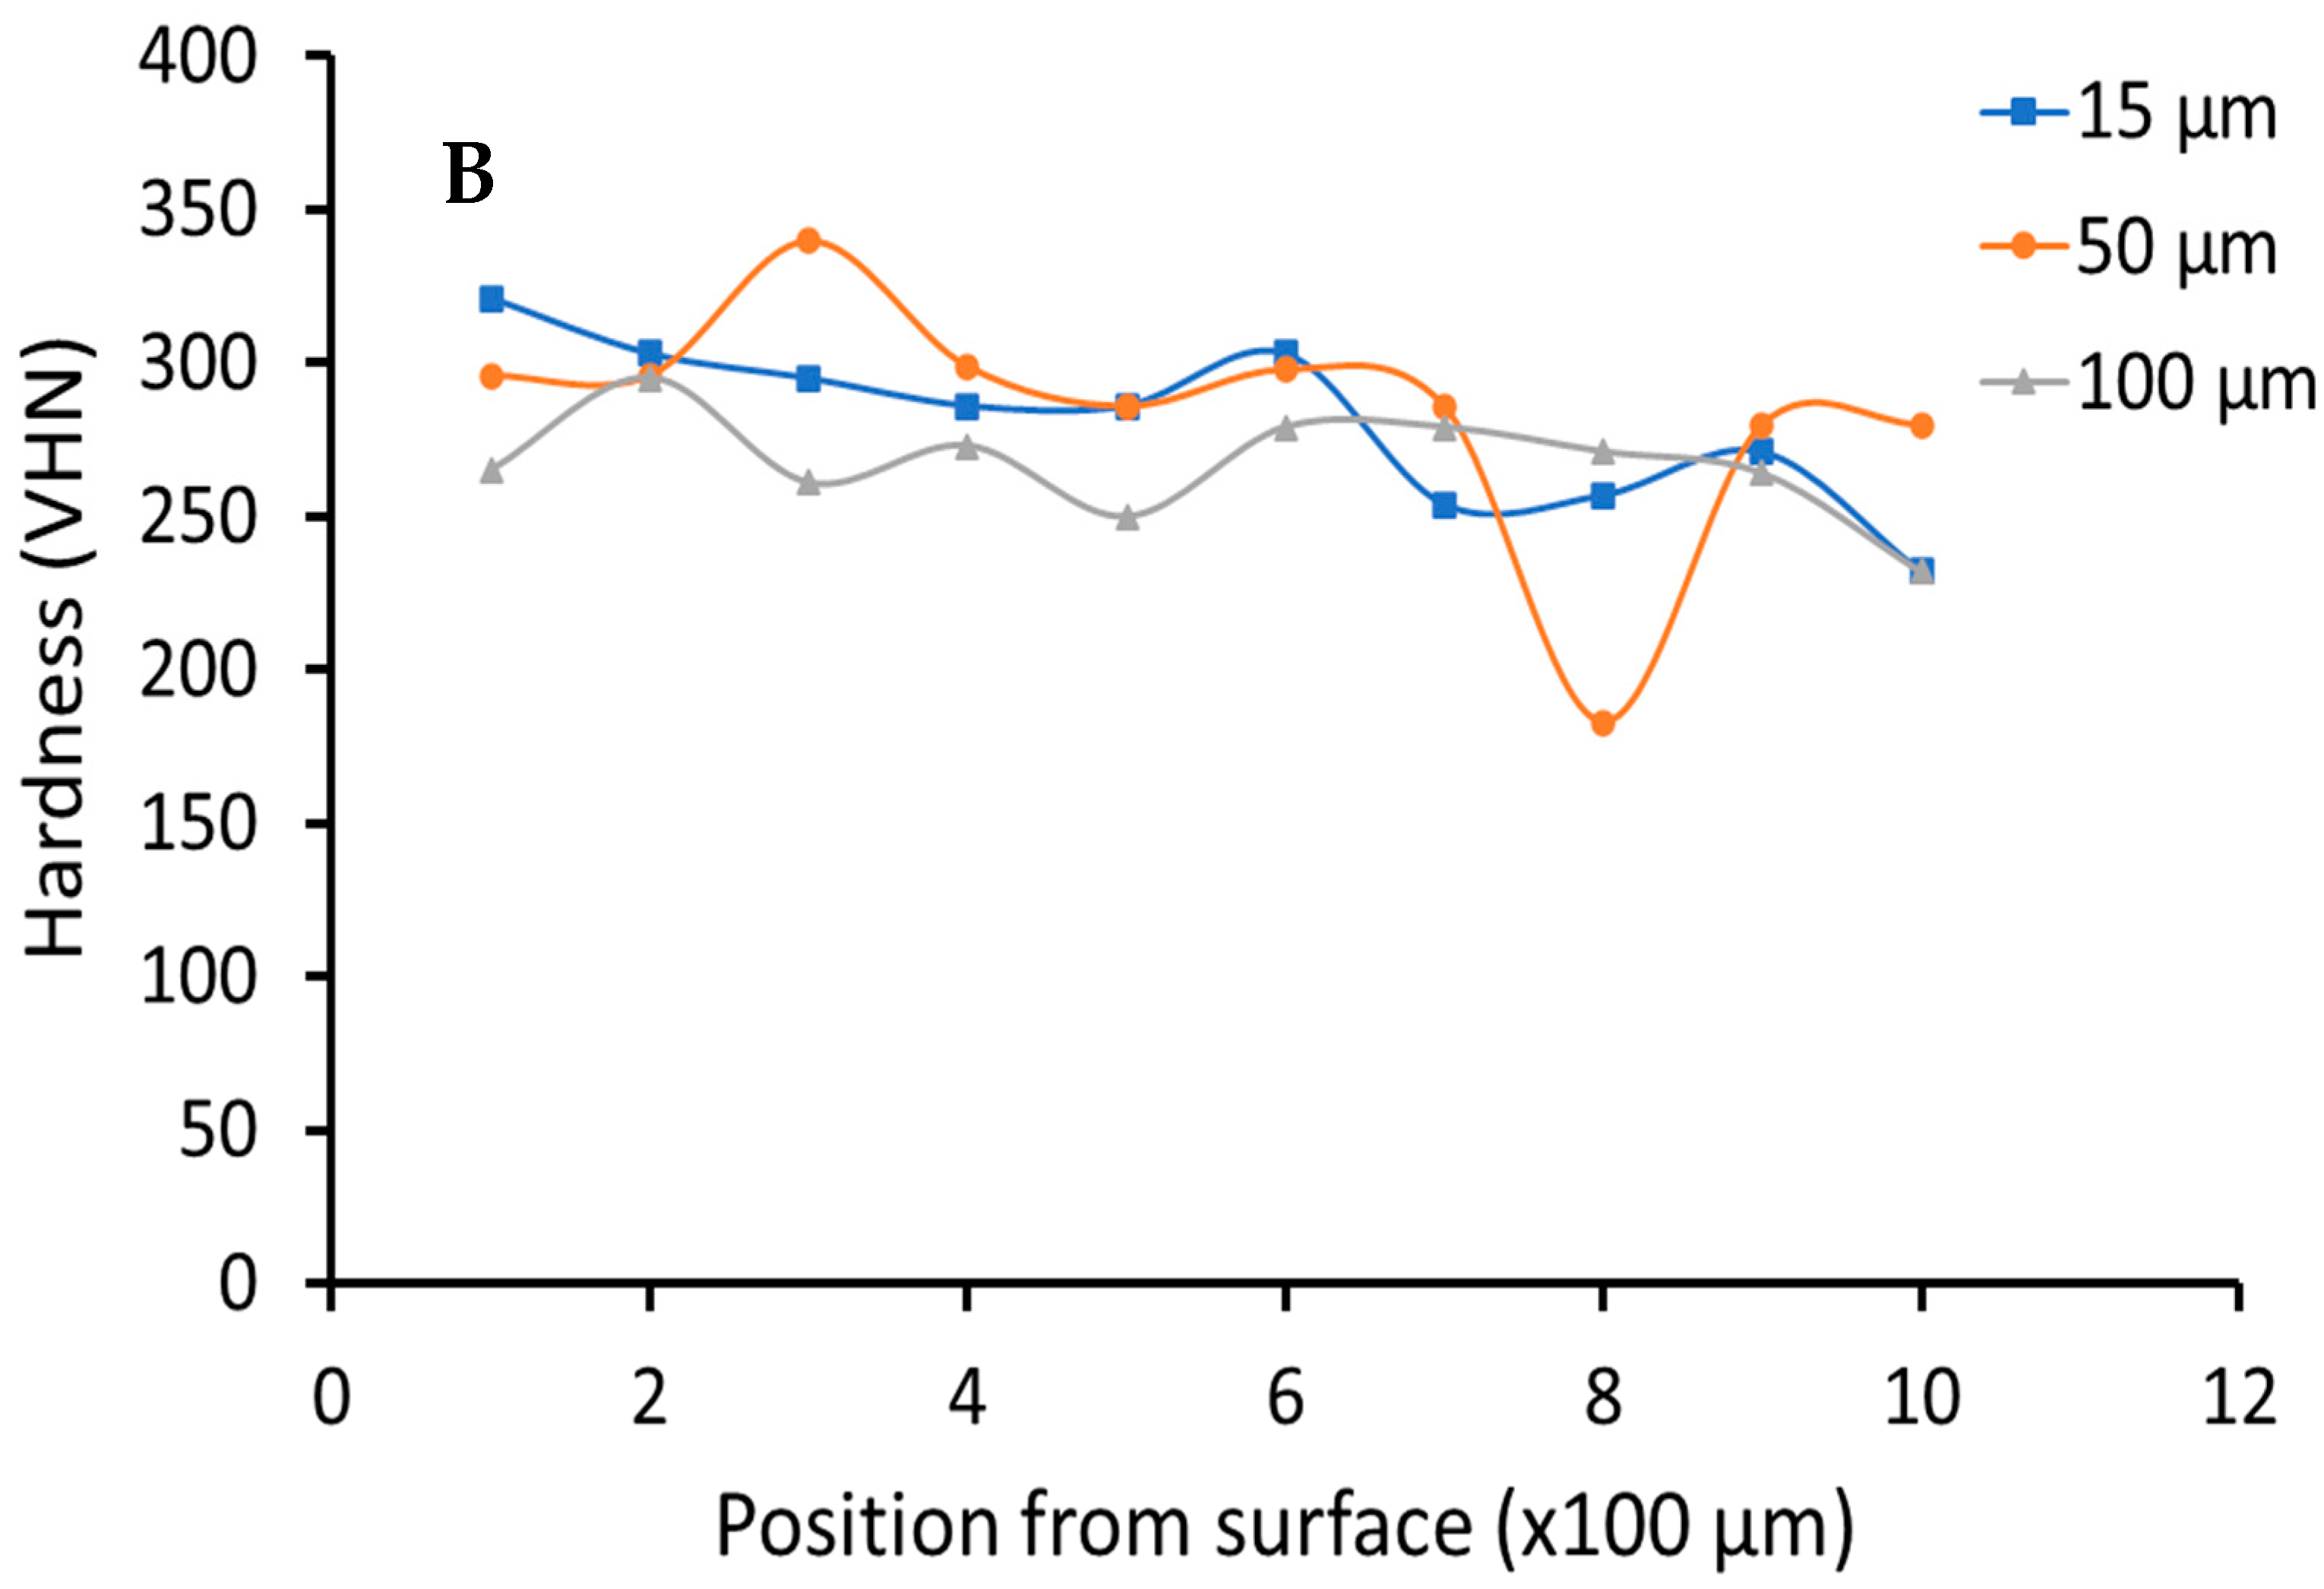
In comparison, the samples coated 250 nm TiO2 particles co-deposited into the coating and impregnated into the treated surface had a maximum surface hardness of 321 VHN. The hardness profiles demonstrate a clear trend of decreasing hardness with increasing depth from the surface. The 15 µm profile exhibits the highest hardness. In contrast, the 50 µm and 100 µm profiles show a more gradual decrease in hardness, suggesting a potential transition zone between the surface layer and the bulk material.
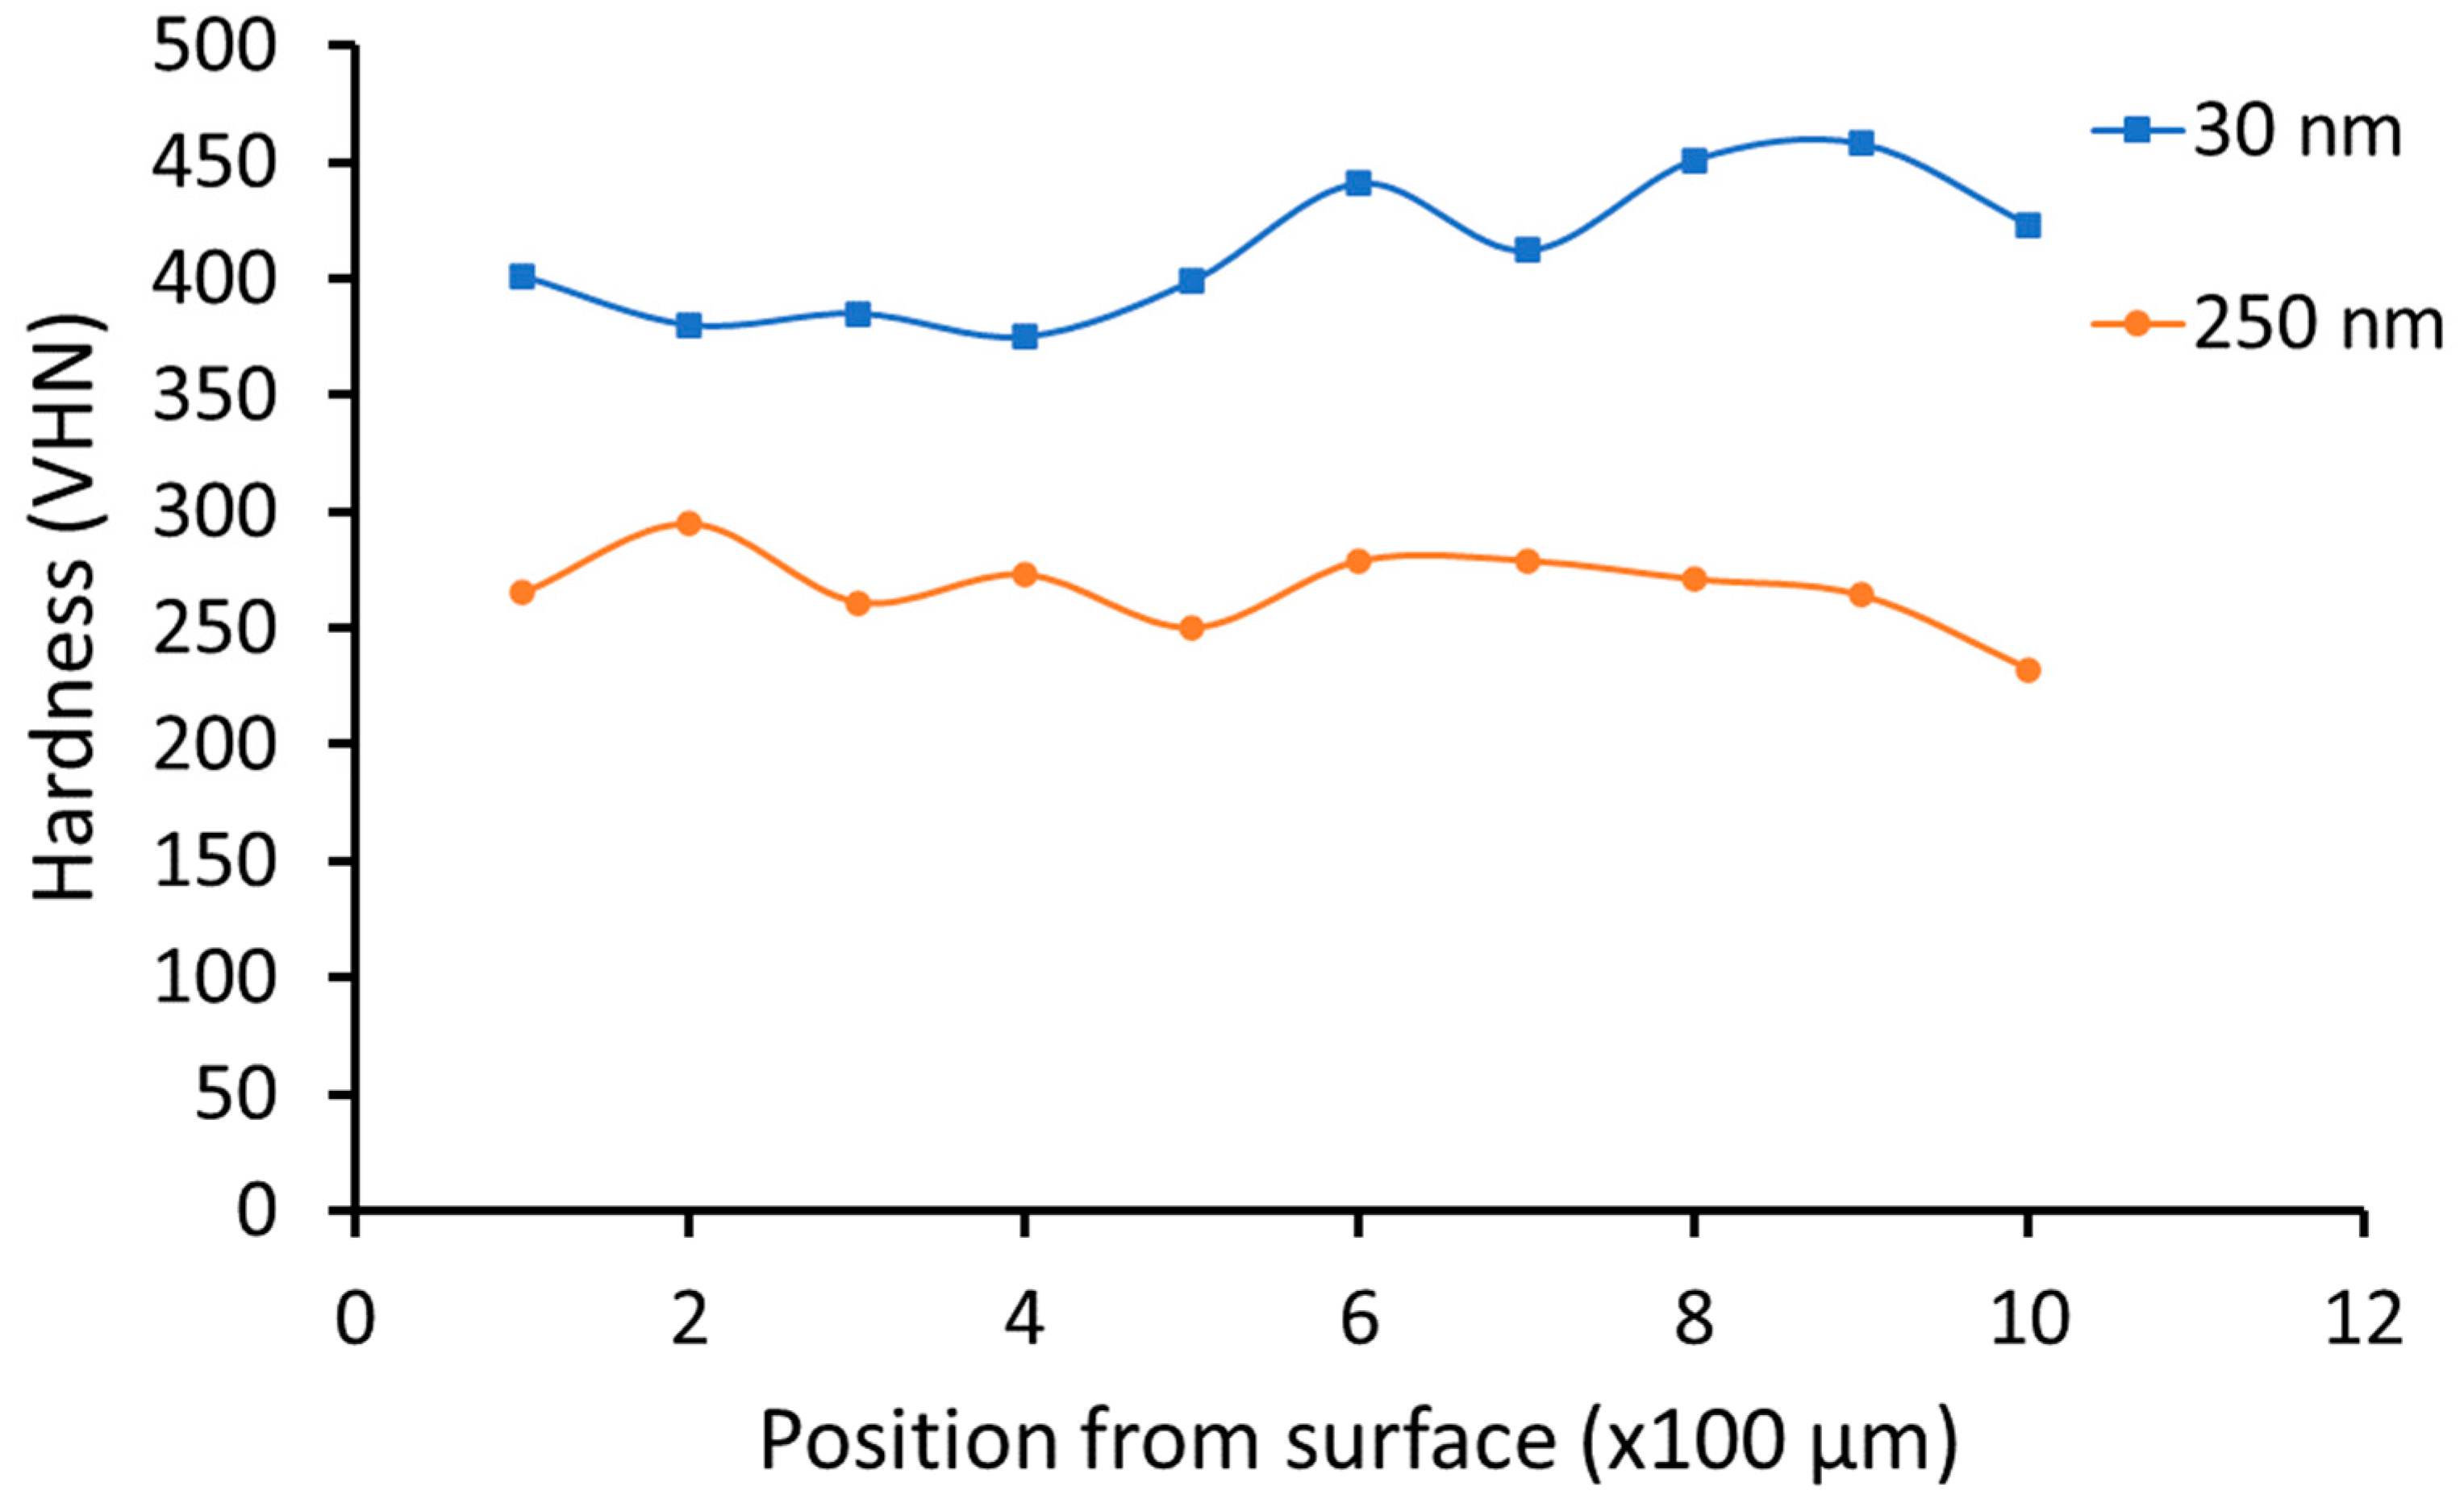
When the effect of particle size was studied, the results showed that the sample prepared with 30 nm with a thickness of 120 µm produced the surface with the highest hardness of 451 VHN. On the other hand, samples prepared with 250 nm TiO2 particles produced a hardness of 300 VHN for similar coating thickness (see Figure 10). The surface hardening of steel can be achieved through various methods. As indicated in a previous article [29,34], this two-step treatment process can activate three specific strengthening mechanisms: grain size reduction, solid solution strengthening and dispersion strengthening of the treated layer due to the mixing TiO2 and diffusion of Ni into the steel surface. The individual impact of grain size reduction can be estimated using Equation (1):
H g r a i n = K y d 1 / 2 ,
where K y is the Hall–Petch coefficient (material-specific), and d is the Average grain size.
The second mechanism is nanoparticle dispersion strengthening and is presented in Equation (2):
H n p =   K n p   x   V f 1 / 2   x   d n f 1 / 2 ,
where K n p is the strengthening coefficient related to particle-matrix interface strength, V f is the volume fraction of nanoparticles, and d n f is the average nanoparticle diameter. Finally, the third mechanism is solid solution strengthening:
H S S =   K s s     x   C n ,  
where K s s   is the solid solution strengthening coefficient, C is the concentration of solute atoms, and n is the exponent, typically between 0.5 and 1.
The effect of each mechanism can be estimated using a rule-of-mixtures model, which is a simple yet effective approach to modelling the combined impact of these mechanisms. This assumes that the overall hardness (H) is a linear combination of the individual contributions from each mechanism:
H = H o + H g r a i n + H n p + H S S ,  
where H o is the hardness of the untreated bulk material, H g r a i n is the hardness increment due to grain size reduction, H n p is the hardness increment due to the strengthening of nanoparticle dispersion, and H S S   is the hardness increment due to the strengthening of the solid solution.
In this study, the values selected from the literature show that mild steel has a hardness of 165 MPa [35]. Taking Ky = 19.26 MPa√m and d = 0.5 µm, the volume fraction of particles in the solution is 18.4 wt%, while Knp = 150 MPa√m, Kss = 130 MPa√m, n = 0.4, and C = 1 are estimated. Using the values listed above, the total of the strengthening effects can be calculated to be 439 MPa, which confirms the changes observed in the hardness results.

3.3. Wear Testing

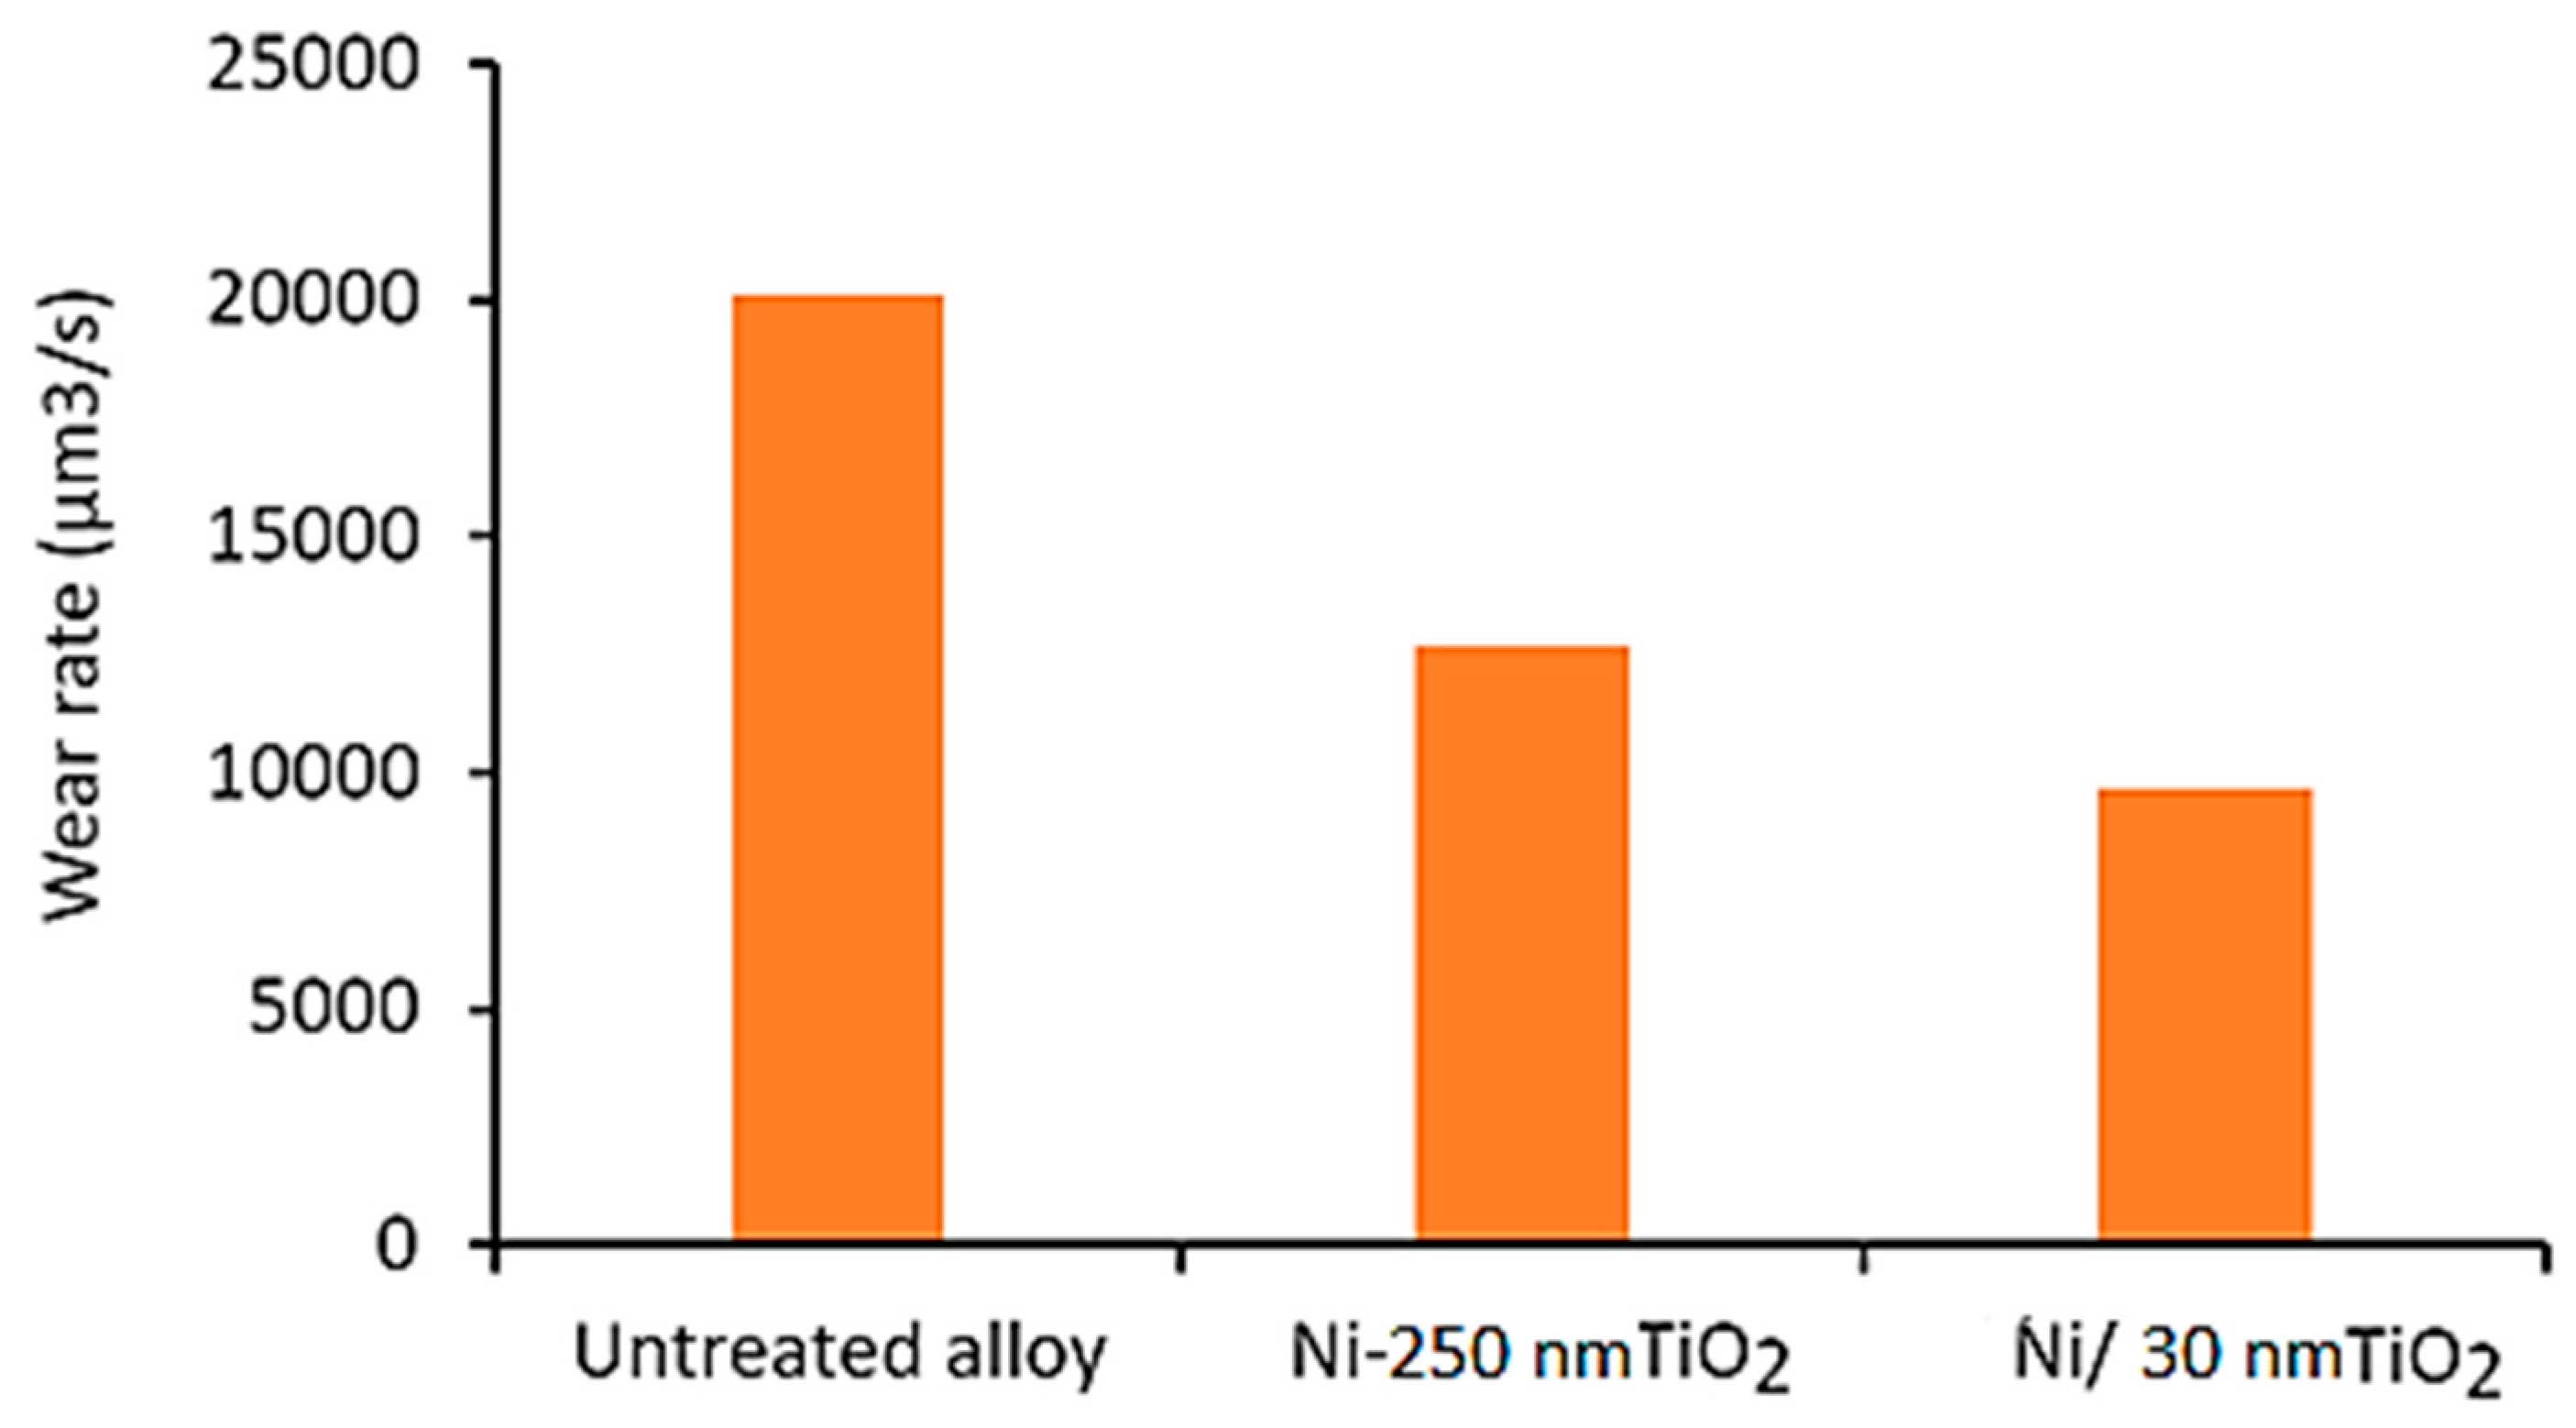
Figure 11 shows a comparison of the wear rate for the three types of samples tested. The result shows that in both cases, where the steel surface was coated and subsequently treated with a high-intensity arc, the wear rate of the sample coated with Ni-250 nm TiO2 particles was approximately half that of the untreated surface. When 30 nm TiO2 nanoparticles were co-deposited with the Ni matrix, the wear rate decreased by another 10%. The results confirm that the inclusion of finer nanoparticles has a positive impact on the wear rate of the sample.
The improvements observed in hardness and wear resistance can be attributed to the combined effects of grain size reduction, solid solution strengthening, and dispersion strengthening. Smaller grains have fewer slip systems available to support dislocation motion. Similarly, solid solution strengthening results in a distortion within the crystal lattice due to differences in the atomic radius of the atoms. The resulting distortion also reduces dislocation motion, causing an overall increase in the strength of the material. With the addition of TiO2 nanoparticles to the treated layer, the TiO2 nanoparticles are believed to have interacted with dislocations, pinning them in place and further impeding their movement, increasing the material’s resistance to plastic deformation and wear.
The worn surface of the Ni-250 nm TiO2 sample is presented in Figure 12A. The optical micrograph contains a series of parallel lines indicative of abrasive wear. Additionally, the image had several dark sections where it appeared that sections of the coatings had been removed during the wear-testing process. The wear scar appears as a series of parallel lines or grooves across the surface. The lines are dark in colour and are surrounded by a lighter-coloured background. There are also some small, dark spots scattered throughout the wear scar. Based on the appearance of the wear scar, the most likely mode of wear is abrasive wear. Abrasive wear occurs when hard particles or asperities come into contact with the surface and scratch or gouge the material. The parallel lines in the wear scar indicate abrasive wear, likely caused by hard particles rubbing against the surface.
The wear scar is relatively smooth, indicating that the abrasive particles were not very large or hard. Small, dark spots suggest that some material may have been removed from the surface during the wear process. The wear profile shown in Figure 12B confirms a wear track depth of approximately 17 µm.
Compared to the sample coated with Ni-30 nmTiO2 and treated with TIG arc, the worn surfaces contained similar parallel groves, indicative of abrasive wear (see Figure 13A). Large fibrous regions were observed where large coating sections were removed during the wear test. However, the depth of the wear track was approximately 14 µm. The difference observed in the wear track’s depth, and the samples’ wear rate confirmed that the treated surface experienced greater wear resistance than the untreated surface. Like the Ni-250 nmTiO2 sample, the wear scar appears as a series of parallel lines or grooves running across the surface. The lines are dark in colour and surrounded by a lighter-coloured background. There are also some small, dark spots scattered throughout the wear scar. Based on the appearance of the wear scar, the most likely mode of wear is abrasive wear. Small, dark spots suggest that some material may have been removed from the surface during the wear process.

4. Conclusions

In this study, a novel two-step process was applied, which involved embedding nanoparticles into the surface of mild steel. This method entails depositing a Ni/TiO2 composite coating onto the steel substrate, followed by treatment with a high-temperature arc generated during TIG welding of the coated substrate. The treated surface was characterised by microhardness, wear resistance, and microstructural and compositional changes. The results confirm that steel surface hardening was achieved using the novel two-step process described in this study.
The data show that for samples coated with Ni containing 30 µm TiO2 particles and those coated with Ni containing 250 µm TiO2 particles, there was a significant reduction in the grain size from the bulk material to the treated layer. However, while all samples coated experienced a reduction in grain size, the samples containing 30 µm TiO2 particles experienced the most significant grain size reduction.
The results show that in both cases, the hardness of the sample increases substantially above that of the untreated steel substrate. Samples coated with Ni containing 30 nm TiO2 particles had a maximum hardness of 451 VHN and greater wear resistance than the untreated samples and those coated with Ni containing 250 nm TiO2 particles. The surface hardening of steel was attributed to three principal mechanisms: grain size reduction, solid solution strengthening, and dispersion strengthening.
The thickness of the coating has also been shown to affect surface hardness positively. The worn surfaces contained similar parallel groves, indicative of abrasive wear. In addition, large fibrous regions were observed where large coating sections were removed during the wear test.
The reduction of the nanoparticles’ size has also positively impacted the hardness of the treated layer. The results showed that the sample prepared with 30 nm with a thickness of 120 µm produced the surface with the highest hardness of 451 VHN. Meanwhile, samples prepared with 250 nm TiO2 particles produced a hardness of 300 VHN for similar coating thickness.
The wear rate of the sample coated with Ni-250 nm TiO2 particles was approximately half that of the untreated surface. When 30 nm TiO2 nanoparticles were co-deposited with the Ni matrix, the wear rate decreased by another 10%. The results confirm that the inclusion of finer nanoparticles positively impacts the wear rate of the sample.

Author Contributions

Conceptualization, K.O.C.; Methodology, A.M., J.C. and A.A.H.; Formal analysis, K.O.C.; J.C. and A.A.H.; Investigation, K.O.C., J.C. and A.A.H.; Writing—original draft, K.O.C. and A.M.; Supervision, K.O.C.; Project administration, K.O.C.; Funding acquisition, K.O.C. All authors have read and agreed to the published version of the manuscript.

Funding

This research received no external funding.

Data Availability Statement

The original contributions presented in this study are included in the article. Further inquiries can be directed to the corresponding author.

Conflicts of Interest

The authors declare no conflict of interest.

References

  1. Jurči, P. History, developments and trends in the heat treatment of steel. Materials 2020, 13, 4003. [Google Scholar] [CrossRef] [PubMed]
  2. Lakkannavar, V.; Yogesha, K.B.; Prasad, C.D.; Mruthunjaya, M.; Suresh, R. A Review on Tribological and Corrosion Behaviour of Thermal Spray Coatings. J. Inst. Eng. India Ser. D 2024. [Google Scholar] [CrossRef]
  3. Cooke, K.O. Parametric Analysis of Electrodeposited Nano-composite Coatings for Abrasive Wear Resistance. In Electrodeposition of Composite Materials; InTech: Penang, Malaysia, 2016. [Google Scholar] [CrossRef]
  4. Cooke, K.O.; Khan, T.I.; Shar, M.A. Effect of heat-treatment on the thermal and mechanical stability of Ni/Al2O3 nanocrystalline coatings. J. Manuf. Mater. Process. 2020, 4, 17. [Google Scholar] [CrossRef]
  5. Eo, D.R.; Chung, S.G.; Yang, J.H.; Cho, W.T.; Park, S.H.; Cho, J.W. Surface modification of high-Mn steel via laser-DED: Microstructural characterization and hot crack susceptibility of clad layer. Mater. Des. 2022, 223, 111188. [Google Scholar] [CrossRef]
  6. Balbande, S.; Paraye, N.K.; Das, S. Surface Modification of Steel via In Situ Formed Tantalum Carbide Through TIG Arcing. Met. Mater. Trans. A Phys. Met. Mater. Sci. 2023, 54, 1–5. [Google Scholar] [CrossRef]
  7. Leitner, M.; Pichler, P.; Steinwender, F.; Guster, C. Wear and fatigue resistance of mild steel components reinforced by arc welded hard layers. Surf. Coat Technol. 2017, 330, 140–148. [Google Scholar] [CrossRef]
  8. Ci, W.; Chen, X.; Dai, X.; Liu, C.; Ma, Y.; Zhao, D.; Pan, F. Achieving ultra-high corrosion-resistant Mg-Zn-Sc alloys by forming Sc-assisted protective corrosion product film. J. Mater. Sci. Technol. 2024, 181, 138–151. [Google Scholar] [CrossRef]
  9. Hu, Z.; Zhang, D.; Wu, D.; Zheng, X.; Sun, J.; Geng, P.; Ma, N. Enhanced mechanical properties of Fe-based hardfacing alloy with Al additions fabricated by laser cladding. Surf. Coat Technol. 2024, 478, 130447. [Google Scholar] [CrossRef]
  10. Kong, H.; Liu, Y.; Ren, H.; Li, F.; Kang, K.; Tao, Y.; Sun, Q. Surface modification of mild steel via heterogeneous double-wire arc directed energy deposition: Microstructure and performance of cladding layer. Surf. Coat Technol. 2024, 482, 130751. [Google Scholar] [CrossRef]
  11. Dowling, M.; Al-Hamaoy, A.R.; Obeidi, M.A. Laser surface cladding of metal parts. Results Surf. Interfaces 2023, 12, 100142. [Google Scholar] [CrossRef]
  12. Qiu, F.; Kujanpää, V. Transformation hardening of medium-carbon steel with a fiber laser: The influence of laser power and laser power density. Mechanika 2011, 17, 318–323. [Google Scholar] [CrossRef]
  13. Sarkar, S.; Gopinath, M.; Chakraborty, S.S.; Syed, B.; Nath, A.K. Analysis of temperature and surface hardening of low carbon thin steel sheets using Yb-fiber laser. Surf. Coat Technol. 2016, 302, 344–358. [Google Scholar] [CrossRef]
  14. Yu, H.; Sun, F.; Zhang, J. Laser and plasma nitriding of titanium using CW-CO2 laser in the atmosphere. Curr. Appl. Phys. 2009, 9, 227–233. [Google Scholar] [CrossRef]
  15. Obeidi, M.A.; McCarthy, E.; Brabazon, D. Laser surface processing with controlled nitrogen-argon concentration levels for regulated surface life time. Opt. Lasers Eng. 2018, 102, 154–160. [Google Scholar] [CrossRef]
  16. Harnett, A.; Obeidi, M.A.; Ahad, I.U.; Al-Hamaoy, A.R. Comparing the surface hardness of mild steel processed with CO₂ and fibre lasers. Results Mater. 2023, 18, 100400. [Google Scholar] [CrossRef]
  17. Psyllaki, P.P.; Griniari, A.; Pantelis, D.I. Parametric study on laser nitriding of 1.5919 steel. J. Mater Process. Technol. 2008, 195, 299–304. [Google Scholar] [CrossRef]
  18. Kong, H.; Liu, Y.; Ren, H.; Li, F.; Kang, K.; Tao, Y.; Sun, Q. Corrosion and abrasion behavior of high-temperature carburized 20MnCr5 gear steel with Nb and B microalloying. J. Mater. Res. Technol. 2023, 25, 5845–5854. [Google Scholar] [CrossRef]
  19. Valente, E.H.; Jellesen, M.S.; Somers, M.A.J.; Christiansen, T.L. Gaseous surface hardening of Ti-6Al-4V fabricated by selective laser melting. Surf. Coat Technol. 2020, 383, 125278. [Google Scholar] [CrossRef]
  20. Zhang, Z.; Wang, D.; Liu, G.; Qian, Y.; Xu, Y.; Xiang, D. Surface Modification of 42CrMo Steels: A Review from Wear and Corrosion Resistance. Coatings 2024, 14, 337. [Google Scholar] [CrossRef]
  21. Zhang, G.; Wang, S.; Liu, S.; Guo, Y.; Liang, S.; Zhang, S.; Zhang, X.; Zhang, J.; Liu, R. Effect of annealing treatment on microstructure and mechanical properties of lightweight steels micro-alloyed with vanadium and niobium. Mater. Sci. Eng. A 2023, 886, 145700. [Google Scholar] [CrossRef]
  22. Balasubramanian, K.; Vikram, R.; Sambath, S.; Sowrirajan, M.; Arunachalashiva, M.; Abhijith, P.V.; Deepak, D. Optimization of flux cored arc welding parameters to minimize the dilution percentage of AISI 316L stainless steel cladding on mild steel. Int. J. Interact. Des. Manuf. 2023. [Google Scholar] [CrossRef]
  23. Tian, W.; Wang, Y.; Yang, Y.; Li, C. Toughening and strengthening mechanism of plasma sprayed nanostructured Al2O3-13 wt.%TiO2 coatings. Surf. Coat Technol. 2009, 204, 642–649. [Google Scholar] [CrossRef]
  24. Varis, T.; Lagerbom, J.; Suhonen, T.; Terho, S.; Laurila, J.; Vuoristo, P. On the Applicability of Iron-Based Coatings Against Abrasion and Cavitation Erosion Wear. J. Therm. Spray Technol. 2023, 32, 473–487. [Google Scholar] [CrossRef]
  25. Li, Y.; Meng, X.; Li, R.; Zeng, F.; Gu, Y. Effect of Ni Content on Microstructure and Performance of Ni/Ceramic Composite Coating. J. Mater. Eng. Perform. 2020, 29, 2853–2864. [Google Scholar] [CrossRef]
  26. Dudás, A.; Laki, G.; Nagy, A.L.; Zsoldos, I.; Hanula, B.; Bartel, D. Wear behaviour of ceramic particle reinforced atmospheric plasma spray coatings on the cylinder running surface of internal combustion engines. Wear 2022, 502–503, 204373. [Google Scholar] [CrossRef]
  27. Yu, X.; Jiang, R.; Gao, Y.; Li, Y.; Gong, W.; Li, X.; Lü, W. Microstructure and wear-resistant behaviors of Al2O3-TiO2 reinforced Ni-based composite coating plasma-sprayed on 6061 aluminum alloy. Surf. Coat Technol. 2024, 487, 131032. [Google Scholar] [CrossRef]
  28. Kumar, N.; Choubey, V.K. Comparative Evaluation of Oxidation Resistance of Detonation Gun-Sprayed Al2O3–40%TiO2 Coating on Nickel-Based Superalloys at 800 °C and 900 °C. High Temp. Corros. Mater. 2023, 99, 359–373. [Google Scholar] [CrossRef]
  29. Cooke, K.; Alhubaida, A. Microstructural response and wear behaviour of Ti-6Al-4V impregnated with Ni/Al2O3 + TiO2 nanostructured coating using an electric arc. Sci. Rep. 2022, 12, 21978. [Google Scholar] [CrossRef]
  30. Bhansali, K.; Keche, A.J.; Gogte, C.L.; Chopra, S. Effect of grain size on Hall-Petch relationship during rolling process of reinforcement bar. Mater. Today Proc 2020, 26, 3173–3178. [Google Scholar] [CrossRef]
  31. Kawasaki, M.; Figueiredo, R.B.; Langdon, T.G. The Role of Grain Size in the Mechanical Properties of Metals. Solid State Phenom. 2023, 353, 149–156. [Google Scholar] [CrossRef]
  32. Figueiredo, R.B.; Kawasaki, M.; Langdon, T.G. The role of grain size in achieving excellent properties in structural materials. J. Mater. Res. Technol. 2024, 30, 3448–3462. [Google Scholar] [CrossRef]
  33. Zhang, H.; Yu, J.; Yang, Z.; Zhang, X.; Dong, Y.; Jiang, J.; Wang, J.; Ren, Z. Surface melt nitriding and strengthening mechanism of plasma torched M50 bearing steel. J. Manuf. Process. 2024, 124, 1214–1226. [Google Scholar] [CrossRef]
  34. Cooke, K.O.; Shar, M.A.; Hussain, S. Micro-alloying and surface texturing of Ti-6Al-4V alloy by embedding nanoparticles using gas tungsten arcwelding. J. Manuf. Mater. Process. 2020, 4, 29. [Google Scholar] [CrossRef]
  35. Cardona, D.M.M.; Wongsa-Ngam, J.; Jimenez, H.; Langdon, T.G. Effects on hardness and microstructure of AISI 1020 low-carbon steel processed by high-pressure torsion. J. Mater. Res. Technol. 2017, 6, 355–360. [Google Scholar] [CrossRef]
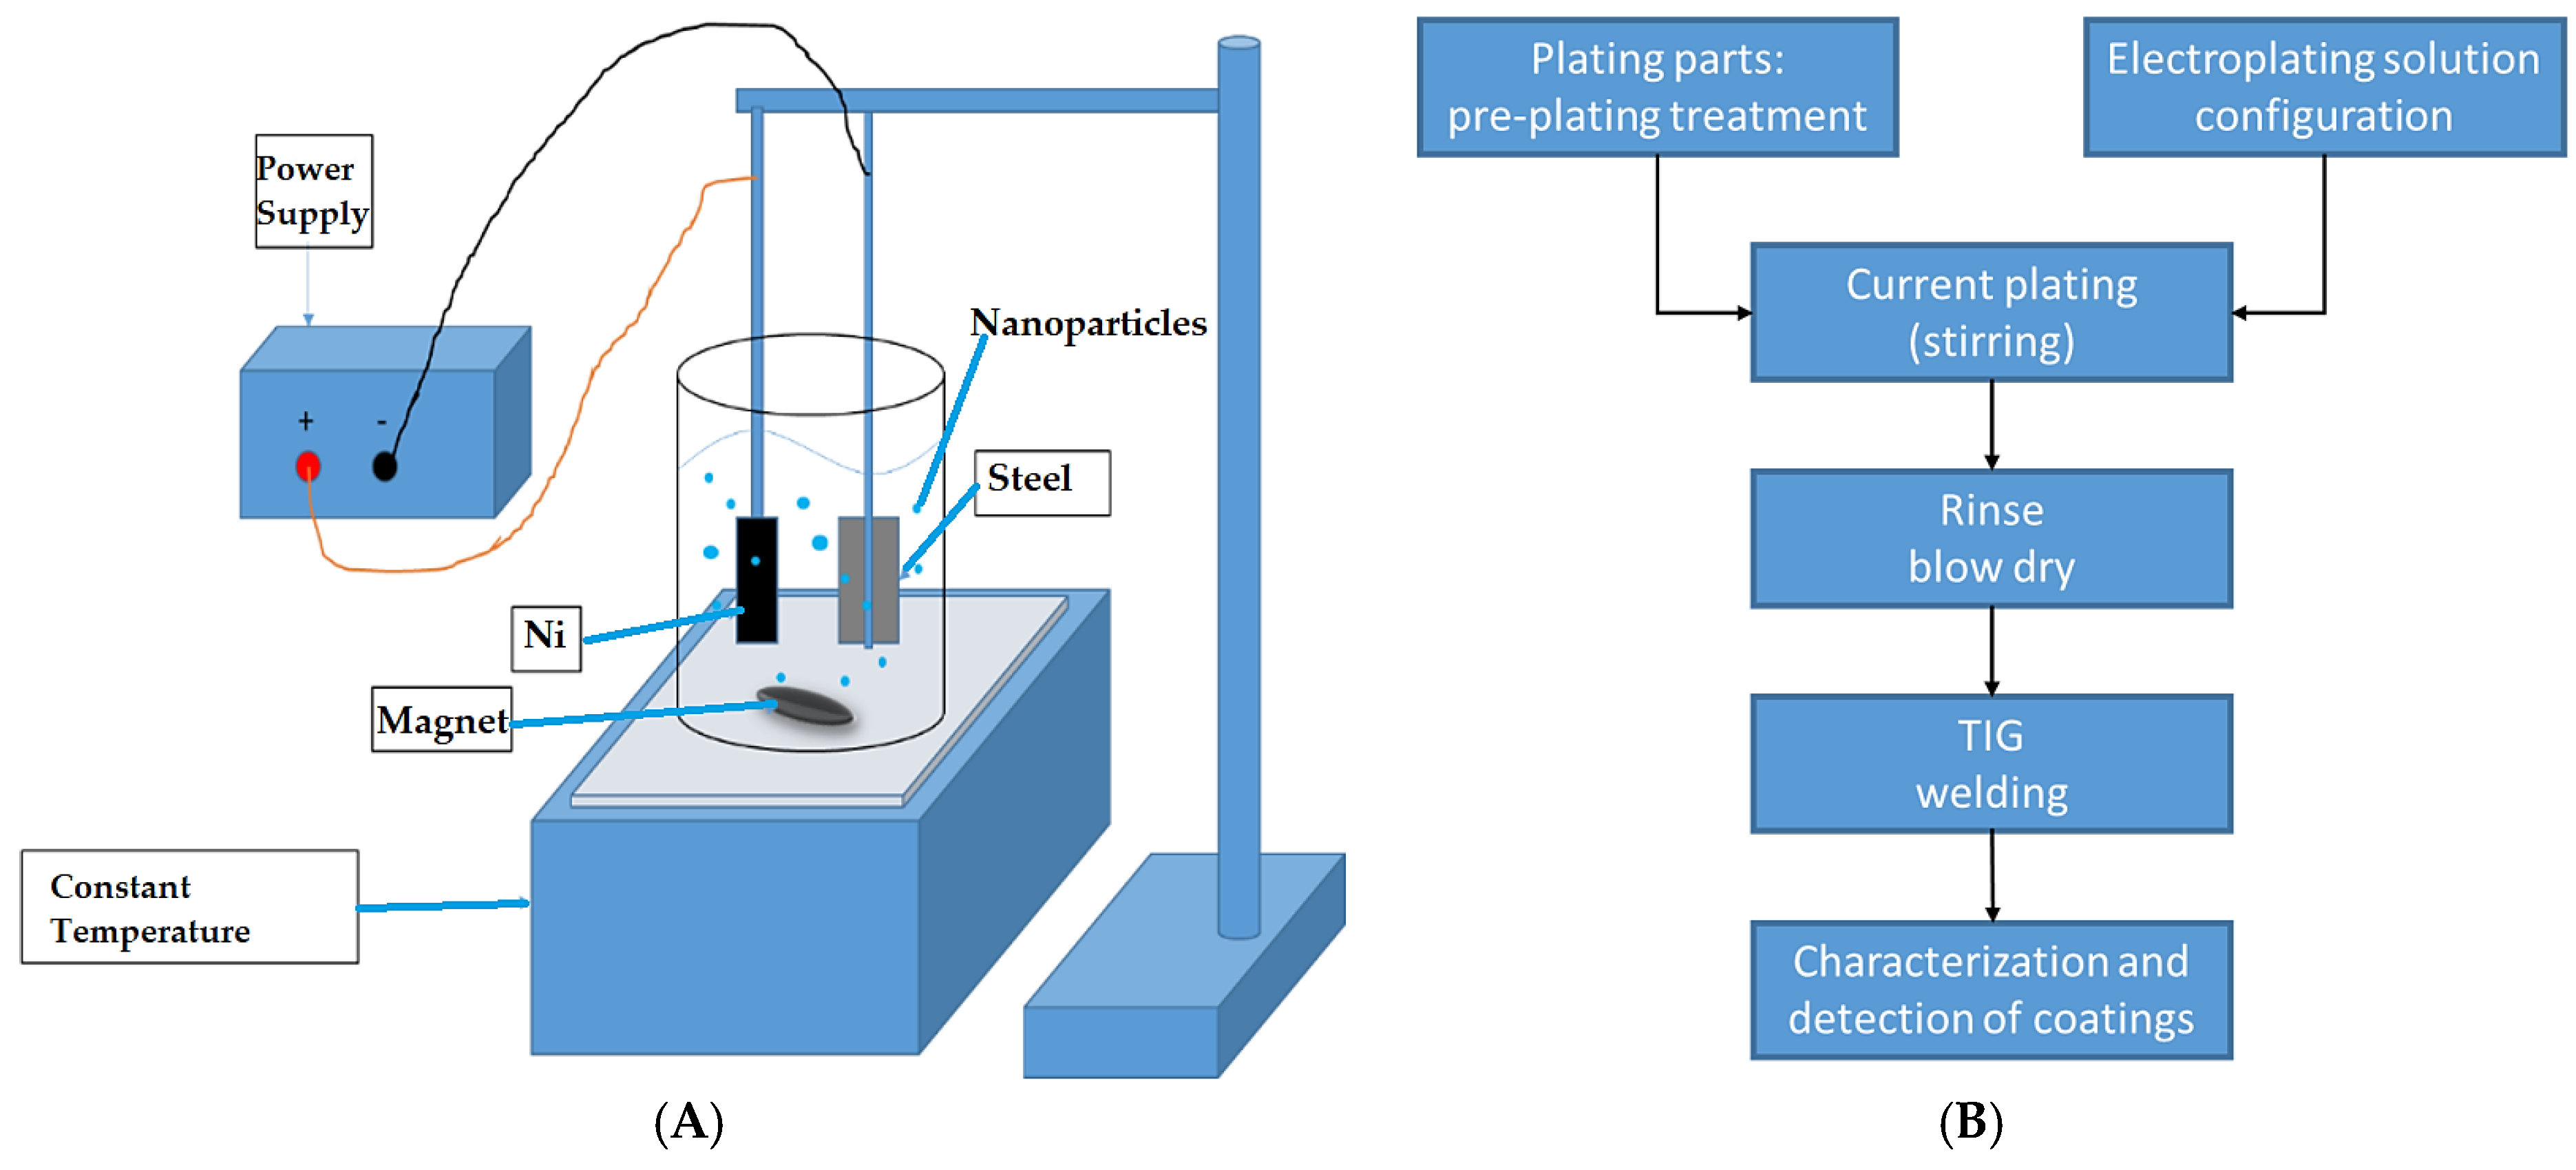
Figure 1. (A) Schematic diagram of the experimental set-up used during the co-deposition process. (B) Flow chart detailing all the steps involved in the treatment process.
Crystals 14 01048 g001
Figure 2. (A) SEM micrograph showing the cross-section of the coated steel surface. (B) EDS spectrum of the Ni-TiO2 coating deposited. (C) Microstructure of the untreated steel substrate and (D) EDS map of the untreated steel substrate. (E) EDS spectrum showing the composition of the steel substrate.
Crystals 14 01048 g002
Figure 3. (A,B) Topographical map of the surface cladded Ni + 30 nm TiO2 particles.
Crystals 14 01048 g003
Figure 4. (A) Optical microscopic image of the cross-section of a sample coated with Ni containing 30 µm TiO2 particles coatings obtained using 75 A current at a travel speed of 2 mm/s. (B) Grain size variation within region-L4. (C) Detailed view of region-L2. (D) Detailed view of the microstructure of region-L4.
Crystals 14 01048 g004
Figure 5. (A) Optical microscopic image of the cross-section of the surface treated Ni coating containing 250 µm TiO2 particles obtained using 75 A current at a travel speed of 1 mm/min. (B) Grain size variation within region-a. (C) Detailed view of region-b. (D) Detailed view of the microstructure of region-c.
Crystals 14 01048 g005
Figure 6. (A) Optical microscopic image of the cross-section of the surface treated Ni coating containing 30 µm TiO2 particles. (B) Grain size variation within region-L1. (C) Detailed view of region-L2. (D) Detailed view of the microstructure of region-L4.
Crystals 14 01048 g006
Figure 7. LIBS spectrum of the steel surface treated Ni containing 30 µm TiO2 particles.
Crystals 14 01048 g007
Figure 8. (AC) SEM micrograph showing the cross-section of the coated steel surface. EDS map confirming the composition of the treated layer: (D) Fe; (E) Si; (F) C; (G) Ni; (H) Al; (I) Ti.
Crystals 14 01048 g008aCrystals 14 01048 g008b
Figure 9. Effect of coating thickness of the hardness profile on the cross-section of the sample coated with (A) Ni coatings containing 30 nm TiO2 particles and (B) Ni coatings containing 250 nm TiO2 particles.
Crystals 14 01048 g009aCrystals 14 01048 g009b
Figure 10. Effect of particle size on the hardness profile on the cross-section of the sample coated with 100 µm Ni-TiO2 coating.
Crystals 14 01048 g010
Figure 11. Wear rate of the samples tested. All samples were evaluated for 30 min.
Crystals 14 01048 g011
Figure 12. Wear scar of the sample coated with Ni-250 nm TiO2 particles: (A) depth of the wear scar of the sample coated with Ni coating and treated with tig arc; (B) LIBS topographical map of the wear scar of the sample coated with Ni-250 nm TiO2 particles and treated with tig arc.
Crystals 14 01048 g012aCrystals 14 01048 g012b
Figure 13. Wear scar of the sample coated with Ni-30 nm TiO2 particles: (A) depth of the wear scar of sample coated with Ni coating and treated with tig arc; (B) LIBS topographical map of the wear scar of the sample coated with Ni-30 nm TiO2 particles and treated with tig arc.
Crystals 14 01048 g013aCrystals 14 01048 g013b
Table 1. Composition of the as-received mild steel samples.
ElementsFeMnCCuSP
Composition (wt%)Bal0.750.260.20.050.04
Table 2. Parameters used for depositing the Ni-TiO2 coating.
Number of BathsBath CompositionParticle SizeVolume of Particles AddedCoating Thickness (µm)
Bath 1250 g/L NiSO4·6H2O, 45 g/LNiCl2·6H2O, 35 g/L H3BO3, 1 g/L Saccharin, 1 L H2O 15, 50 and 120
Bath 2250 g/L NiSO4·6H2O, 45 g/LNiCl2·6H2O, 35 g/L H3BO3, 1 g/L Saccharin, 1 L H2O250 nm TiO2 particles20 g/L—TiO215, 50 and 120
Bath 3250 g/L NiSO4·6H2O, 45 g/LNiCl2·6H2O, 35 g/L H3BO3, 1 g/L Saccharin, 1 L H2O30 nm TiO2 particles20 g/L—TiO215, 50 and 120
Table 3. Parameter setting for the TIG process used to melt the surface of the steel alloy.
TIG Welding Parameters
Welding TypeCurrentTorch AngleDistance Between Platform andTorchPlatform Moving Speed
TIG parameters75 Amp45 degrees3 mm2 mm/s
Disclaimer/Publisher’s Note: The statements, opinions and data contained in all publications are solely those of the individual author(s) and contributor(s) and not of MDPI and/or the editor(s). MDPI and/or the editor(s) disclaim responsibility for any injury to people or property resulting from any ideas, methods, instructions or products referred to in the content.