Abstract
The most common form of solidification of metals is heterogeneous nucleation, in which the particles, regardless of whether they are endogenous or exogenous, nucleate the primary crystal phase, becoming solid crystal particles and, subsequently, initiating into grains during solidification. Explosive grain initiation has been proposed recently for these particles, which have significant nucleation undercooling, in which once nucleation happens, a certain number of solid particles can initiate into grains simultaneously, resulting in recalescence. This is a different form of grain initiation and has high potential for more significant grain refinement in casting alloys. In this work, an analytical model is designed to describe explosive grain initiation, based on which the criteria for the three different grain initiation forms, explosive grain initiation (EGI), hybrid grain initiation (HGI), and progressive grain initiation (PGI), are derived. These criteria are employed to develop a grain initiation map for the Mg-Al alloy system inoculated with nucleant particles having a log-normal size distribution. This work can not only help us to understand the effect of each condition, such as the cooling rate and the solute concentration, on grain initiation behaviors, but also predict the grain size for alloy systems with relatively impotent nucleant particles during solidification.
1. Introduction
Primary manufacturing processes, such as ingot casting, continuous casting, squeeze casting, pressure casting, and atomization, and secondary manufacturing processes, such as welding, soldering, brazing, cladding, and sintering, involve solidification as an important stage [,,,]. These processes are actually forms of heterogeneous nucleation because of the unavoidable impurities or inclusions in the melt. Usually, the grain size of the casting alloys is determined by the early stage of solidification, which is defined as solidification before instability of spherical growth into dendritic growth [], irrespective of the phenomena of fragmentation. Usually, the early stage of solidification involves two essential processes: heterogeneous nucleation, which is currently regarded as the formation of a two-dimensional (2D) nucleus that can template further crystal growth and can be described by a three-layer atomic mechanism []; and, subsequently, grain initiation, which provides a hemispherical cap (3D) on a substrate that can grow freely without any energy barriers [,,]. Both heterogeneous nucleation and grain initiation are deterministic processes, having their particular forms of undercooling, nucleation undercooling (ΔTn) and grain initiation undercooling (ΔTgi). Based on the interplay between nucleation undercooling and grain initiation undercooling of the largest particles in the melt, three different grain initiation types have been identified, i.e., progressive grain initiation (PGI), explosive grain initiation (EGI), and hybrid grain initiation (HGI) [,].
The nucleating agent that supplies the substrate for the nucleation of the new crystal phase is one of the most crucial factors in heterogeneous nucleation and, therefore, in the grain refinement of alloys. It has been recognized that the misfit between the crystal phase and the substrate plays a very important role in heterogeneous nucleation. Bramfitt [] systematically studied the influence of more than 20 kinds of carbides and nitrides on the heterogeneous nucleation of liquid iron, and found that the nucleation undercooling is proportional to the value of the lattice misfit. This proposed relationship between the nucleation undercooling and the lattice misfit was also experimentally confirmed by Suzuki et al. [], Ohashi, and Nakajima et al. [,]. Wang et al. [] obtained a series of lattice misfits from nucleating Al on different termination planes of single-crystal alumina substrates in their experiment, indicating that the lattice structure of the nucleation substrate does affect the nucleation behavior of new crystals, and proposed a general misfit–interfacial energy model for heterogeneous nucleation interface.
Recently, the atomistic mechanism of heterogeneous nucleation was investigated by Fan et al. [], using a molecular dynamics (MD) simulation. They found that heterogeneous nucleation produces a 2D nucleus (i.e., a crystal plan of the solid) by building on the precursor provided by prenucleation [], which is generally summarized by a three-layer mechanism []. From this nucleation theory, it can be predicted implicitly that nucleation undercooling increases linearly with the increase in the lattice misfit []. Besides the misfit between the substrate and crystal phase, the chemical interaction [] and the substrate surface roughness [] at the atomic level between the liquid and the substrate can affect the nucleation potency as well [].
Nucleation undercooling can be manipulated by changing the interfacial conditions between the liquid and the substrate through the adsorption of solute atoms at the interface [,]. For example, the formation of an atomic monolayer of an Al3Ti two-dimensional compound (2DC) on the (0001) TiB2 surface (denoted hereafter as TiB2/Al3Ti-2DC) through the adsorption of Ti at the TiB2/liquid interface during the grain refiner production process [] changes the lattice misfit from −4.22% with TiB2 to 0.09% with TiB2/Al3Ti-2DC, leading to a substantial increase in nucleation potency. Inversely, the Zr can be adsorbed and form Ti2Zr 2DC on the (0001) TiB2 surface, which changes the lattice misfit from 0.09% with Al3Ti 2DC to −4.70% with TiB2/Ti2Zr-2DC, rendering TiB2/Ti2Zr-2DC impotent for heterogeneous nucleation [].
After nucleation, the crystal layer on the surface of the substrate will continue to grow and eventually form a cap, whose radius is determined by the undercooling []. Therefore, the substrate particle becomes a solid (crystal) particle, whose size (diameter) is the same as the substrate before grain initiation. Once the cap grows over the hemisphere, the solid particle can grow freely and initiate into the grain, which is referred to as grain initiation.
In the practice of solidification, the nucleant particles in the melt are not of a single size, but have a range of sizes that usually follow a log-normal size distribution [,]. The grain initiation behavior of these particles is strongly dependent on the chemical and physical nature of the nucleant particles, the alloy composition, and the solidification conditions [,]. In cases involving very potent nucleant particles, which are normally concentrated on, such as potent TiB2 particles in Al-Ti-B grain refiners, the nucleation happens on all the potent inoculant particles once the undercooling surrounding the particles reaches nucleation undercooling. Subsequently, with further decreases in the temperature of the melt, the largest solid particle will initiate into a grain first, followed by smaller ones, until recalescence, which is progressive grain initiation [,]. In cases involving very impotent particles, such as MgO particles in Mg alloys, the grain initiation will not happen even if the undercooling is larger than the nominal grain initiation undercooling for the largest particle, as there is no nucleation happening. Once the undercooling reaches nucleation undercooling, all the impotent particles nucleate simultaneously, and a certain number of solid particles whose sizes are larger than the critical size for free growth will initiate into grains at the same time, resulting in recalescence immediately, and with no further grain initiation happening, which was recently identified as explosive grain initiation [,]. It is interesting to note that EGI is not necessary for grain refinement, but can lead to more significant grain refinement than PGI at the same conditions.
In this work, we aim to develop an analytical model to describe EGI on the basis of diffusion-controlled isothermal solidification and to construct grain initiation maps. Using this model, we can clearly understand the effect of solidification conditions, such as the cooling rate, solute concentration, and particle number density, on EGI and grain initiation maps.
2. Model
2.1. Analytical Model
It has been demonstrated that the interplay between nucleation undercooling and grain initiation undercooling determines the grain initiation form during solidification [,]. Nucleation undercooling, , is undercooling in which there forms a 2D nucleus on the surface of the substrate that can epitaxially grow a crystal phase without an energy barrier. After nucleation, the crystal phase will grow into a cap on the substrate, making the substrate particles become solid particles. Note that the sizes (diameters) of solid particles are the same as those of substrate particles. Grain initiation undercooling, , is the critical undercooling at which the solid particle can overcome the hemisphere and continue to grow without the requirement of further undercooling. As illustrated by the free growth model, the largest solid particle in the melt will initiate first grain, which is referred to as and can be calculated by the following equation []:
where is the largest solid particle in the melt, γ is the interfacial energy, ΔSV is the entropy of fusion per unit volume. If nucleation has not occurred at this time, “ΔTgi(1st)” is calculated, with meaning the largest substrate particle in the melt.
Based on the heat balance, the heat extracted from the melt to the environment () equals the heat released due to temperature (T) drop and/or the latent heat () at any time (t):
When , where is the time at which grain initiation occurs, the heat released is only due to the temperature drop, and one has
where is the specific heat capacity of the melt per unit volume. Therefore,
where is the cooling rate, TL is the liquidus, and t is time accounted from the liquidus. Clearly, in this condition, the temperature decreases linearly with time.
When , where is the time at which recalescence takes place, the heat released is due to both temperature drop and latent heat, and one has
where is the latent heat of fusion per unit volume, and is the fraction of the solid phase.
After nucleation during solidification, the nucleant particles become solid particles, and their grain initiation undercooling can be derived from the free growth model []. In other words, for fixed undercooling, ΔT, the radius of the solid particles that can initiate into grains should be larger than the minimum radius () obtained from the free growth model []:
The growth velocity () of a particular spherical grain (i) is expressed as follows, based on the previous model [] on the diffusion-controlled spherical growth in isothermal conditions:
For linear phase diagram,
where D is the diffusion coefficient, is the supersaturation, m is the liquidus slop, and k is the partition coefficient. Therefore, the increase in solid fraction at this moment can be obtained as follows:
where , and substituting Equation (7) into Equation (9), one can obtain
When recalescence happens, one obtains
From Equations (10) and (11), one obtains the critical cooling rate for the EGI, as follows:
Therefore, the criteria for the EGI are
and
According to the definition of PGI, the nucleation undercooling should be no larger than the calculated grain initiation undercooling of the largest particle in the melt, meaning . Obviously, the HGI occurs between PGI and EGI. Therefore, we can obtain criteria a–c for the three different grain initiation forms:
- For PGI, ;
- For HGI, and ;
- For EGI, and
Note that the term is strongly dependent on the size distribution of the nucleant particles in the melt, and it is only solved when the particles have a regular size distribution. Generally, naturally produced particles have a log-normal size distribution.
2.2. For Log-Normal-Distribution Particles
Here, we assume that there is only one type of particle. Therefore, the nucleation undercooling of the particles is the same, and the sizes of the particles follow a log-normal distribution:
Hence,
where n is the frequency, is the mean of log-normal distribution, σ is the standard deviation, dx is the size interval for the particles, is the particle number with the size of Ri, N0 is the particle number density, and V0 is the volume of melt. When = 1, we can obtain the maximum radius of the particle, R1, in the melt and, subsequently, calculate the grain initiation undercooling from the free growth model. Similarly, when we obtain maximum undercooling, we can calculate the minimum radii of particles and their number. Furthermore, if explosive grain initiation occurs, the maximum undercooling equals the nucleation undercooling.
For particular N0 and V0, we substitute Equation (16) into Equation (12) and obtain
where f is a function of N and d, which shows the critical condition for EGI.
2.3. Simplifying of Equation (17)
To simplify Equation (17), we use a parameter, , to replace the in Equation (17), and obtain
The cumulative function can be obtained as follows:
The term means the cumulative number of particles is larger than R1, which is very small compared to the whole particle number. Therefore, it is ignored in this work.
Next, for critical EGI, one obtains
2.4. Fitted Simple Equation
In order to practice use, we use in the Equation (20) and obtain:
Another approximation is to describe p as a function of d0, , and one obtains
2.5. The Grain Initiation of the First Particle
From Equation (16), we can find that is proportional to . For a fixed particle size distribution, when = 1, we can obtain the maximum diameter of the particles in the melt, d1. Therefore, the minimum grain initiation undercooling, ΔTgi(1st), for the maximum diameter of a particle is a function of the total number of particles, such as
Therefore, after calculating the critical in Equation (20) and “ΔTgi(1st)” in Equation (23), we can develop the grain initiation map based on criteria a–c.
3. Results
The grain initiation undercooling for the first (largest) particle, “ΔTgi(1st)”, can be calculated from the free growth model based on the largest particle in the model, which is a function of N0V0, as shown in Figure 1, and the used parameters are listed in Table 1. With increases in the value of N0V0, the size of the largest particle increases, resulting in the reduction of “ΔTgi(1st)”, as the “ΔTgi(1st)” is in inverse proportion to the largest particle size. If ΔTn is less than “ΔTgi(1st)”, the nucleation occurs first and the substrate particles become the solid particles, and then ΔTgi(1st) = “ΔTgi(1st)”. Otherwise, ΔTgi(1st) > “ΔTgi(1st)”, because grain initiation should occur after nucleation.
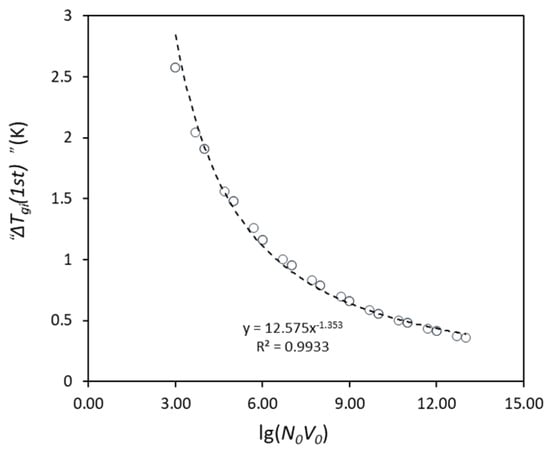
Figure 1.
The calculated grain initiation undercooling for the first (largest) particle, “ΔTgi(1st)”, with increasing particle number (N0V0), where the particles have a log-normal size distribution with d0 = 0.07 μm and σ = 0.45. The dashed line is the fitted line based on the data (open circle).

Table 1.
The parameters used in this work.
From Equations (6) and (12), the relationship between ΔTn and can be obtained if the term is known. Thus, the value of the term is numerically calculated with the condition of N0 = 1017/m3, V0 = 10−6 m3, and log-normal size distribution (d0 = 0.07 μm, σ = 0.45), as shown in Figure 2 (solid line). For small ΔTn, ΔTn < 2 K, the value of the term increases slowly with the increase in ΔTn. However, when 2 K < ΔTn < 14 K, the value of the term increases significantly with increasing ΔTn. However, when ΔTn > 20 K, the value of the term no longer increases with increasing ΔTn due to there being no smaller particles available.
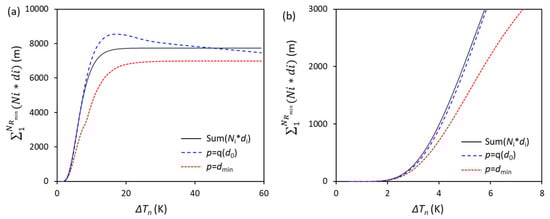
Figure 2.
The (a) accumulation term and two approximations with different forms of nucleation undercooling, ΔTn, and (b) enlarged part with small ΔTn.
In order to simply the model, a new parameter p was introduced in the model to replace the d in Equation (17). One approximation is to make , as shown in Equation (21) and Figure 2. It can be seen that if , the calculated value of the term is less than the numerical value in the full range of ΔTn from 0 to 60 K. For a more precise prediction of EGI, the numerically calculated term of is fitted approximately as a function of and ΔTn, as . As a result, Equation (22) becomes
This fitted approximation is compared with the numerical calculation and previous approximation, Equation (21), as shown in Figure 2, from which we can see that Equation (24) is much better than the first approximation in Equation (21), especially in the range of ΔTn < 10 K.
Depending on the numerically calculated term of and two different approximations, a grain initiation map of Mg-10Al alloy is calculated and shown in Figure 3, based on criteria a–c. From the comparison, the calculated critical EGI line from the approximation in Equation (24) is in good agreement with that calculated from the numerical calculation term of .
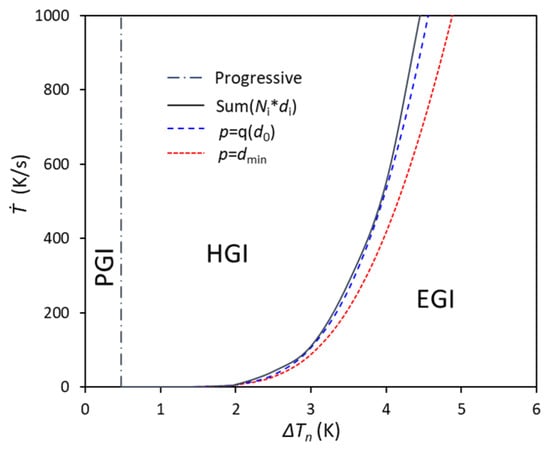
Figure 3.
The calculated grain initiation map for Mg-10Al alloys with N0 = 1017/m3, V0 = 10−6 m3, and log-normal size distribution (d0 = 0.07 μm, σ = 0.45).
In this work, the grain initiation maps of some other Mg alloys, e.g., Mg-0.3Al, Mg-5Al, and Mg-10Al, are calculated for comparison, as shown in Figure 4, in which the numerically calculated EGI from Ref. [] is shown as well. For low concentrations, such as in Mg-0.3Al alloy, the deviation between the two approximations of the EGI line is much smaller. However, when the concentration increases to Mg-5Al and Mg-10Al, the deviations become larger, especially when ΔTn > 3 K. However, the deviations between those from the approximation Equation (24) and the numerical calculation from Ref. [] are always small for all the concentrations from Mg-0.3Al to Mg-10Al.
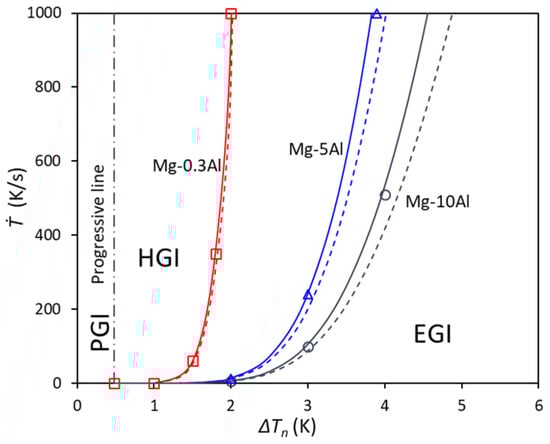
Figure 4.
The calculated grain initiation map for Mg-0.3Al, Mg-5Al, and Mg-10Al alloys compared with that from the numerical model with the same N0 = 1017/m3 and V0 = 10−6 m3 and the same size distribution (d0 = 0.07 μm, σ = 0.45). The symbols are from numerical calculation, solid lines are from p = q(d0), and dashed lines are from p = dmin.
The particle number density’s effect on the grain initiation map can also be calculated from the present model. For example, Figure 5 shows the grain initiation map for Mg-10Al alloy for different particle number densities with 1015 and 1017 m−3, with the other conditions the same as those in Figure 3. For high number density, e.g., 1017 m−3, the calculated EGI lines from two approximations agree well with each other, as well as the numerical calculation from Ref. []. However, when the number density reduces to 1015 m−3, the calculation from Equation (24) has a larger deviation from that from Equation (21) with increasing ΔTn, although it is still consistent with that from the numerical calculation from Ref. [], which indicates that the approximation in Equation (24) can be used to calculate the grain initiation map for alloys with nucleation particles having a log-normal size distribution.
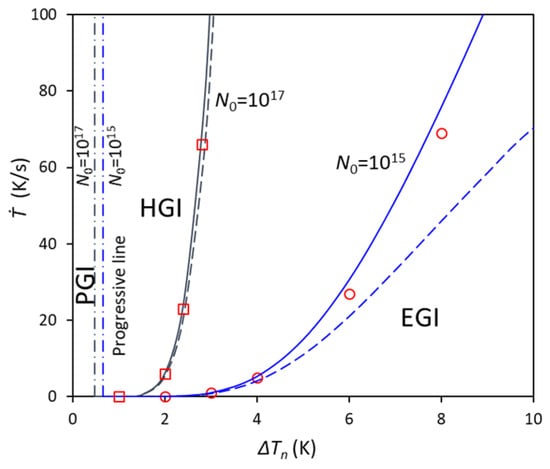
Figure 5.
The calculated grain initiation map of cooling rate against nucleation undercooling at particle number densities of 1015 and 1017 m−3 for Mg-10Al alloy with the same log-normal size distribution (d0 = 0.07 μm, σ = 0.45). The blue color means N0 = 1015 and the black color means N0 = 1017. The symbols are from numerical calculation, solid lines are from p = q(d0), and dashed lines are from p = dmin.
4. Discussion
For particular alloy systems, such as Mg-Al alloys, the ΔTn for a particular particle may be fixed, ignoring the change in solute. In this case, the cooling rate is inversely proportional to the concentration, according to Equation (24), for which the relationship is calculated and shown in Figure 6 in Mg-Al alloys at two different ΔTn, 2.0 and 3.0 K. For a low concentration, the cooling rate remarkably reduces with increases in the concentration, especially for small ΔTn (2.0 K), and then smoothly reduces with further increases in concentration. This is because, for fixed ΔTn and particle number density and size distribution, the initiated grains are in the manner of EGI. The lower the composition, the smaller the growth restriction’s contribution to the grain growth, which leads to higher growth velocity (higher latent heat released from growth), which needs more heat to be extracted by the environment, equivalent to a higher cooling rate. This is also the reason why the change in the curve in Figure 6 is very similar to the curve between the growth velocity and the growth restriction parameter β [].
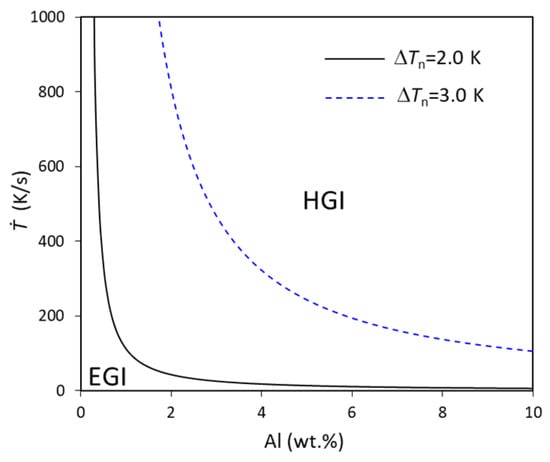
Figure 6.
The relationship between cooling rate and concentration calculated using approximation in Equation (24) for fixed nucleation undercooling for Mg-Al alloys with N0 = 1017/m3, V0 = 10−6 m3, and log-normal size distribution (d0 = 0.07 μm, σ = 0.45).
Similarly, for a particular solidification condition, equivalent to a fixed cooling rate, the concentration is also a function of ΔTn, as shown in Figure 7, where two different cooling rates, 3.5 and 1000 K/s, are presented for low cooling rate (equivalent to DC casting) and high cooling rate (high-pressure die casting), respectively. From Figure 7, it can be easily observed that the concentration sharply increases with increasing ΔTn for both of the different cooling rates. From the comparison of these two different cooling rates, we can find that the low cooling rate is much more beneficial for EGI, and the ΔTn should be increased with increasing solute to obtain the EGI.
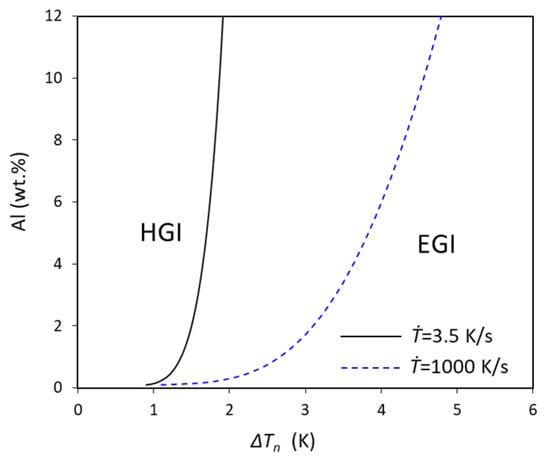
Figure 7.
The relationship between nucleation undercooling and concentration calculated using approximation in Equation (24) for fixed cooling rate of Mg-Al alloys with N0 = 1017/m3, V0 = 10−6 m3, and log-normal size distribution (d0 = 0.07 μm, σ = 0.45).
However, as discussed in Ref. [], EGI does not mean grain refinement, but for the same system, impeding the nucleation undercooling to exhibit the EGI is beneficial for grain refinement, as shown in Figure 8, in which the grain size () is calculated by the following equation:
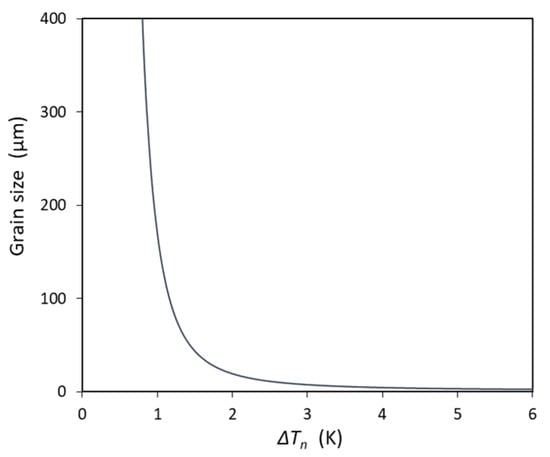
Figure 8.
The calculated grain size against nucleation undercooling for particles with N0 = 1017/m3, V0 = 10−6 m3, and log-normal size distribution (d0 = 0.07 μm, σ = 0.45).
Which is deduced from the log-normal size distribution for EGI. From Figure 8, we can see that the large ΔTn can significantly reduce the grain size. For example, the grain size is only 3.4 μm when ΔTn = 5.0 K.
5. Summary
A new form of grain initiation, explosive grain initiation, has been derived based on the interplay between nucleation undercooling and grain initiation undercooling of the largest particle in the melt during solidification, which may significantly promote grain refinement compared to progressive grain initiation in the same solidification process. In this work, we developed an analytical model to calculate the critical explosive grain initiation based on the explosive grain initiation behavior. Moreover, criteria a–c were derived to describe the different grain initiation behaviors, as follows:
- For PGI, ;
- For HGI, and ;
- For EGI, and .
These criteria can be used to calculate the grain initiation map and analyze the effect of each condition on the grain initiation behavior. In this work, we took Mg-Al alloys as an example to illustrate this model’s effectiveness for describing EGI, developing grain initiation maps, and even calculating the grain size in the manner of EGI.
Supplementary Materials
The following supporting information can be downloaded at: https://www.mdpi.com/article/10.3390/cryst14110940/s1.
Author Contributions
Conceptualization, methodology, F.G. and Z.F.; validation, formal analysis, investigation, data curation, writing—original draft preparation, F.G.; writing—review and editing, supervision, funding acquisition, Z.F. All authors have read and agreed to the published version of the manuscript.
Funding
This research was financially supported by EPSRC (UK) under UKRI Interdisciplinary Centre for CircularMetal, with grant number EP/V011804/1.
Data Availability Statement
A MATLAB code to calculate explosive lines for different compositions is attached in the manuscript as a Supplementary File. Any other data presented in this study are available on request from the corresponding author.
Conflicts of Interest
The authors declare no conflicts of interest.
References
- McCartney, D.G. Grain refining of aluminium and its alloys using inoculants. Int. Mater. Rev. 1989, 34, 247–260. [Google Scholar] [CrossRef]
- Murty, B.S.; Kori, S.A.; Chakraborty, M. Grain refinement of aluminium and its alloys by heterogeneous nucleation and alloying. Int. Mater. Rev. 2002, 47, 3–29. [Google Scholar] [CrossRef]
- Kelton, K.F.; Greer, A.L. Nucleation in Condensed Matter: Applications in Materials and Biology; Pergamon: Oxford, UK, 2010. [Google Scholar]
- Jonathan, A.D.; Rappaz, M. Solidification, 2nd ed.; EPFL Press: Lausanne, Switzerland, 2017. [Google Scholar]
- Fan, Z.; Gao, F.; Jiang, B.; Que, Z.P. Impeding nucleation for more significant grain refinement. Sci. Rep. 2020, 10, 9448. [Google Scholar] [CrossRef] [PubMed]
- Fan, Z.; Men, H. An Overview on Atomistic Mechanisms of Heterogeneous Nucleation. Metals 2022, 12, 1547. [Google Scholar] [CrossRef]
- Fan, Z.; Gao, F. Grain initiation and grain refinement: An overview. Metals 2022, 12, 1728. [Google Scholar] [CrossRef]
- Bramfitt, B.L. The effect of carbide and nitride additions on the heterogeneous nucleation behavior of liquid iron. Metall. Mater. Trans. B 1970, 1, 1987–1995. [Google Scholar] [CrossRef]
- Suzuki, T.; Inoue, J.; Koseki, T. Solidification of iron and steel on single-crystal oxide. ISIJ Int. 2007, 47, 847–852. [Google Scholar] [CrossRef]
- Ohashi, T.; Hiromoto, T.; Fujii, H.; Nuri, Y.; Asano, K. Effect of oxides on nucleation behaviour in supercooled iron. Tetsu-to-Hagané 1976, 62, 614–623. [Google Scholar] [CrossRef]
- Nakajima, K.; Hasegawa, H.; Khumkoa, S.; Mizoguchi, S. Effect of a catalyst on heterogeneous nucleation in pure and Fe-Ni alloys. Metall. Mater. Trans. B 2003, 34, 539–547. [Google Scholar] [CrossRef]
- Wang, L.; Yang, L.; Zhang, D.; Xia, M.; Wang, Y.; Li, J.G. The role of lattice misfit on heterogeneous nucleation of pure aluminium. Metall. Mater. Trans. A 2016, 47, 5012–5022. [Google Scholar] [CrossRef]
- Men, H.; Fan, Z. Prenucleation induced by crystalline substrates. Metall. Mater. Trans. A 2018, 49, 2766–2777. [Google Scholar] [CrossRef]
- Fang, C.M.; Men, H.; Fan, Z. Effect of substrate chemistry on prenucleation. Metall. Mater. Trans. A 2018, 49, 6231–6242. [Google Scholar] [CrossRef]
- Jiang, B.; Men, H.; Fan, Z. Atomic ordering in the liquid adjacent to an atomically rough solid surface. Comp. Mater. Sci. 2018, 153, 73–81. [Google Scholar] [CrossRef]
- Wang, Y.; Wang, S.; Que, Z.P.; Fang, C.; Hashimoto, T.; Zhou, X.; Ramasse, Q.M.; Fan, Z. Manipulating nucleation potency of substrates by interfacial segregation: An overview. Metals 2022, 12, 1636. [Google Scholar] [CrossRef]
- Fang, C.; Fan, Z. Effect of Segregation of Sc, Y and La Atoms on Prenucleation at the Liquid-Al/γ-Al2O3{1 1 1} Interfaces. Metals 2022, 12, 1550. [Google Scholar] [CrossRef]
- Fan, Z.; Wang, Y.; Zhang, Y.; Qin, T.; Zhou, X.R.; Thompson, G.E.; Pennycook, T.; Hashimotob, T. Grain refining mechanism in the Al/Al–Ti–B system. Acta Mater. 2015, 84, 292–304. [Google Scholar] [CrossRef]
- Wang, Y.; Fang, C.; Zhou, L.; Hashimoto, T.; Zhou, X.; Ramasse, Q.; Fan, Z. Mechanism for Zr poisoning of Al-Ti-B based grain refiners. Acta Mater. 2019, 164, 428–439. [Google Scholar] [CrossRef]
- Quested, T.; Greer, A. The effect of the size distribution of inoculant particles on as-cast grain size in aluminium alloys. Acta Mater. 2004, 52, 3859–3868. [Google Scholar] [CrossRef]
- Van Ende, M.-A.; Guo, M.; Zinngrebe, E.; Blanpain, B.; Jung, I.-H. Evolution of non-metallic inclusions in secondary steelmaking: Learning from inclusion size distributions. ISIJ Int. 2013, 53, 1974–1982. [Google Scholar] [CrossRef]
- Greer, A.L.; Bunn, A.M.; Tronche, A.; Evans, P.V.; Bristow, D.J. Modelling of inoculation of metallic melts: Application to grain refinement of aluminium by Al-Ti-B. Acta Mater. 2000, 48, 2823–2835. [Google Scholar] [CrossRef]
- Fan, Z.; Lu, S.Z. A simple model for spherical growth in alloy solidification. IOP Conf. Ser. Mater. Sci. Eng. 2016, 117, 012016. [Google Scholar] [CrossRef]
- Fan, Z.; Gao, F.; Zhou, L.; Lu, S.Z. A new concept for growth restriction during solidification. Acta Mater. 2018, 152, 248–257. [Google Scholar] [CrossRef]
Disclaimer/Publisher’s Note: The statements, opinions and data contained in all publications are solely those of the individual author(s) and contributor(s) and not of MDPI and/or the editor(s). MDPI and/or the editor(s) disclaim responsibility for any injury to people or property resulting from any ideas, methods, instructions or products referred to in the content. |
© 2024 by the authors. Licensee MDPI, Basel, Switzerland. This article is an open access article distributed under the terms and conditions of the Creative Commons Attribution (CC BY) license (https://creativecommons.org/licenses/by/4.0/).