Article

Effects of Friction Stir Processing on the Microstructure and Mechanical Properties of an Ultralight Mg-Li Alloy

1
College of Mechanical and Electrical Engineering, Shaanxi University of Science and Technology, 7 Xuefu Road, Weiyang District, Xi’an 710021, China
2
Department of Materials Science, Fudan University, Shanghai 200438, China
3
School of Aeronautics, Northwestern Polytechnical University, Xi’an 710072, China
4
School of Mechanical Engineering, Qinghai University, Xining 810016, China
*
Author to whom correspondence should be addressed.
Crystals 2024, 14(1), 64; https://doi.org/10.3390/cryst14010064
Submission received: 6 December 2023 / Revised: 19 December 2023 / Accepted: 20 December 2023 / Published: 4 January 2024
(This article belongs to the Special Issue Progress in Light Alloys)

Abstract

:
Magnesium–lithium alloys are arguably the lightest metal structural materials but have low strength. In order to increase strength, friction stir processing (FSP) is applied to a hot-rolled Mg-10Li-3Al-3Zn (LA103Z) sheet to study the effects on the microstructure and mechanical properties. In this study, the strengthening mechanisms of various FSP regions of an Mg-Li alloy were clarified by a combination of numerical simulation and experimental method. Based on ANSYS APDL, a finite element model with a moving heat source is established. Rotational speeds of 800, 1000, and 1200 rpm and traverse speeds of 100, 110, and 120 mm/min were used in this research. The simulation results confirm that the influence of the rotation speed on the alloy temperature field is greater than that of the travel speed. The temperature of the processing area increases with an increase in rotation speed and decreases with an increase in travel speed. Then, hot-rolled LA103Z alloy plates are processed by FSP. The correspondence between the numerical simulation and experiment was verified by infrared thermography. The results indicate that FSP decreases the grain size significantly for the dynamic recrystallization and dramatic mechanical crushing of the stirring pin. The α-Mg and AlLi are solid soluted in the β-Li matrix. The tensile strength of the processing zone is 260.67 MPa (1000 rpm, 110 mm/min) versus the 170.47 MPa of the base metal. The SZ has the highest microhardness of 77.8 HV (800 rpm, 120 mm/min) and decreases gradually to the BM. The severe deformation, recrystallization, and solid solution of the α-Mg are important factors contributing to the improved mechanical properties.

1. Introduction

Magnesium–lithium alloys are by far among the lightest metal structure materials, with high specific strength, stiffness, ductility, and good electrical conductivity [1,2,3]. As a “21st-century green engineering material”, it has a wide application prospect in many high-end fields such as aerospace, electronics, and medical devices [4]. Ultralight Mg-Li alloys with different microstructures can be prepared by adding Li (body-centered cubic, BCC) to Mg (hexagonal close-packed, HCP) [5]. The addition of a proper amount of Li can transform HCP Mg into a BCC solid solution; it may increase the number of simultaneously activated independent slip systems or reduce the c/a value and the critical resolved shear stress (CRSS) of the non-basal slip systems, resulting in significantly improved ductility. If properly designed, Mg-Li alloys can show decent ductility and formability at room temperature. However, the absolute strengths of most Mg-Li alloys are still low [6,7,8]. Therefore, several approaches including alloying [9], heat treatment [10], traditional extrusion [8], rolling [11], forging [12], severe plastic deformation (SPD) such as equal channel angular pressing (ECAP) [12,13,14], high-pressure torsion [15], and accumulative roll bonding (ARB) [16], etc., have been explored to improve alloy strengths.
Friction stir processing (FSP) is a solid-state, thermomechanical, metal-processing technique for the preparation of fine and ultrafine grains [17,18,19]. Compared with other SPD technologies, FSP cannot only improve strength but also limits the loss of ductility [20]. This is mainly due to that grain refinement leads to a decrease in the storage capacity of mobile dislocations in the interior grains, which reduces the strain-hardening properties. The strain-hardening behavior of metallic materials plays a significantly important role in the plastic deformation and determines the eventual elongation [21]. Xue et al. [22] pointed out that a low dislocation storage efficiency inside the tiny grains in FSP materials can reduce strain hardening during the tensile deformation process, which results in a decreased ductility. As such, FSP is successfully applied to aluminum alloys [23,24], copper and copper alloys [17,25,26], and magnesium alloys [18,27,28]. Chen et al. [29] have used FSP on an as-cast LAT832 (Mg-8Li-3Al-2Sn (wt. %)) alloy and concluded that the improvement in strength is due to the refinement of α-Mg and the crushing and strengthening effect of Li2MgSn particles. Kumar et al. [19] have studied the effect of FSP on an as-cast magnesium alloy and found that a larger shoulder reduction parameter of the stirring tool resulted in a higher heat input and more sufficient plastic deformation, which leads to a more solid solution of the second phase in the matrix to further improve hardness. Zhu et al. [30] designed a dual-phase Mg-Li alloy with high Al and Zn content (Mg-9Li-5Al-4Zn alloy, LAZ954) and subjected it to the thermomechanical process of FSP, and the yield strength of the alloy increased by 86.4% under the highest heat input condition. Li et al. [31] have conducted the submerged FSP of an LA103Z (Mg-9.98Li-3.01Al-2.81Zn (wt. %)) alloy sheet and showed that α-Mg and β-Li go through complete dynamic recrystallization (DRX). FSP promotes the precipitation of the AlLi phase and the MgLi2Al phase. As a result, the tensile strength increases by ~50%. These efforts focused on the strengthening of the processing area, but there are few reports on the strengthening and microstructure evolution of the individual regions in the processing area of Mg-Li alloys.
Experimental methods and numerical simulations are used to study the FSP technology, but the experimental period is long, and the experimental process is complicated, especially since the temperature-field distribution and material flow behavior are not intuitive, while the numerical simulation can solve this problem simply and effectively. The simulation method is an effective and convenient method for studying the temperature field distribution of FSP. Gao et al. [32] have explored the temperature-field distribution and material flow behavior in the friction stir welding process through numerical simulation, indicating that the maximum temperature is 383 °C and occurred near the pin center. Ji et al. [33] have studied the numerical simulation of the material flow behavior of friction stir welding. The results show that the shape of the stirring pin has an obvious influence on the material flow behavior and velocity field. A stir pin with a spiral groove will make the materials in the thermomechanically affected zone (TMAZ) flow upward.
In this work, a Mg-10Li-3Al-3Zn (LA103Z) alloy is processed by FSP to reveal the strengthening mechanisms of different regions within the processing range. A moving heat-source model is established to simulate the temperature field during FSP and explore the influence of the temperature distribution in the processing area on the evolution of the microstructure based on ANSYS APDL software. It is focused on the effects of FSP on the microstructure evolution and mechanical properties of the alloy.

2. Experimental and Modeling
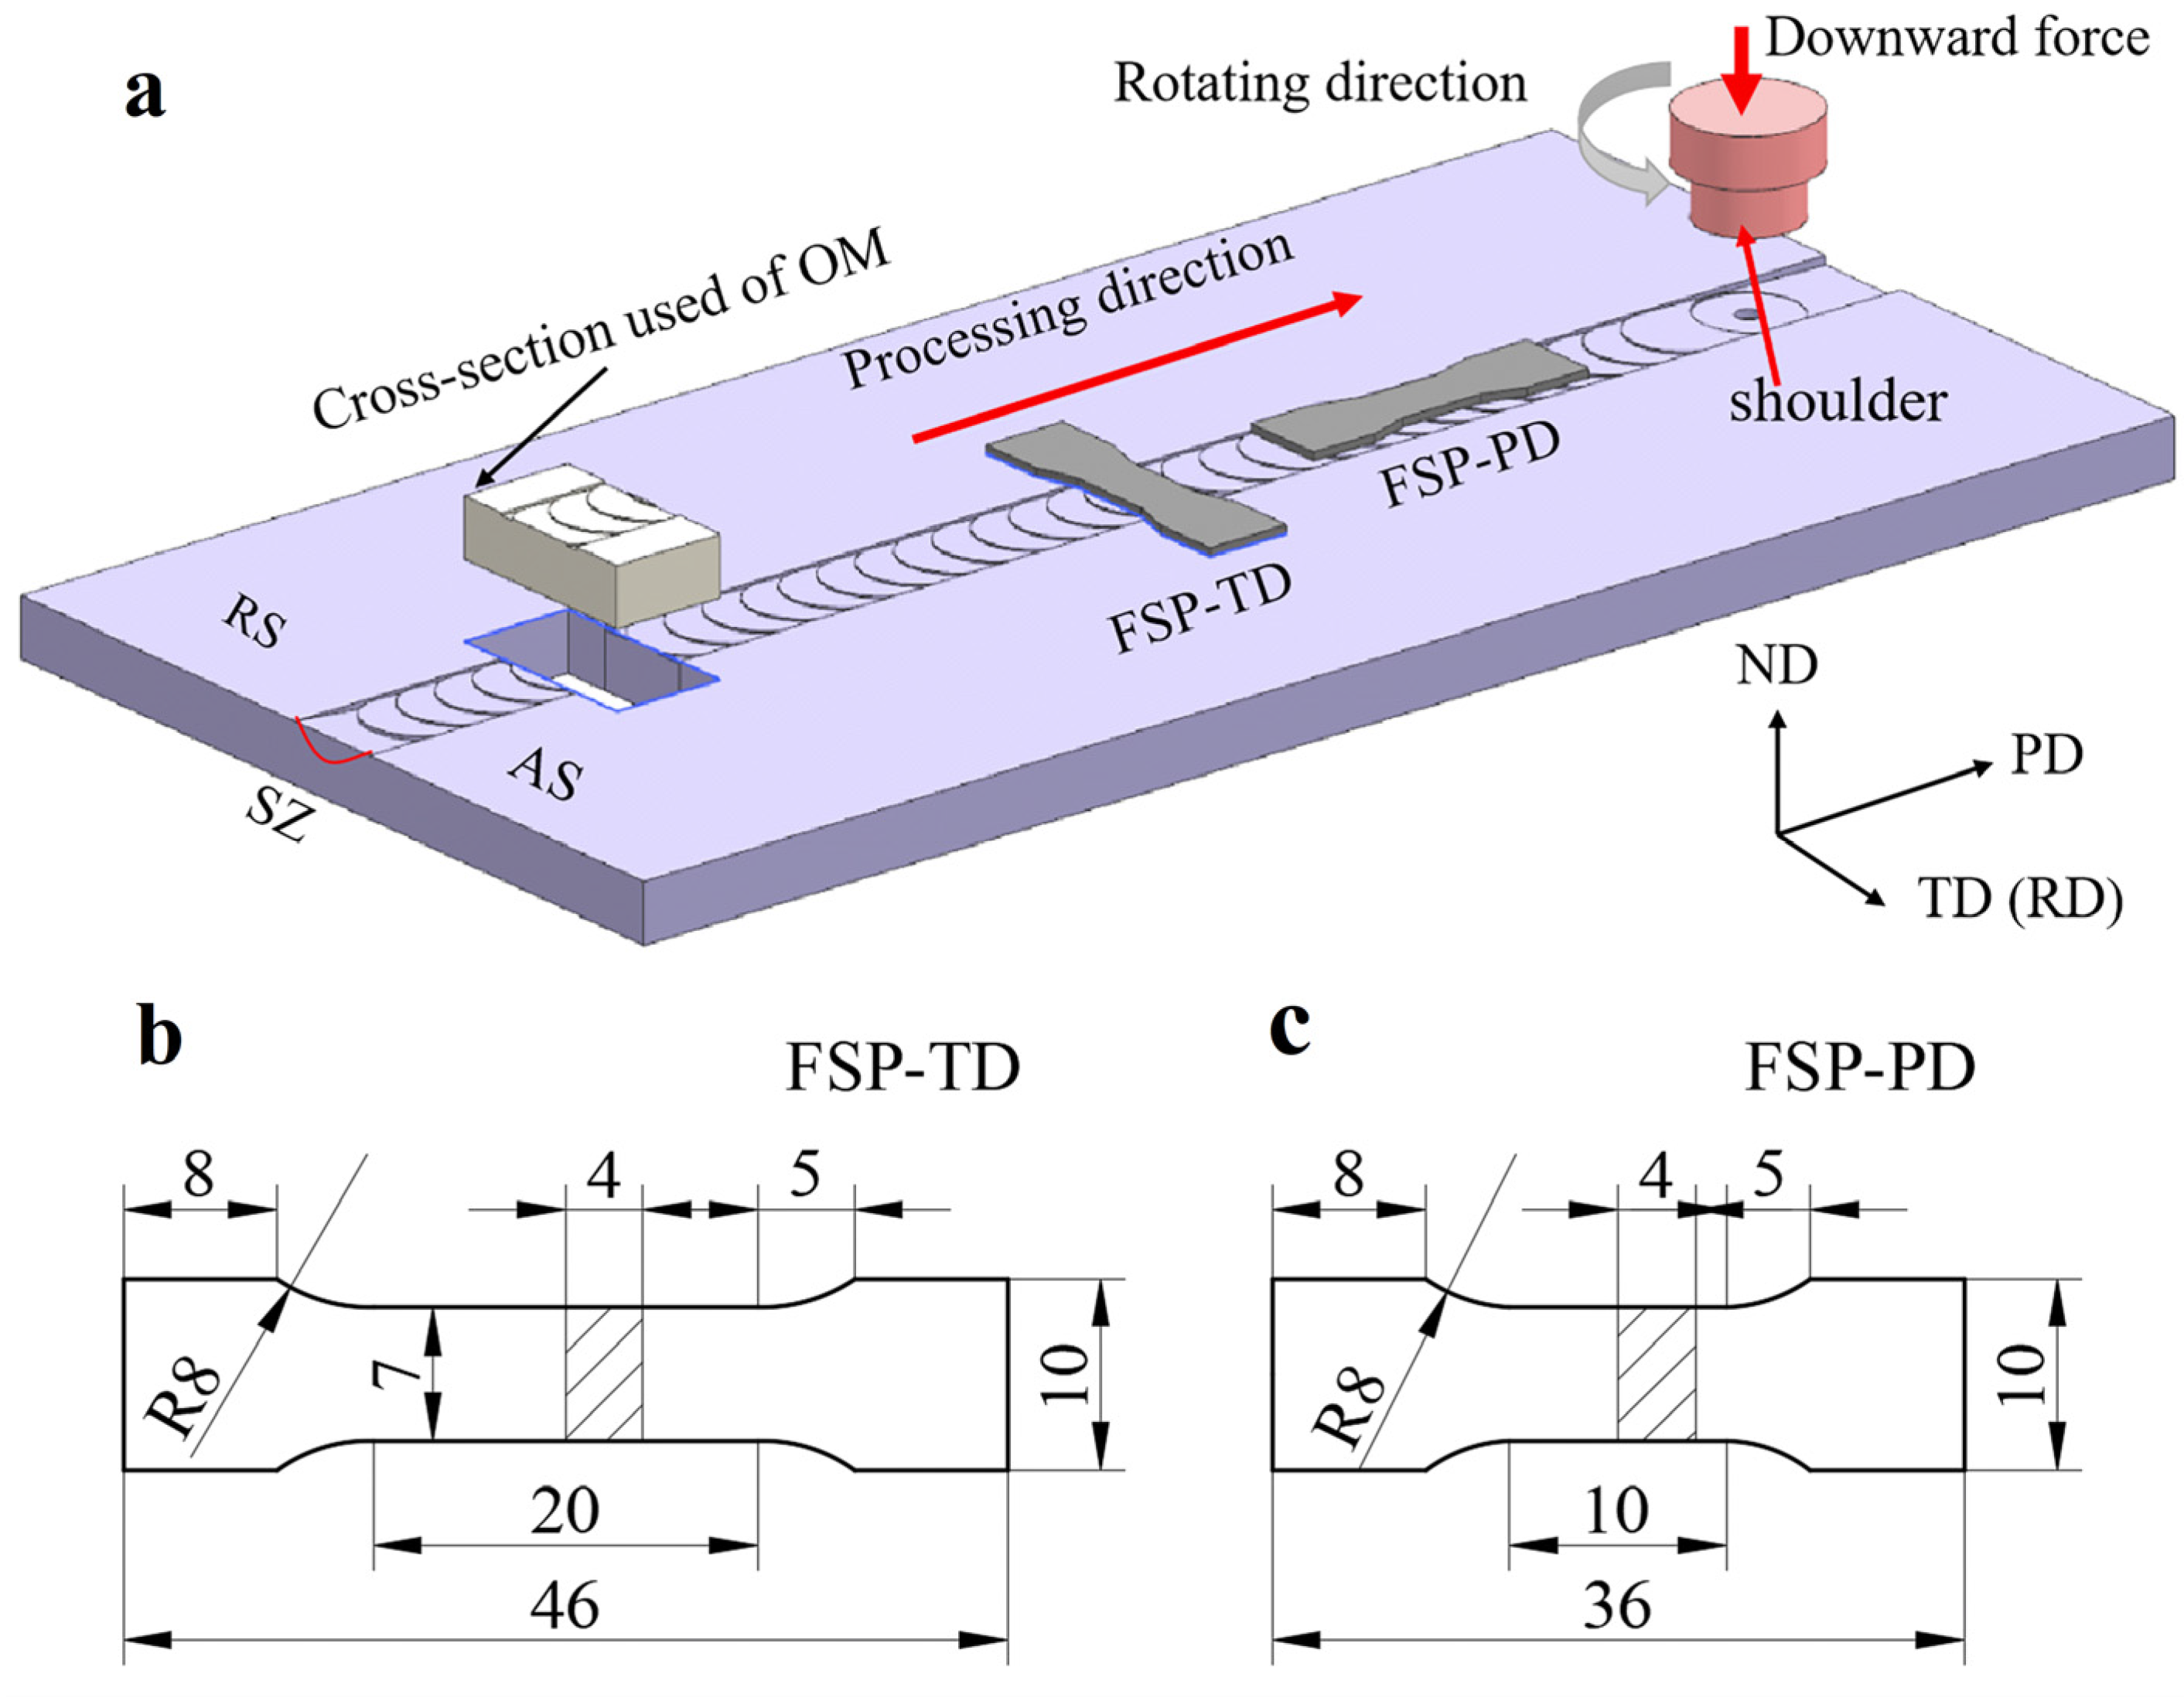
2.1. Experimental

The base material of this work was LA103Z provided by Xi’an Sifang Ultra-light Materials Co., Ltd., Xi’an, China. It was in the form of hot-rolled plates with a dual-phase microstructure, and the plate size was 200 × 100 × 7 mm. The chemical composition of the material was Mg-10.26Li-2.99Al-3.11Zn-0.01Fe-0.01Cu-0.13Si (wt. %). The equipment for FSP was a gantry one-dimensional friction stir welding machine (HT-9JM16X8/1) from Aerospace Engineering Equipment (Suzhou) Co., Ltd., Suzhou, China. The steel stirring tool (WE360) had a cylindrical shoulder with a diameter of 10 mm, a conical stirring pin tip with a diameter of 2.5 mm, a root diameter of 3.5 mm, and a height of 3 mm with a taper thread. FSP was performed in an argon atmosphere to mitigate oxidation of the workpiece. The thickness reduction in the shoulder was 0.1–0.2 mm.
Before FSP, the LA103Z alloy plates were polished to remove the surface oxide layer, and then firmly fixed on the welding platform. The reference directions were designated as follows: the processing direction of the stirring tool (PD), the transverse direction (TD, or rolling direction, RD) normal to the PD, and the normal direction (ND) normal to the processing surface. Such designations are shown in Figure 1a. The FSP processing parameters were conducted at a rotational speed of 800, 1000, and 1200 rpm with a traverse speed of 100, 110, and 120 mm/min. The tilt angle of the stir tool was adjusted to 2.5° to optimize material flow. The shoulder plug depth, or thickness reduction, was 0.1–0.2 mm during FSP.
Metallographic samples were cut by wire electrical discharge machining (wire EDM). The cross-section of the samples was perpendicular to the PD, as shown in Figure 1a. The processed samples were etched with 1.0 vol. % nitric acid alcohol solution after polishing. The microstructures of different regions were analyzed by optical microscopy (OM, DSX-BSW) and scanning electron microscopy (SEM, Zeiss-SIGMA500, ZEISS, Oberkochen, Germany). The phase composition was analyzed by X-ray diffraction (XRD, D/max 2200PC, RIGAKU, Tokyo, Japan) with Cu Kα at 40 kV and 30 mA. A thermal camera (FOTRIC 326Q-L25, FOTRIC, Shanghai, China) was used in this study. It has an uncooled microbolometer detector with a resolution of 768 × 576 pixels (1 mm = 0.17 pixels), a frame rate of 30 Hz, and a pitch of 17 µm. The accuracy of measurement is ±2 °C or ±2% of the reading. The thermal sensitivity measured by the noise equivalent temperature difference (NETD) is <30 mK. The field of view (FoV) is 25° × 19°. The thermal imager takes thermal images at a fixed position 1 m away from the sample.
The tensile properties of the processed alloy were evaluated on a universal testing machine (Instron-5848, INSTRON, Boston, MA, USA) with a tensile rate of 1mm/min at room temperature. Tensile samples were prepared with orientations and positions shown in Figure 1, and the dimension of the tensile specimens as shown in Figure 1b,c, all with a thickness of 4 mm (stirring pin length 3 mm, heat-affected zone thickness 1 mm) (GB/T 228.1-2021 [34], China). The microhardness of the processing area was also measured with a Leco LM248TA. The tensile fracture surface was observed by SEM (TESCAN VEGA 3 LUM, TESCAN, Brno, Czech).

2.2. Modeling

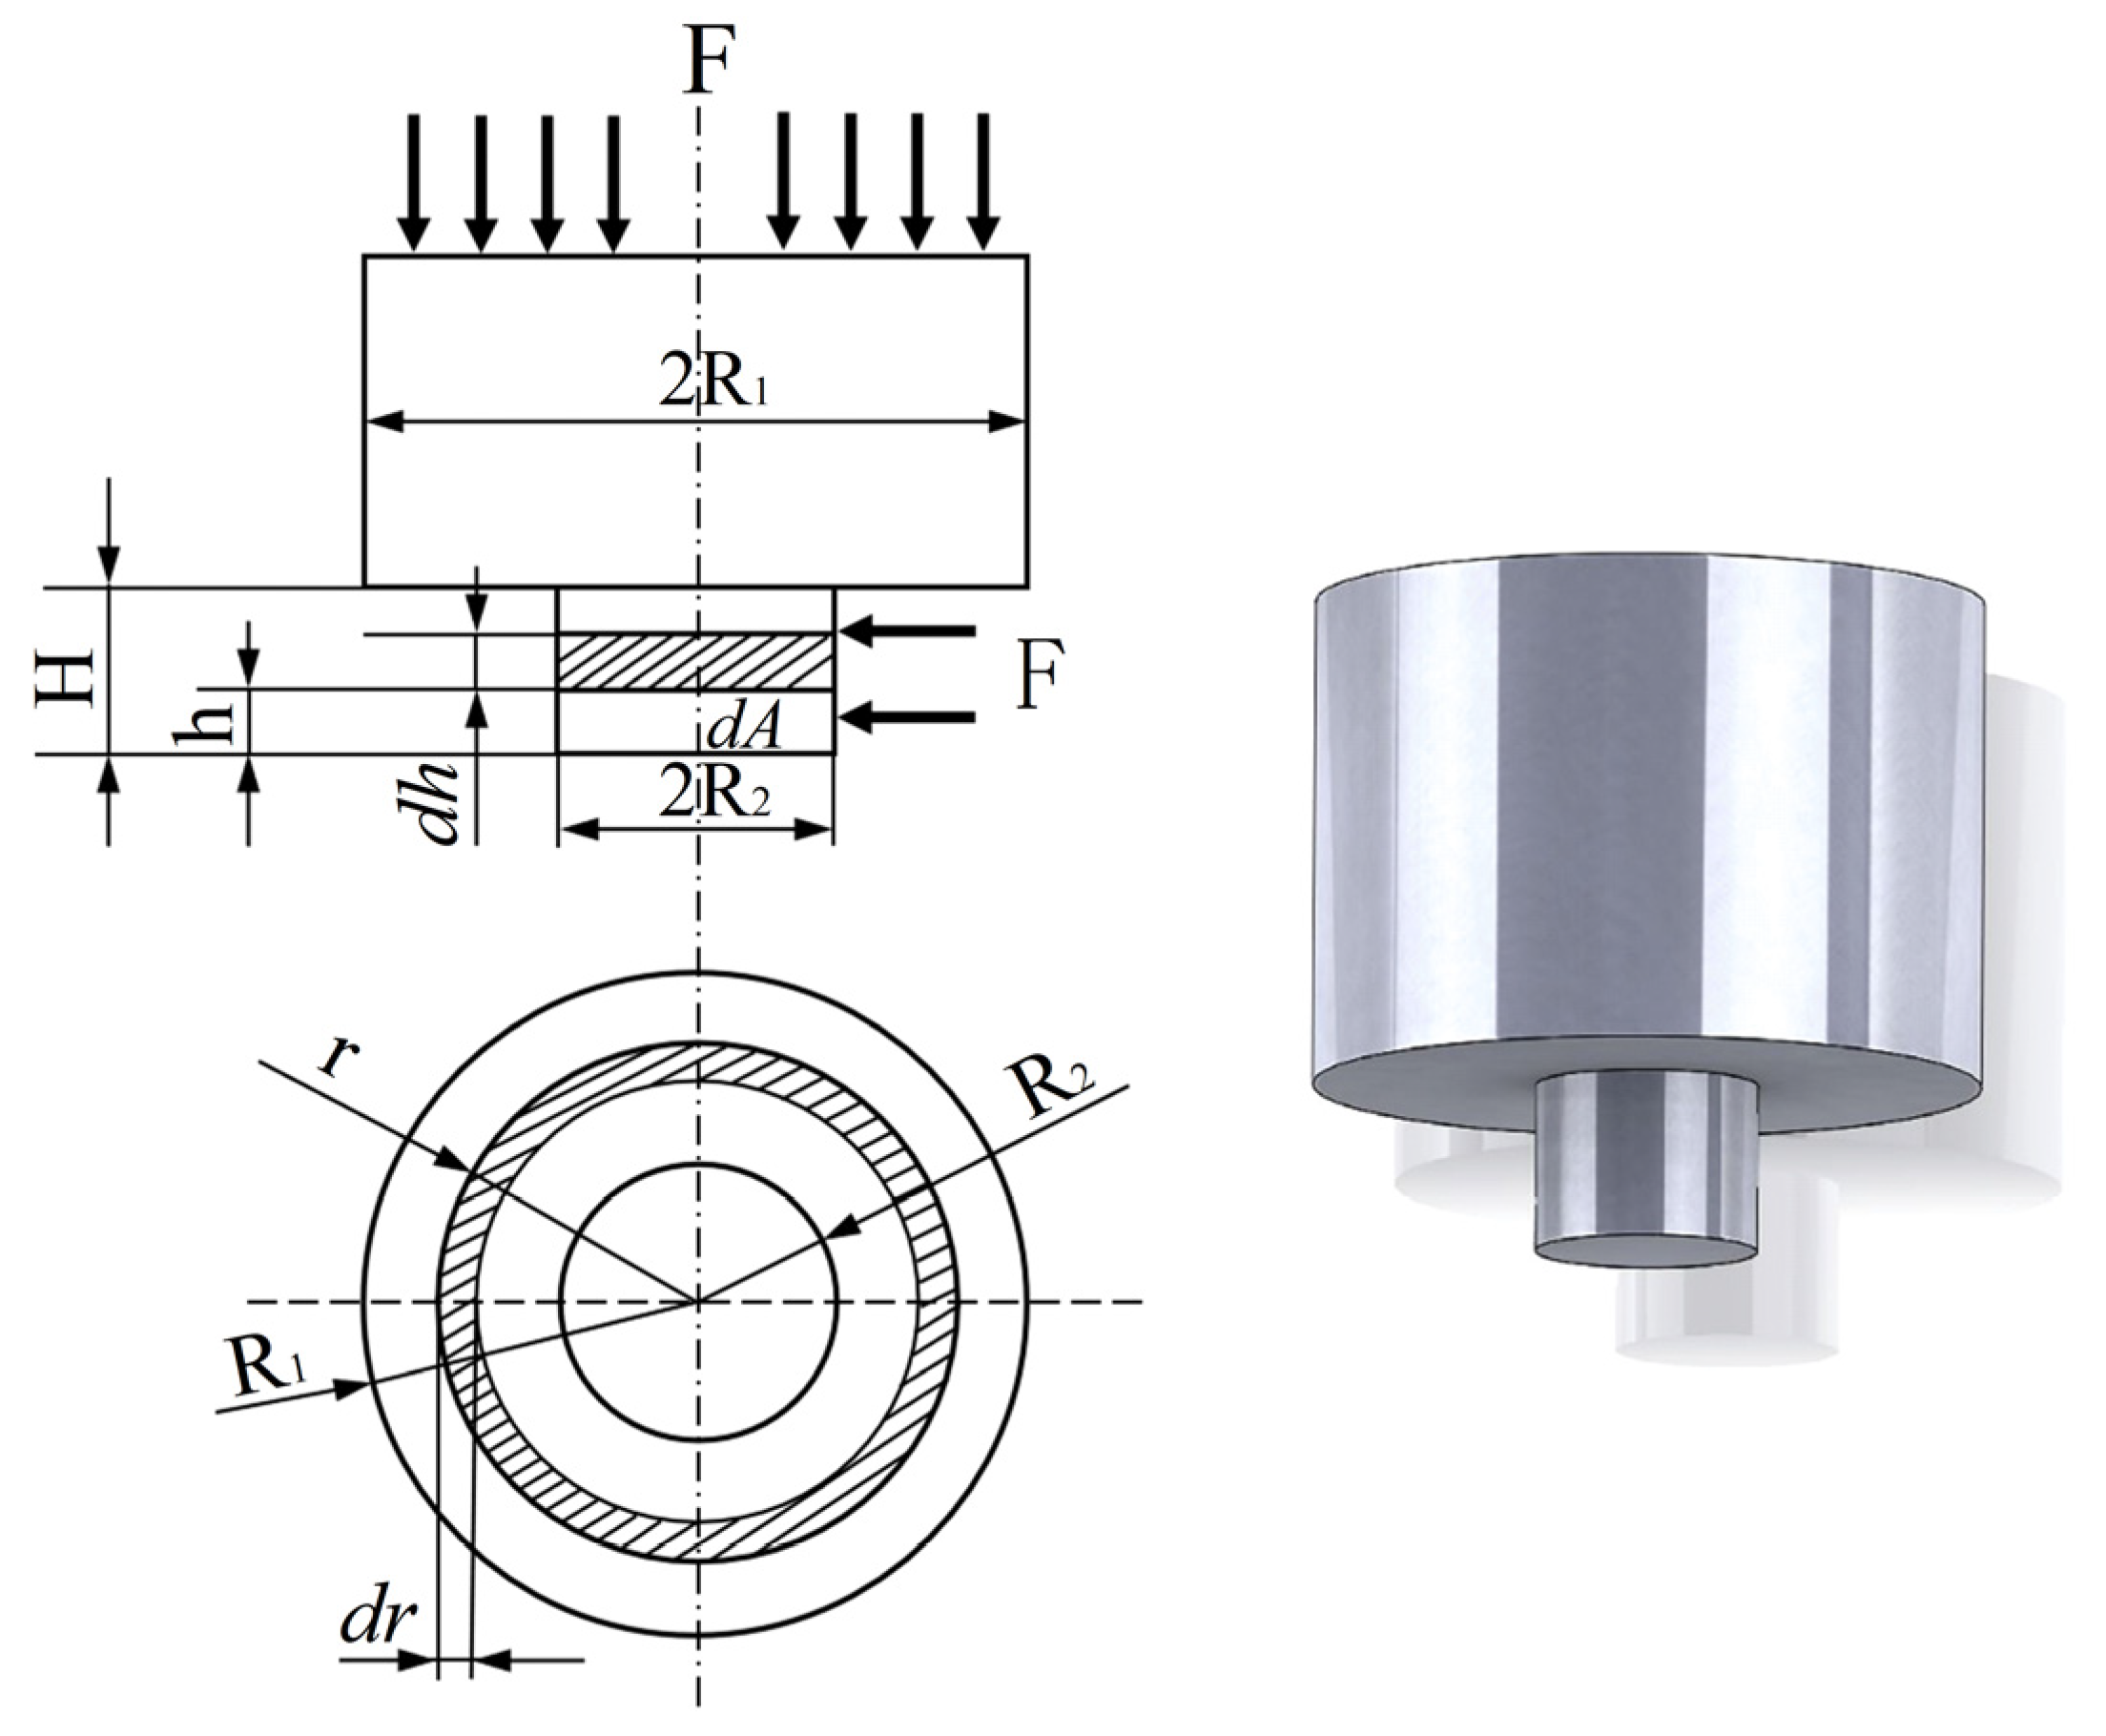
2.2.1. Moving Heat-Source Modeling

Friction heat generation is the main heat source during FSP. The heat-source model of the shoulder and pin of the stir tool are established. Figure 2 shows the model size of the stir tool. The radius of the shoulder and stir pin is R1 (m) and R2 (m), respectively. H (m) is the length of the stirring pin, and F (N) is the load during processing. Taken the infinitesimal ring dr in the shoulder, assuming its friction coefficient is μ, the friction (f) is expressed as
d f = μ F π R 1 2 2 π d r = 2 μ F R 1 2 r d r
The moment (M) associated with friction (f) is expressed as
d M = d f · r = 2 μ F R 1 2 r 2 d r
The heat-generation power (P1) of the shoulder is expressed as
P 1 = R 2 R 2 π N μ F 15 R 1 2 r 2 d r = π N μ F ( R 2 3 R 2 3 ) 45 R 1 2
The heat-flux density (q1) of the shoulder is expressed as
q 1 = P 1 S = N μ F ( R 1 2 + R 2 2 + R 1 R 2 ) 45 R 1 2 ( R 1 + R 2 )
Similarly, the heat-generation power (P2) at the bottom of the stirring pin can be expressed as
P 2 = π N μ F R 2 3 45 R 1 2
The heat-generation power (P3) at the side of the stirring needle is expressed as
P 3 = 0 H d p d r = 3 π 2 σ S H N · R 2 2 45 3
The heat-flux density (q2) of the stirring needle is expressed as
q 2 = P 2 + P 3 π R 2 2 H
In the above formulas [35,36], N (rpm) is the rotation speed of the stir tool, S (m2) is the surface of the shoulder, and H (m) is the distance from the bottom of the stirring pin to the shoulder.

2.2.2. Finite Element Modeling

In the simulation process, it is assumed that the density, Poisson’s ratio, and elastic modulus of the LA141 magnesium–lithium alloy do not change with temperature, but the thermal conductivity, specific heat capacity, and yield strength do change with temperature. The change in the thermal physical parameters of the material with temperature is shown in Table 1.
ANSYS software provides many types of units, and the SOLID70 unit with three-dimensional heat transfer capability is often selected for simulation in temperature-field studies [38]. The finite element model of the sheet for simulation is shown in Figure 3a. The following assumptions were made during the establishment of the finite element model. During the simulation process, the thermal conductivity of the welding fixture and the holding part of the mixing head were ignored. Half of the model is taken for simulation to reduce the computing time due to the symmetrical processing area. Figure 3b shows the ANSYS finite element mesh dividing of the sheet. The nonuniform mesh is generated in this simulation which not only ensured the accuracy of simulation results but also shortened the simulation period. In addition, some physical parameters of the alloy are tested. The density is 1.53 g/cm3, the thermal conductivity is 24.6 W/m·K, and the specific heat capacity is 1448 J/kg·K. In the model, the heat transfer is specified by convective boundary conditions. The heat transfer coefficient between the alloy plate and the pad is set to be 150 W/(m2·°C), and the heat transfer coefficient of other surfaces is set to be 30 W(m2·°C) [39]. The processing parameters of this simulation are set as 300–1200 rpm for the rotation speed and 30–120 mm/min for the travel speed, respectively.

3. Results and Discussion

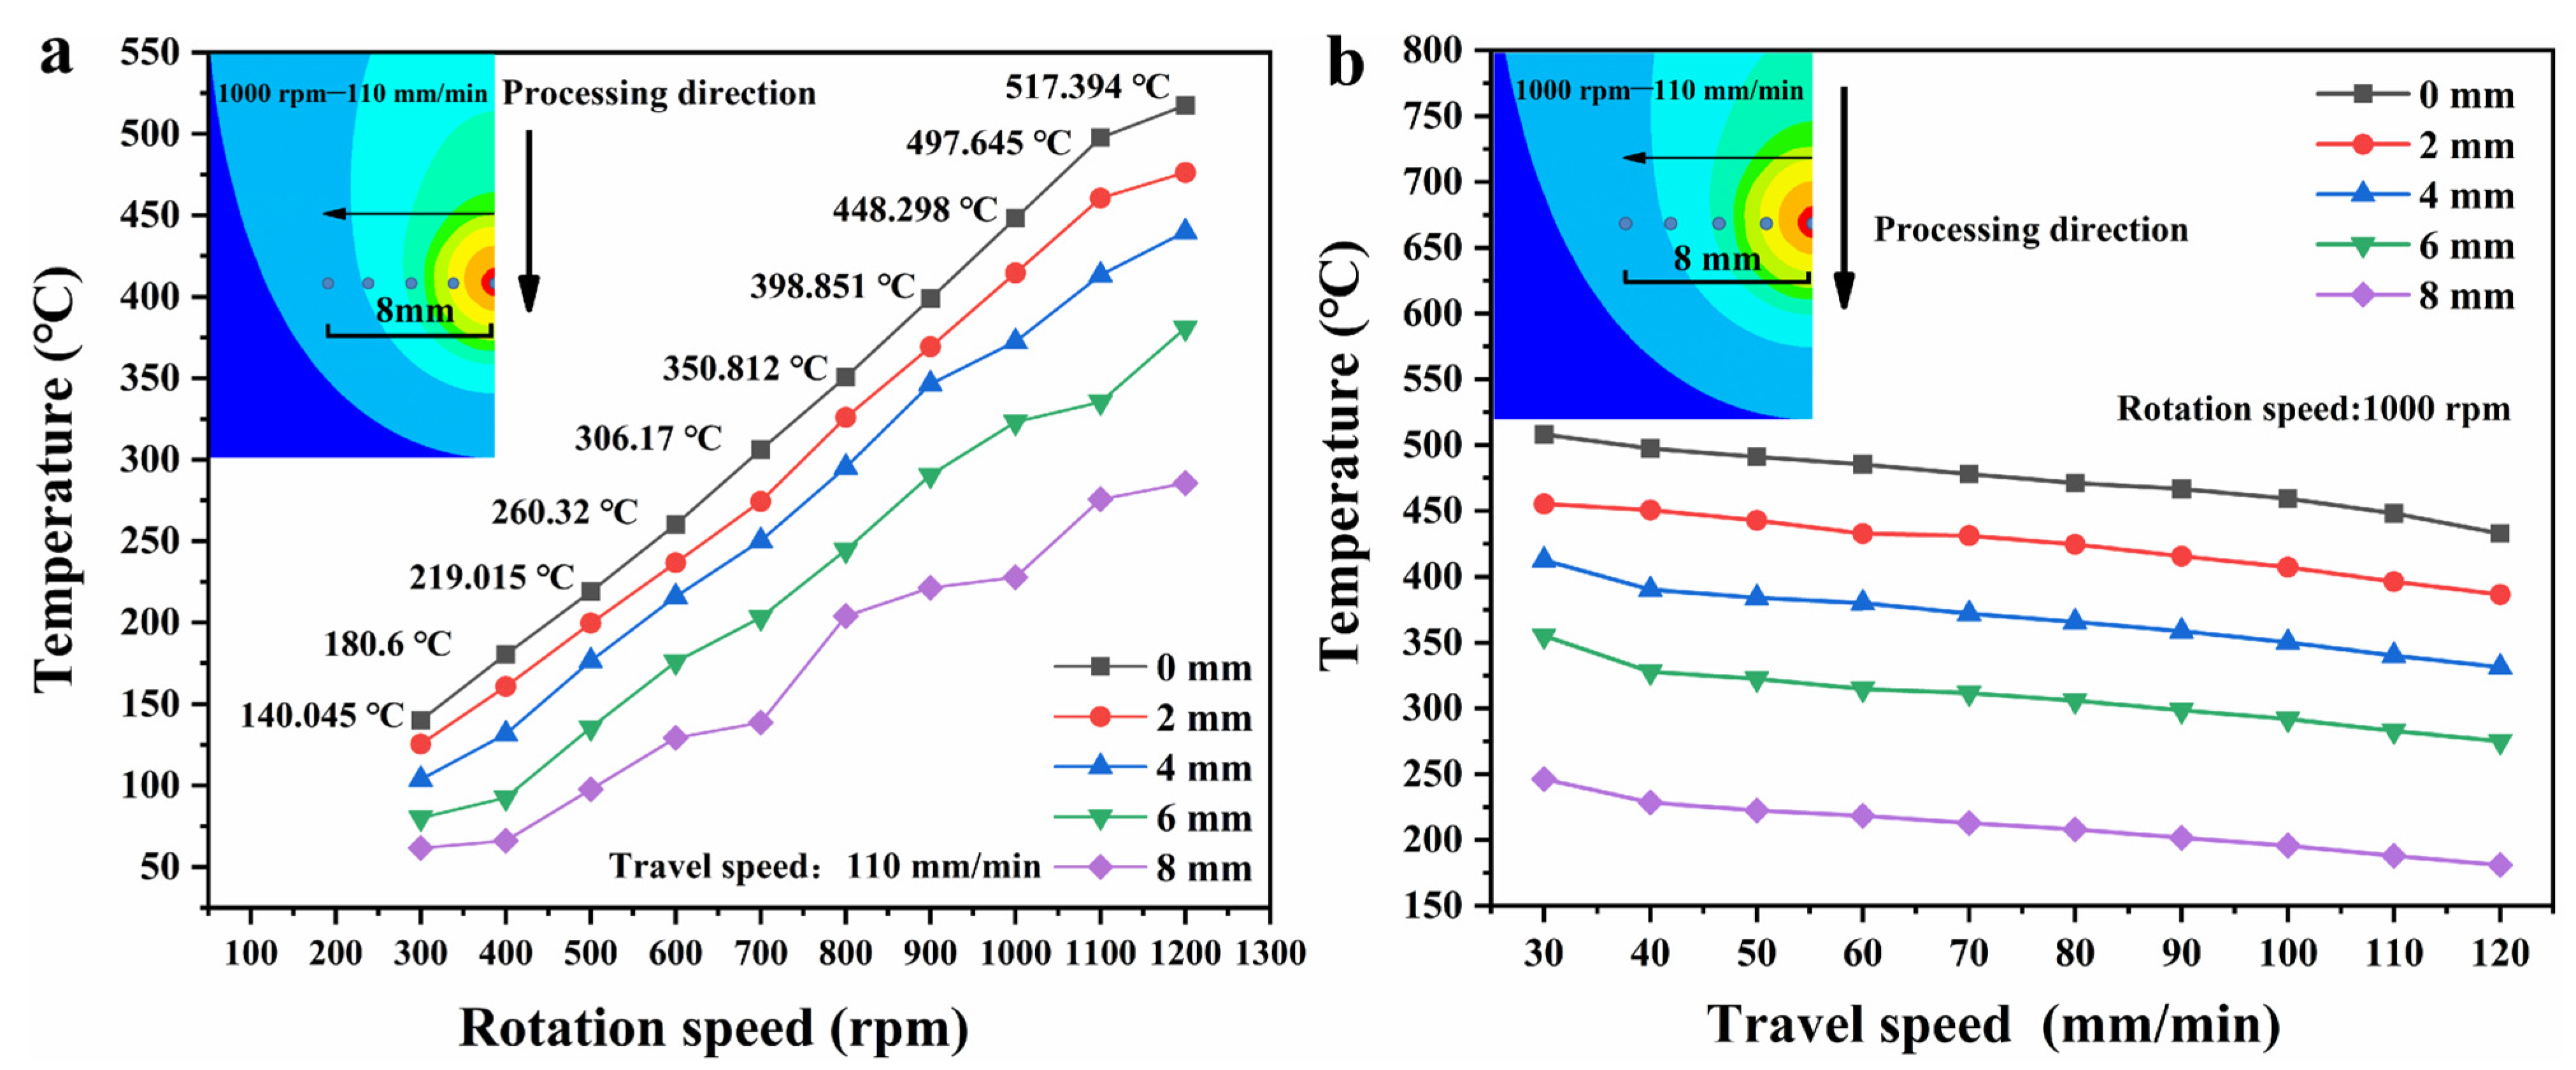
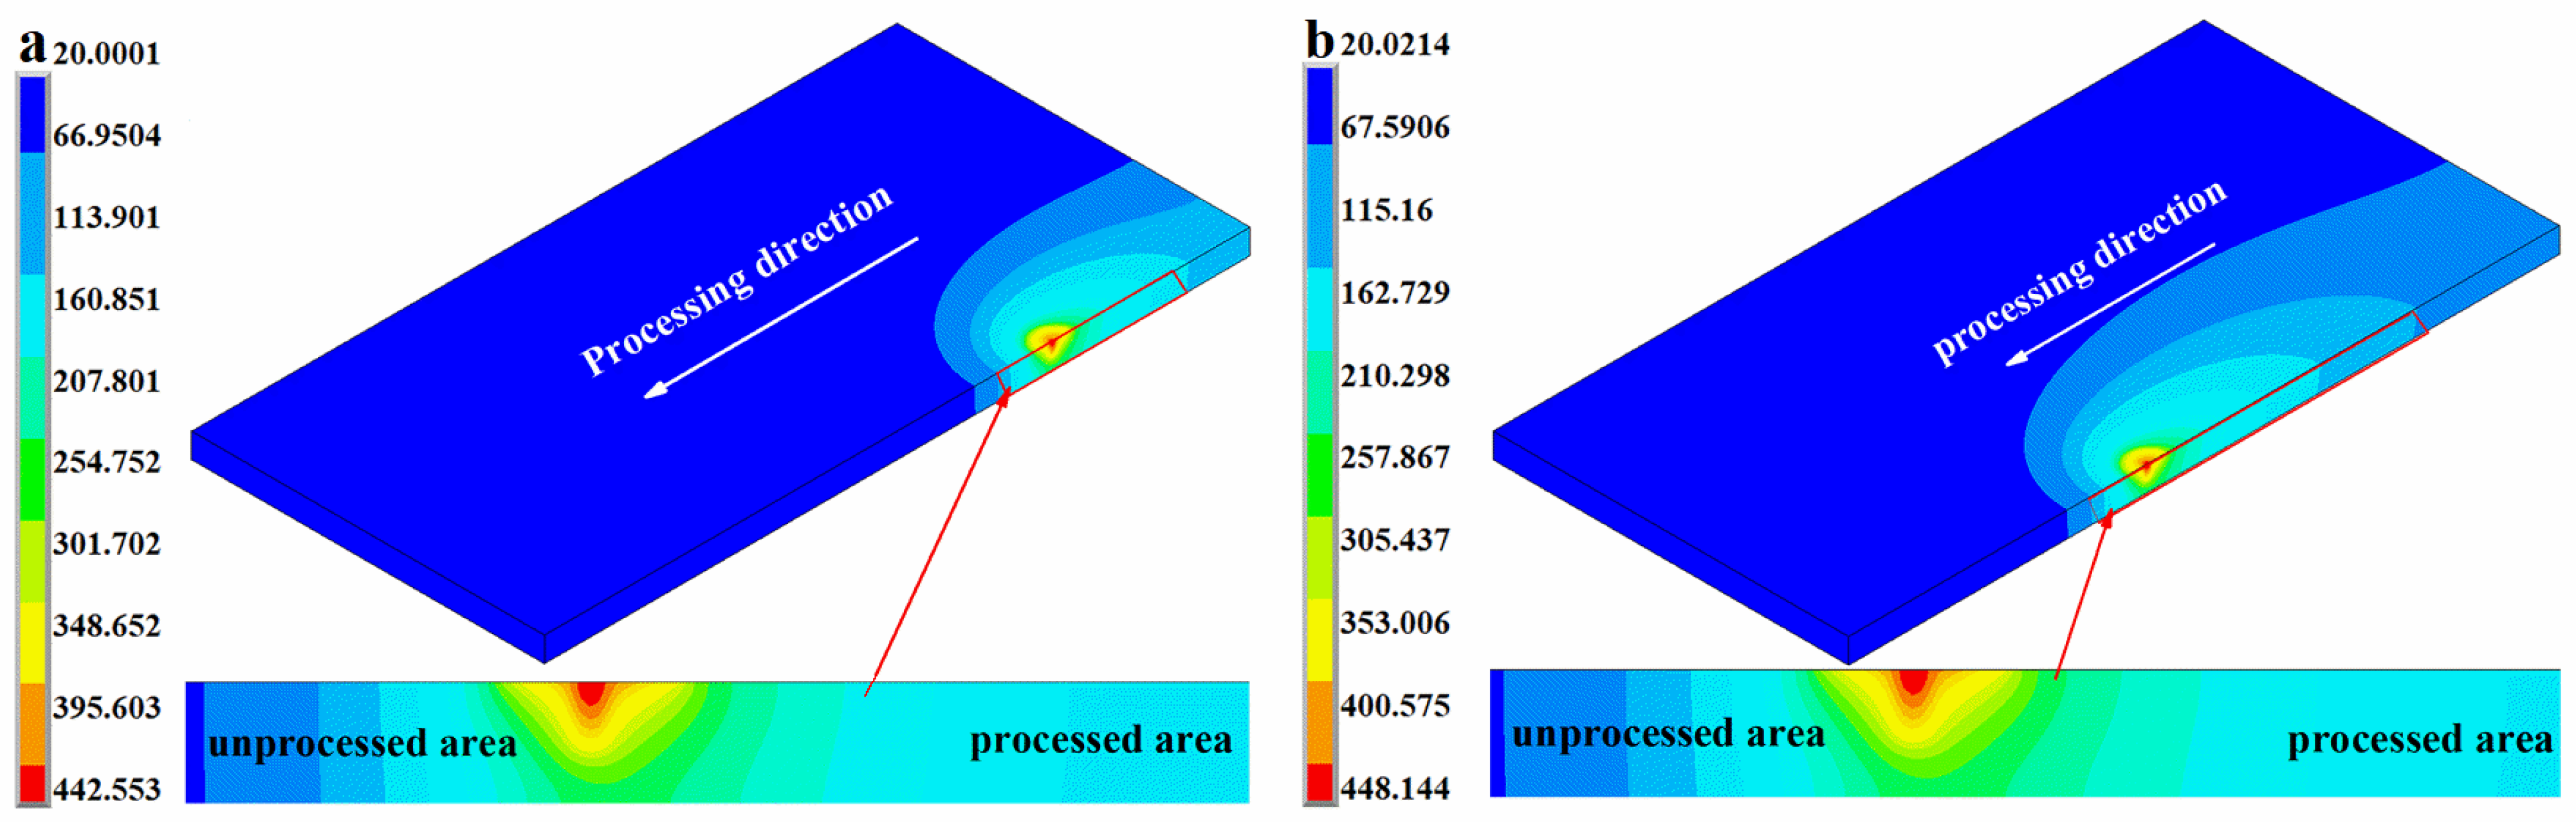
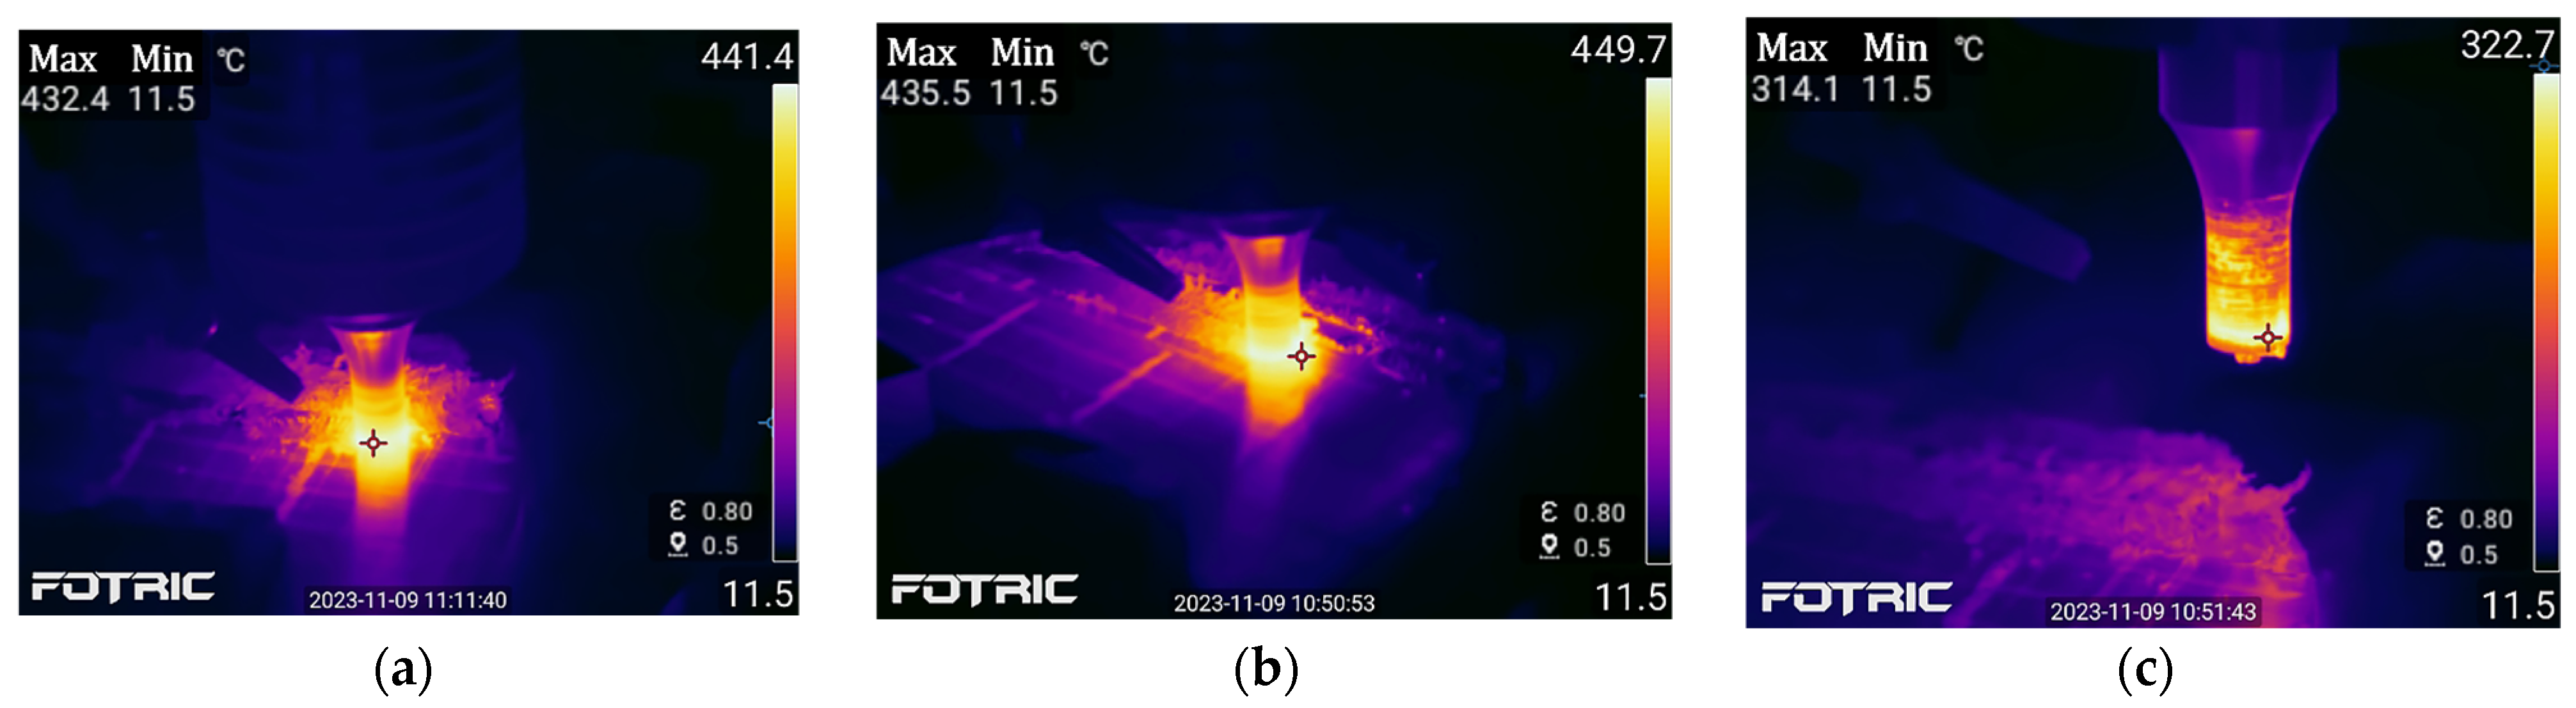
3.1. Temperature Distribution

Figure 4 shows the temperature trend after steady processing at the rotation speed of 300–1200 rpm and travel speed of 30–120 mm/min. It can be seen that the temperature of the processing area increases with an increase in rotation speed and decreases with an increase in travel speed. The influence of rotation speed on the temperature of the processing area is greater than that of the travel speed. Therefore, the temperature of the processing area could be regulated by changing the rotation speed and travel speed. A high rotation speed and low travel speed may cause the peak temperature to approach the melting point of the alloy [32]. However, a rough processing surface quality is caused by a low travel speed. Hence, a high travel speed improves surface quality, and a high rotation speed controls the temperature field during processing.
The temperature field after steady processing for 33 s and 76 s at a rotation speed of 1000 rpm and a travel speed of 110 mm/min is shown in Figure 5. It can be seen from Figure 5a,b that the temperature field in the processing area has become stable after steady processing for 33 s. The peak temperature is 442 °C at 33 s, which is only 6 °C different after steady processing for 76 s. A.N. Albakri et al. [40] conducted stirred friction processing of an AZ31 Mg alloy which was investigated by numerical modeling and experiments. The results showed that the peak temperature after stable welding was 470 °C when the rotation speed was 1000 rpm and the travel speed was 180 mm/min, which is close to the simulation results of this work.
Figure 6 shows one of the raw and unprocessed thermal image frames in comparison to its counterpart optical image. The peak temperature of the work after 33 s of stabilization treatment was 432 °C, and the peak temperature after 76 s of fully stabilized treatment differed by only 4 °C. At the end of the work, the temperature of the stir tool was around 314 °C.

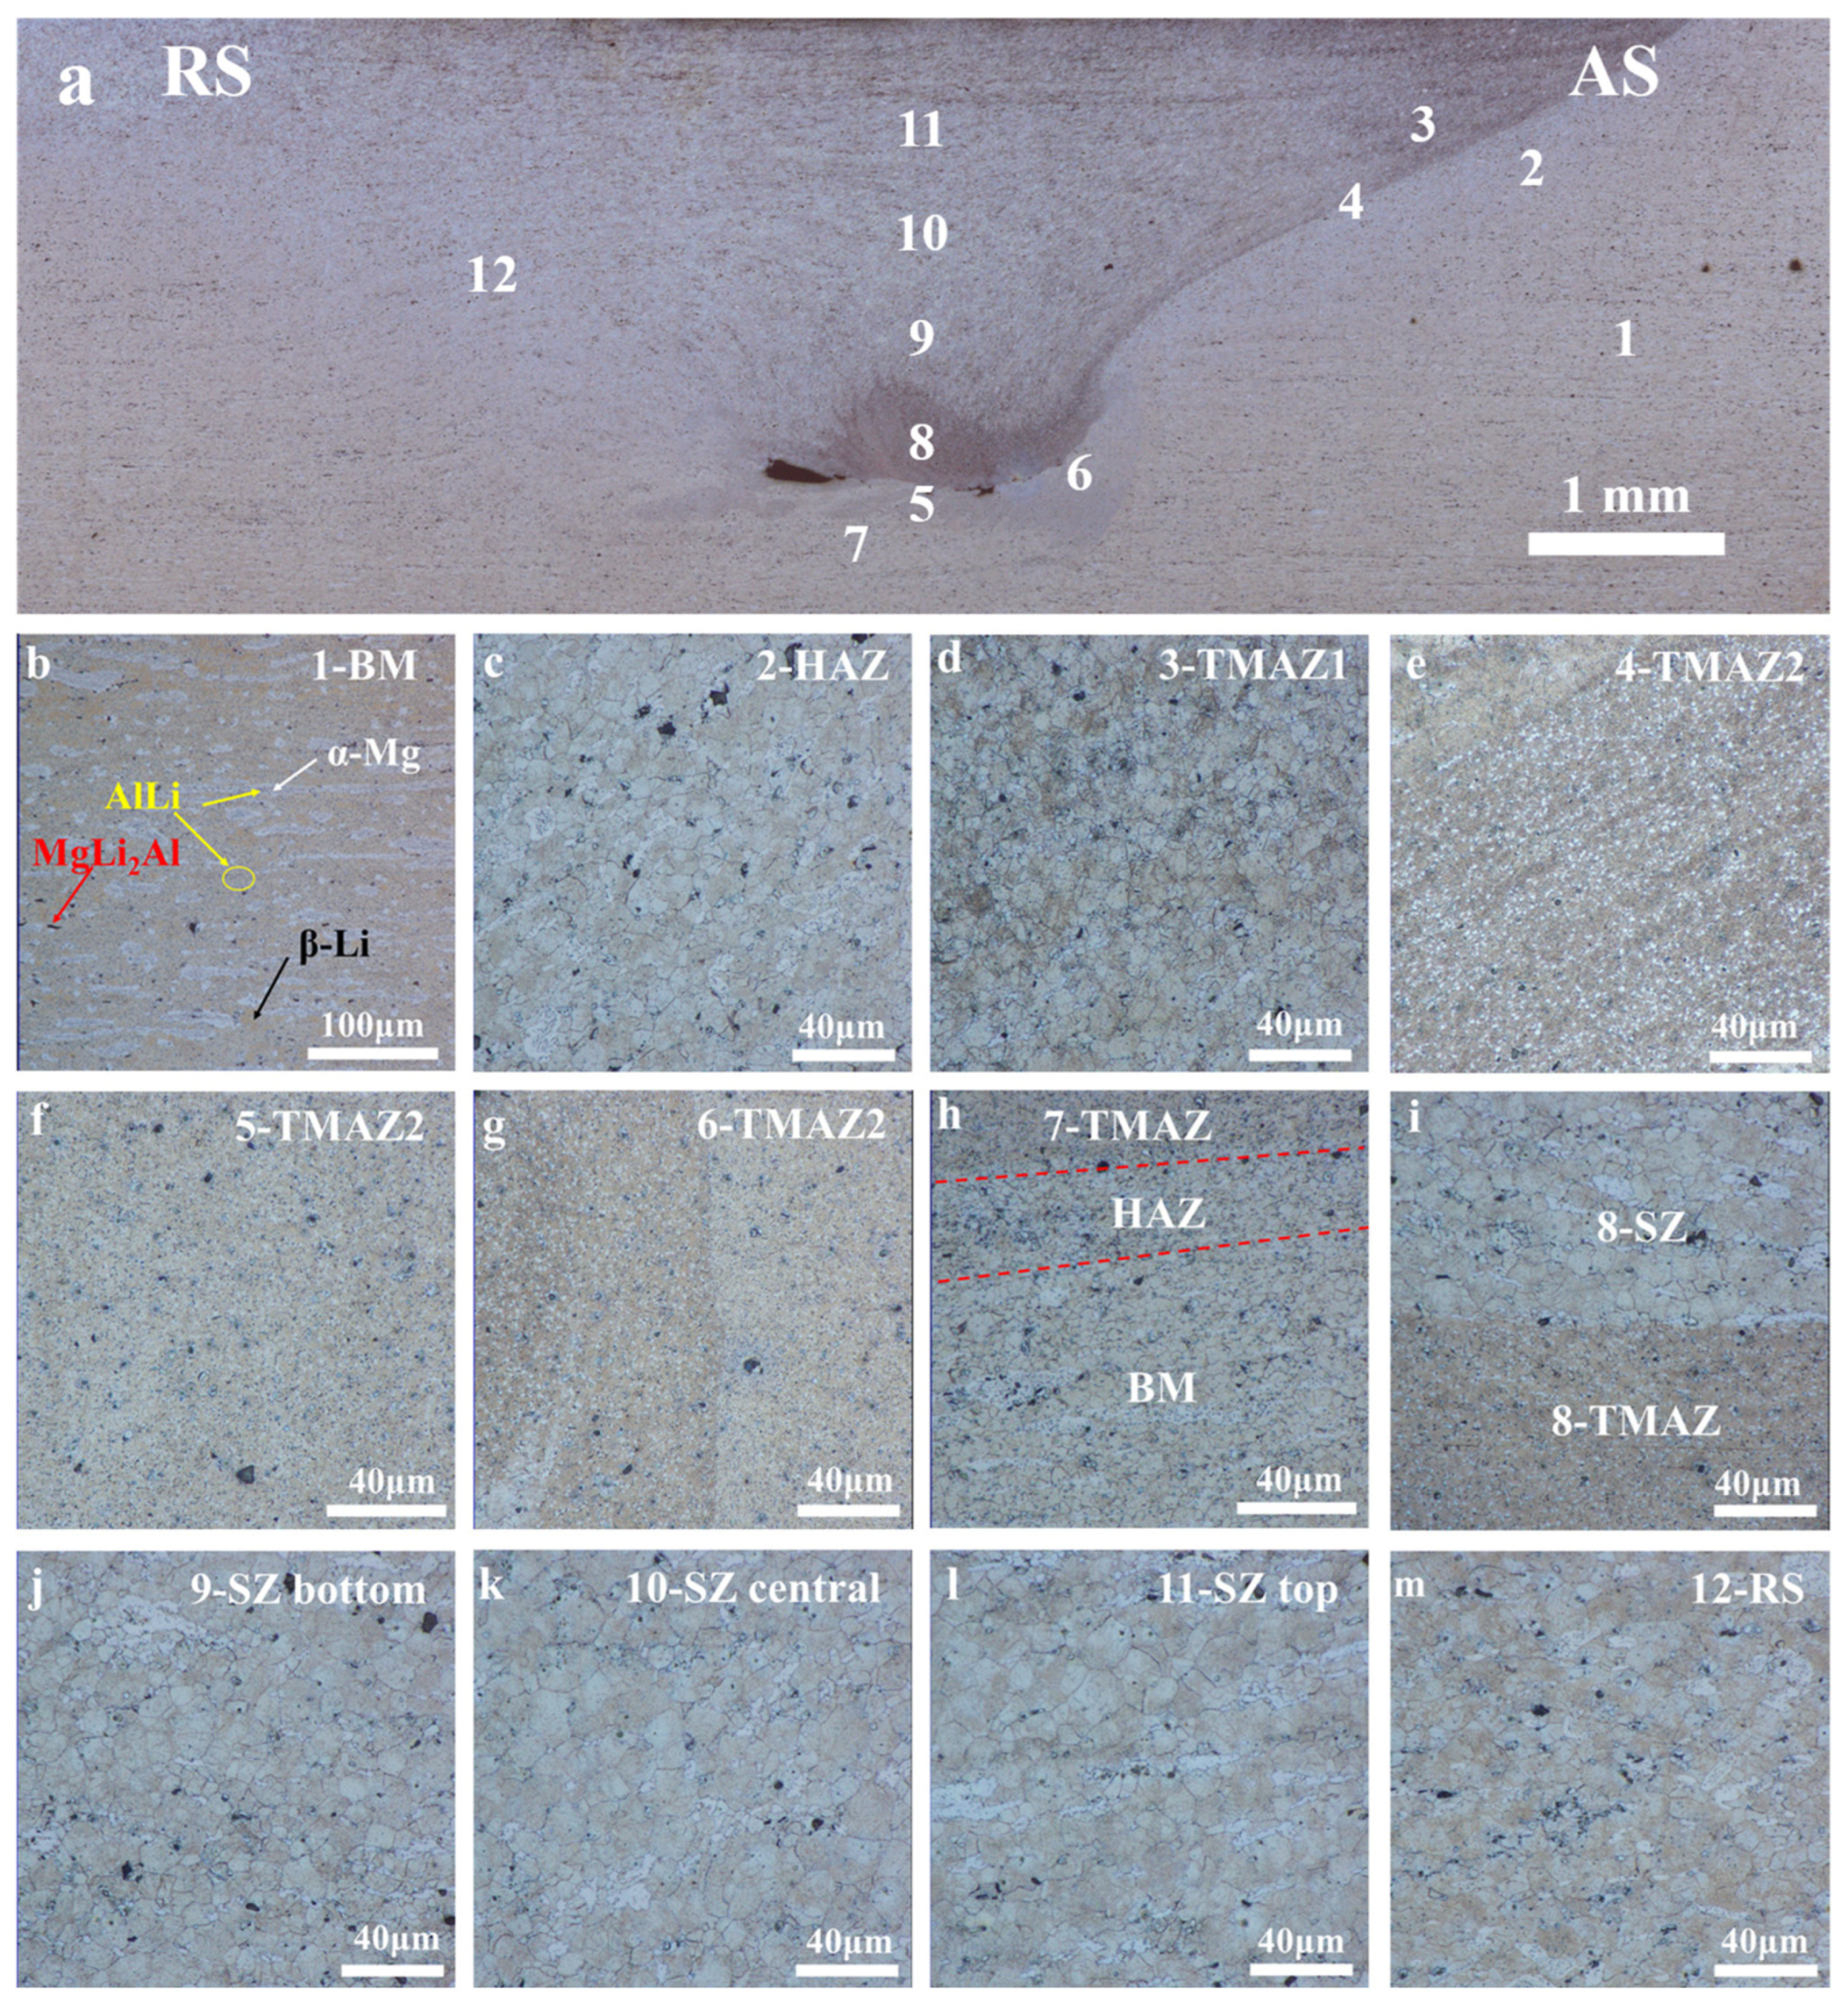
3.2. Microstructures

Figure 7a–c shows some low-magnification optical images of the processing area at travel speeds of 100, 110, and 120 mm/min and a rotation speed of 800 rpm, respectively. Good-quality joints are produced with these processing parameters, and only a small amount of flash is generated during FSP, but it is easily removable. Figure 7d shows the low-magnification cross-sectional view of the FSP-processed LA103Z. The right part is the advancing side (AS), and the left is the retreating side (RS). A bowl-shaped processing area with an obvious boundary could be observed. It is noteworthy that the AS can be observed with a distinct processed macrotexture, while the RS did not have this phenomenon that is related to the direction of metal plastic flow [40]. The reasons for this phenomenon will be analyzed in detail later. Based on this optical image, the cross-section is divided into four zones including the base metal (BM), the heat-affected zone (HAZ), the thermomechanically affected zone (TMAZ), and the stir zone (SZ). A similar morphology is observed in an FSP-processed Mg-Li-Al-Zn-Si-Fe-Cu alloy [20]. The HAZ is very narrow, which is explained by the small size of the stirring pin and the limited diffusion due to the low heat generated by friction. Processed tunnel defects are detected at the bottom of the processing area.
The XRD results of the BM and FSP samples are provided in Figure 8. Both the BM and FSP samples are composed of α-Mg, β-Li, AlLi, and MgLi2Al phases. The XRD intensity of the matrix β-Li is much higher than those of α-Mg, AlLi, and MgLi2Al phases. Compared with the BM sample, after FSP, the intensity of β-Li diffraction decreases by half and peak broadening is observed. The hot-rolled BM has a strong texture, but the texture is randomized after FSP. The XRD peak broadening indicates a grain size refinement by FSP.
To further analyze the microstructure evolution induced by FSP, OM and SEM with back-scattered electron (BSE) mode are used in combination with the advantages of OM and SEM in this work; the results are shown in Figure 9 (OM) and Figure 10 (SEM), respectively. The different zones in the joint are marked in the low-magnification optical images as shown in Figure 9a. The microstructure of various zones is detailed as shown in Figure 9b–m and Figure 10a–h. The base metal (BM) exhibited an obvious dual-phase microstructure and limited precipitated phases as shown in Figure 9b and Figure 10a, consistent with the corresponding XRD results (Figure 8). Here, the matrix is β-Li with a grain size of 10.4~24.6 μm; the white phase with an obvious rolling orientation is α-Mg (Figure 10a shows a light gray strip in SEM). The tiny black AlLi particles are gathered inside the α-Mg phase (white particles in Figure 10f). MgLi2Al appears as small black blocks under OM (Figure 9) and bright blocks in SEM (Figure 10).
Figure 9c shows the microstructure of the HAZ on the surface of the alloy. The α-Mg phase is fractured and spheroidized under the influence of heat during FSP. Furthermore, a small amount of α-Mg phase and part of the AlLi phase are dissolved in the matrix, which can be seen in the higher-magnification SEM images (Figure 10b). The main heat input is from the shoulder of the stirring tool during FSP. Because of the high initial energy density of the rolled material, FSP should easily promote recrystallization of the deformed microstructure. It may even lead to grain growth due to the low melting point of the alloy, with a grain size of 8.8–18.6 μm, close to that of the BM (10.4–24.6 μm). There is no obvious grain refinement in the HAZ, indicating that the strengthening in this region is primarily from solid solution. The microstructure of the TMAZ near the surface in the AS region is displayed in Figure 9d and Figure 10c. The α-Mg phase is the block or particles and is different from the α-Mg in the BM (Figure 9b) and HAZ (Figure 9c). In Figure 10c, equiaxed grains are observed in the non-ultrafine grain region of TMAZ1, and the α-Mg precipitated along the grain boundaries. The strong crushing effect of the stirring tool leads to the formation of equiaxed grains. Figure 9e–g shows the ultrafine grain microstructure in the TMAZ. The α-Mg exists as ultrafine and uniform small particles. The formation of the TMAZ2 area (Figure 9e) is due to the upward flow of the material at the bottom under the action of the stirring pin, and the ultrafine-grained microstructure at the bottom of the processing area is transferred to this location [32]. Figure 10d shows the high-magnification morphology of Figure 9f (TMAZ2). The grain size is 3.8–4.9 μm. This area is composed of recrystallized grains, and the α-Mg is precipitated discontinuously from the grain boundaries, along with a small amount of precipitation within the grains with a size of 0.2–1.7 μm. Because of the heat input generated by the shoulder, the α-Mg is firstly dissolved into the matrix, and then precipitated out during cooling. After steady processing, the peak temperature of the SZ is above 440 °C, and the temperature of the TMAZ is about 350 °C in this work. The solid solution of α-Mg and AlLi are within this temperature field [41,42]. Wei et al. [43] investigated the effect of α-Mg precipitation on the strength of a Mg-Li-Zn-Y alloy, showing that the bulk α-phase disappeared with a short solid solution treatment at 450 °C. In addition, a large linear velocity at the edge of the shoulder and stir pin body has an obvious mechanical crushing effect [44], and it further induces recrystallization to occur in β-Li. In the TMAZ, the shoulder edge of the stirring tool and the surface of the stirring needle are in a high-stress zone [45]. The residual stress and temperature effects make the α phase precipitate at the grain boundary and inhibit the growth of β-Li grains during cooling. As shown in Figure 9g, the α-Mg on the left is sporadic versus the right. The ultrafine grain structure in the TMAZ2 region is caused by the solid solution of the α-Mg and the refinement of the β-Li grains. Figure 9h shows the morphology at the bottom of the processing area with the TMAZ, HAZ, and BM, respectively.
The microstructures of the SZ bottom and TMAZ are shown in Figure 9i. Compared with the TMAZ, the SZ had larger β-Li grains because of a higher heat input. The horizontal distribution of the residual α-Mg in the SZ is consistent with the rotational direction of the stirring tool. Figure 9j–l (OM) and Figure 10e–g (SEM/BSE) show the microstructure of the SZ in the thickness directions. The SZ region presents an obvious gradient microstructure, and the grain size at the top (~15 μm) is larger than that at the bottom (~10 μm). In the bottom area of the SZ (Figure 10e), dense reticular substructures are observed. A small amount of massive α-Mg and AlLi phases are present in the central area of the SZ (Figure 10f), the same as seen in the result of the OM image. In the top area of the SZ (Figure 10g), the finer precipitates and substructures could be observed, and the fractured equiaxed grains are also one of the most prominent features in this area. This is because the heat input along the thickness direction is different. The top area of the SZ has a higher heat input than the bottom [1]. The main reason for the formation of the gradient microstructure is the influence of the heat input. Due to the violent and rapid movement of the stirring pin, dislocation multiplication occurred in the crystal. Continuous dynamic recrystallization occurs under the action of friction heat resulting in a large number of substructures.
Figure 9m and Figure 10h show the microstructure of the RS. In Figure 9m, this zone has almost the same grain size as the center of SZ (5.4–15.3 μm), and the α-Mg appeared as a short strip randomly and uniformly distributed in the matrix. Figure 7d shows that the RS does not have a pronounced plastic flow texture compared with the AS side. The same result is shown in Figure 10h, and the reasons are as follows. One of the results is that the flow pattern of materials around the stirring pin is a spiral movement [32]. The AS has an oblique upward texture on account of the stir tool being rotated counterclockwise, and the material at the bottom moves up spirally under the action of the shoulder, as shown in Figure 9e. In addition, the metal plastic flow direction of the AS and RS is different. Ji et al. [33] studied the numerical simulation of metal plastic flow in friction stir welding. The stirring tool is in the shape of a conical spiral groove. At this time, the AS metal plastic flow direction is consistent with the rotation direction of the stir tool, while the RS appeared to reverse “turbulence”.

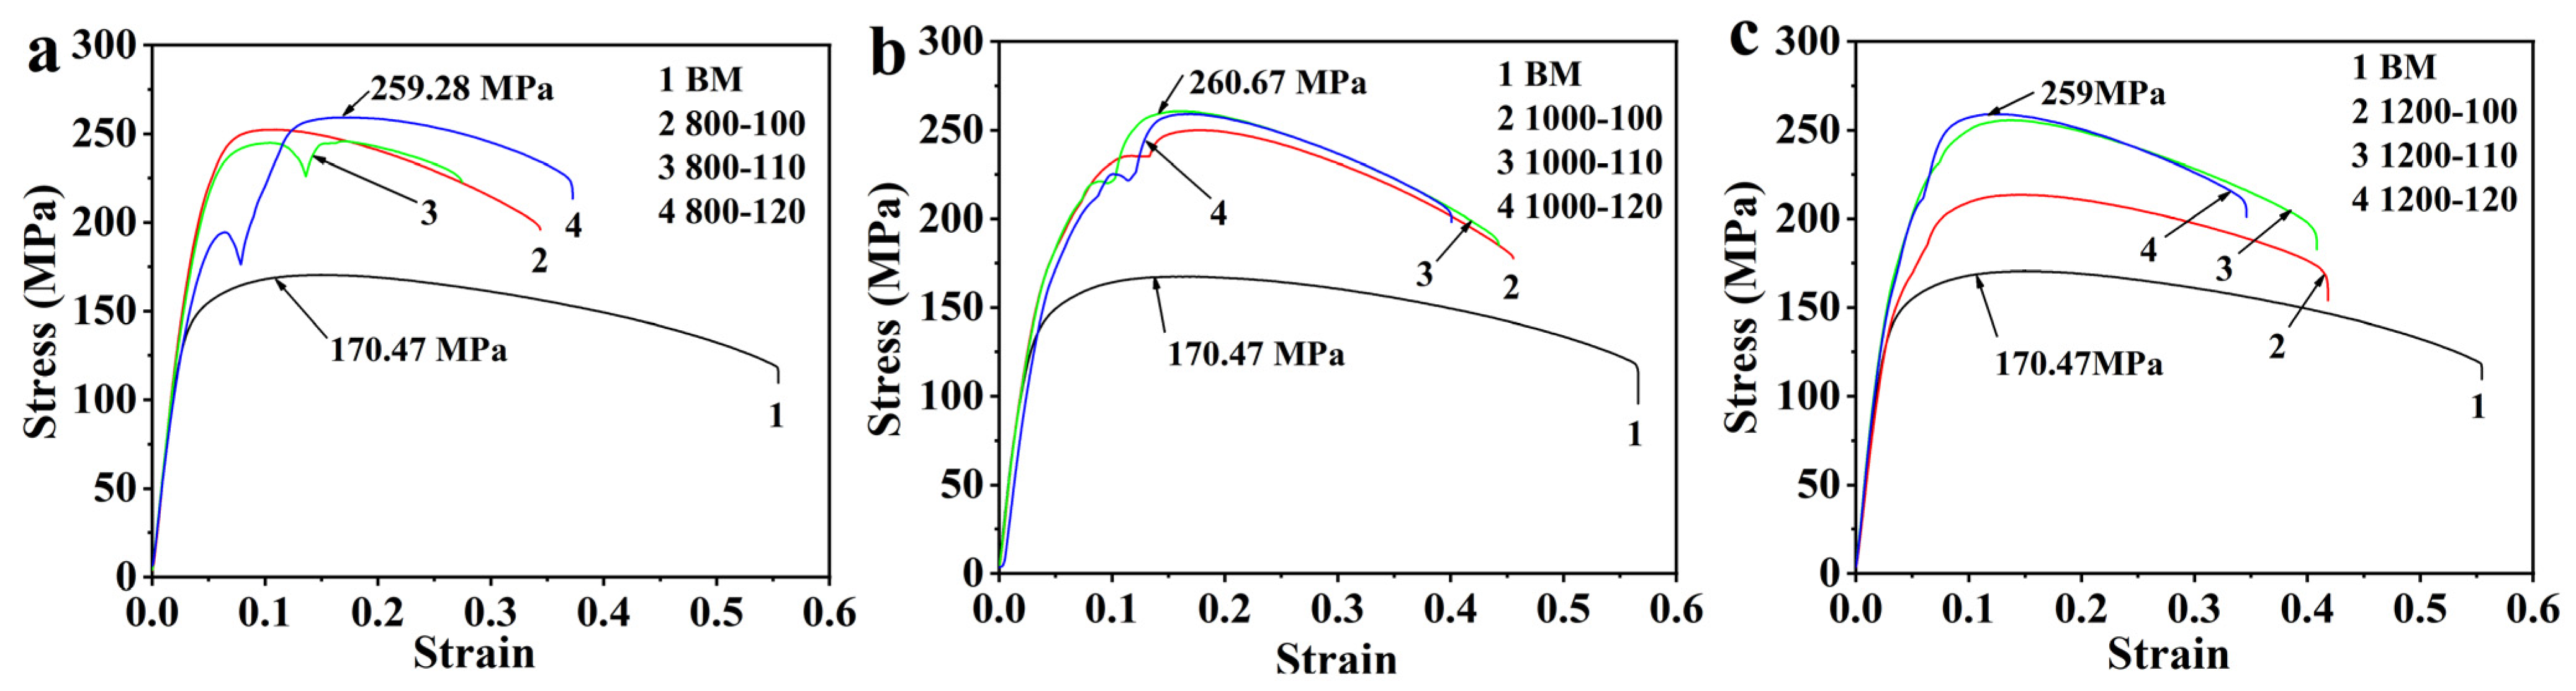
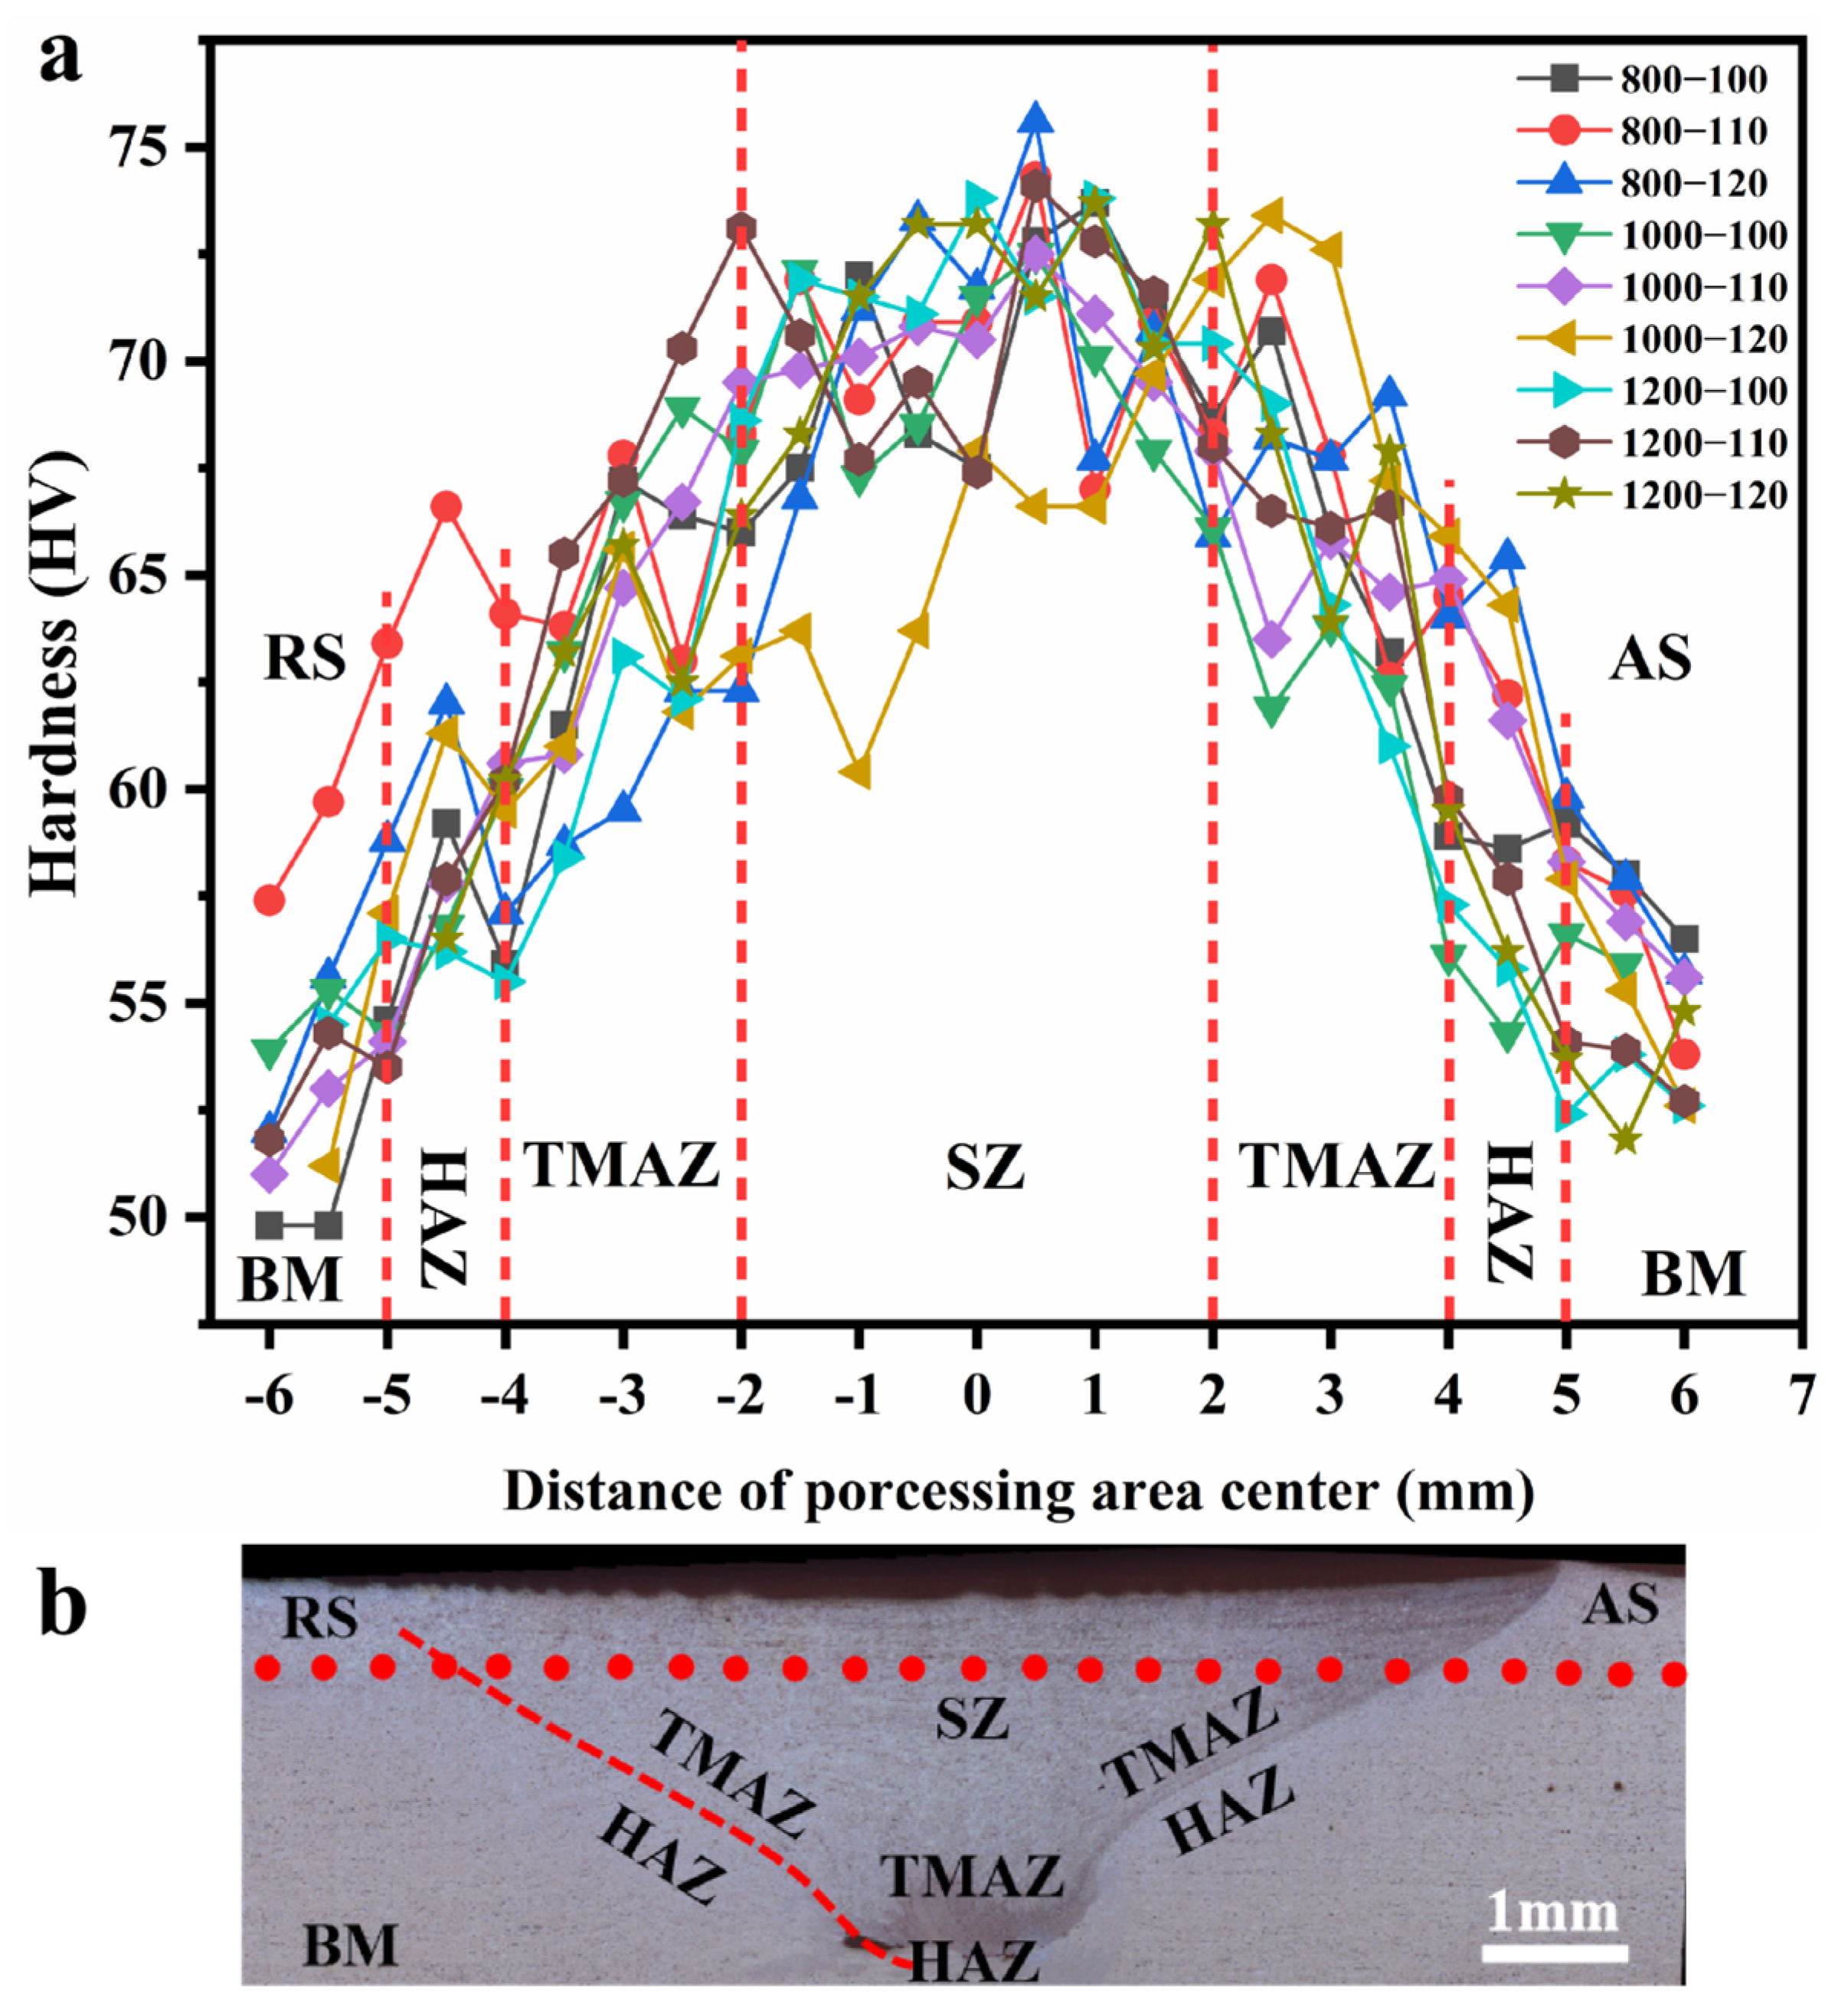
3.3. Mechanical Properties

Tensile tests are carried out on the FSP LA103Z joint to evaluate the influence of microstructure evolution on mechanical properties. All the samples perpendicular to the traverse direction are broken in the BM region, indicating that the strength of the processing area is significantly higher than that of the BM. Then, samples are taken along the processing direction to measure the strength of the processing area.
Figure 11a–c shows the stress–strain curves under different processing parameters along the processing direction. The maximum strength is 260.67 MPa, about 90 MPa higher than the 170.47 MPa of the BM. The elongation to failure is reduced from 50% to 36%. Based on the microstructure observations, the main reasons for the strength increase in the SZ are believed to be subgrains and high-density dislocations [46]. Upon severe plastic deformation during FSP, dislocation density increases rapidly, leading to work hardening [47] at the cost of tensile ductility. The precipitates also hinder dislocation movement, contributing to strengthening [48].
The “yield point phenomenon” commonly observed in low-carbon steels is also observed in the stress–strain curves when the rotating speed is 800 rpm (Figure 11a). But, this phenomenon becomes less significant and even disappeared with an increase in rotating speed. There are several possible reasons for this phenomenon. For example, processing defects, such as the tunnel defects produced during FSP, at a rotating speed of 800 rpm are larger than at 1200 rpm. With an increase in rotating speed, the tunnel defects became smaller. It is worth mentioning that although obvious tunnel defects occur during FSP at 800 rpm, the performance of the sample is still better than the BM because the improvement in sample performance by FSP is far greater than the reduction in sample performance by tunnel defects. In addition, the interactions between the solute atoms and dislocations in the stir zone and the dislocation multiplications caused by tensile deformation could also render the yield point phenomenon. This yield phenomenon is reported in zirconium alloys [49]. Solute atoms could pin the dislocations to form the Snoek atmosphere [50]. Another possible mechanism is stemmed from the soft second-phase AlLi in the LA103Z alloy. When the stress increases to a certain extent (225 MPa), the dislocations will break away from the obstruction of the second phase, and the stress required for dislocation movement will decrease.
The microhardness distribution of the processing area is shown in Figure 12. The distance between the microhardness test points is 500 μm. The results show that the microhardness of the whole machining area increases first and then decreases from the AS to the RS. The microhardness distribution order is SZ > TMAZ > HAZ > BM, and the maximum hardness of the SZ is 77.8 HV.
The increase in hardness in the SZ can be explained as the high-density dislocation interaction for the severely deformed region by stirring. The increase in TMAZ hardness is closely related to grain refinement, and the increase in HAZ hardness is attributed to a small amount of α-Mg solid solution. The different material flow directions between the AS and the RS lead to a nonuniform distribution of the microstructure on both sides, so the hardness of the AS is significantly higher than that of the RS.

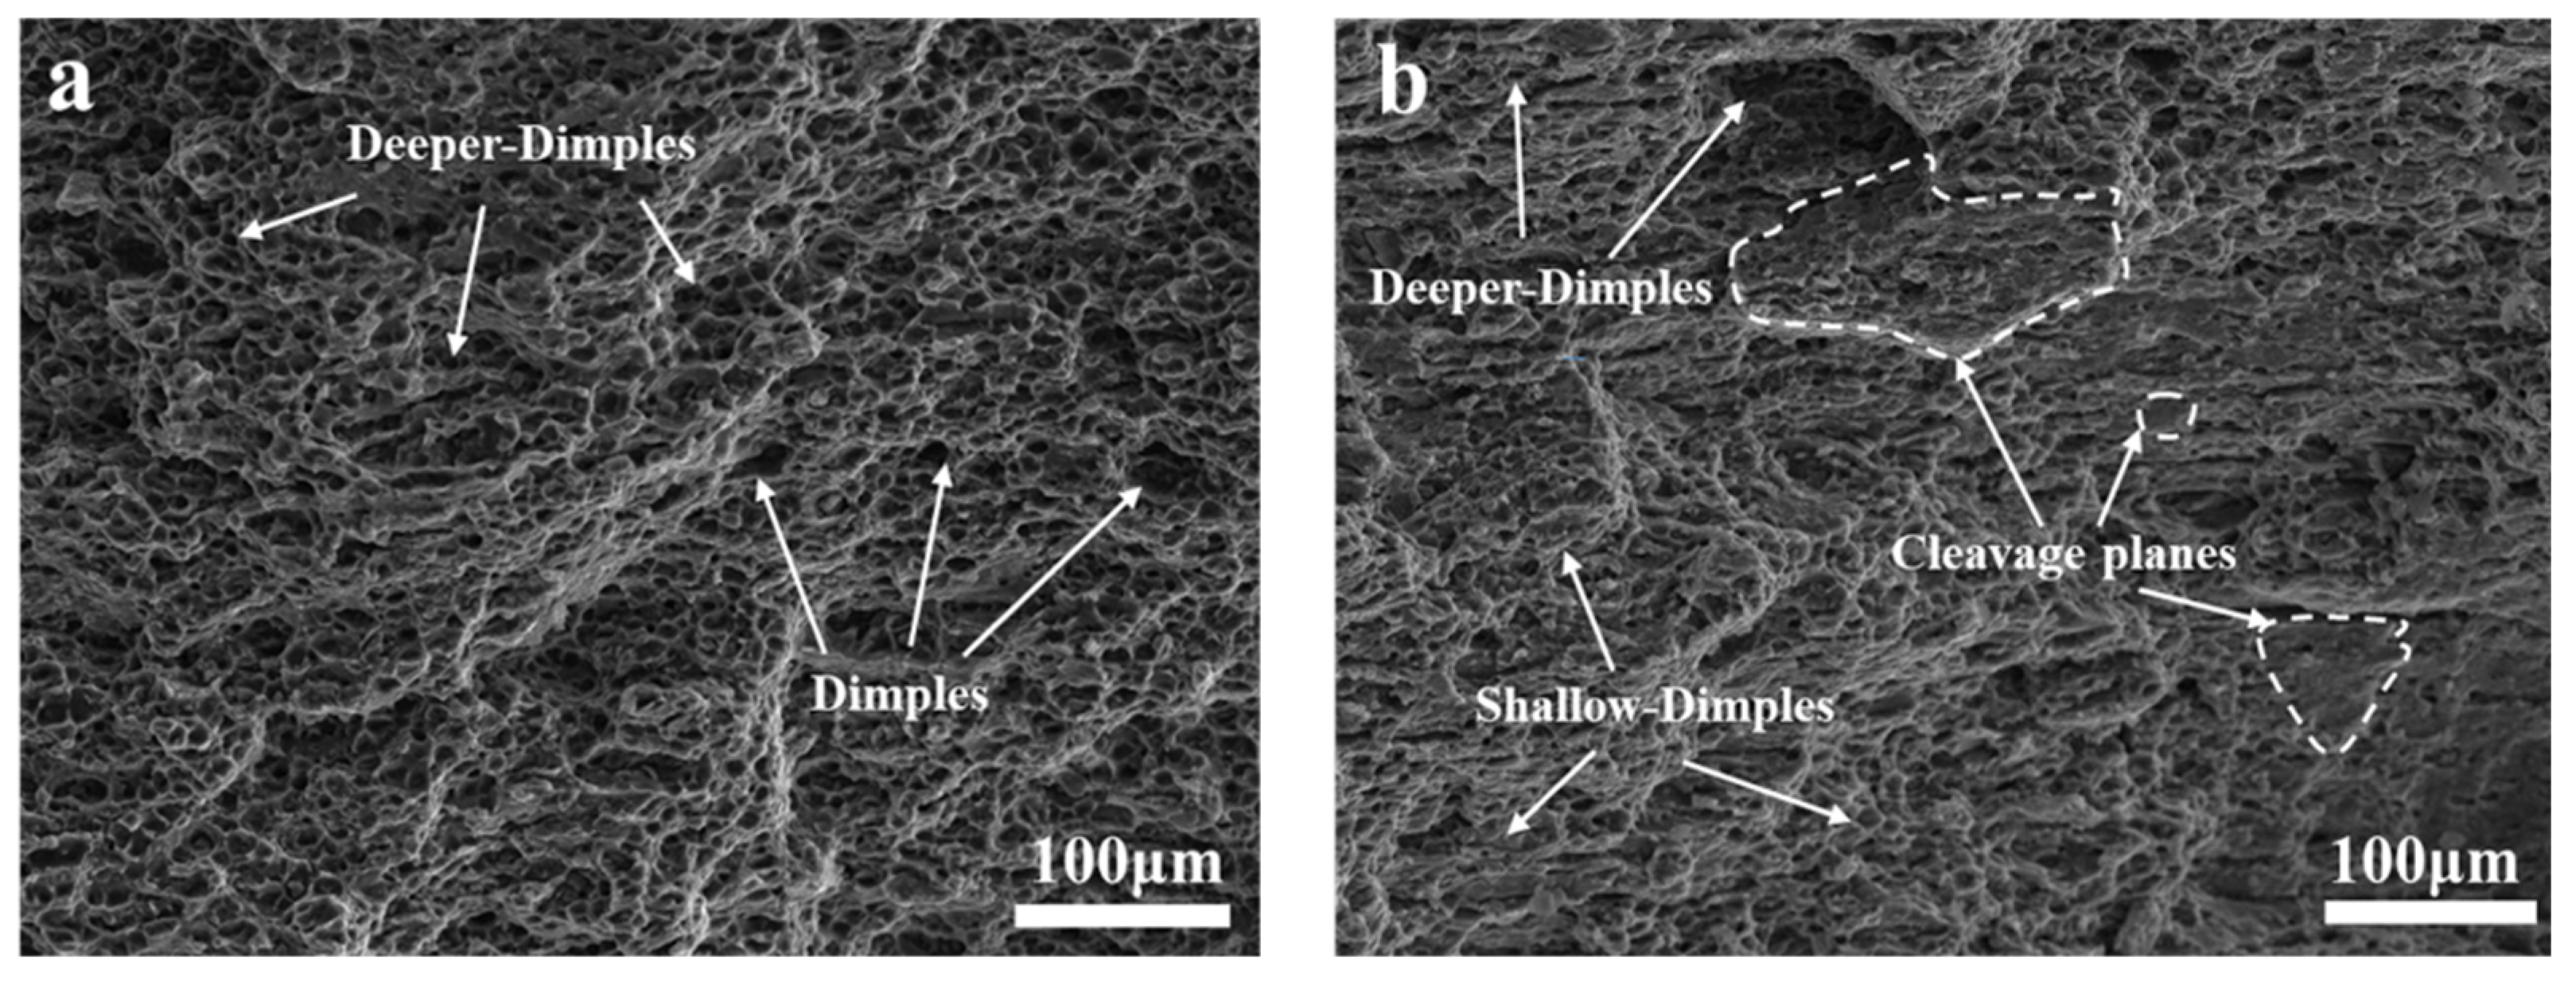
3.4. Analysis of Tensile Fracture Surfaces

Figure 13 shows the fracture surface morphology of the base metal (Figure 13a) and the FSP joint (1000 rpm–110 mm/min) (Figure 13b). The fracture surface of the base metal is composed of large and deep dimples. After FSP, the dimples are slightly smaller than that of the base metal; the proportion of deep dimples is reduced, and there is a small amount of cleavage surface. This explains the reduction in tensile ductility upon FSP.

4. Conclusions

In this study, the strengthening mechanisms of various FSP regions of a Mg-Li alloy were clarified by a combination of numerical simulation and experimental method. The correspondence between the numerical simulation and experiment was verified by infrared thermography. In particular, the strengthening of the TMAZ is mainly due to the discontinuous precipitation of the ultrafine β-Li matrix and submicron α-Mg phase at β-Li grain boundaries. The results show that friction stir processing obviously improves the tensile strength of the Mg-Li alloy to 260.65 MPa from the 170.4 MPa of the hot-rolled sheet. Based on the experimental results and the discussions, the following conclusions were reached.
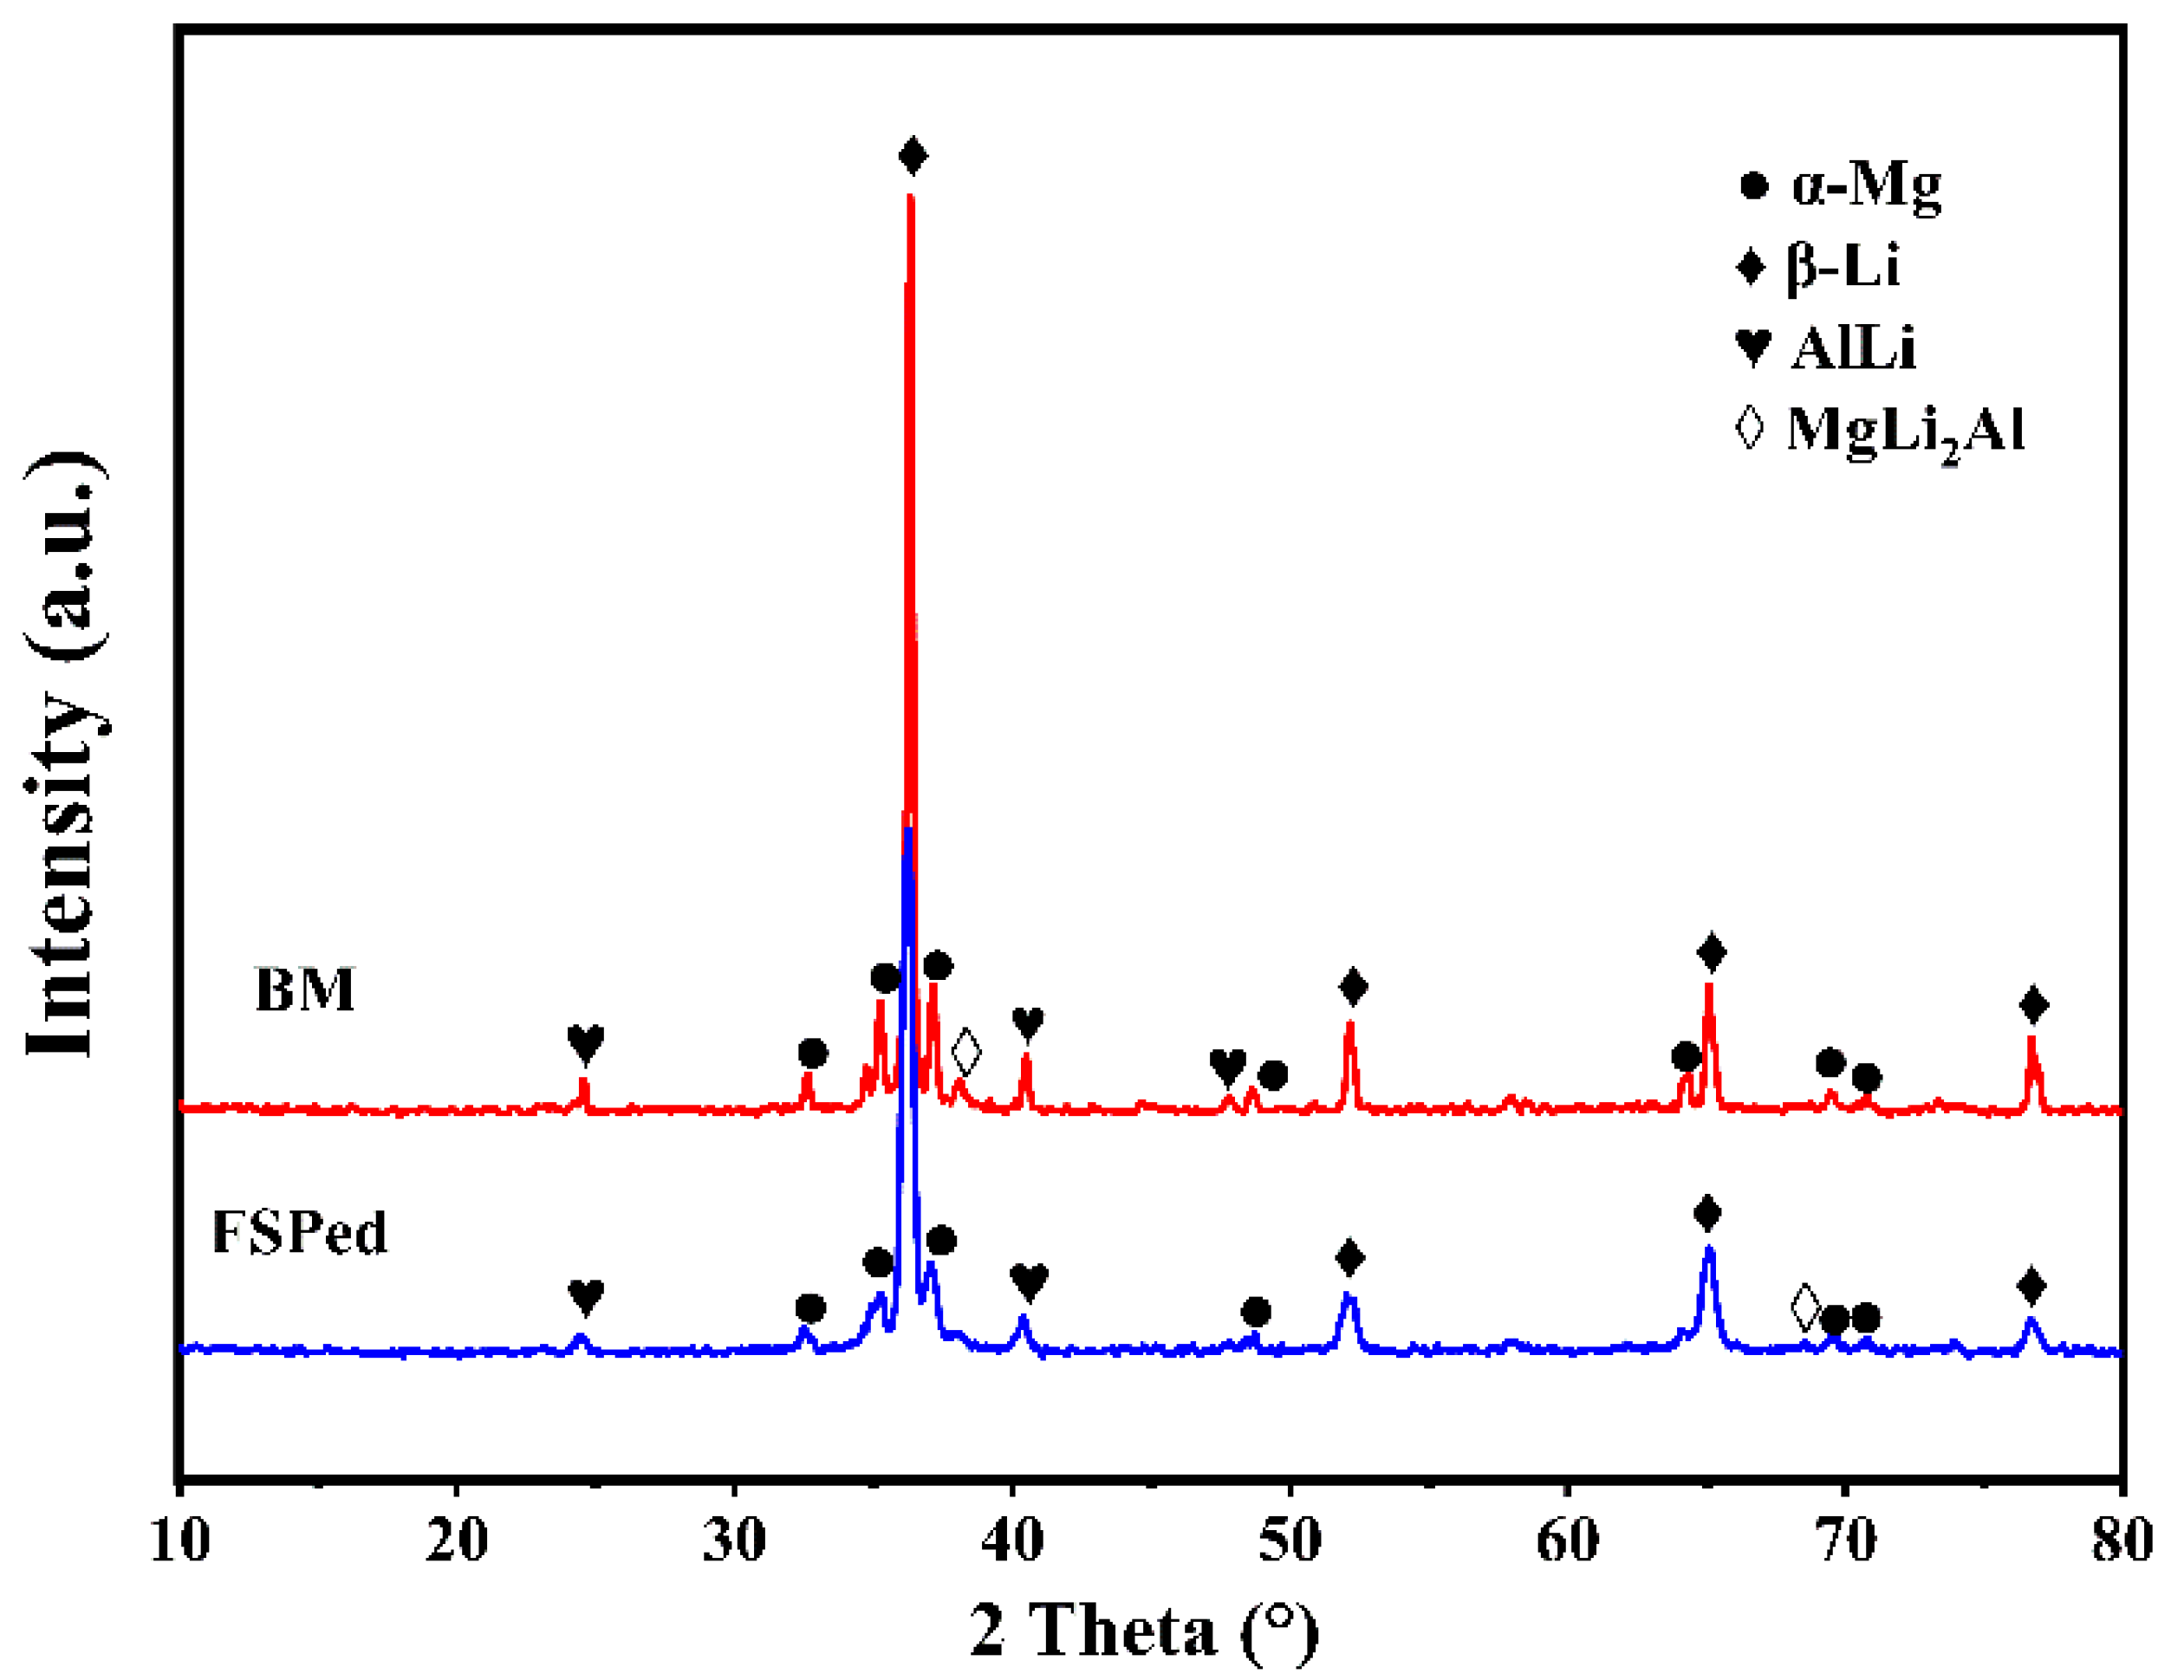
  • Friction stir processing does not change the phase composition. The grain size is refined and the texture of the hot-rolled Mg-Li alloy plate is weakened.
  • The distribution of the temperature field in the processing area is closely related to the rotation speed and travel speed, and the influence of the rotation speed on the distribution of the temperature field is greater than that of the travel speed.
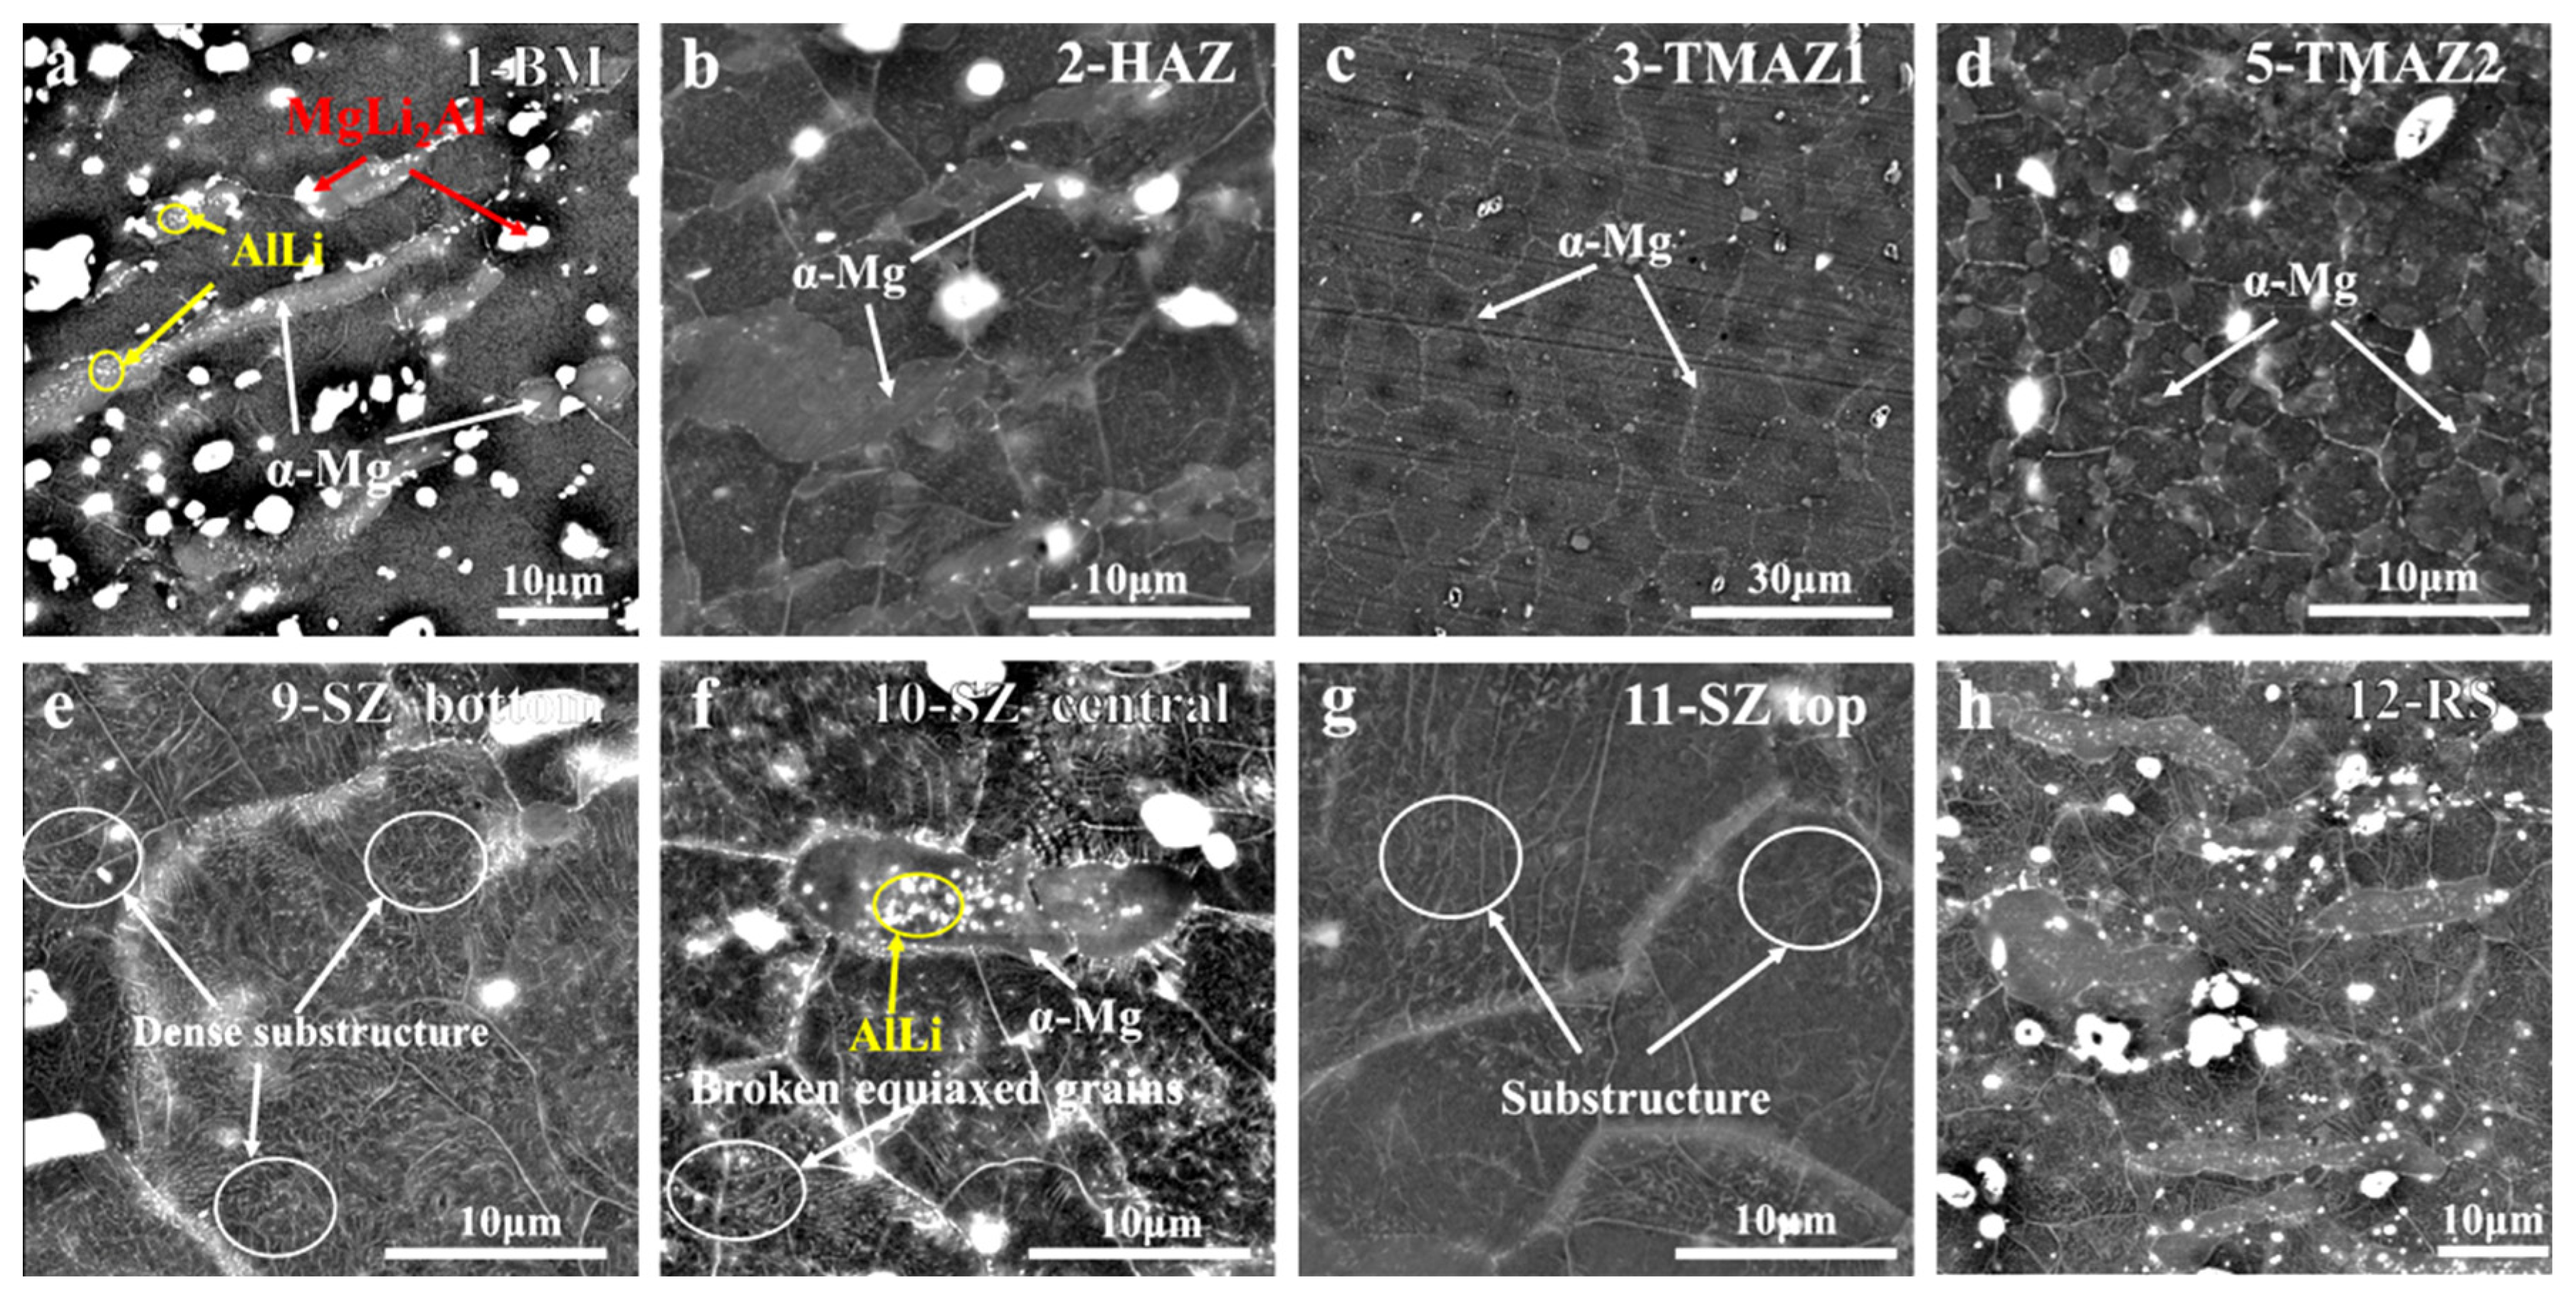
  • The strengthening in the SZ is mainly due to the solid solution, precipitation, and recrystallization of the α-Mg, the high-density dislocation in the β-Li matrix, and a large number of subgrains. The enhancement in the TMAZ is mainly attributed to the ultrafine β-Li matrix, and the submicron α-Mg phase precipitated discontinuously at β-Li grain boundaries.
  • Friction stir processing obviously improves the tensile strength of Mg-Li alloy to 260.65 MPa from the 170.4 MPa of the hot-rolled plate.

Author Contributions

Conceptualization, W.S.; formal analysis, W.S., Z.W., S.H. and J.L.; investigation, Z.W., S.H., J.L. and Y.H.; data curation, Z.W.; writing—original draft preparation, Z.W. and S.H.; writing—review and editing, W.S., J.L., G.Y., Y.L., H.J. and Z.H.; visualization, Z.W. and S.H.; supervision, G.Y., Y.L. and Z.H.; project administration, W.S.; funding acquisition, W.S. and H.J. All authors have read and agreed to the published version of the manuscript.

Funding

This work was partially supported by the National Natural Science Foundation of China [No. 52201265], Shaanxi Province Key Project of Research and Development Plan, China [No. 2023-YBGY-294, No. 2023KXJ-060], the Natural Science Basic Research Program of Shaanxi [No. 2022JQ-449], and the Doctoral Scientific Research Starting Foundation of the Shaanxi University of Science and Technology, China [No. 2016GBJ-02].

Data Availability Statement

Data are contained within the article.

Acknowledgments

The authors appreciate the assistance from Xi’an Sifang Ultralight Material Co., Ltd. for providing the alloy raw materials. The authors appreciate the assistance from Shenzhou Technology Measurement (Shenzhen) Technology Co., Ltd. for providing the infrared camera. The authors would like to thank Qijiang Shen for his technical help in the numerical simulation.

Conflicts of Interest

The authors declare no conflicts of interest.

References

  1. Zhang, S.; Sun, Y.; Wu, R.; Wang, X.; Chen, X.-B.; Fernandez, C.; Peng, Q. Coherent interface strengthening of ultrahigh pressure heat-treated mg-li-y alloys. J. Mater. Sci. Technol. 2020, 51, 79–83. [Google Scholar] [CrossRef]
  2. Mineta, T.; Hasegawa, K.; Sato, H. High strength and plastic deformability of mg–li–al alloy with dual bcc phase produced by a combination of heat treatment and multi-directional forging in channel die. Mater. Sci. Eng. A 2020, 773, 138867. [Google Scholar] [CrossRef]
  3. Rahulan, N.; Gopalan, S.; Kumaran, S. Mechanical behavior of mg-li-al alloys. Mater. Today Proc. 2018, 5, 17935–17943. [Google Scholar] [CrossRef]
  4. Tang, H.; Yan, Y.-D.; Zhang, M.-L.; Li, X.; Han, W.; Xue, Y.; Zhang, Z.-J.; He, H. Fabrication of mg–pr and mg–li–pr alloys by electrochemical co-reduction from their molten chlorides. Electrochim. Acta 2013, 107, 209–215. [Google Scholar] [CrossRef]
  5. Nayeb-Hashemi, A.A.; Clark, J.B.; Pelton, A.D. The li-mg (lithium-magnesium) system. Bull. Alloy Phase Diagr. 1984, 5, 365–374. [Google Scholar] [CrossRef]
  6. Li, X.; Ren, L.; Le, Q.; Jin, P.; Cheng, C.; Wang, T.; Wang, P.; Zhou, X.; Chen, X.; Li, D. The hot deformation behavior, microstructure evolution and texture types of as-cast mg–li alloy. J. Alloys Compd. 2020, 831, 154868. [Google Scholar] [CrossRef]
  7. Ding, H.-B.; Liu, Q.; Zhou, H.-T.; Zhou, X.; Atrens, A. Effect of thermal-mechanical processing on microstructure and mechanical properties of duplex-phase mg-8li-3al-0.4y alloy. Trans. Nonferrous Met. Soc. China 2017, 27, 2587–2597. [Google Scholar] [CrossRef]
  8. Zou, Y.; Zhang, L.; Li, Y.; Wang, H.; Liu, J.; Liaw, P.K.; Bei, H.; Zhang, Z. Improvement of mechanical behaviors of a superlight mg-li base alloy by duplex phases and fine precipitates. J. Alloys Compd. 2018, 735, 2625–2633. [Google Scholar] [CrossRef]
  9. Pugazhendhi, B.S.; Kar, A.; Sinnaeruvadi, K.; Suwas, S. Effect of aluminium on microstructure, mechanical property and texture evolution of dual phase mg-8li alloy in different processing conditions. Arch. Civ. Mech. Eng. 2018, 18, 1332–1344. [Google Scholar] [CrossRef]
  10. Tang, Y.; Le, Q.; Misra, R.D.K.; Su, G.; Cui, J. Influence of extruding temperature and heat treatment process on microstructure and mechanical properties of three structures containing mg-li alloy bars. Mater. Sci. Eng. A 2018, 712, 266–280. [Google Scholar] [CrossRef]
  11. Cao, F.; Zhou, B.; Ding, X.; Zhang, J.; Xu, G. Mechanical properties and microstructural evolution in a superlight mg-7.28li-2.19al-0.091y alloy fabricated by rolling. J. Alloys Compd. 2018, 745, 436–445. [Google Scholar] [CrossRef]
  12. Wu, J.; Shi, Q.; Chiu, Y.L. Fragmentation of mg 24 y 5 intermetallic particles in an mg-zn-y alloy during the equal channel angular pressing. Mater. Charact. 2017, 129, 46–52. [Google Scholar] [CrossRef]
  13. Dutkiewicz, J.; Bobrowski, P.; Rusz, S.; Hilser, O.; Tański, T.A.; Borek, W.; Łagoda, M.; Ostachowski, P.; Pałka, P.; Boczkal, G.; et al. Effect of various spd techniques on structure and superplastic deformation of two phase mglial alloy. Met. Mater. Int. 2018, 24, 1077–1089. [Google Scholar] [CrossRef]
  14. Klu, E.E.; Song, D.; Li, C.; Wang, G.; Zhou, Z.; Gao, B.; Sun, J.; Ma, A.; Jiang, J. Development of a high strength mg-9li alloy via multi-pass ecap and post-rolling. Metals 2019, 9, 1008. [Google Scholar] [CrossRef]
  15. Li, Y.; Wang, J.; Xu, R. The microstructure and mechanical properties of nanocrystalline mg-zn-y alloy achieved by a combination of aging and high pressure torsion. Vacuum 2020, 178, 109396. [Google Scholar] [CrossRef]
  16. Yousefi Mehr, V.; Toroghinejad, M.R.; Rezaeian, A.; Asgari, H.; Szpunar, J.A. A texture study of nanostructured al–cu multi-layered composite manufactured via the accumulative roll bonding (arb). J. Mater. Res. Technol. 2021, 14, 2909–2919. [Google Scholar] [CrossRef]
  17. Bheekya Naik, R.; Venkateswara Reddy, K.; Madhusudhan Reddy, G.; Arockia Kumar, R. Microstructure, mechanical and wear properties of friction stir processed cu-1.0%cr alloys. Fusion Eng. Des. 2021, 164, 112202. [Google Scholar] [CrossRef]
  18. Gotawala, N.; Kumar, A.; Mishra, S.; Shrivastava, A. Microstructure and texture evolution of complete mg-3al-0.2ce alloy blanks upon multi-pass friction stir processing with spiral strategy. Mater. Today Commun. 2021, 26, 101850. [Google Scholar] [CrossRef]
  19. Kumar, A.; Gotawala, N.; Mishra, S.; Shrivastava, A. Defects, microstructure and mechanical behaviour upon multi-pass friction stir processing of magnesium alloy with spiral tool path. CIRP J. Manuf. Sci. Technol. 2021, 32, 170–178. [Google Scholar] [CrossRef]
  20. Che, Q.-Y.; Wang, K.-S.; Wang, W.; Huang, L.-Y.; Li, T.-Q.; Xi, X.-P.; Peng, P.; Qiao, K. Microstructure and mechanical properties of magnesium–lithium alloy prepared by friction stir processing. Rare Met. 2019, 40, 2552–2559. [Google Scholar] [CrossRef]
  21. Kumar, N.; Mishra, R.S.; Dahotre, N.B.; Brennan, R.E.; Doherty, K.J.; Cho, K.C. Effect of friction stir processing on microstructure and mechanical properties of laser-processed mg4y3nd alloy. Mater. Des. 2016, 110, 663–675. [Google Scholar] [CrossRef]
  22. Xue, P.; Wang, B.B.; Chen, F.F.; Wang, W.G.; Xiao, B.L.; Ma, Z.Y. Microstructure and mechanical properties of friction stir processed cu with an ideal ultrafine-grained structure. Mater. Charact. 2016, 121, 187–194. [Google Scholar] [CrossRef]
  23. Adetunla, A.; Akinlabi, E.T. Investigating the effects of process parameters on the mechanical integrity of friction stir processed aluminium alloy. Mater. Today Proc. 2021, 44, 1238–1242. [Google Scholar] [CrossRef]
  24. Ardalanniya, A.; Nourouzi, S.; Jamshidi Aval, H. Fabrication of a laminated aluminium matrix composite using friction stir processing as a cladding method. Mater. Sci. Eng. B 2021, 272, 115326. [Google Scholar] [CrossRef]
  25. Babapour Golafshani, K.; Nourouzi, S.; Jamshidi Aval, H. Hot tensile deformation and fracture behavior of friction stir processed al-si-cu alloy. CIRP J. Manuf. Sci. Technol. 2021, 35, 41–52. [Google Scholar] [CrossRef]
  26. Mazaheri, H.; Aval, H.J.; Jamaati, R. Pre-strain assisted low heat-input friction stir processing to achieve ultrafine-grained copper. Mater. Sci. Eng. A 2021, 826, 141958. [Google Scholar] [CrossRef]
  27. Liu, G.; Ma, Z.; Wei, G.; Xu, T.; Zhang, X.; Yang, Y.; Xie, W.; Peng, X. Microstructure, tensile properties and corrosion behavior of friction stir processed mg-9li-1zn alloy. J. Mater. Process. Technol. 2019, 267, 393–402. [Google Scholar] [CrossRef]
  28. Jiang, L.; Jiang, W.; Guo, F.; Huang, W.; Dong, H.; Hu, H.; Dai, Q. Micro-nano structure characteristics and texture evolution of the friction stir processed dual-phase mg li alloy. Mater. Charact. 2021, 173, 110979. [Google Scholar] [CrossRef]
  29. Chen, X.; Zhang, Y.; Cong, M. Effect of friction stir processing on microstructure and tensile properties of as-cast mg–8li–3al–2sn (wt. %) alloy. Vacuum 2020, 175, 109292. [Google Scholar] [CrossRef]
  30. Zhu, Y.; Zhou, M.; Geng, Y.; Zhang, S.; Xin, T.; Chen, G.; Zhou, Y.; Zhou, X.; Wu, R.; Shi, Q. Microstructural evolution and its influence on mechanical and corrosion behaviors in a high-Al/Zn containing duplex Mg-Li alloy after friction stir processing. J. Mater. Sci. Technol. 2024, 184, 245–255. [Google Scholar] [CrossRef]
  31. Li, Y.; Guan, Y.; Liu, Y.; Zhai, J.; Hu, K.; Lin, J. Effect of processing parameters on the microstructure and tensile properties of a dual-phase mg–li alloy during friction stir processing. J. Mater. Res. Technol. 2022, 17, 2714–2724. [Google Scholar] [CrossRef]
  32. Gao, E.-Z.; Zhang, X.-X.; Liu, C.-Z.; Ma, Z.-Y. Numerical simulations on material flow behaviors in whole process of friction stir welding. Trans. Nonferrous Met. Soc. China 2018, 28, 2324–2334. [Google Scholar] [CrossRef]
  33. Ji, S.D.; Shi, Q.Y.; Zhang, L.G.; Zou, A.L.; Gao, S.S.; Zan, L.V. Numerical simulation of material flow behavior of friction stir welding influenced by rotational tool geometry. Comput. Mater. Sci. 2012, 63, 218–226. [Google Scholar] [CrossRef]
  34. GB/T 228.1-2021; Metallic Materials-Tensile Testing-Part 1: Method of Test at Room Temperature. Standards Press of China: Beijing, China, 2021.
  35. Meyghani, B.; Awang, M.; Emamian, S.; Khalid, N.M. Developing a finite element model for thermal analysis of friction stir welding by calculating temperature dependent friction coefficient. In 2nd International Conference on Mechanical, Manufacturing and Process Plant Engineering; Awang, M., Ed.; Springer: Singapore, 2017; pp. 107–126. [Google Scholar] [CrossRef]
  36. Feulvarch, E.; Roux, J.-C.; Bergheau, J.-M. Finite element modeling of friction stir welding. In Thermomechanical Industrial Processes: Modeling and Numerical Simulation; Wiley: New York, NY, USA, 2014; pp. 155–186. [Google Scholar] [CrossRef]
  37. Li, H.; Xu, R.; Hou, Y.; Cui, S.; Wei, Z. Feasibility and interface migration characteristics of friction stir lap welding of LA141 Mg-Li alloy. Rev. Adv. Mater. Sci. 2019, 58, 123–131. [Google Scholar] [CrossRef]
  38. Lu, S.; Qi, F.; Chen, J.; Jia, X.D. Numerical simulation and experiment of temperature field on mg alloy weld processed by friction-stir welding. J. Comput. Theor. Nanosci. 2012, 9, 1231–1235. [Google Scholar] [CrossRef]
  39. Prasanna, P.; Rao, B.S.; Rao, G. Finite element modeling for maximum temperature in friction stir welding and its validation. Int. J. Adv. Manuf. Technol. 2010, 51, 925–933. [Google Scholar] [CrossRef]
  40. Albakri, A.N.; Mansoor, B.; Nassar, H.; Khraisheh, M.K. Thermo-mechanical and metallurgical aspects in friction stir processing of az31 mg alloy—A numerical and experimental investigation. J. Mater. Process. Technol. 2013, 213, 279–290. [Google Scholar] [CrossRef]
  41. Ji, H.; Deng, Y.L.; Xu, H.Y.; Yin, X.; Zhang, T.; Wang, W.Q.; Dong, H.G.; Wang, T.Y.; Wu, J.P. Numerical modeling for the mechanism of shoulder and pin features affecting thermal and material flow behavior in friction stir welding. J. Mater. Res. Technol. 2022, 21, 662–678. [Google Scholar] [CrossRef]
  42. Chen, G.; Zhu, J.; Zhao, Y.; Hao, Y.; Yang, C.; Shi, Q. Digital twin modeling for temperature field during friction stir welding. J. Manuf. Process. 2021, 64, 898–906. [Google Scholar] [CrossRef]
  43. Wei, Z.; Zhang, J.; Bao, R.; Wu, R.; Zhang, H. Achieving high strength in a mg–li–zn–y alloy by α-mg precipitation. Mater. Sci. Eng. A 2022, 846, 143272. [Google Scholar] [CrossRef]
  44. Abbasi, M.; Bagheri, B.; Sharifi, F. Simulation and experimental study of dynamic recrystallization process during friction stir vibration welding of magnesium alloys. Trans. Nonferrous Met. Soc. China 2021, 31, 2626–2650. [Google Scholar] [CrossRef]
  45. Zhai, M.; Wu, C.; Shi, L. Numerical simulation of friction stir lap welding of al-to-mg alloys under different lap configurations and pin lengths. J. Mater. Res. Technol. 2022, 20, 2889–2904. [Google Scholar] [CrossRef]
  46. Cao, F.; Zhang, J.; Ding, X.; Xue, G.; Liu, S.; Sun, C.; Su, R.; Teng, X. Mechanical properties and microstructural evolution in a superlight mg-6.4li-3.6zn-0.37al-0.36y alloy processed by multidirectional forging and rolling. Mater. Sci. Eng. A 2019, 760, 377–393. [Google Scholar] [CrossRef]
  47. Starink, M.J. Dislocation versus grain boundary strengthening in spd processed metals: Non-causal relation between grain size and strength of deformed polycrystals. Mater. Sci. Eng. A 2017, 705, 42–45. [Google Scholar] [CrossRef]
  48. Arora, H.S.; Singh, H.; Dhindaw, B.K. Numerical simulation of temperature distribution using finite difference equations and estimation of the grain size during friction stir processing. Mater. Sci. Eng. A 2012, 543, 231–242. [Google Scholar] [CrossRef]
  49. Shi, H.; Li, J.; Mao, J.; Lu, W. The elimination of the yield point phenomenon in a new zirconium alloy: Influence of degree of recrystallization on the tensile properties. Scr. Mater. 2019, 169, 28–32. [Google Scholar] [CrossRef]
  50. Jiang, F.; Zhang, T. Stress-induced long-range ordering snoek atmosphere. Scr. Metall. 1988, 22, 773–777. [Google Scholar] [CrossRef]
Figure 1. The schematic illustration of friction stir processing and test sampling. (a) Schematic diagram and sample positions of friction stir processing. AS represents the advancing side, and RS represents the retreating side. The dimension of the tensile specimens, (b) sampling perpendicular to the processing direction (TD: transverse direction) and (c) along the processing direction (PD).
Crystals 14 00064 g001
Figure 2. Model size of the stir tool: R1 = 0.0065 m, R2 = 0.002 m, and H = 0.0015 m.
Crystals 14 00064 g002
Figure 3. The ANSYS finite element model of the LA103Z sheet: (a) finite element model of the sheet; (b) finite element mesh dividing of the sheet.
Crystals 14 00064 g003
Figure 4. The temperature trend diagram after steady processing: (a) rotation speed is 300–1200 rpm, travel speed is 110 mm/min; (b) rotation speed is 1000 rpm, travel speed is 30–120 mm/min.
Crystals 14 00064 g004
Figure 5. The temperature field after steady processing at a rotation speed of 1000 rpm and a travel speed of 110 mm/min: (a) steady processing for 33 s; (b) steady processing for 76 s.
Crystals 14 00064 g005
Figure 6. The actual operating thermal image after steady processing at a rotation speed of 1000 rpm and a travel speed of 110 mm/min: (a) steady processing for 33 s; (b) steady processing for 76 s; (c) thermal image of the stir tool after working. The lighter the color of the image area, the higher the actual operating temperature of the area.
Crystals 14 00064 g006
Figure 7. Low-magnification optical images of the joints at a rotational speed of 800 rpm with different traverse speeds: (a) 100 mm/min, (b) 110 mm/min, (c) 120 mm/min. (d) Cross-section optical image of LA103Z after friction stir processing with a rotation speed of 1200 rpm and a travel speed of 120 mm/min; the various zones of the joint are marked.
Crystals 14 00064 g007
Figure 8. XRD results of the base metal and friction stir processed samples.
Crystals 14 00064 g008
Figure 9. OM images of different areas with the processing parameters of a rotating speed of 1000 rpm and a traverse speed of 110 mm/min: (a) marks the position of (bm) in this figure; images (bm) represent the morphologies of different zones.
Crystals 14 00064 g009
Figure 10. SEM images of different areas with the processing parameters of a rotating speed of 1000 rpm and a traverse speed of 110 mm/min: (a) BM, (b) HAZ, (c) TMAZ1, (d) TMAZ2, (e) bottom of SZ, (f) center of SZ, (g) top of SZ, (h) RS.
Crystals 14 00064 g010
Figure 11. Stress–strain curves of tensile specimens parallel to the PD direction under different processing parameters (provided in the inset of the plots): (a) 800 rpm, (b) 1000 rpm, (c)1200 rpm.
Crystals 14 00064 g011
Figure 12. Microhardness distribution of the specimen cross-section upon FSP of various parameters: (a) hardness distribution trend graph, (b) hardness testing on specific parts of the section.
Crystals 14 00064 g012
Figure 13. SEM fracture surface images of different tensile specimens: (a) BM, (b) FSP joint-PD (1000 rpm, 110 mm/min).
Crystals 14 00064 g013
Table 1. Thermal properties of the LA141 Mg-L alloy [37].
Temperature
T/°C
100200300400500
Density
ρ/(kg·m3)
13501350135013501350
Thermal conductivity
λ/(W/(m·°C))
74.8473.9772.2171.1070.10
Specific heat
C/(J/(kg·°C))
14531461.9146414651466
Disclaimer/Publisher’s Note: The statements, opinions and data contained in all publications are solely those of the individual author(s) and contributor(s) and not of MDPI and/or the editor(s). MDPI and/or the editor(s) disclaim responsibility for any injury to people or property resulting from any ideas, methods, instructions or products referred to in the content.

