
Transferring Crystallization Conditions from Small to Larger Scale for Achieving Targeted Crystal Morphologies of an Active Pharmaceutical Ingredient


Abstract
:1. Introduction
2. Materials and Methods
2.1. Bitopertin
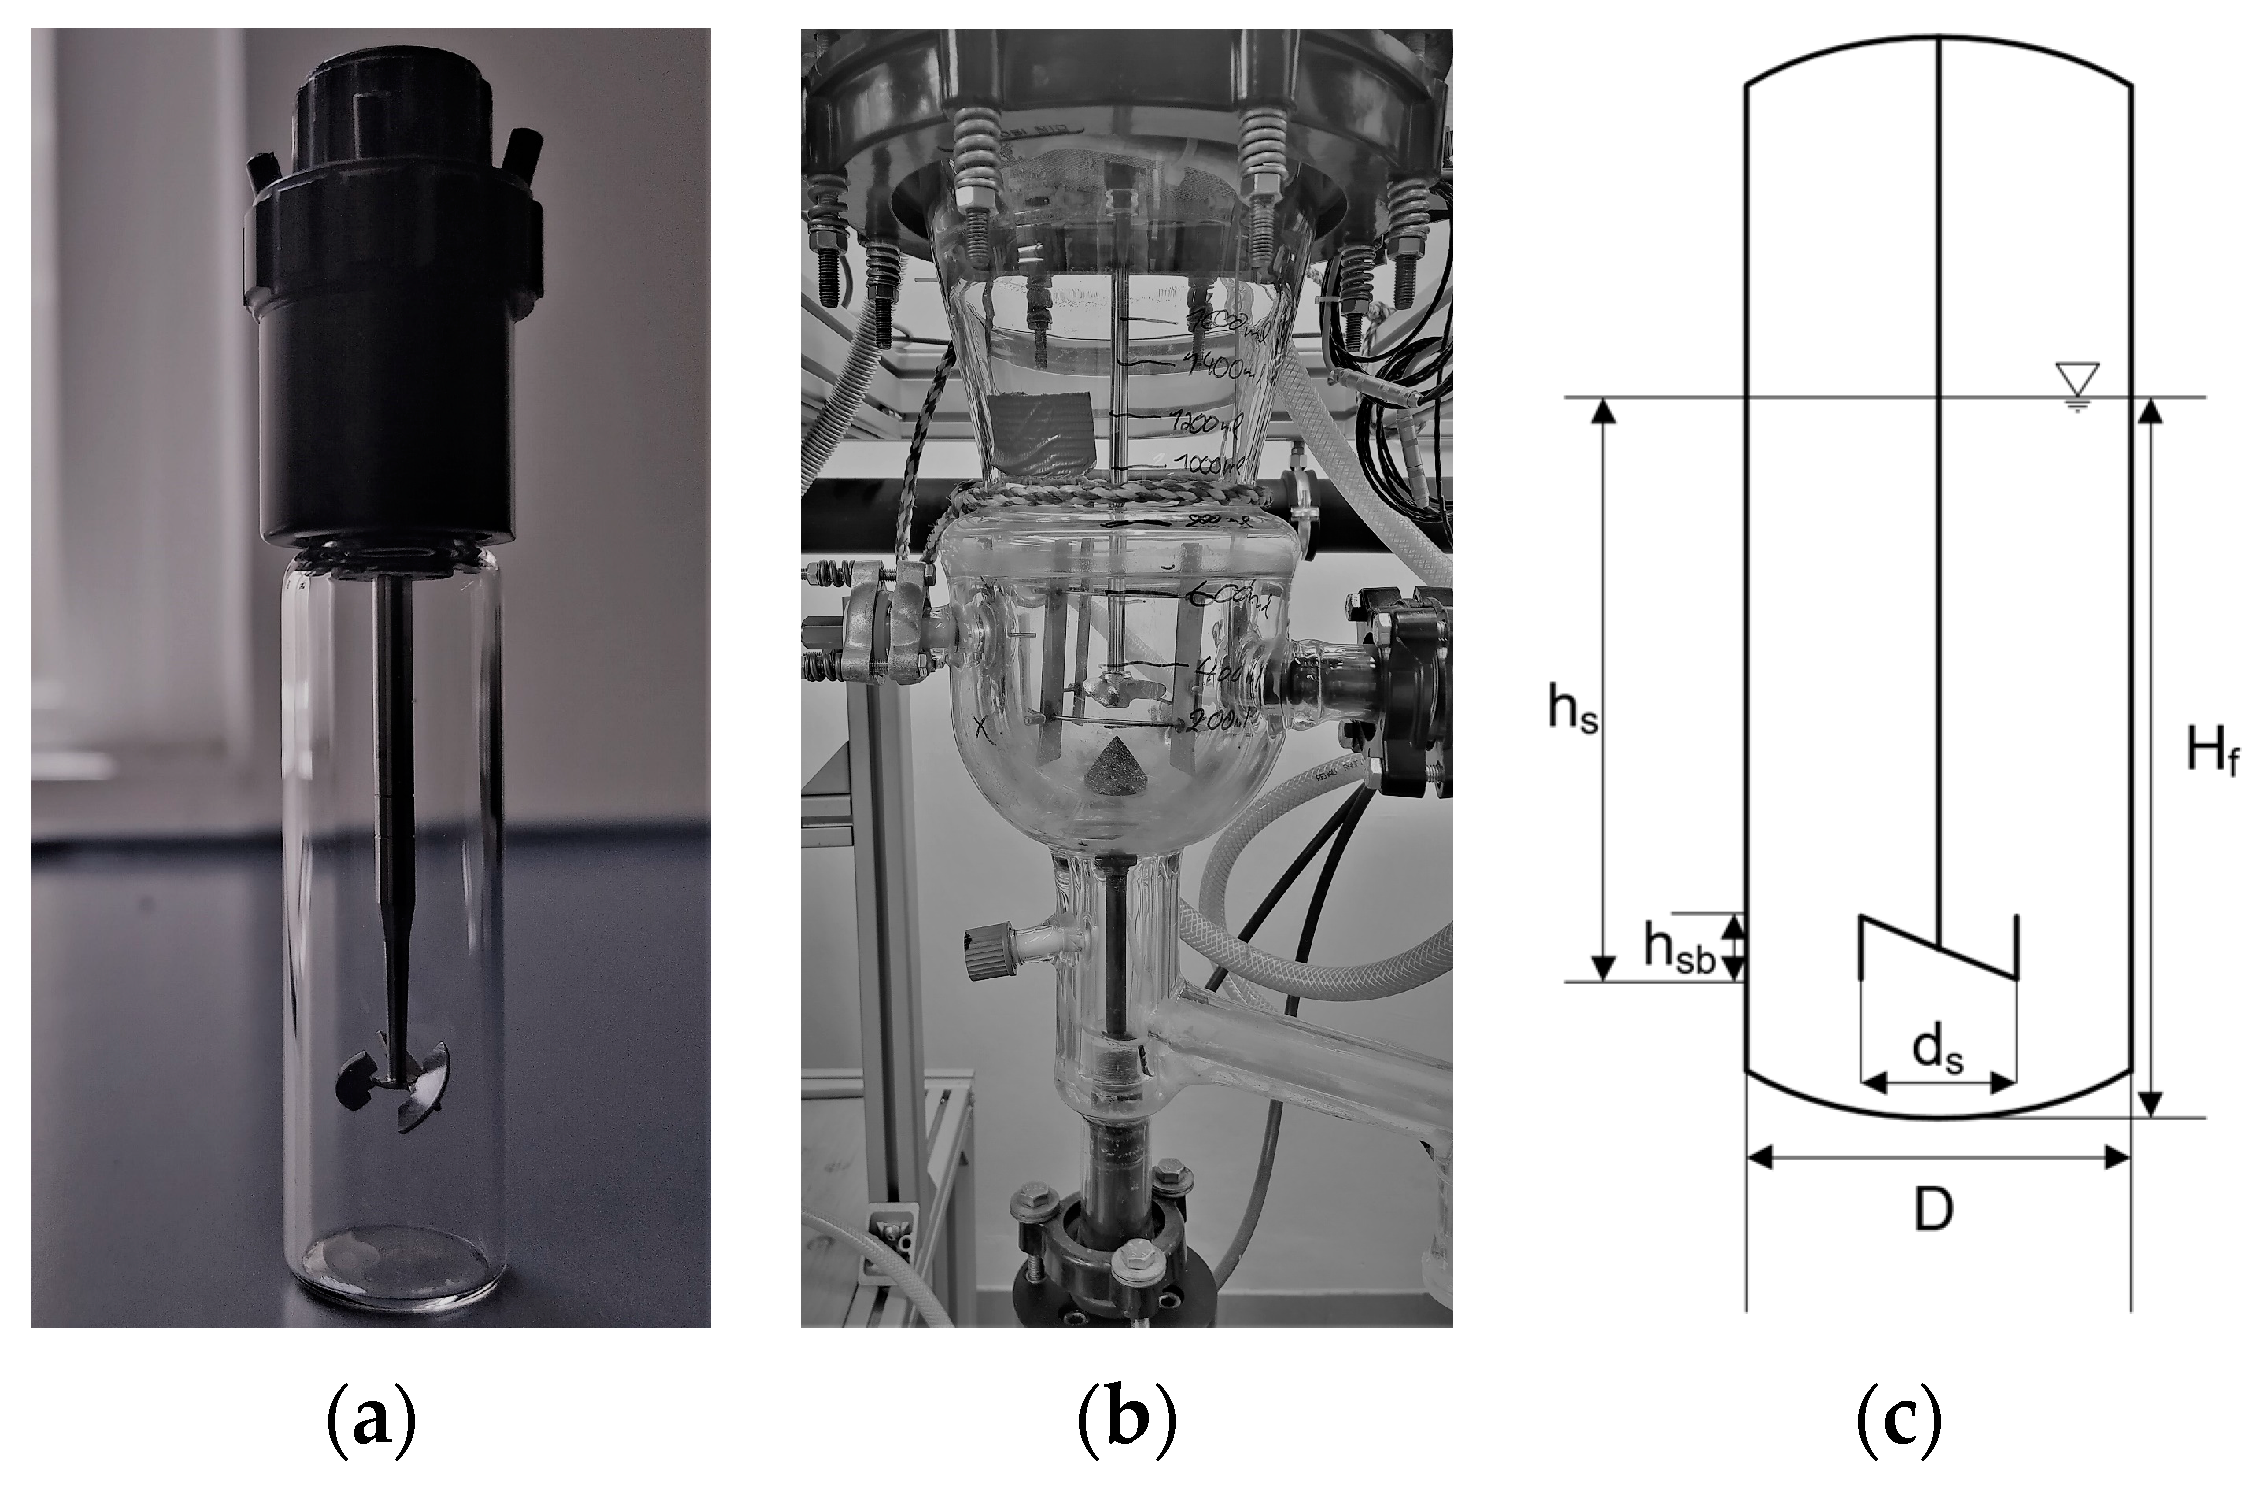
2.2. Miniaturized Crystallizator (ml Scale)
2.3. Large Crystallizator (l Scale)
2.4. Resemblance between Scales
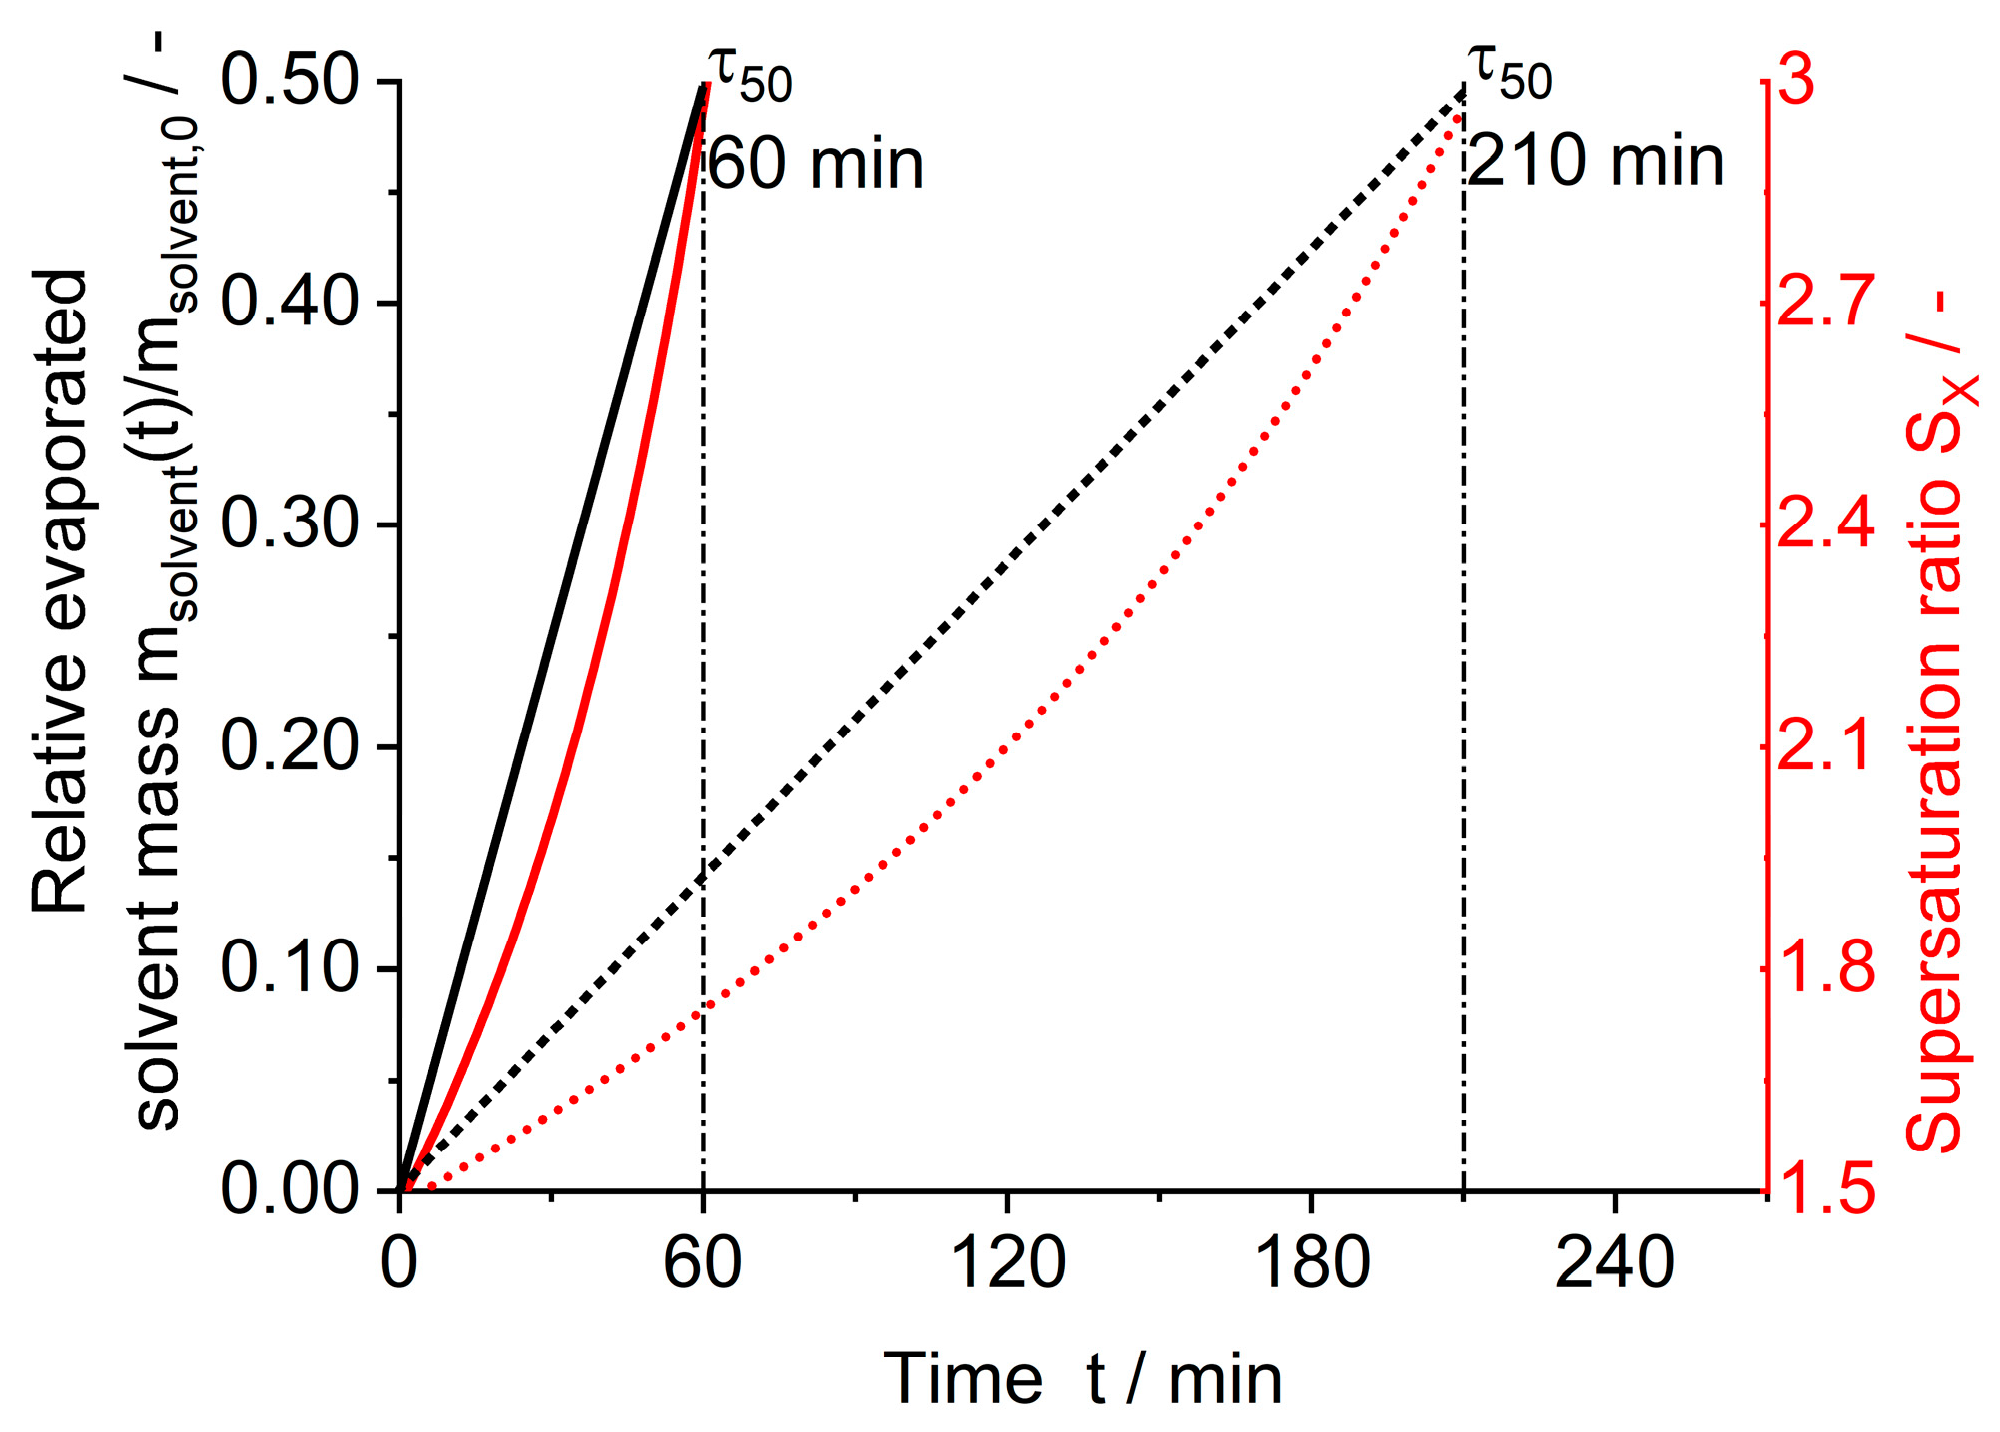
2.5. Evaporative Crystallization
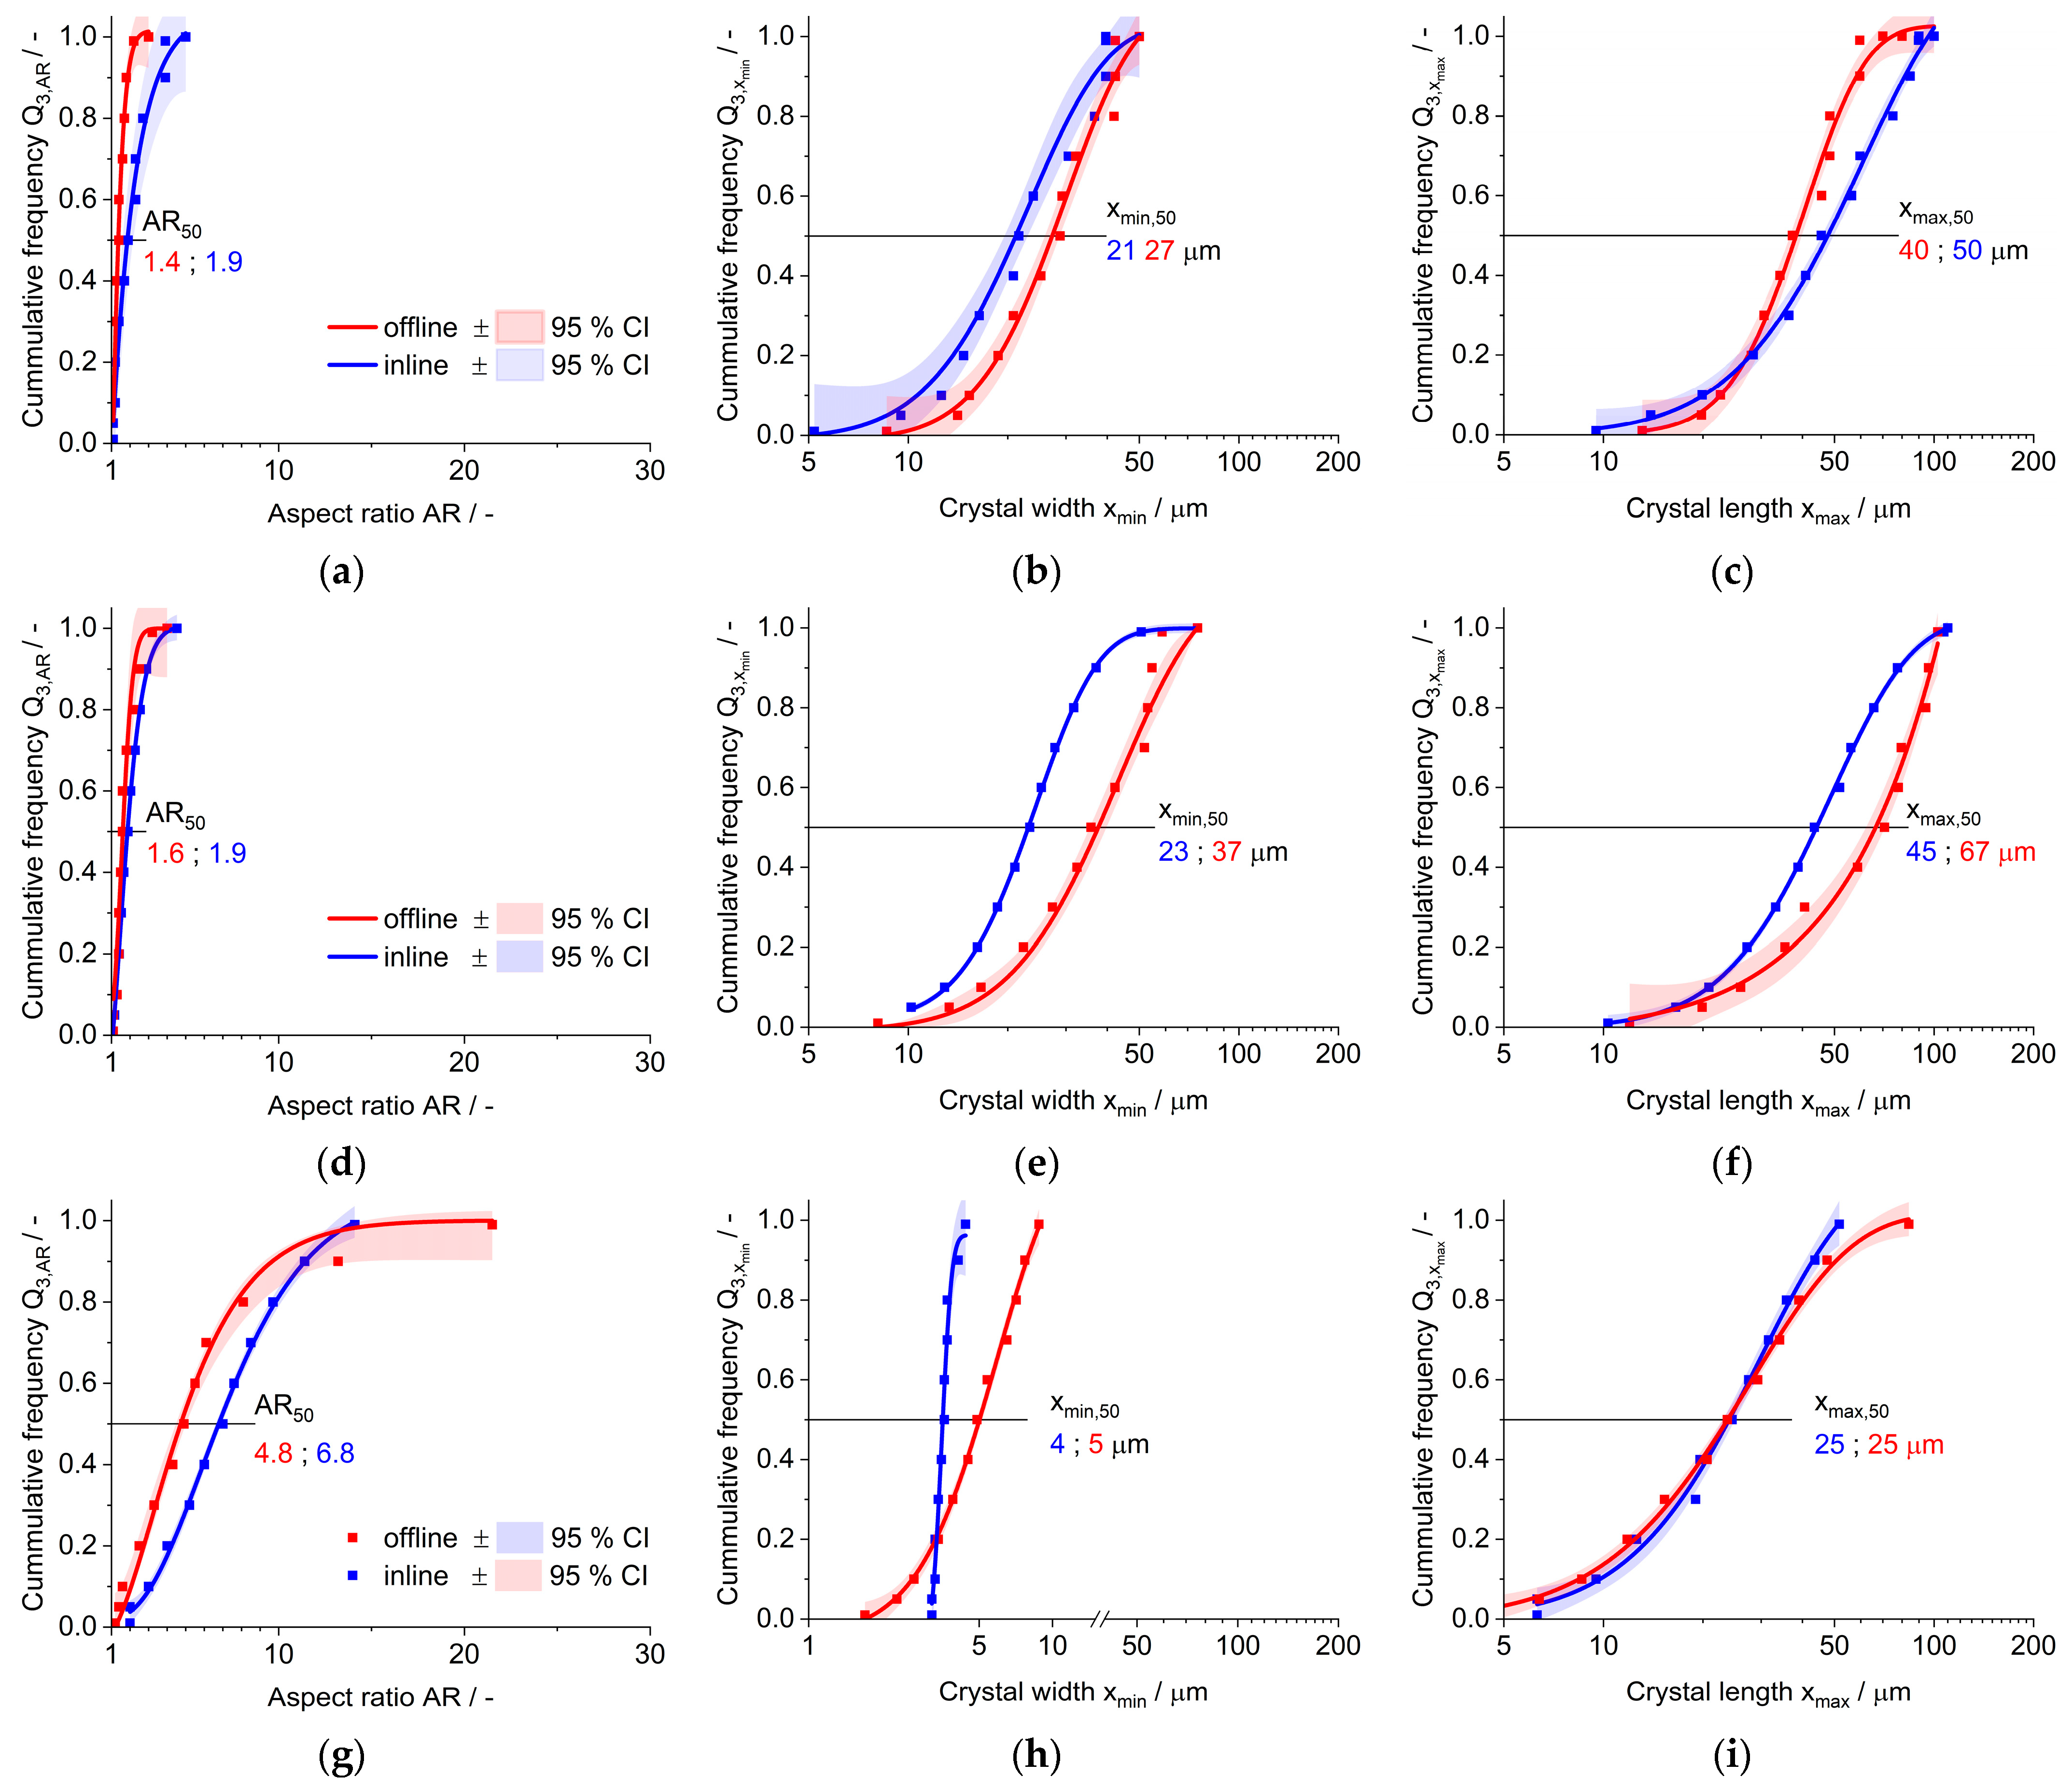
2.6. Crystal Morphology and Structure Analysis
3. Results
3.1. Miniaturized Crystallizator (ml Scale)
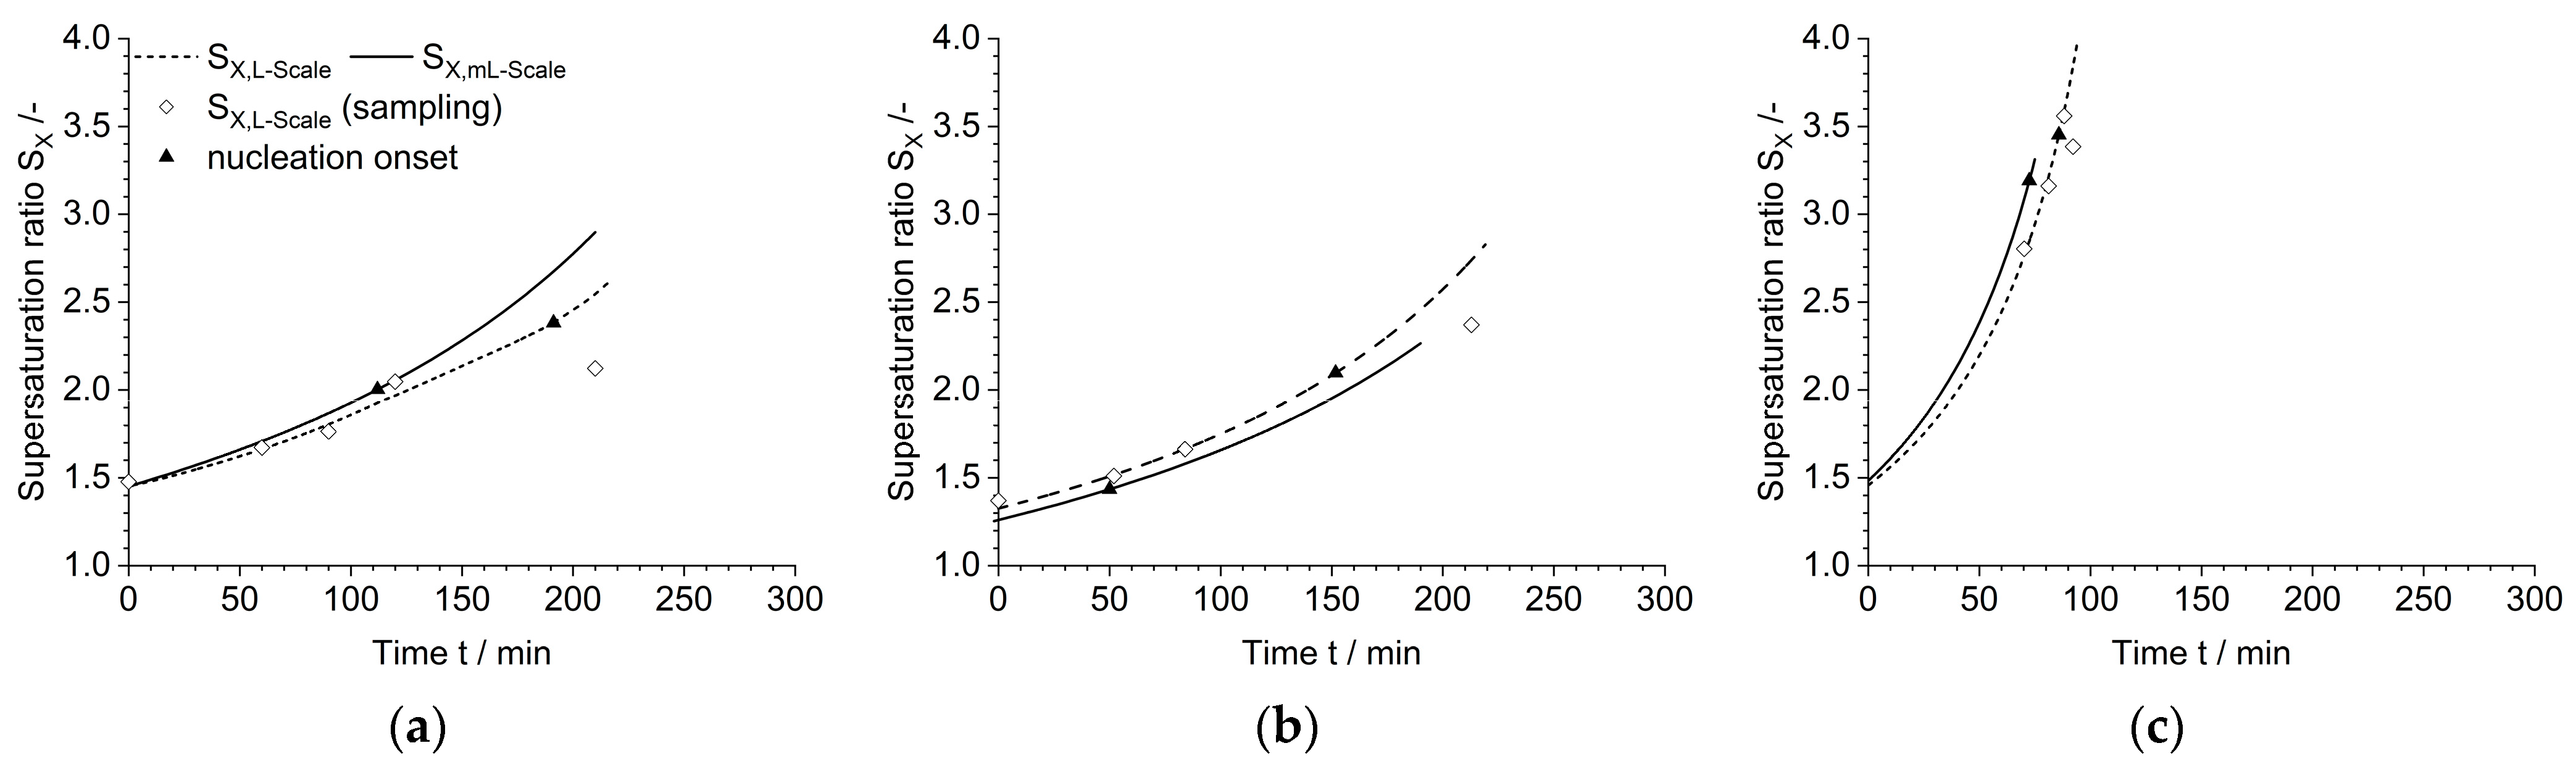
3.2. Process Resemblancy
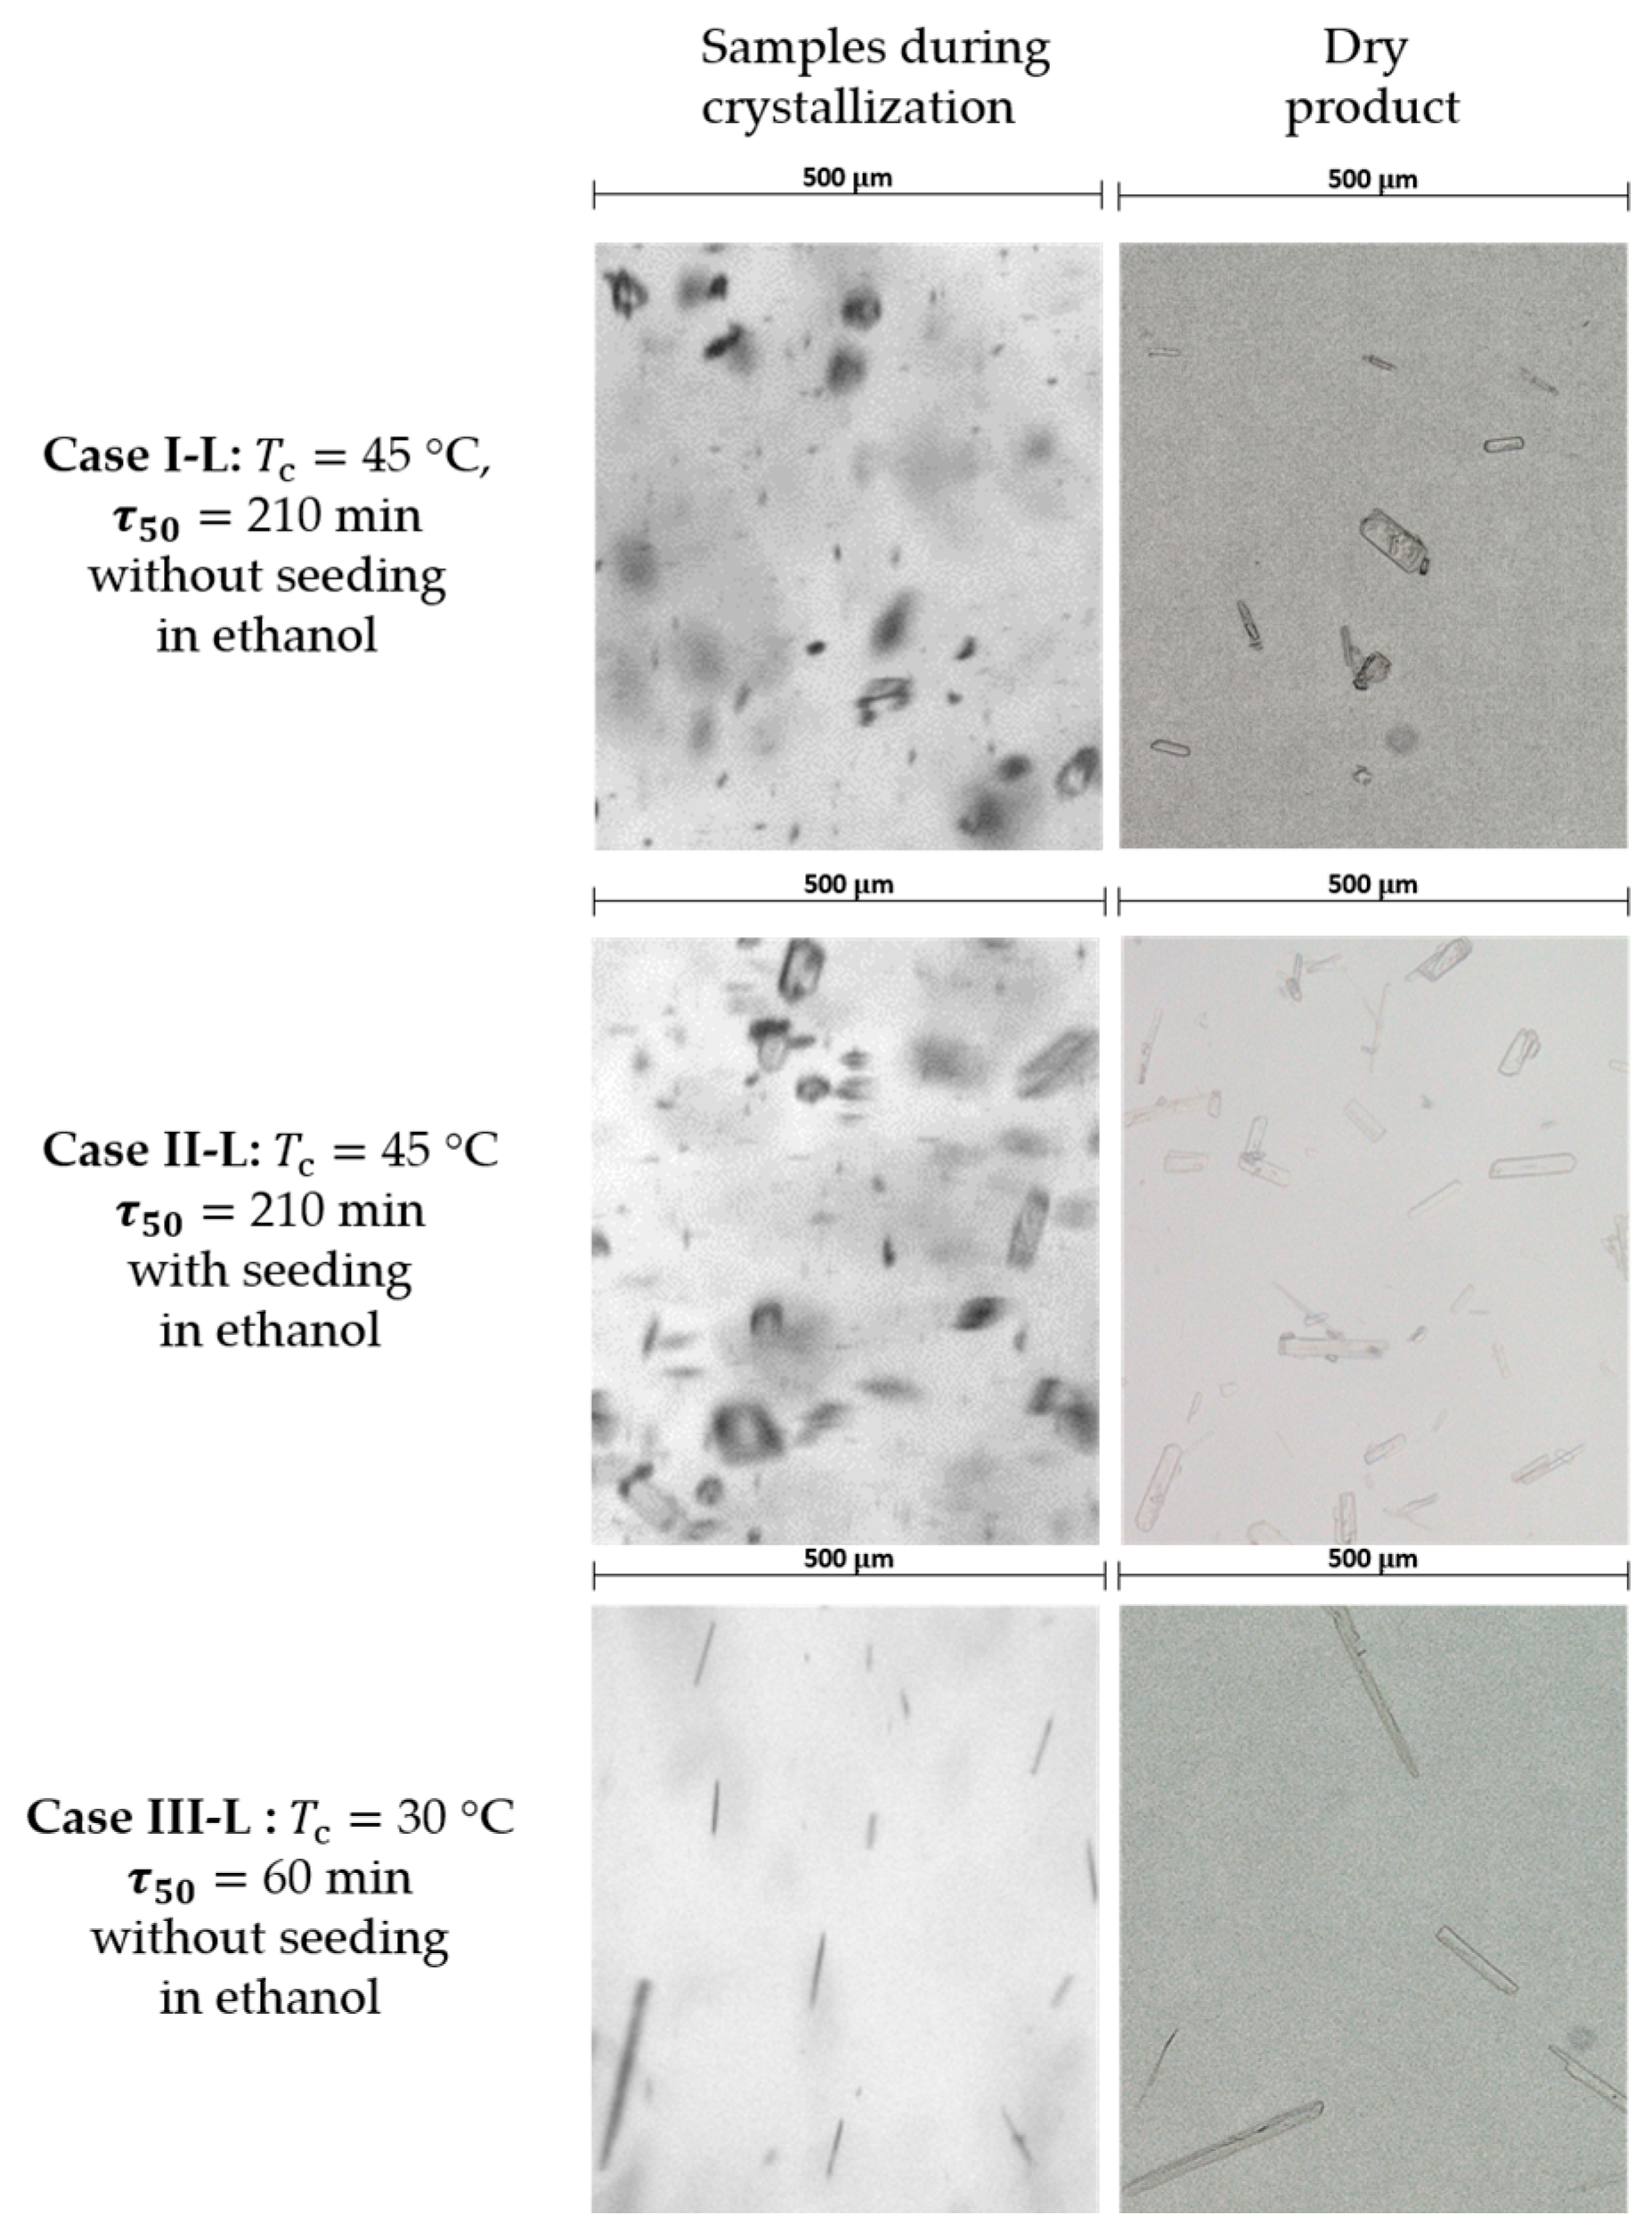
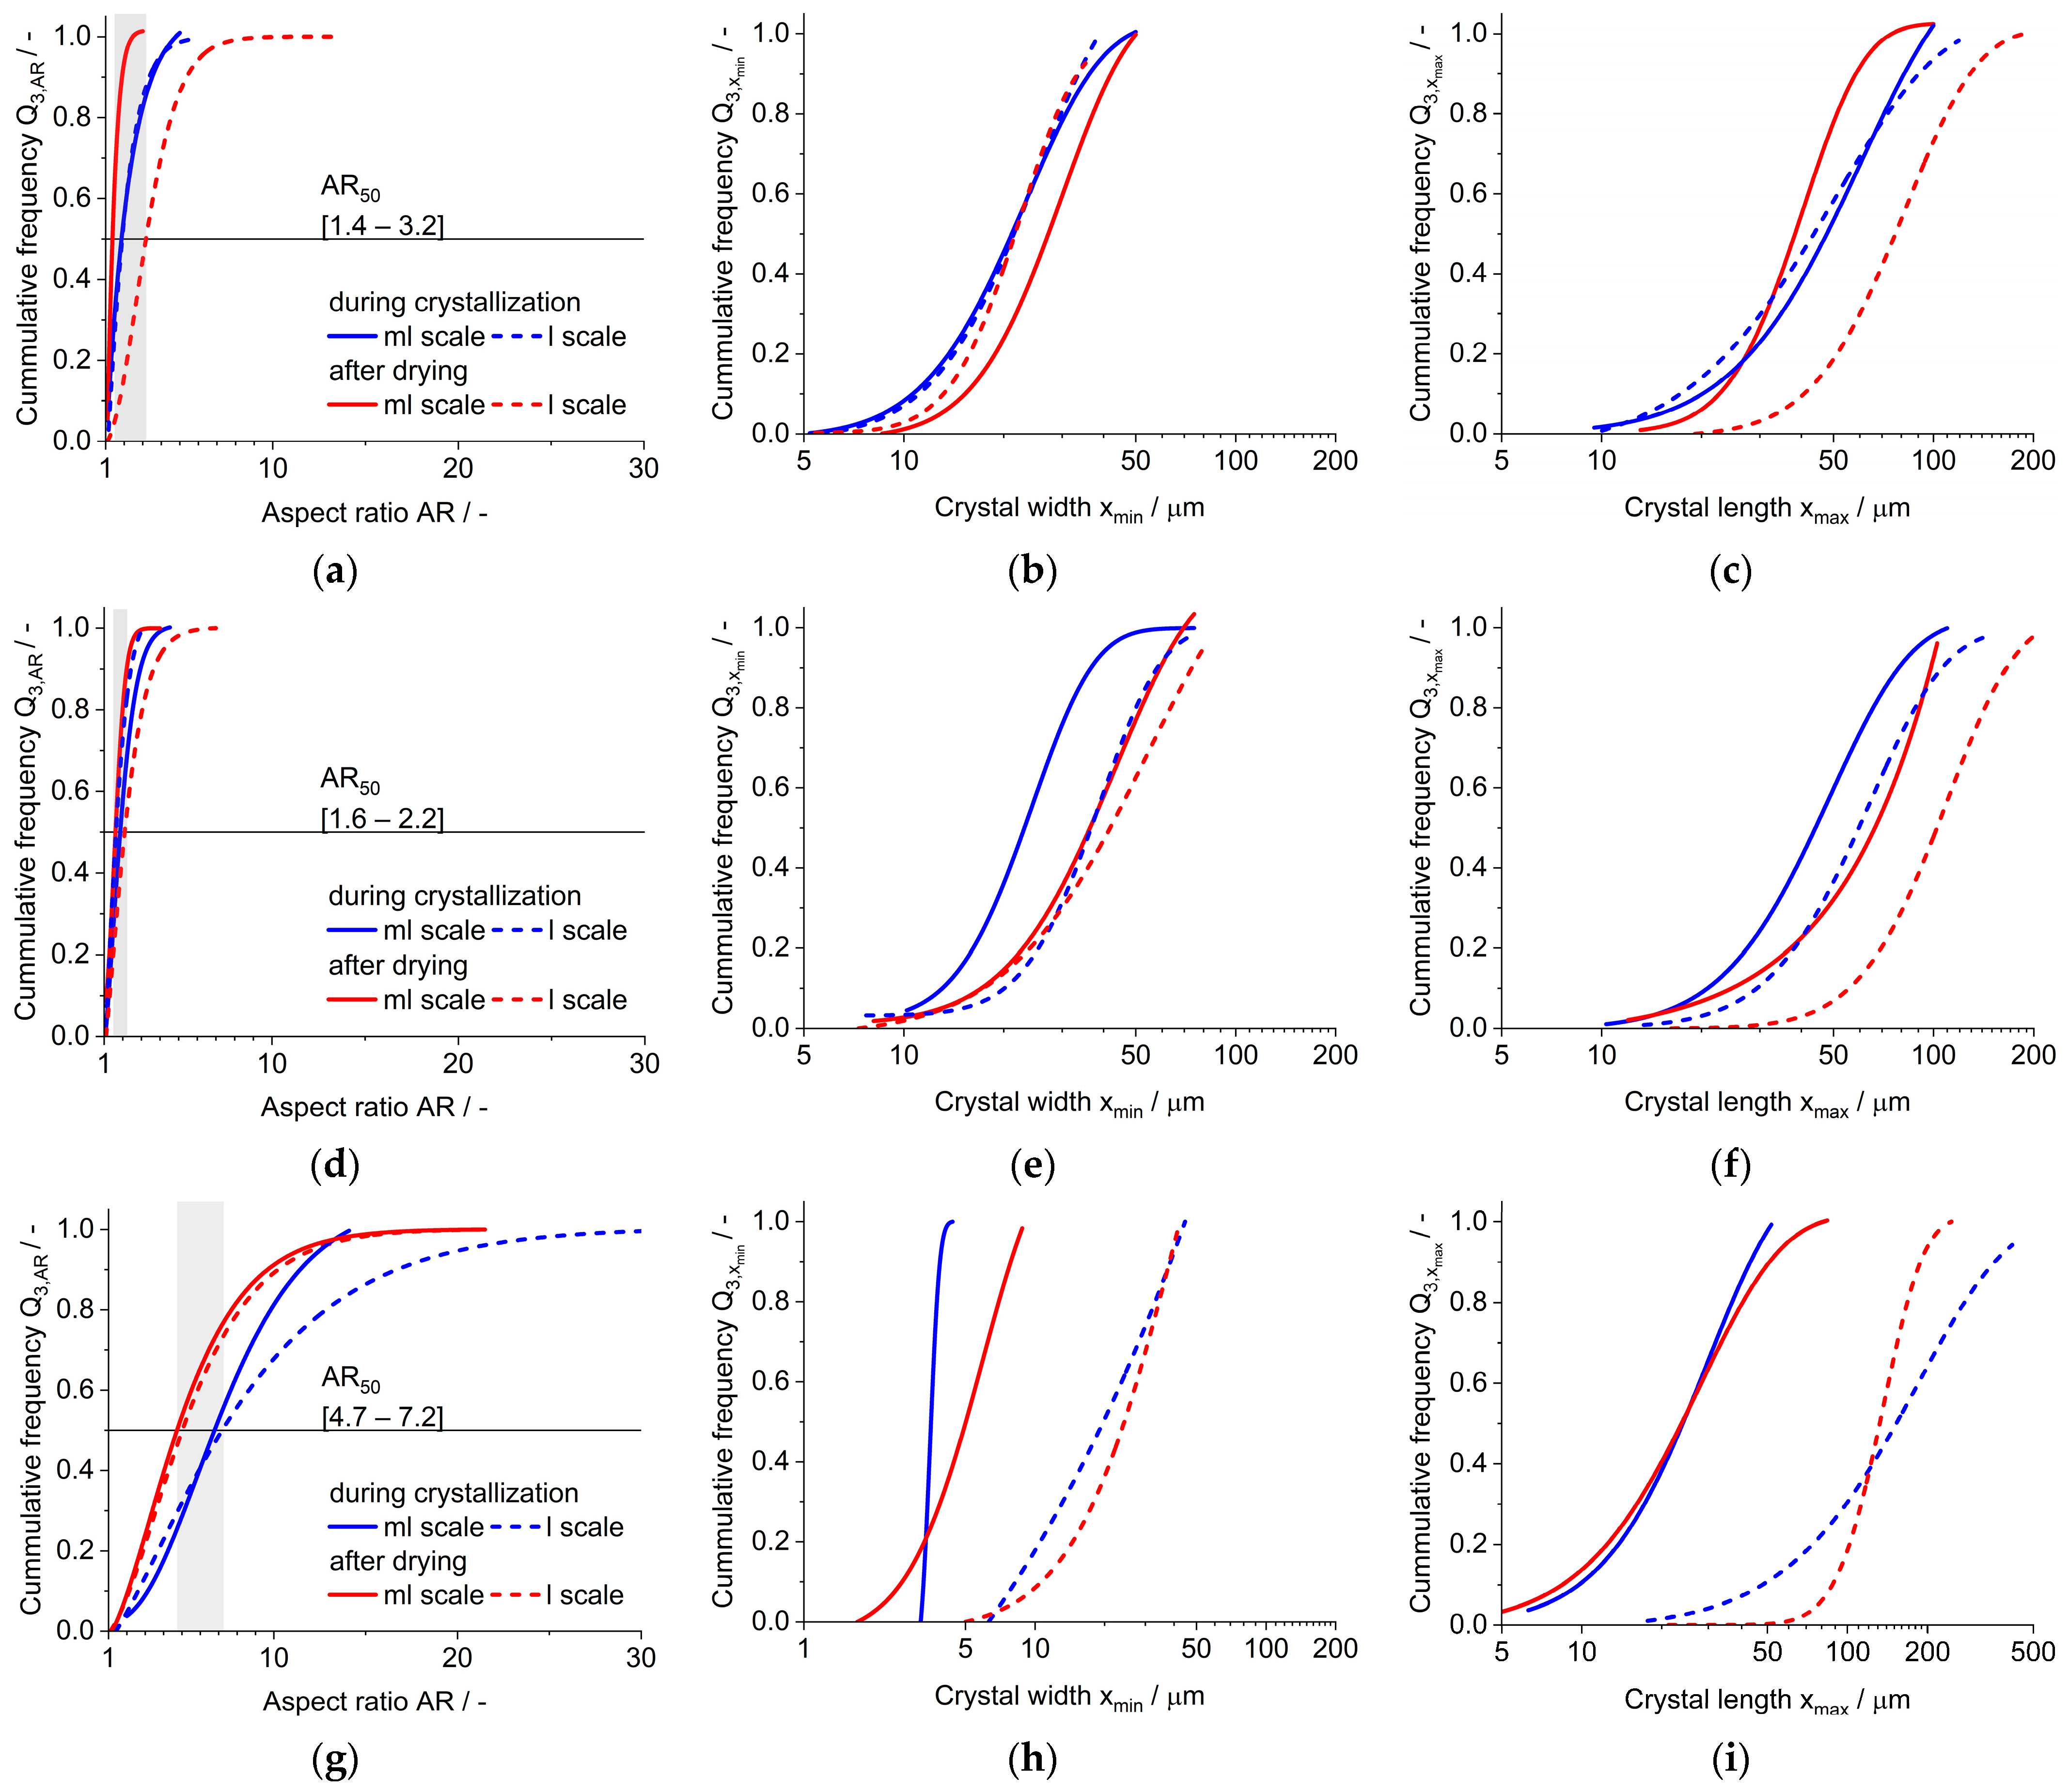
3.3. Large Crystallizator (l Scale)
3.4. Crystal Structure
4. Discussion
5. Conclusions
Author Contributions
Funding
Data Availability Statement
Acknowledgments
Conflicts of Interest
References
- Dandekar, P.; Kuvadia, Z.B.; Doherty, M.F. Engineering Crystal Morphology. Annu. Rev. Mater. Res. 2013, 43, 359–386. [Google Scholar] [CrossRef]
- Lovette, M.A.; Browning, A.R.; Griffin, D.W.; Sizemore, J.P.; Snyder, R.C.; Doherty, M.F. Crystal Shape Engineering. Ind. Eng. Chem. Res. 2008, 47, 9812–9833. [Google Scholar] [CrossRef]
- Pu, S.; Hadinoto, K. Habit Modification in Pharmaceutical Crystallization: A Review. Chem. Eng. Res. Des. 2024, 201, 45–66. [Google Scholar] [CrossRef]
- Pudasaini, N.; Upadhyay, P.P.; Parker, C.R.; Hagen, S.U.; Bond, A.D.; Rantanen, J. Downstream Processability of Crystal Habit-Modified Active Pharmaceutical Ingredient. Org. Process Res. Dev. 2017, 21, 571–577. [Google Scholar] [CrossRef]
- Bourcier, D.; Féraud, J.P.; Colson, D.; Mandrick, K.; Ode, D.; Brackx, E.; Puel, F. Influence of Particle Size and Shape Properties on Cake Resistance and Compressibility during Pressure Filtration. Chem. Eng. Sci. 2016, 144, 176–187. [Google Scholar] [CrossRef]
- Datir, S.R.; Kumar, D.; Bele, M.H. Modified Crystal Habits of Glimepiride to Improve Manufacturing Processability. J. Cryst. Growth 2022, 592, 126711. [Google Scholar] [CrossRef]
- Mirza, S.; Miroshnyk, I.; Heinämäki, J.; Antikainen, O.; Rantanen, J.; Vuorela, P.; Vuorela, H.; Yliruusi, J. Crystal Morphology Engineering of Pharmaceutical Solids: Tabletting Performance Enhancement. AAPS PharmSciTech 2009, 10, 113–119. [Google Scholar] [CrossRef]
- Tiwary, A.K. Modification of Crystal Habit and Its Role in Dosage Form Performance. Drug Dev. Ind. Pharm. 2001, 27, 699–709. [Google Scholar] [CrossRef]
- Blagden, N.; Matas, M.; Gavan, P.T.; York, P. Crystal Engineering of Active Pharmaceutical Ingredients to Improve Solubility and Dissolution Rates. Adv. Drug Deliv. Rev. 2007, 59, 617–630. [Google Scholar] [CrossRef]
- Phan, C.U.; Shen, J.; Yu, K.; Mao, J.; Tang, G. Impact of Crystal Habit on the Dissolution Rate and In Vivo Pharmacokinetics of Sorafenib Tosylate. Molecules 2021, 26, 3469. [Google Scholar] [CrossRef]
- Modi, S.R.; Dantuluri, A.K.R.; Perumalla, S.R.; Sun, C.C.; Bansal, A.K. Effect of Crystal Habit on Intrinsic Dissolution Behavior of Celecoxib Due to Differential Wettability. Cryst. Growth Des. 2014, 14, 5283–5292. [Google Scholar] [CrossRef]
- Dali, M.V.; Carstensen, J.T. Effect of Change in Shape Factor of a Single Crystal on Its Dissolution Behavior. Pharm. Res. 1996, 13, 155–162. [Google Scholar] [CrossRef] [PubMed]
- Ren, Y.; Shen, J.; Yu, K.; Phan, C.U.; Chen, G.; Liu, J.; Hu, X.; Feng, J. Impact of Crystal Habit on Solubility of Ticagrelor. Crystals 2019, 9, 556. [Google Scholar] [CrossRef]
- Cote, A.; Erdemir, D.; Girard, K.P.; Green, D.A.; Lovette, M.A.; Sirota, E.; Nere, N.K. Perspectives on the Current State, Challenges, and Opportunities in Pharmaceutical Crystallization Process Development. Cryst. Growth Des. 2020, 20, 7568–7581. [Google Scholar] [CrossRef]
- Bötschi, S.; Rajagopalan, A.K.; Rombaut, I.; Morari, M.; Mazzotti, M. From Needle-like toward Equant Particles: A Controlled Crystal Shape Engineering Pathway. Comput. Chem. Eng. 2019, 131, 106581. [Google Scholar] [CrossRef]
- Civati, F.; O’Malley, C.; Erxleben, A.; McArdle, P. Factors Controlling Persistent Needle Crystal Growth: The Importance of Dominant One-Dimensional Secondary Bonding, Stacked Structures, and van Der Waals Contact. Cryst. Growth Des. 2021, 21, 3449–3460. [Google Scholar] [CrossRef] [PubMed]
- Lovette, M.A.; Doherty, M.F. Needle-Shaped Crystals: Causality and Solvent Selection Guidance Based on Periodic Bond Chains. Cryst. Growth Des. 2013, 13, 3341–3352. [Google Scholar] [CrossRef]
- Wells, A.F. XXV. Crystal Habit and Internal Structure.—II. Lond. Edinb. Dublin Philos. Mag. J. Sci. 1946, 37, 217–236. [Google Scholar] [CrossRef]
- Klapwijk, A.R.; Simone, E.; Nagy, Z.K.; Wilson, C.C. Tuning Crystal Morphology of Succinic Acid Using a Polymer Additive. Cryst. Growth Des. 2016, 16, 4349–4359. [Google Scholar] [CrossRef]
- Croker, D.M.; Kelly, D.M.; Horgan, D.E.; Hodnett, B.K.; Lawrence, S.E.; Moynihan, H.A.; Rasmuson, Å.C. Demonstrating the Influence of Solvent Choice and Crystallization Conditions on Phenacetin Crystal Habit and Particle Size Distribution. Org. Process Res. Dev. 2015, 19, 1826–1836. [Google Scholar] [CrossRef]
- Burton, W.K.; Cabrera, N.T.; Frank, F.C. The Growth of Crystals and the Equilibrium Structure of Their Surfaces. Trans. R. Soc. Lond. Ser. A 1951, 244, 299–358. [Google Scholar]
- Fischer, C.; Drummer, D. Crystallization and Mechanical Properties of Polypropylene under Processing-Relevant Cooling Conditions with Respect to Isothermal Holding Time. Int. J. Polym. Sci. 2016, 2016, 5450708. [Google Scholar] [CrossRef]
- Prywer, J. Kinetic and Geometric Determination of the Growth Morphology of Bulk Crystals: Recent Developments. Prog. Cryst. Growth Charact. Mater. 2005, 50, 1–38. [Google Scholar] [CrossRef]
- Shekunov, B.Y.; York, P. Crystallization Processes in Pharmaceutical Technology and Drug Delivery Design. J. Cryst. Growth 2000, 211, 122–136. [Google Scholar] [CrossRef]
- Said, A.; Louhi-Kultanen, M. Simulation and Empirical Studies of Solvent Evaporation Rates in Vacuum Evaporation Crystallization. Chem. Eng. Technol. 2019, 42, 1452–1457. [Google Scholar] [CrossRef]
- Liang, Z.; Zhang, M.; Wu, F.; Chen, J.-F.; Xue, C.; Zhao, H. Supersaturation Controlled Morphology and Aspect Ratio Changes of Benzoic Acid Crystals. Comput. Chem. Eng. 2017, 99, 296–303. [Google Scholar] [CrossRef]
- Wang, C.; Zhang, X.; Du, W.; Huang, Y.; Guo, M.; Li, Y.; Zhang, Z.; Hou, B.; Yin, Q. Effects of Solvent and Supersaturation on Crystal Morphology of Cefaclor Dihydrate: A Combined Experimental and Computer Simulation Study. CrystEngComm 2016, 18, 9085–9094. [Google Scholar] [CrossRef]
- Takiyama, H. Supersaturation Operation for Quality Control of Crystalline Particles in Solution Crystallization. Adv. Powder Technol. 2012, 23, 273–278. [Google Scholar] [CrossRef]
- Boerrigter, S.X.M.; Cuppen, H.M.; Ristic, R.I.; Sherwood, J.N.; Bennema, P.; Meekes, H. Explanation for the Supersaturation-Dependent Morphology of Monoclinic Paracetamol. Cryst. Growth Des. 2002, 2, 357–361. [Google Scholar] [CrossRef]
- Li, J.; Doherty, M.F. Steady State Morphologies of Paracetamol Crystal from Different Solvents. Cryst. Growth Des. 2017, 17, 659–670. [Google Scholar] [CrossRef]
- Davey, R.J. The Role of the Solvent in Crystal Growth from Solution. J. Cryst. Growth 1986, 76, 637–644. [Google Scholar] [CrossRef]
- Horst, J.H.; Geertman, R.M.; van Rosmalen, G.M. The Effect of Solvent on Crystal Morphology. J. Cryst. Growth 2001, 230, 277–284. [Google Scholar] [CrossRef]
- Stoica, C.; Verwer, P.; Meekes, H.; van Hoof, P.J.C.M.; Kaspersen, F.M.; Vlieg, E. Understanding the Effect of a Solvent on the Crystal Habit. Cryst. Growth Des. 2004, 4, 765–768. [Google Scholar] [CrossRef]
- Soper, E.M.; Penchev, R.Y.; Todd, S.M.; Eckert, F.; Meunier, M. Quantifying the Effect of Solvent on the Morphology of Organic Crystals Using a Statistical Thermodynamics Approach. J. Cryst. Growth 2022, 591, 126712. [Google Scholar] [CrossRef]
- Ji, X.; Wang, J.; Wang, T.; Huang, X.; Li, X.; Wang, N.; Huang, Y.; Li, R.; Zhao, B.; Zhang, T.; et al. Understanding the Role of Solvent in Regulating the Crystal Habit. CrystEngComm 2022, 24, 2226–2240. [Google Scholar] [CrossRef]
- Zhu, D.; Zhang, S.; Cui, P.; Wang, C.; Dai, J.; Zhou, L.; Huang, Y.; Hou, B.; Hao, H.; Zhou, L.; et al. Solvent Effects on Catechol Crystal Habits and Aspect Ratios: A Combination of Experiments and Molecular Dynamics Simulation Study. Crystals 2020, 10, 316. [Google Scholar] [CrossRef]
- Turner, T.D.; Hatcher, L.E.; Wilson, C.C.; Roberts, K.J. Habit Modification of the Active Pharmaceutical Ingredient Lovastatin Through a Predictive Solvent Selection Approach. J. Pharm. Sci. 2019, 108, 1779–1787. [Google Scholar] [CrossRef]
- Wang, Y.; Liang, Z. Solvent Effects on the Crystal Growth Structure and Morphology of the Pharmaceutical Dirithromycin. J. Cryst. Growth 2017, 480, 18–27. [Google Scholar] [CrossRef]
- Wilkinson, M.R.; Martinez-Hernandez, U.; Huggon, L.K.; Wilson, C.C.; Castro Dominguez, B. Predicting Pharmaceutical Crystal Morphology Using Artificial Intelligence. CrystEngComm 2022, 24, 7545–7553. [Google Scholar] [CrossRef]
- Achermann, R.; Adams, R.; Prasser, H.-M.; Mazzotti, M. Characterization of a Small-Scale Crystallizer Using CFD Simulations and X-ray CT Measurements. Chem. Eng. Sci. 2022, 256, 117697. [Google Scholar] [CrossRef]
- Simone, E.; McVeigh, J.; Reis, N.M.; Nagy, Z.K. A High-Throughput Multi-Microfluidic Crystal Generator (MMicroCryGen) Platform for Facile Screening of Polymorphism and Crystal Morphology for Pharmaceutical Compounds. Lab Chip 2018, 18, 2235–2245. [Google Scholar] [CrossRef] [PubMed]
- Jain, D.; Dalvi, V.; Mathpati, C.; Kant, J. Process Analytical Technology as an Enabling Tool for Scale up of Crystallization, Filtration, Drying and Milling. Chem. Eng. Res. Des. 2023, 190, 117–128. [Google Scholar] [CrossRef]
- Nguyen, T.T.H.; Turner, T.D.; Matinong, A.M.E.; Marziano, I.; Hammond, R.B.; Roberts, K.J. Measured Growth Rates of Ibuprofen: Comparing Single Crystal and Bulk Suspensions Data. Chem. Eng. Technol. 2021, 44, 1287–1293. [Google Scholar] [CrossRef]
- Barros Groß, M.; Kind, M. From Microscale Phase Screening to Bulk Evaporative Crystallization of Proteins. J. Cryst. Growth 2018, 498, 160–169. [Google Scholar] [CrossRef]
- Yi, Y.J.; Myerson, A.S. Laboratory Scale Batch Crystallization and the Role of Vessel Size. Chem. Eng. Res. Des. 2006, 84, 721–728. [Google Scholar] [CrossRef]
- Kramer, H.J.M.; Bermingham, S.K.; van Rosmalen, G.M. Design of Industrial Crystallisers for a given Product Quality. J. Cryst. Growth 1999, 198, 729–737. [Google Scholar] [CrossRef]
- Feth, M.P.; Heyse, W.; Baumgartner, B.; Nagel, N.; Tappertzhofen, C.; Olpp, T.; Jurascheck, J.; Ulrich, J.; Helmdach, L.; Petzoldt, C. From Laboratory to Pilot Plant: The Solid-State Process Development of a Highly Potent Cathepsin S/K Inhibitor. Eur. J. Pharm. Biopharm. 2013, 83, 436–448. [Google Scholar] [CrossRef]
- Steendam, R.R.E.; Keshavarz, L.; Blijlevens, M.A.R.; Souza, B.; Croker, D.M.; Frawley, P.J. Effects of Scale-Up on the Mechanism and Kinetics of Crystal Nucleation. Cryst. Growth Des. 2018, 18, 5547–5555. [Google Scholar] [CrossRef]
- Yu, Z.-Q.; Yeoh, A.; Chow, P.S.; Tan, R.B.H. Particle Size Control in Batch Crystallization of Pyrazinamide on Different Scales. Org. Process Res. Dev. 2016, 20, 2100–2107. [Google Scholar] [CrossRef]
- Smejkal, B.; Helk, B.; Rondeau, J.-M.; Anton, S.; Wilke, A.; Scheyerer, P.; Fries, J.; Hekmat, D.; Weuster-Botz, D. Protein Crystallization in Stirred Systems—Scale-up via the Maximum Local Energy Dissipation. Biotechnol. Bioeng. 2013, 110, 1956–1963. [Google Scholar] [CrossRef]
- Ramos Ojeda, N.; Kind, M. A Comprehensive Workflow Towards More Equant Shaped Crystals of Active Pharmaceutical Ingredients. Chem. Eng. Technol. 2023, 43, 1–12. [Google Scholar]
- Bubendorf, A.; Deynet-Vucenovic, A.; Diodone, R.; Grassmann, O.; Lindenstruth, K.; Pinard, E.; Rohrer, F.E.; Schwitter, U. Hoffmann-La Roche INC. Solid Forms of 4-(3-Fluoro-5-Trifluoromethyl Pyridin-2-Yl)-Piperazin-1-Yl-5-Methanesulfonyl-2-((S)-2,2.2-Trifluoro-1-Methyl-Ethoxy)-Phenyl-Methanone. U.S. Patent US2008/0214561A1, 4 September 2008. [Google Scholar]
- Qian, R.Y.; Chen, Z.D.; Ni, H.G.; Fan, Z.Z.; Cai, F.D. Crystallization Kinetics of Potassium Chloride from Brine and Scale-up Criterion. AIChE J. 1987, 33, 1690–1697. [Google Scholar] [CrossRef]
- Henzler, H.J.; Biedermann, A. Modelluntersuchungen Zur Partikelbeanspruchung in Reaktoren. Chem. Ing. Tech. 1996, 68, 1546–1561. [Google Scholar] [CrossRef]
- Hebel, D.; Ürdingen, M.; Hekmat, D.; Weuster-Botz, D. Development and Scale up of High-Yield Crystallization Processes of Lysozyme and Lipase Using Additives. Cryst. Growth Des. 2013, 13, 2499–2506. [Google Scholar] [CrossRef]
- Lehrer, I.H. Jacket-Side Nusselt Number. Ind. Eng. Chem. Process Des. Dev. 1970, 9, 553–558. [Google Scholar] [CrossRef]
- European Directorate for the Quality of Medicines & HealthCare. European Pharmacopoeia, 8th ed.; Council of Europe: Strasbourg, France, 2013. [Google Scholar]
- Borho, K.; Polke, R.; Wintermatel, K.; Schubert, H.; Sommer, K. Produkteigenschaften und Verfahrenstechnik. Chem. Ing. Tech. 1991, 63, 792–808. [Google Scholar] [CrossRef]
- Steenweg, C.; Habicht, J.; Wohlgemuth, K. Continuous Isolation of Particles with Varying Aspect Ratios up to Thin Needles Achieving Free-Flowing Products. Crystals 2022, 12, 137. [Google Scholar] [CrossRef]
- Mahdi, F.M.; Shier, A.P.; Fragkopoulos, I.S.; Carr, J.; Gajjar, P.; Muller, F.L. On the Breakage of High Aspect Ratio Crystals in Filter Beds under Continuous Percolation. Pharm. Res. 2020, 37, 231. [Google Scholar] [CrossRef]
- Selzer, D.R. On Primary Crystal Nucleation in Electrolyte Solutions of Well-Soluble Substances Primary Nucleation Kinetics and Nucleation Mechanisms at Low and High Supersaturation, Karlsruher Institute für Technologie: Karlsruhe; Verlag Dr. Hut: München, Germany, 2021. [Google Scholar]
- Devos, C.; van Gerven, T.; Kuhn, S. A Review of Experimental Methods for Nucleation Rate Determination in Large-Volume Batch and Microfluidic Crystallization. Cryst. Growth Des. 2021, 21, 2541–2565. [Google Scholar] [CrossRef]
- Xiao, Y.; Wang, J.; Huang, X.; Shi, H.; Zhou, Y.; Zong, S.; Hao, H.; Bao, Y.; Yin, Q. Determination Methods for Crystal Nucleation Kinetics in Solutions. Cryst. Growth Des. 2018, 18, 540–551. [Google Scholar] [CrossRef]
- Yokota, M.; Takezawa, E.; Takakusaki, T.; Sato, A.; Takahashi, H.; Kubota, N. Scale-up effEct on the Rate of Contact Nucleation Caused by Collisions of Crystals with an Impeller. Chem. Eng. Sci. 1999, 54, 3831–3838. [Google Scholar] [CrossRef]
- Li, X.; Heng, J.Y.Y. The Critical Role of Agitation in Moving from Preliminary Screening Results to Reproducible Batch Protein Crystallisation. Chem. Eng. Res. Des. 2021, 173, 81–88. [Google Scholar] [CrossRef]
- Mullin, J.W. Crystallization; Chemical, Petrochemical & Process; Butterworth-Heinemann: Oxford, UK, 2001; ISBN 978-0-7506-4833-2. [Google Scholar]
- Mersmann, A. (Ed.) Crystallization Technology Handbook; CRC Press: New York, NY, USA; Basel, Switzerland, 2001; ISBN 978-0-429-20798-3. [Google Scholar]
- Rajagopalan, A.K.; Schneeberger, J.; Salvatori, F.; Bötschi, S.; Ochsenbein, D.R.; Oswald, M.R.; Pollefeys, M.; Mazzotti, M. A Comprehensive Shape Analysis Pipeline for Stereoscopic Measurements of Particulate Populations in Suspension. Powder Technol. 2017, 321, 479–493. [Google Scholar] [CrossRef]
- Li, P.; He, G.; Lu, D.; Xu, X.; Chen, S.; Jiang, X. Crystal Size Distribution and Aspect Ratio Control for Rodlike Urea Crystal via Two-Dimensional Growth Evaluation. Ind. Eng. Chem. Res. 2017, 56, 2573–2581. [Google Scholar] [CrossRef]


| Parameters | Units | ml Scale | l Scale | |
|---|---|---|---|---|
| Construction material | - | - | Glass | Glass |
| Filling Volume | V | mL | 5 | 1200 |
| Impeller type | - | - | Bladed propeller | Bladed propeller |
| Number of blades | nb | - | 3 | 3 |
| Stirrer speed | n | min−1 | 1000 | 178 |
| Impeller tip speed | nt | m s−1 | 0.42 | 0.42 |
| Stirrer diameter | ds | mm | 8 | 45 |
| Crystallizator diameter | D | mm | 15 | 110 |
| Liquid coverage of the stirrer | hs | mm | 14 | 75 |
| Stirrer blade height | hsb | mm | 11 | 5 |
| Level height | Hf | mm | 24.3 | 125 |
| Blade inclination to the horizontal | ° | 60 | 45 | |
| Number of baffles | nb | - | 0 | 4 |
| Height ratio | Hf/hs | - | 1.7 | 1.7 |
| Diameter ratio | ds/D | - | 0.5 | 0.5 |
| Height-to-diameter ratio | Hf/D | - | 1.5 | 1.6 |
| Ethanol | |||||
|---|---|---|---|---|---|
| without seeding | with seeding | ||||
| 60 min | 210 min | 60 min | 210 min | ||
| 15 °C | needle, rod-like | needle, rod-like | isometric, rod-like | isometric, rod-like | |
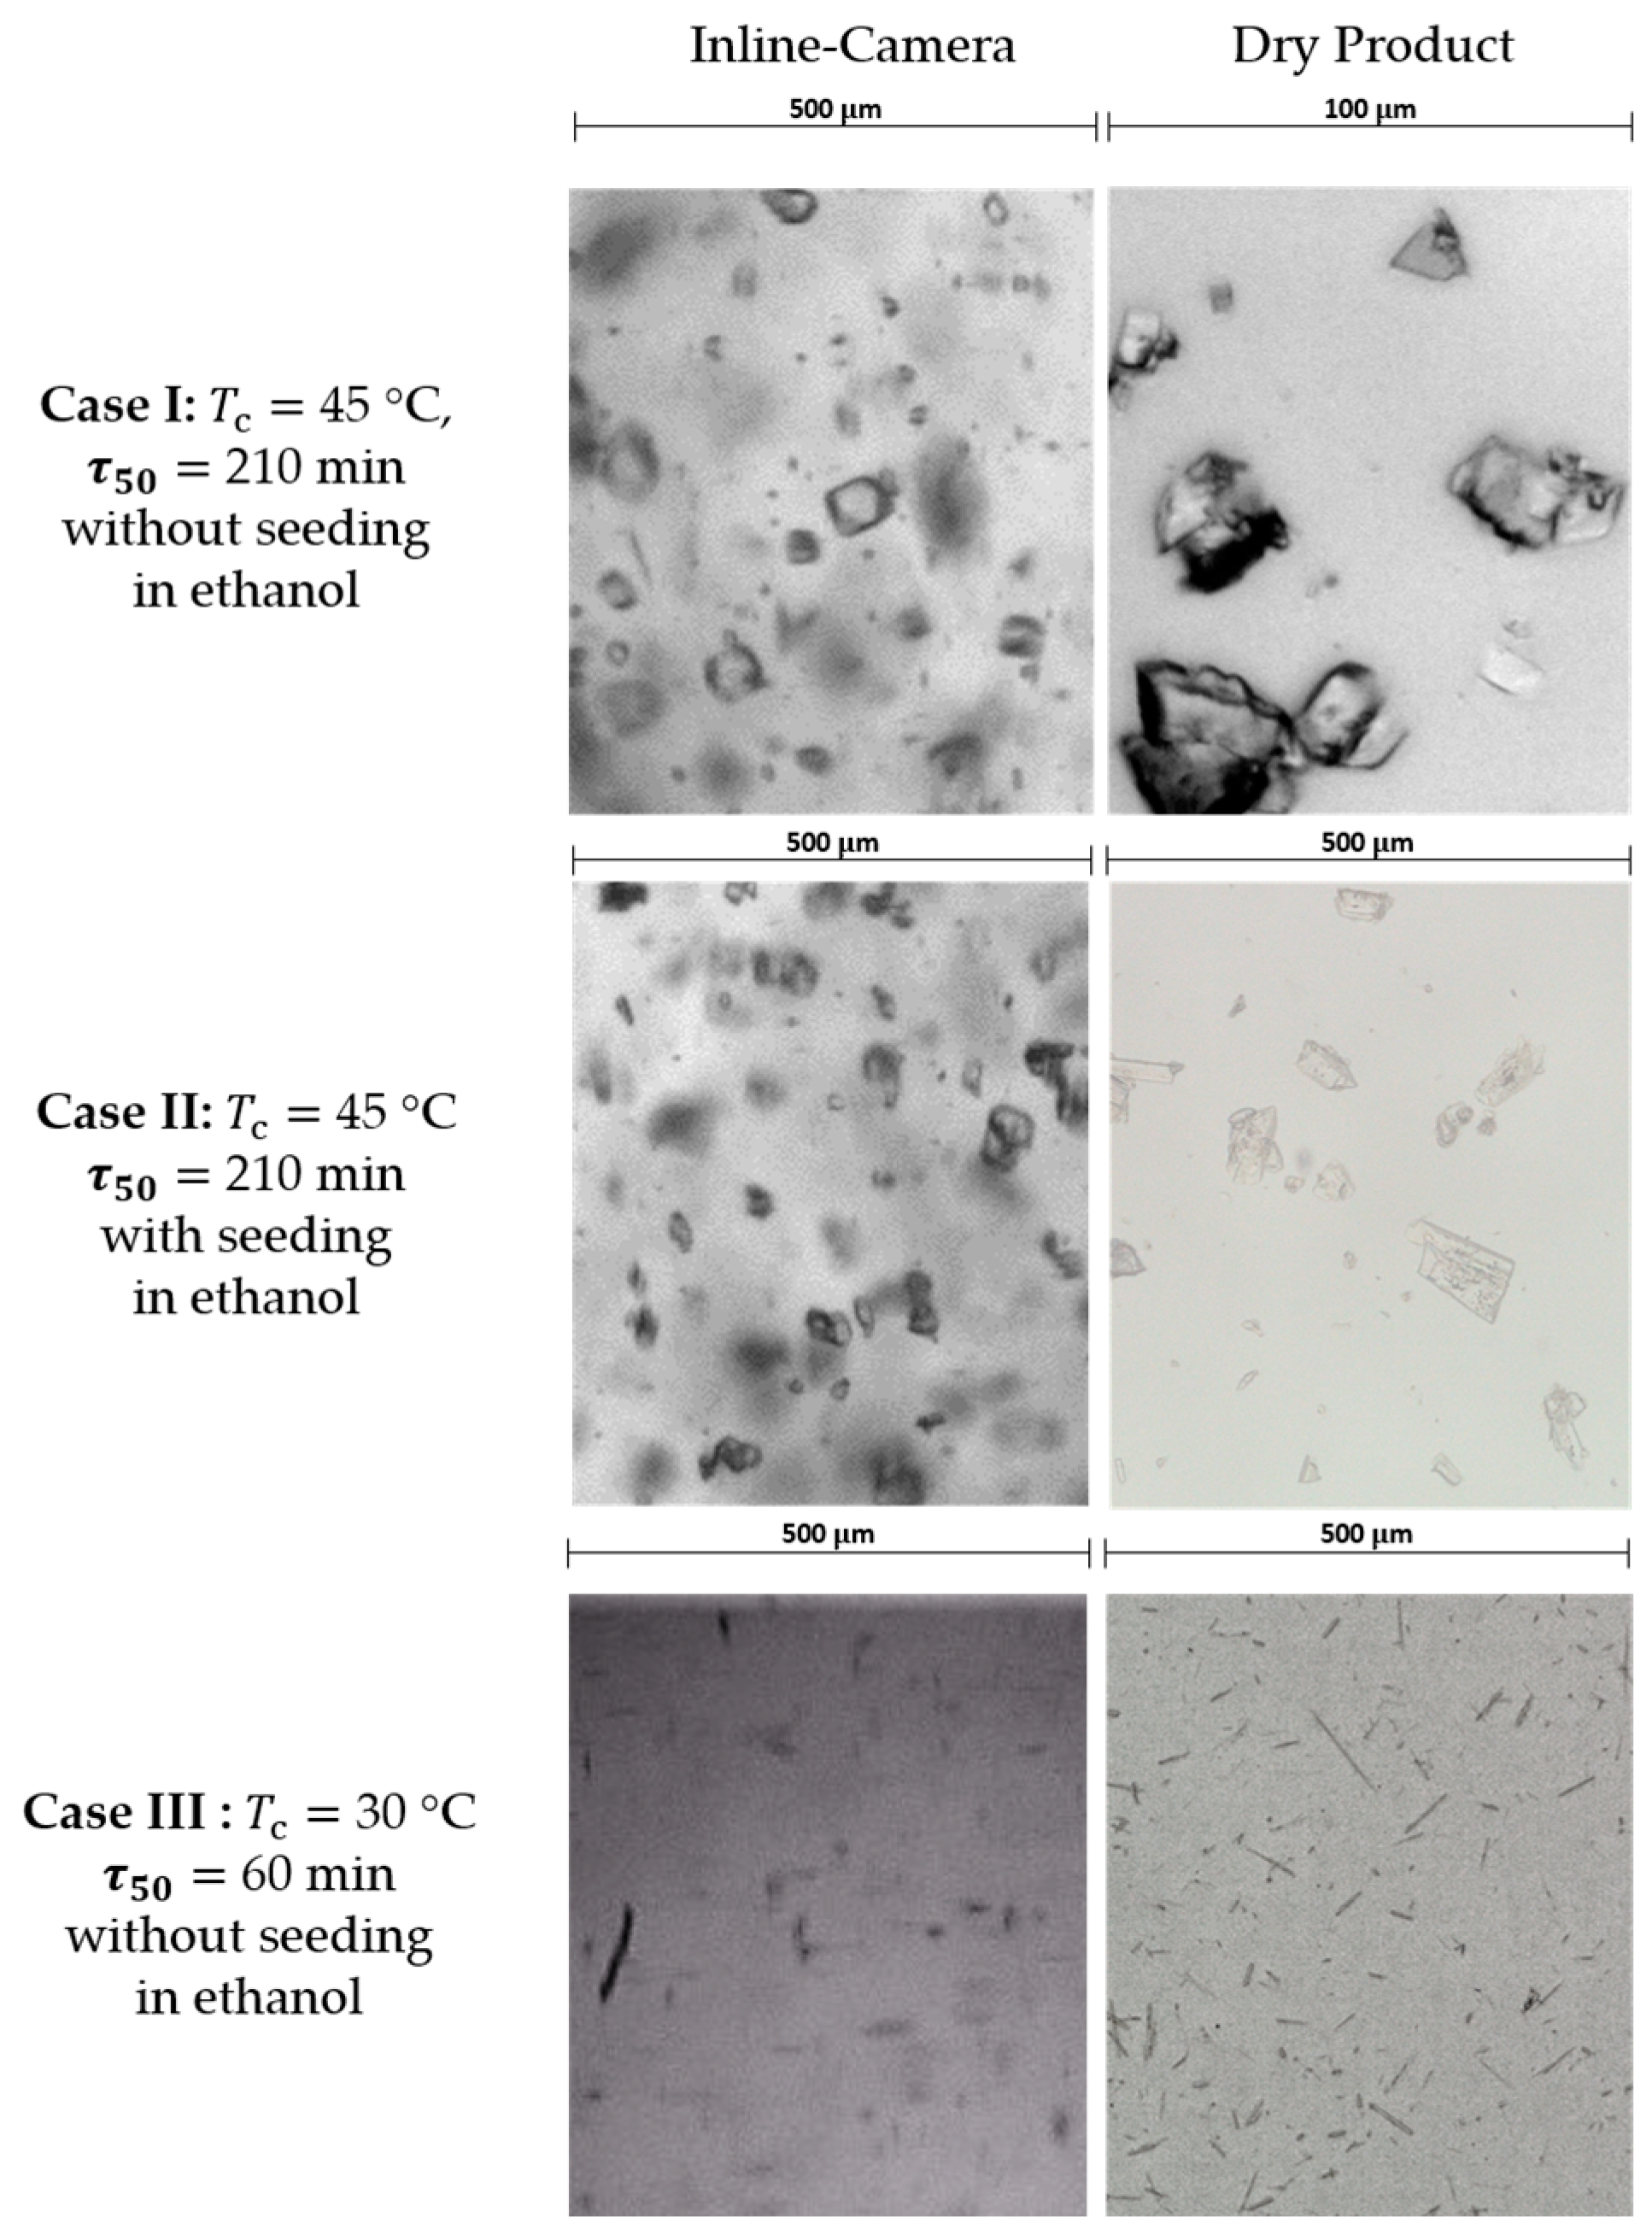
| 30 °C | Case III needle, rod-like | needle, rod-like | isometric | isometric | |
| 45 °C | needle, rod-like | Case I isometric | isometric | Case II isometric | |
| 55 °C | needle, rod-like | isometric | - | - | |
| 1-propanol | |||||
| without seeding | with seeding | ||||
| 60 min | 210 min | 60 min | 210 min | ||
| 15 °C | - | needle | needle | needle | |
| 30 °C | needle | needle | - | needle, rod-like | |
| 45 °C | needle | needle | isometric, rod-like | isometric, rod-like | |
| 55 °C | - | needle | |||
| 2-propanol | |||||
| without seeding | with seeding | ||||
| 60 min | 210 min | 60 min | 210 min | ||
| 15 °C | needle | needle | needle | needle | |
| 30 °C | needle | needle | - | - | |
| 45 °C | needle | needle | needle | isometric, rod-like | |
| 55 °C | gel | needle | - | gel | |
| ml Scale | |||||||||
|---|---|---|---|---|---|---|---|---|---|
| Case | °C | mL min−1 | min | mbar | g | - | mL | g | n min−1 |
| I | 45 | 37 | 210 | 970 | 0 | 1.45 | 5 | 0.952 | 1000 |
| II | 45 | 37 | 210 | 970 | 0.004 | 1.33 | 5 | 0.874 | 1000 |
| III | 30 | 220 | 60 | 970 | 0 | 1.49 | 5 | 0.333 | 1000 |
| l Scale | |||||||||
| Case | °C | °C | min | mbar | g | - | mL | g | n min−1 |
| I-L | 45 | 58 | 210 | 232 | - | 1.45 | 1090 | 207 | 178 |
| II-L | 45 | 58 | 210 | 232 | 0.425 | 1.37 | 1100 | 198 | 178 |
| III-L | 30 | 56 | 60 | 106 | - | 1.47 | 1200 | 72 | 178 |
Disclaimer/Publisher’s Note: The statements, opinions and data contained in all publications are solely those of the individual author(s) and contributor(s) and not of MDPI and/or the editor(s). MDPI and/or the editor(s) disclaim responsibility for any injury to people or property resulting from any ideas, methods, instructions or products referred to in the content. |
© 2023 by the authors. Licensee MDPI, Basel, Switzerland. This article is an open access article distributed under the terms and conditions of the Creative Commons Attribution (CC BY) license (https://creativecommons.org/licenses/by/4.0/).
Share and Cite
Ramos Ojeda, N.A.; Kind, M. Transferring Crystallization Conditions from Small to Larger Scale for Achieving Targeted Crystal Morphologies of an Active Pharmaceutical Ingredient. Crystals 2024, 14, 42. https://doi.org/10.3390/cryst14010042
Ramos Ojeda NA, Kind M. Transferring Crystallization Conditions from Small to Larger Scale for Achieving Targeted Crystal Morphologies of an Active Pharmaceutical Ingredient. Crystals. 2024; 14(1):42. https://doi.org/10.3390/cryst14010042
Chicago/Turabian StyleRamos Ojeda, Nicolás Antonio, and Matthias Kind. 2024. "Transferring Crystallization Conditions from Small to Larger Scale for Achieving Targeted Crystal Morphologies of an Active Pharmaceutical Ingredient" Crystals 14, no. 1: 42. https://doi.org/10.3390/cryst14010042
APA StyleRamos Ojeda, N. A., & Kind, M. (2024). Transferring Crystallization Conditions from Small to Larger Scale for Achieving Targeted Crystal Morphologies of an Active Pharmaceutical Ingredient. Crystals, 14(1), 42. https://doi.org/10.3390/cryst14010042