Article

Experimental Investigation of Laser Damage Limit for ZPG Infrared Single Crystal Using Deep Magnetorheological Polishing of Working Surfaces

1
Scientific Educational Center “Optical and Photonic Technologies”, National Research Tomsk State University, 634050 Tomsk, Russia
2
Institute of Atmospheric Optics Siberian, Branch of the Russian Academy of Sciences, pl. Academician Zueva, 1, 634055 Tomsk, Russia
3
A.V. Luikov Heat and Mass Transfer Institute NASB, 220072 Minsk, Belarus
*
Author to whom correspondence should be addressed.
Crystals 2024, 14(1), 32; https://doi.org/10.3390/cryst14010032
Submission received: 6 October 2023 / Revised: 20 November 2023 / Accepted: 27 November 2023 / Published: 27 December 2023
(This article belongs to the Special Issue Laser Surface Modification of Materials)

Abstract

:
Zinc germanium phosphide (ZGP) crystals have garnered significant attention for their nonlinear properties, making them good candidates for powerful mid-IR optical parametric oscillators and second-harmonic generators. A ZnGeP2 single crystal was treated by deep magnetorheological processing (MRP) until an Angstrom level of roughness. The studies presented in this article are devoted to the experimental evaluation of the influence of deep removal (up to 150 μm) from the surface of a ZnGeP2 single crystal by magnetorheological polishing on the parameters of optical breakdown. It was shown that the dependence of the ZnGeP2 laser-induced damage threshold on MRP depth is a smooth monotonically decreasing logarithmic function. The obtained logarithmic dependence indicates the thermal nature of optical breakdown and the dependence of the ZnGeP2 laser-induced damage threshold on the concentration of surface absorbing defects.

1. Introduction

Pulsed-periodic sources of powerful coherent mid-infrared (IR) radiation are widely used in many areas of science and technology. In particular, frequency converters operating in the 3.5–5.0 μm wavelength range and in the 8.0 μm region are promising for organizing optical communication in the atmosphere within the framework of global 6G information transmission systems [1]. Sources of coherent mid-IR radiation are also used for processing materials (glasses, ceramics, or semiconductors) by scribbling and thermal cracking [2,3] in medicine, including in the diagnosis of diseases [4,5,6]. Sources of coherent radiation with powerful pulsed radiation in the 3.5–5.0 μm wavelength range are relevant for the creation of lidar techniques for monitoring the emission of greenhouse gases [7,8,9]. One of the most efficient solid-state sources of coherent radiation in the mid-IR range is optical parametric oscillators (OPOs).
The most powerful OPOs in the 3.5–5.0 μm wavelength range are currently created based on ZnGeP2 (ZGP) nonlinear optical crystals [10].
This type of OPO can generate radiation up to 160 W or pulse energy of up to 200 mJ at a pulse duration of 20–60 ns and a repetition rate from units of Hz to 100 kHz [11,12,13]. It should be noted that ZGP OPO lifetime is limited by the laser-induced damage threshold (LIDT). Thus, OPO application prospects in the mid-IR range are inextricably linked with an increase in their LIDT.

2. Estimation of the Influence of Various Parameters on the Magnitude of Optical Breakdown

ZGP optical breakdown by 1.064 μm to 10 μm laser radiation was studied in [14,15,16,17,18,19,20]. There is a significant difference in the LIDT for 1.064 μm and 2.1 μm irradiation [14]. It was established via dynamic visualization that thermal effects are initiated by ZPG optical breakdown under 2.1 μm laser radiation. Local melting due to a sharp increase in temperature leads to the formation of an optical breakdown track along the laser beam. The hardening process of the molten material leads to the diffusion of free charge carriers from the heated region of the crystal in a direction perpendicular to the laser beam and is accompanied by the appearance of a glowing region at the output optical surface in the volume of the crystal due to the recombination of the formed non-equilibrium charge carriers, as well as the subsequent movement of this glowing region towards the input optical surface, i.e., in the direction opposite to the propagation of laser radiation [15]. The authors of [16] registered ZGP LIDT increasing when pumping pulse duration was decreasing that "supports the thermal nature of the breakdown for nanosecond pulses due to anomalous infrared absorption". Ref. [17] reported 1.5–3 times the LIDT increase up to 9 J/cm2 under -60 °C crystal cooling for 2.091 μm irradiation and 10 kHz pulse repetition rate. This effect was manifest [17] in the temperature relationship of the filling numbers of phonons that, conjointly with optical quanta, take part in nonlinear absorption from the valence band to the impurity level’s indirect transitions.
In [18], ZGP LIDT of about 9.5 J/cm2 under 142 MW/cm2 incident beam, 85 ns pulse duration, and 1 Hz repetition rate was determined. The authors of [17] established direct dependence of the LIDT on the growth technology and optical quality of crystals. In [21], it was shown that Mg and Se diffusion doping results in LIDT increasing for 2.1 μm irradiation. Reduced conductivity was detected on Mg- and Se-doped ZGP samples. This means that there is a correlation between the LIDT and the electrophysical parameters of ZGP single crystals.
Regarding the effectiveness of using antireflective interference coatings, the authors of [20,22,23] draw completely opposite conclusions. In [22], it was reported that the LIDT values decreased by 1.5 times for coated samples. On the contrary, in [20], it was registered by LIDT increasing by two times. The authors of [23] came to the conclusion that it is necessary to focus on the coating quality improving for 3–5 μm spectrum ZGP crystals.
According to [20,22], the application of interference coatings with varying thicknesses, chemical compositions of materials, and deposition methods significantly effects ZGP LIDT and its use in OPO.
The LIDT increasing dramatically depends on the quality of the polishing and removing of the cracked under layer [17,20]. In [20] ~500 μm total material removal via mechanical polishing using water-based and diamond powder suspension was applied, which led to a two-fold improvement in Rq and a five-fold improvement in PV parameters. As a result, the energy density increasing by two-fold up to 2 J/cm2 was observed for the ZGP-coated sample under 2.05 μm irradiation and 10 kHz repetition rate.
Ref. [17] presented the results of the investigation of the influence of Rz, Rq, and Ra individual roughness parameters on the LIDT value. With a constant Rz parameter, a change in the Rq parameter up to four times and Ra up to five times did not register a change in LIDT. This means that the Rz parameter of roughness directly affects the LIDT. This fact can be explained by the prevalence of field effects at high surface peaks (Rz) under 2.091 μm irradiation.
In [24], magnetorheological polishing (MRP) was, for the first time, utilized to superfinish the ZGP single crystal. As a result, working surfaces without scratching with an angstrom level of roughness were produced. MRP, due to intelligence removal of the material from the surface, allowed for small size bulk structural defects (0.5–1.5 μm) to be characterized more correctly. It was established for non-coated ZPG surfaces that the LIDT value was limited primarily by nano- and microsized structural defects, not by the quality of MRP with an angstrom level of roughness. A similar conclusion was reached by the authors of [25], who put forward the assumption that the concentration of dislocations in a ZGP crystal has a predominant effect on LIDT.
An analysis of the sources [17,20,24] also showed that there are no studies describing the influence of the amount of material removal using various methods of ZGP crystal surface polishing on the value of LIDT.
The studies presented in this article are a logical continuation of the results obtained in [24], and they are devoted to the experimental evaluation of the influence of deep removal (up to 150 μm) via MRP from ZGP single-crystal surfaces on the parameters of optical breakdown.

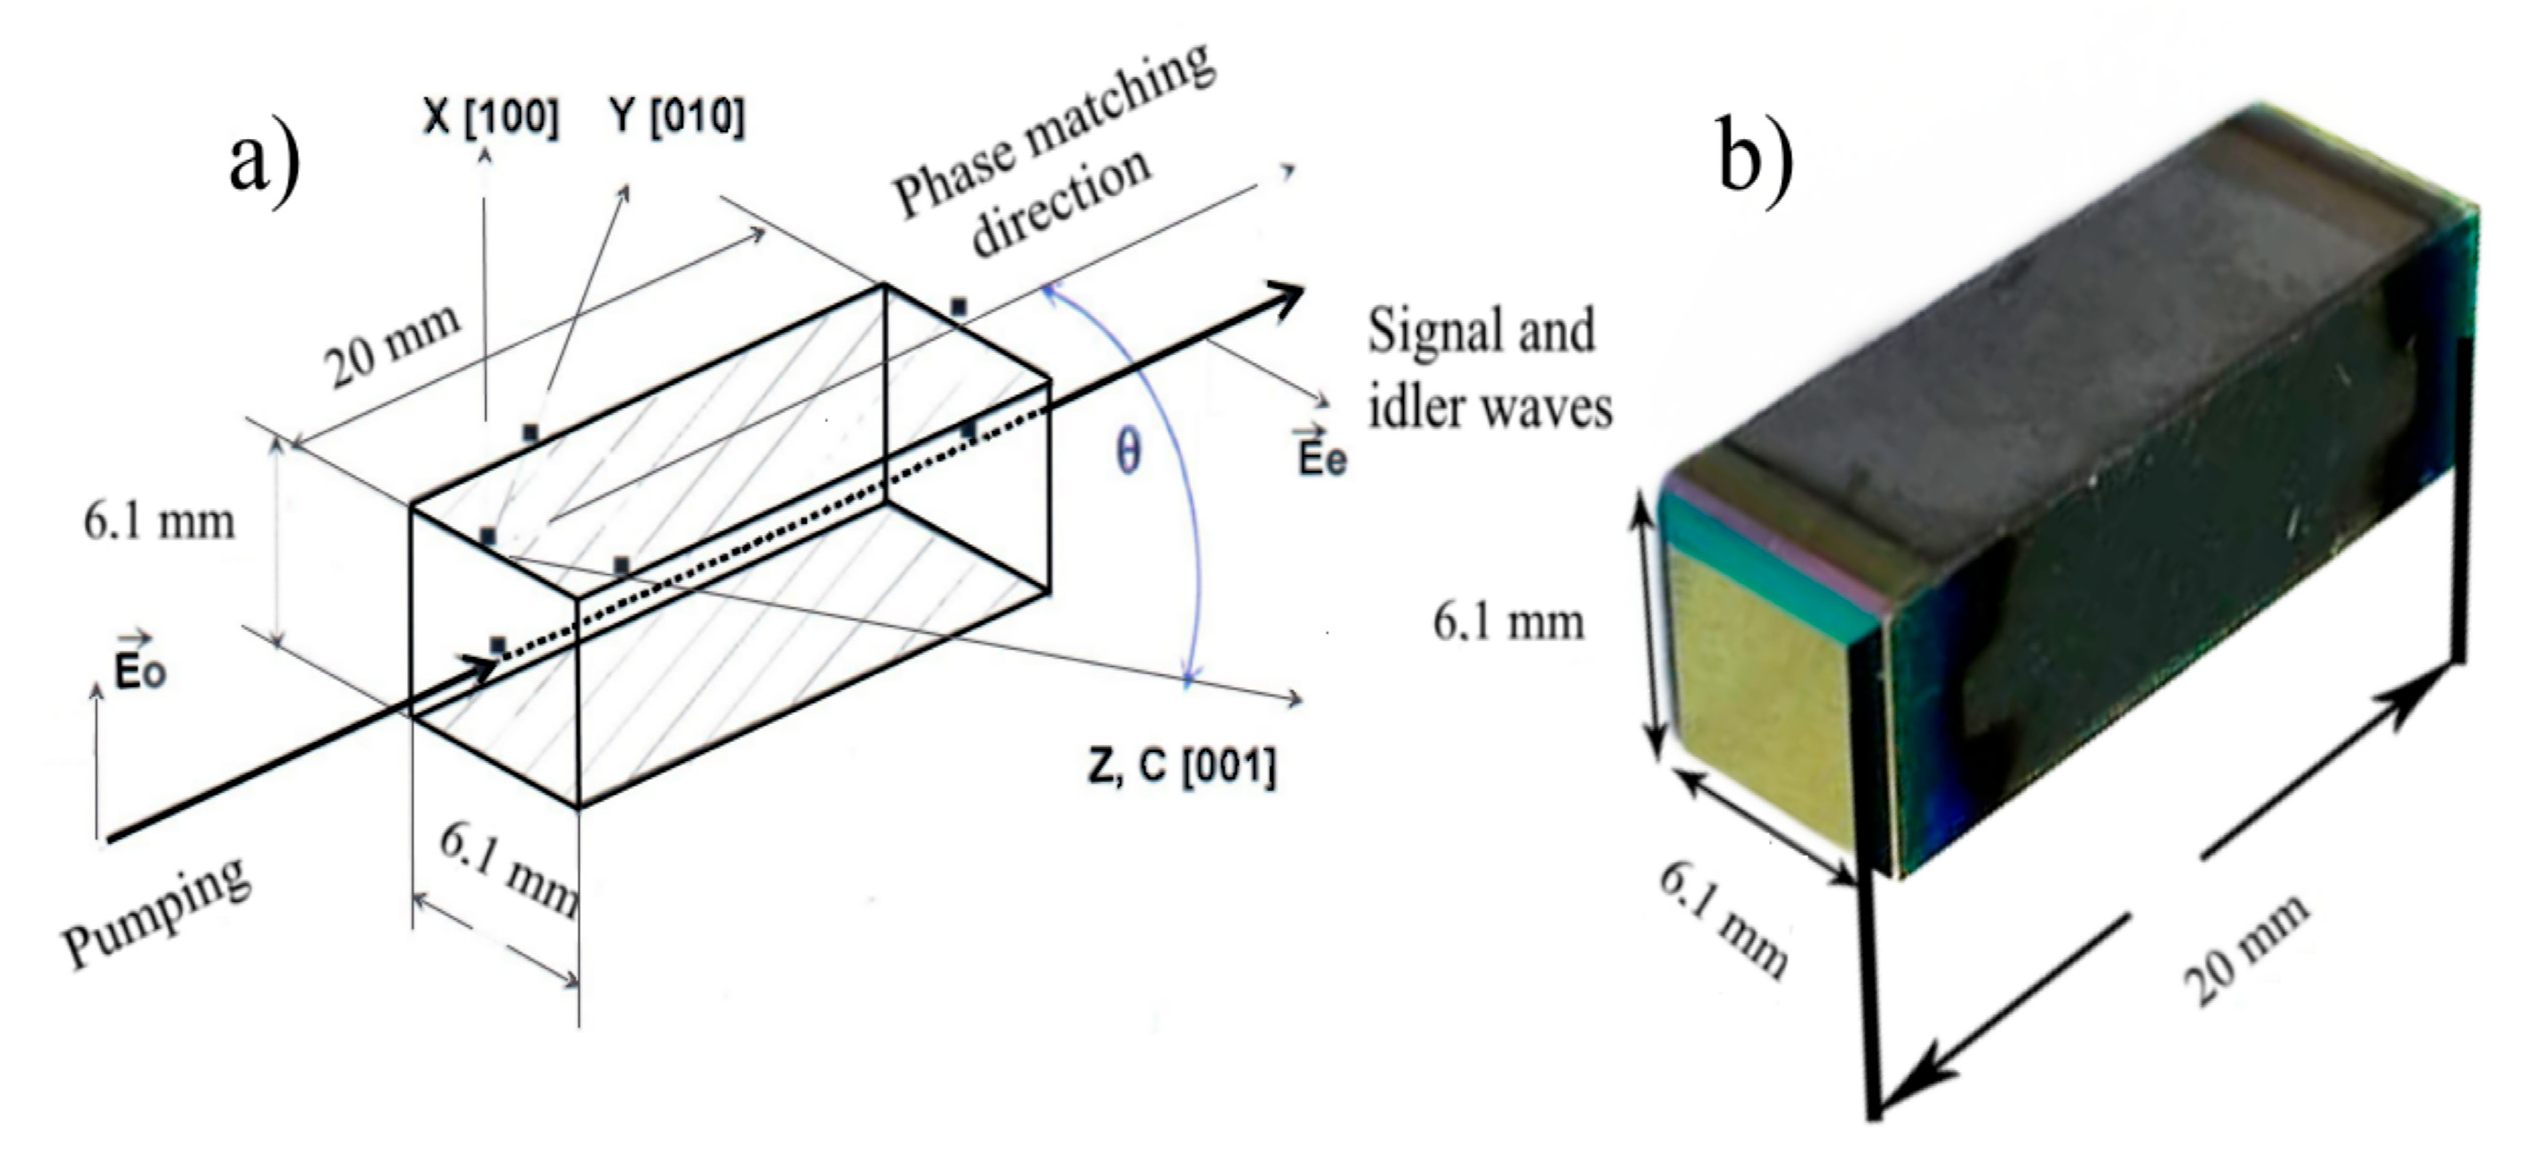
3. Investigated Samples and Their Parameters

For the research, 4 ZGP single crystal samples 6.1 × 6.1 × 20 mm3 in size were pre-pared. The investigated samples were cut at angles θ = 54.5° and φ = 0° from the same ZGP monocrystalline boule (LOC, Tomsk, Russian Federation) with regard to the optical axis (Figure 1). The scheme of the nonlinear crystals is shown in Figure 1. A two-temperature approach was applied in the primary synthesis of the polycrystalline compound [26]. The Bridgman method in the vertical direction on an oriented seed was utilized to grow the ZGP monocrystalline boule through the molten polycrystalline compound. After growth, the boule was annealed at a temperature of 600 °C. Before polishing, all 4 samples were irradiated by fast electrons under 5 MeV energy and 2.2 × 10¹⁷ electrons/cm2 flux density beam. The absorption of radiation for all samples was 0.03 cm−1, taking into account multiple reflection effects at a wavelength of 2.097 μm under room temperature conditions.
The ZGP raw material (boule) was tested using the X-ray method for phase composition. After that, 4 samples were cut on a STX-202AQ wet wire cutting machine (Kejing, Shaanxi, China), using a cutting speed of 0.4 mm/min, a diamond-coated wire with a diameter of 0.3 mm, and a rotation speed of the wire drum of 200 rpm.
The study was conducted on a MiniFlex 600 X-ray diffractometer (Rigaku, Tokyo Japan) with a copper anode tube at a wavelength of 1.541862 Å. The PDF 4+ database and the POWDER CELL 2.4 full-profile analysis program were used to analyze the phase composition. The scan was performed in the 3–60° angular range with 0.02° step. The sample for X-ray structural analysis was milled to a powder media.
The percentage content of the ZnGeP2 phases for all of the investigated samples was confirmed by X-ray analysis with crystal parameters a = 5.4706 Ǻ and c = 10.705 Ǻ detection.
Removal during grinding was 30 μm. Samples 2 and 3 were not subjected to conventional polishing. Conventional treatment of samples 1 and 4 was carried out on a 4-PD-200 lapping machine (SZOS, Minsk, Belarus). Under processing, the working surfaces were polished on a batiste polisher using diamond abrasive. The material removal was ~50 μm from each side. Further, samples 1 and 4 were additionally polished on a batiste polisher using diamond abrasive. Further, the samples were finished on a resin special polisher using diamond abrasive.
Further, samples 2–4 were treated by magnetorheological processing (MPO). MPO was realized on a 5D CNC machine (HMTI, Minsk, Belarus) using nonaqueous polishing magnetic media with nanodiamond abrasive. Two-stage MPO with working gap variation was used. On the machine, the samples were fixed in a holder made of fluoroplastic. The material removal from both polished sides using MPO was as follows: 150 μm for sample 2, 38.15 μm for sample 3, and 17.8 μm for sample 4.
The topography of all samples was registered on a MicroXAM-800 3D profiler (KLA-Tencor, Austin, TX, USA) using a Nikon 50× objective with 116 × 152 μm view. The VSI mode was used to diagnose the roughness parameters of ground surfaces, and the PSI phase mode was utilized for polished surfaces. The Rq, Ra, and Rz parameters were extracted under ref. [27] recommendations.
After the final polishing, dielectric coatings were deposited on the working sides of samples 1–4.
As this study is a logical continuation of ref. [24], for comparison of the results of this work with the previously completed work [24], we used the data obtained in ref. [24] and collectively represented them as sample 5. Sample 5 underwent conventional treatment and then MPO polishing. It should be noted that the MPO conditions for sample 5 completely coincided with the modes for samples 2–4. The amount of material removed from each working side of sample 5 was 9.5 μm. An interference coating was not applied to the surface of sample 5 for LIDT testing. It is necessary to take into account that samples 1–4 were cut from one boule and sample 5 from another.
Additionally, if we compare the LIDT of sample 1 in this work and the LIDT of a sample polished only using classical technology in ref. [24], we can see that the LIDT of the sample in ref. [24] was 2.7 J/cm2 and exceeded the LIDT of sample 1, which was equal to 2.08 J/cm2. Since the polishing parameters of sample 1 and the sample in ref. [24], polished using classical technology, were completely identical, differences in radiation resistance can be attributed to the different structural perfection of the single crystal. In connection with this, when analyzing the results obtained in this work and in ref. [24], it is necessary to take into account the different qualities of the structure of the tested samples.

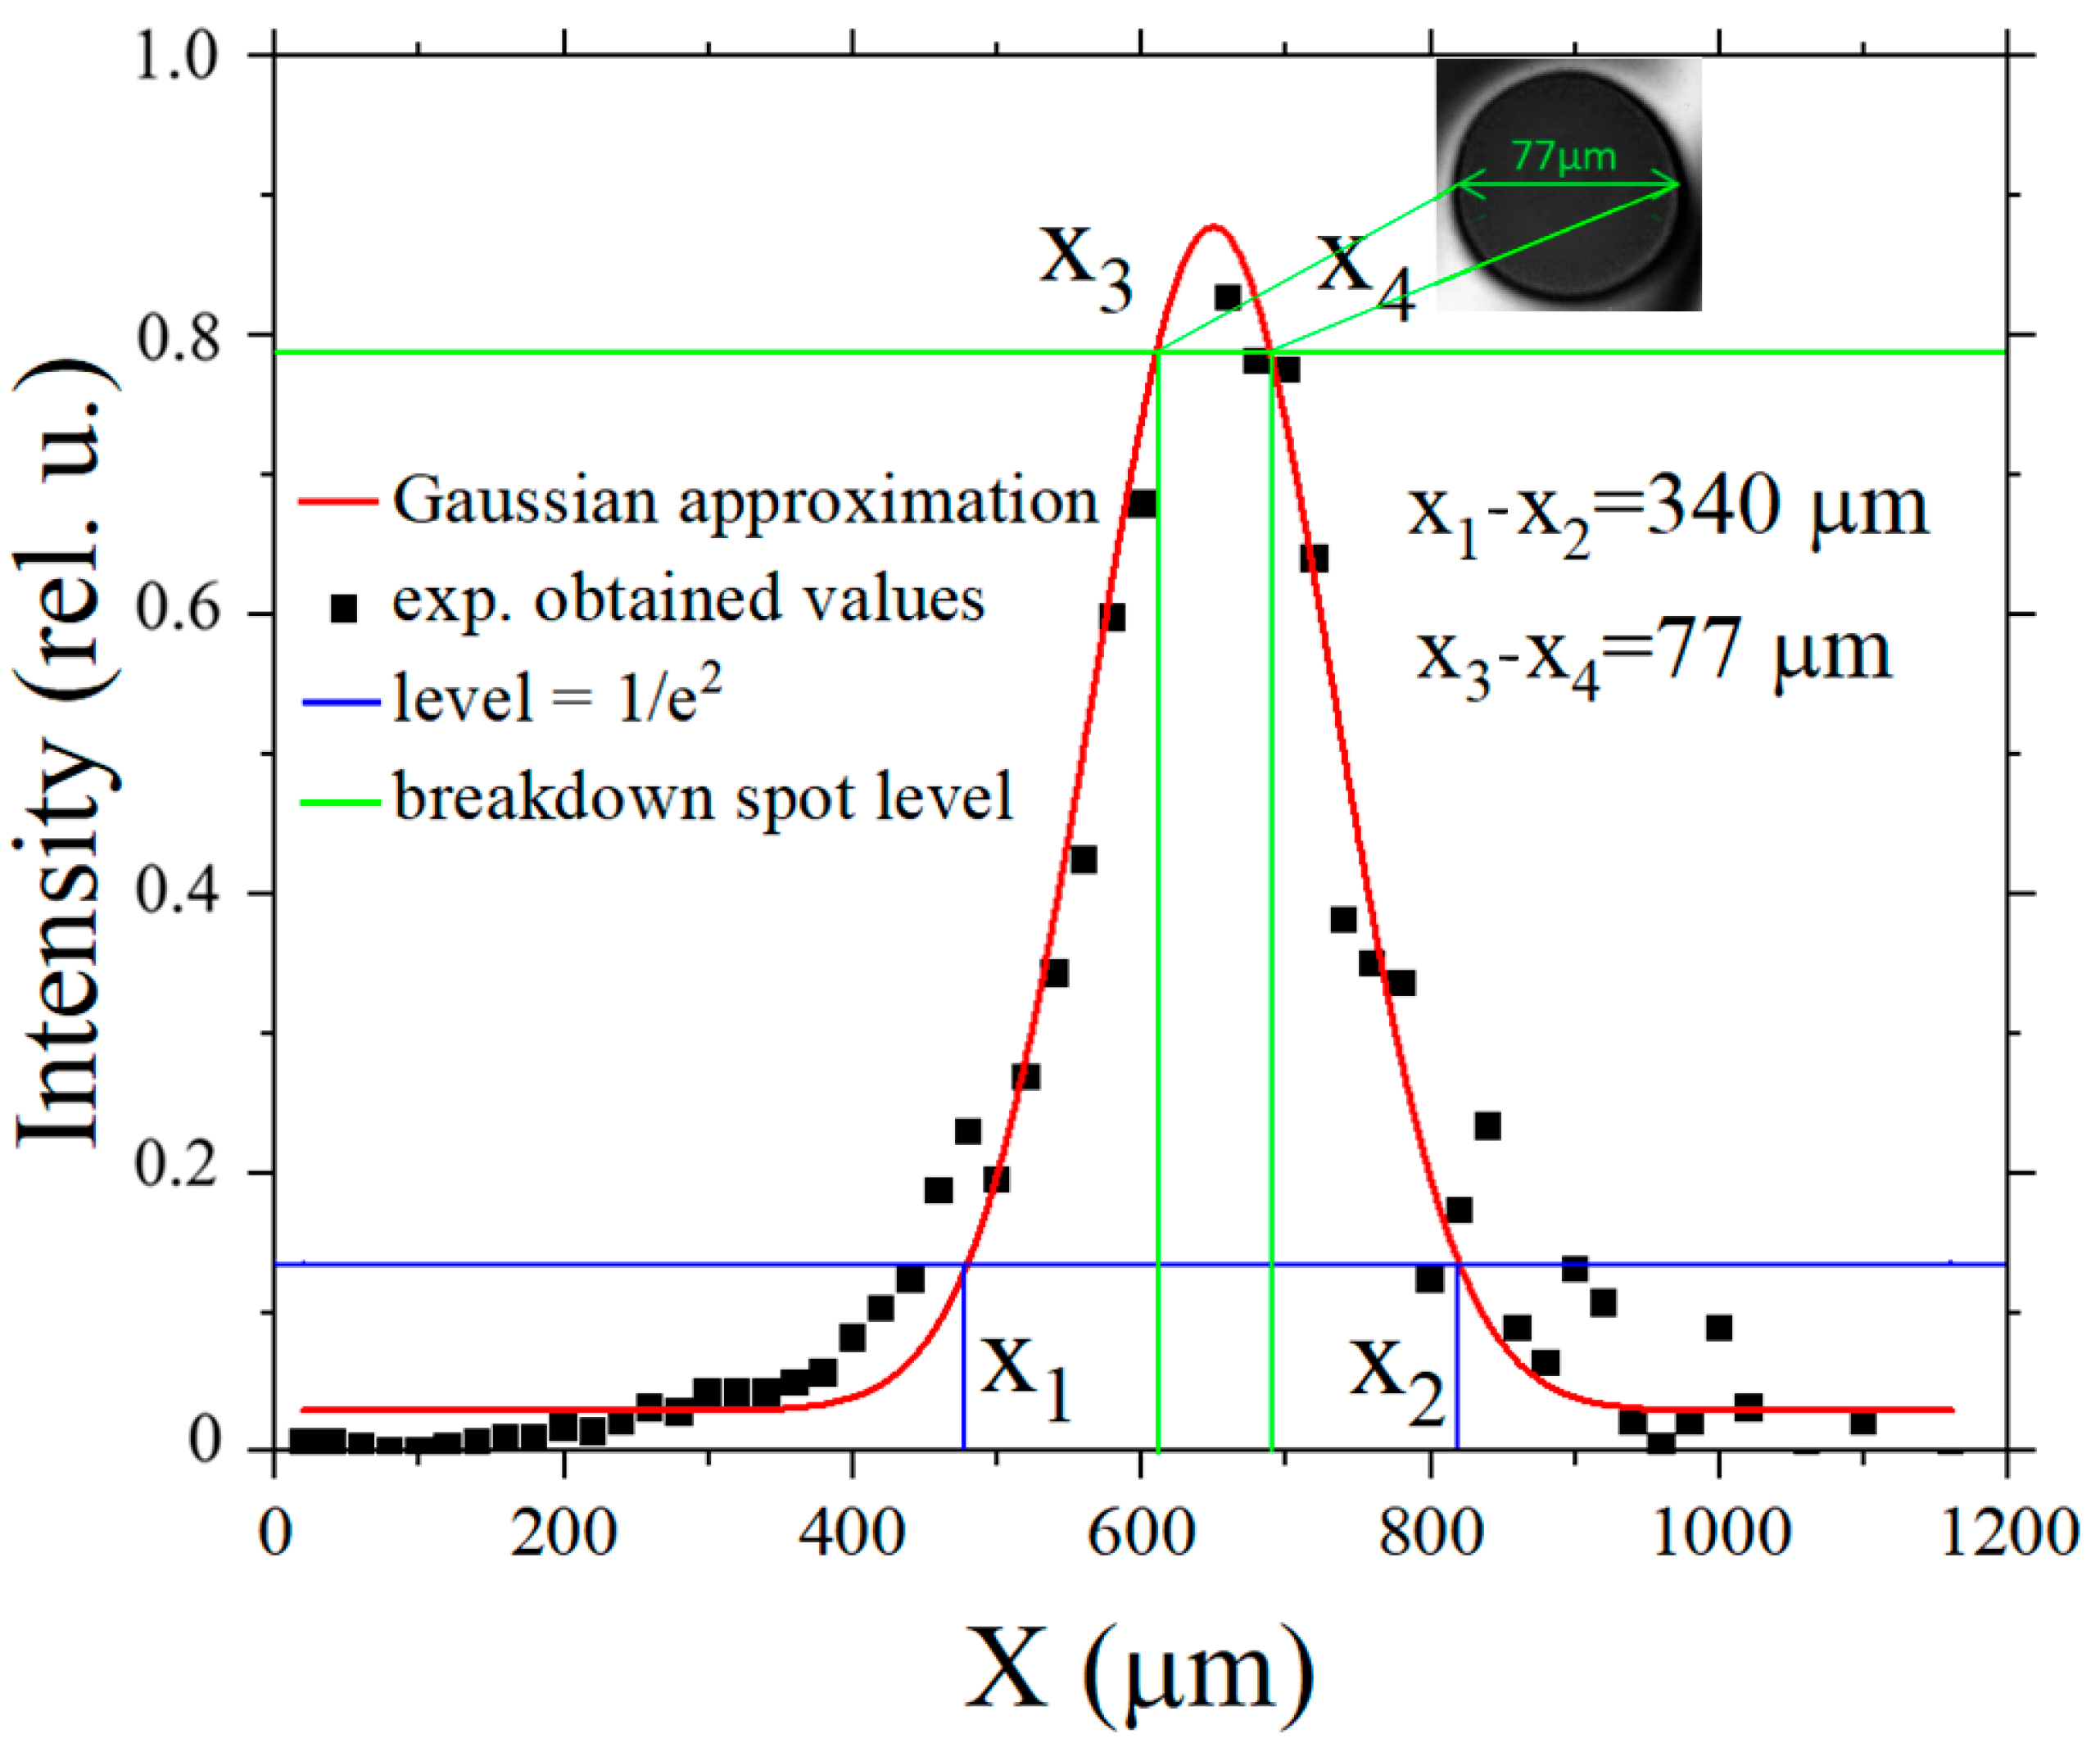
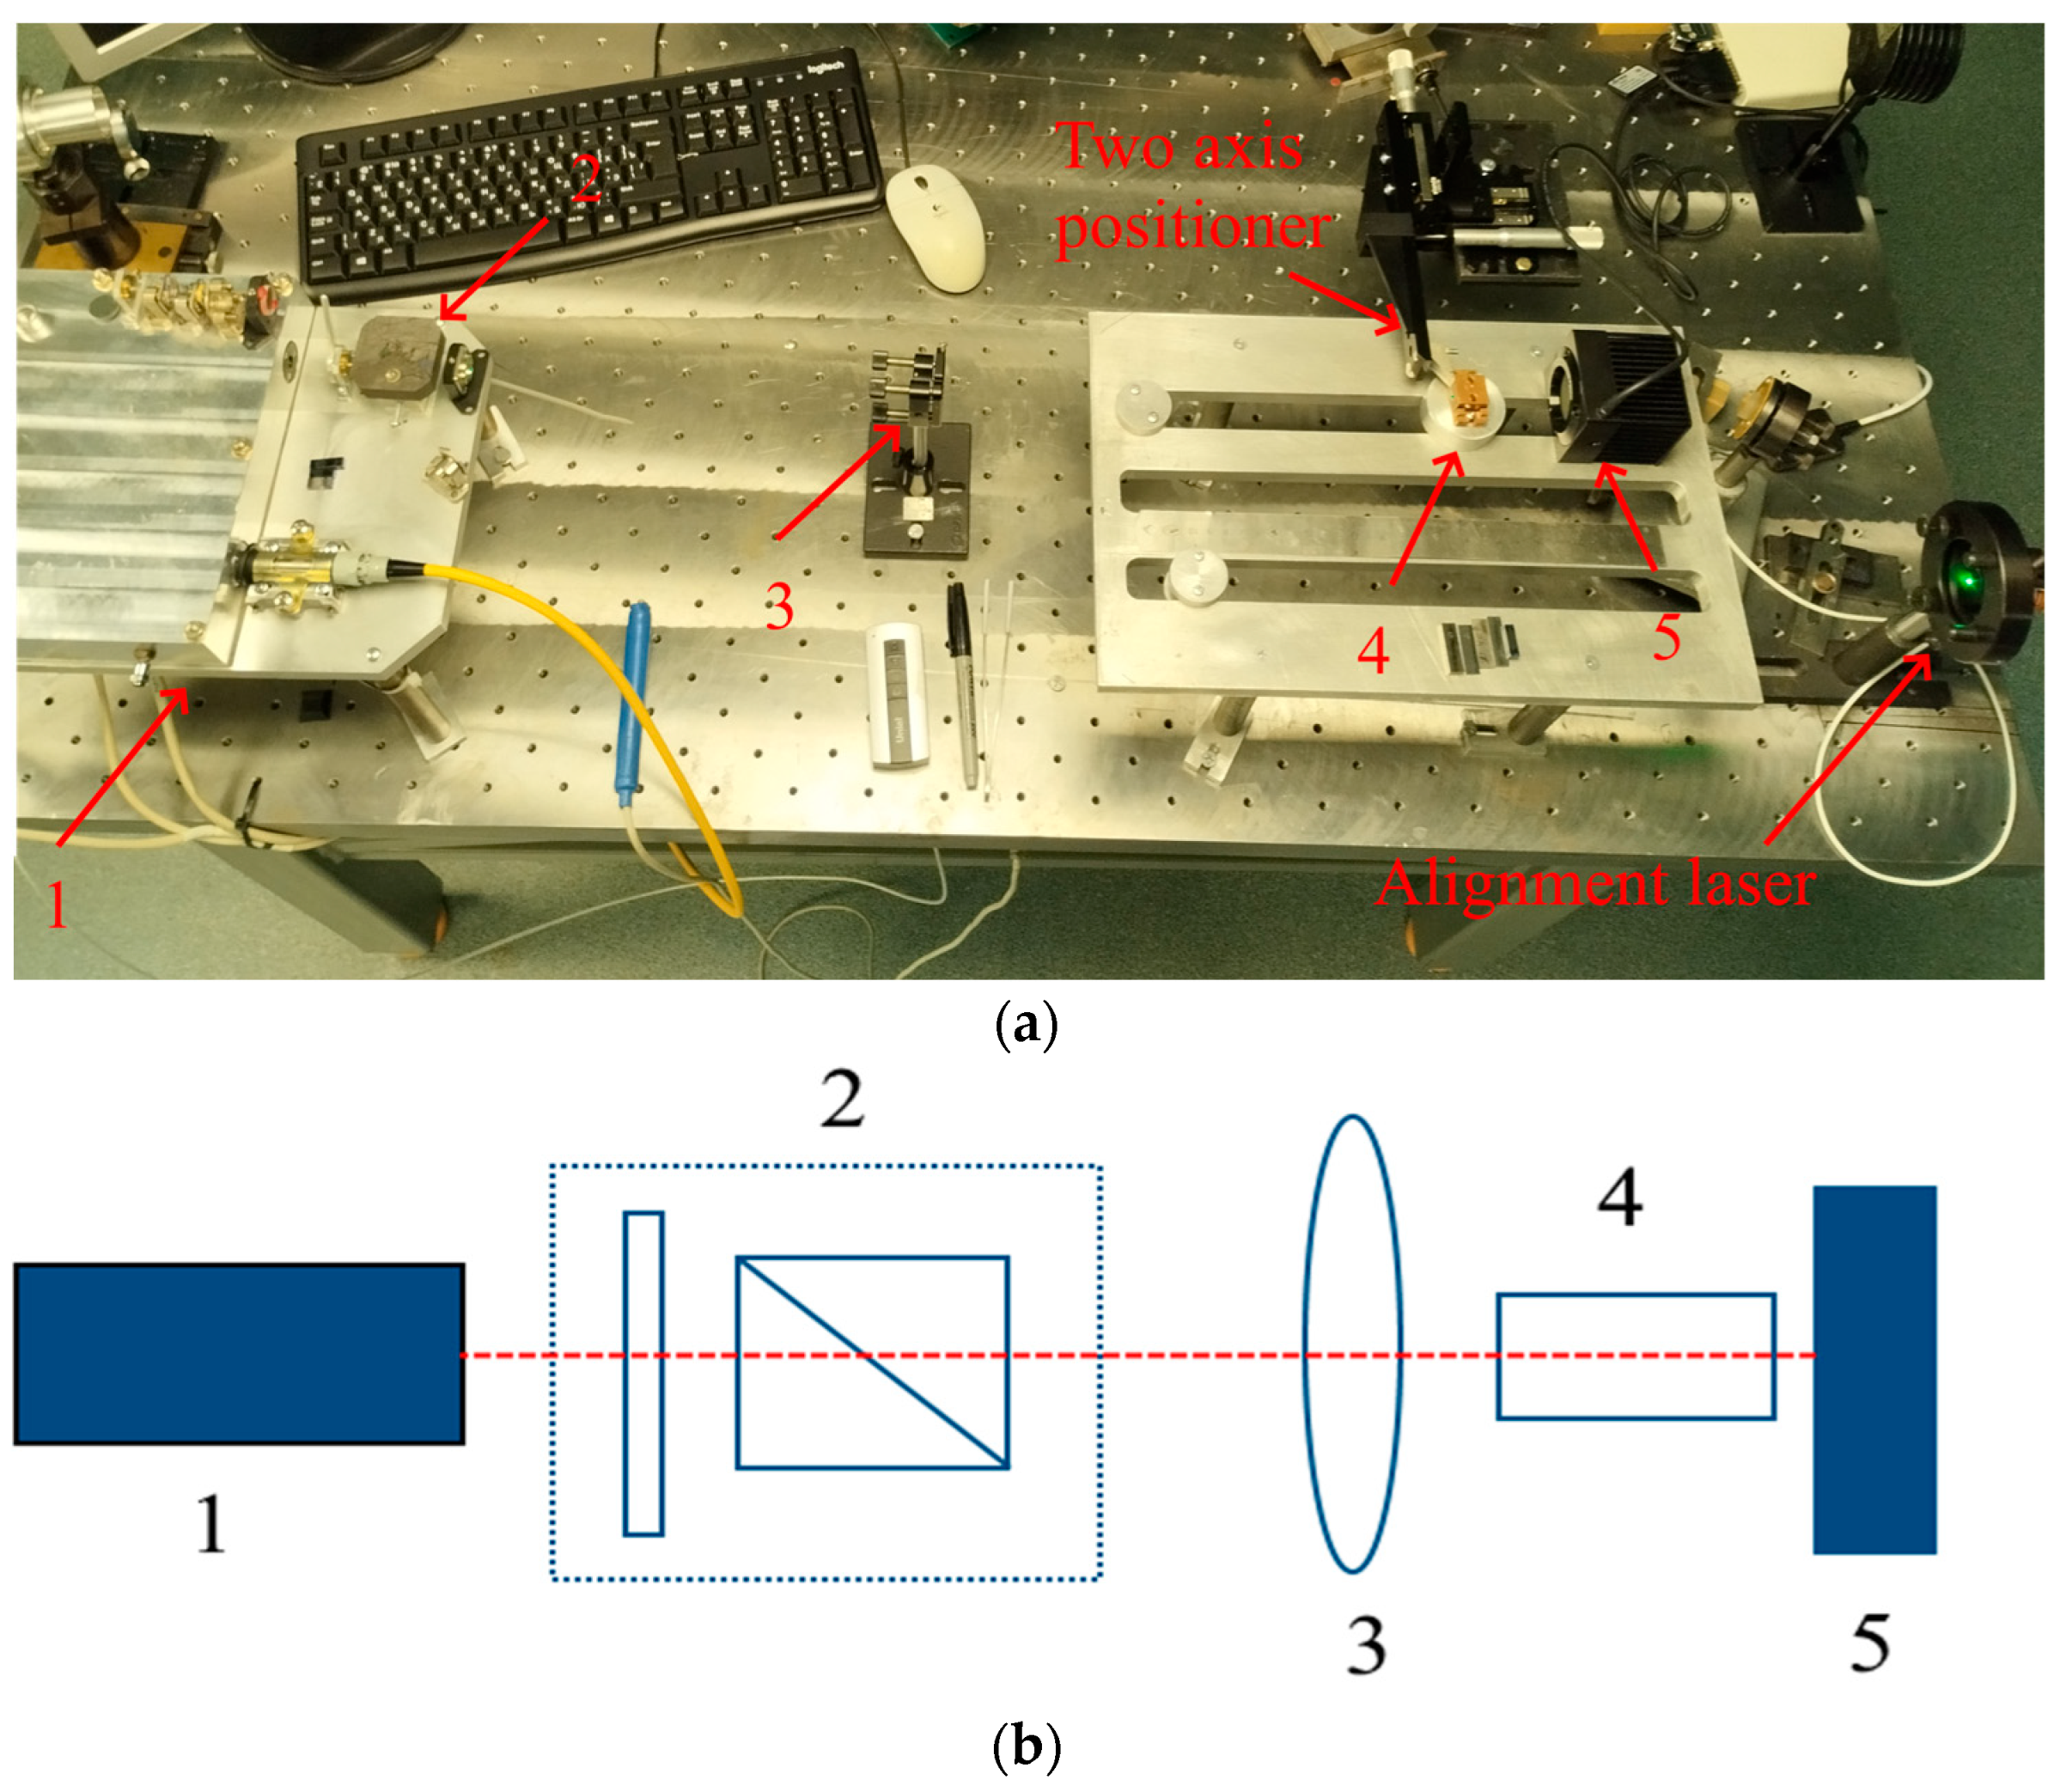
4. Parameters of the Setup and Methodology for Determining the LIDT of the Studied Samples

To study the LIDT, a Ho:YAG laser was used, which generated radiation at a wavelength of 2.097 µm with pumping by a continuous-wave thulium fiber laser. The Ho:YAG laser was operated in the mode of active Q-switching with a pulse duration of τ = 35 ns and a repetition rate of 10 kHz. The measured diameter of the laser beam at the input aperture of the studied samples was d = 340 ± 20 µm in all experiments at the 1/e2 level of maximum intensity. The maximum average power of the radiation generated by the Ho:YAG laser was 20 W in a linearly polarized Gaussian beam (M2 parameter ≤ 1.2). More detailed information about the setup and its parameters presented in Figure 2 is given in ref. [24].
According to the international standard ISO 21254, the effective area of a Gaussian beam is defined as S = πd2/4 [27]. The laser energy density was determined using the following Equation (1) [27]:
E = 8 Pav/(fπd2),
The laser power density was determined using the following Equation (2) [27]:
P = 8 Pav/(fτπd2),
where d is the diameter of the laser beam at the 1/e2 level, measured using the knife-edge method; f is the repetition rate of the pulses; and τ is the duration of the laser pulses.
To determine the LIDT of the samples, the “R-on-1” method [28], which has proven itself well in practice, was used.
For each series of measurements, after which optical breakdown was observed, the average value of the threshold energy density Wav and the root-mean-square error of its determination <ΔWav2> were calculated using the following formulas [28,29]:
W a v = W i n i N ,
< Δ W a v 2 > = ( < W a v > W i ) 2 n i N ( N 1 ) ,
where N is the total number of damaged areas, Wi is the threshold energy density value in one of the irradiated areas, and ni is the number of areas with an LIDT of Wi.
To find the confidence interval of the LIDT (WD) value [28,29], the following equation was used:
WD = Wav ± k<ΔWav2>1/2,
where k is the Student’s t coefficient, and the Student’s t distribution was used for the confidence probability [28,29].
F k , N = Γ ( N 2 ) π N 1 Γ ( N 1 ) 2 k k ( 1 + z 2 N 1 ) N / 2 d z ,
where Г is the gamma function.

5. Experimental Results and Discussion

A set of 2D holograms for the internal volume of the studied samples was obtained using a DHC-1064 digital holographic camera (manufactured by LLC “LOC”, Russian Federation) (an example of a restored multiple holographic image is shown in Figure 3). The obtained digital 2D holograms were restored into a single multiple hologram in order to characterize the 3D volumetric defects. The resolution of the method was 3 μm according to ref. [30]. In all 4 samples used in this work, no volumetric defects were visualized.
The results of the roughness measurements of the samples are presented in Table 1 and Figure 4. (In Figure 4, the roughness profiles of sample 2 before and after MPO are presented as an example.). The values were obtained by 1040 profiles averaging 1360 points each. The standard deviation was 0.01 nm for Ra and Rq and 0.05 nm for Rz.
Based on the results presented in Table 1, it can be seen that MPO was able to reduce the surface roughness level by more than 3 orders of magnitude when magnetic rheological polishing of the samples was performed immediately after grinding. This makes it possible to exclude the technological operations of polishing, fine polishing, and finishing. Accordingly, the equipment for performing these operations would not be used, which can significantly reduce the number of technological operations required to obtain an angstrom level of surface roughness of the element.
Figure 5 and Figure 6 and Table 2 show the results of the study of the LIDT of ZGP using the R-on-1 method. Table 2 shows the values of the energy density ( W 0 d E ) and power density ( W 0 d P ) at a probability of optical breakdown of 0, the average values of the energy density ( W D E ) and power density ( W D P ) with the measurement error, the Student’s t coefficient (k) at a confidence probability of 0.98, and the number of measurements (N).
Based on the data presented in Figure 4 and Figure 5, as well as in Table 2, it can be established that the depth of MPO polishing significantly affects the LIDT of the ZGP crystal. With a material removal depth of more than 30 µm, a significant decrease in the LIDT of the ZGP surface was observed. In addition, with a depth of MPO polishing from 30 µm to 17.8 µm, an increase in the LIDT was observed compared to the ZGP crystal with standard polishing. At the same time, in ref. [24], MPO polishing with a depth of 9.5 µm did not lead to an increase in the LIDT compared to classical polishing.
The approximating lines in Figure 5, corresponding to the optical breakdown of samples after different surface treatments, converge at a probability of optical breakdown of 1 in approximately one point at about 3.5 J/cm2. This may suggest that there is an optical strength limit of the material, which is determined by volumetric defects and the perfection of the crystal lattice, which can be achieved by a surface treatment that excludes the formation of surface defects that reduce the surface radiation resistance.
The dependence of the LIDT on the depth of MPO polishing is shown in Figure 7.
Using the available experimental data and Excel mathematical software, the logarithmic dependence of the LIDT value on the depth of MPO polishing of the surfaces of ZGP crystals was obtained. The dependencies of the average values of the breakdown power density for each sample and the LIDT by power density on the depth of MPO polishing, obtained by the least squares method, were smooth monotonically decreasing logarithmic functions:
W D P z = 7.406 ln z + 107.52 ,
W o d P z = 17.34 ln z + 120.23
The coefficients of determination of the approximation for the average values of the breakdown power density and the LIDT were R2 = 0.9926 and R2 = 0.9982, respectively.
In ref. [31], studies were conducted to determine the effect of the depth of material removal during MPO polishing of fused silica (Corning 7980) on the LIDT. The samples were processed with an aqueous polishing slurry using cerium oxide CeO2 particles with a dispersion of ~0.2 µm. In addition to determining the LIDT in ref. [31], the concentration of absorbing centers on the polished surfaces of the samples was determined using photo-thermal common path interferometry (PCI). Thus, in ref. [31], the following fact was established: with an increase in the depth of material removal during MPO polishing, an increase in the concentration of surface absorbing centers was observed, which led to a decrease in the LIDT.
Thus, if we assume that, as in ref. [31], the density of absorbing centers on the surface of the crystal increases with increasing MPO removal depth when analyzing the approximations obtained in this work, then the obtained logarithmic dependencies obviously indicate the thermal nature of optical breakdown. Since, in general, the absorption of radiation in a material is determined by an exponential function of the exponent according to Lambert–Beer’s law (I = I0 × e−αx), and the logarithmic function is the inverse of the exponential function, it can be assumed that the obtained approximations indicate a direct dependence of the LIDT of ZGP during MPO polishing on the magnitude of local absorption at surface defects either generated during MPO polishing or “exposed” bulk defects that come to the surface during polishing.
Based on the results obtained, it can be assumed that MPO processing can affect the density of surface defects. There is an optimal depth of removal of~several microns at which the density of surface defects decreases, and with an increase in the depth of polishing relative to the optimal depth, new absorbing defects are introduced, contributing to a decrease in the LIDT. A similar effect was observed in ref. [31] for MPO polishing of fused silica; when the depth of material removal was more than 2 µm, the LIDT decreased. At the same time, in the work in ref. [31], the surface roughness RMS was a half order of magnitude greater than that of our MPO processing and was 1.11–1.19 nm.
Figure 8 shows the results of measuring the diameter of the laser beam using a Foucault knife, which acted on the surface of ZGP during the determination of the LIDT of experimental samples.
To compare the diameter of the laser beam and the size of the characteristic surface damage of ZGP, the results of measuring the diameter of the beam using a Foucault knife and the diameter of the breakdown spot obtained from the analysis of images obtained in microinterferometry mode with the MicroXAM-800 profilometer (KLA-Tencor, Austin, TX, USA) are presented in Figure 8. It can be seen that, due to the Gaussian shape of the laser beam intensity profile, material destruction occurred due to the intensity concentrated in the central part of the beam (the diameter of the crater on the surface of the sample was 77 µm with a laser beam diameter of 340 µm at the 1/e2 level).
Figure 9 shows a generalized dependence of the values of removal, roughness parameters, and damageability of samples 1–4. Above the values of the depth of removal for each sample, the values of surface roughness parameter Ra are given.
As can be seen from Figure 9, when comparing the polishing results of samples 1 and 3, replacing traditional polishing of the sample on a resin polisher after grinding with MPO polishing with a comparable depth of material removal (50 μm was removed during classical polishing of sample 1, 38 μm was removed during polishing of sample 3 using MPO polishing), approximately the same LIDT values were observed. This indicates that it is possible to completely replace the stage of classical polishing with finishing on a resin polisher with MPO polishing, in principle, since no decrease in the LIDT was observed and the surface roughness values were reduced by 1.3 times.
Analysis of the data obtained for sample 2 showed a multiple increase in the depth of material removal during MPO polishing, with 150 μm removed from the surface immediately after grinding, which led to a decrease in the LIDT by 1.6 times compared to standard material removal of ~50 μm for sample 1.
The use of MPO after traditional polishing with a removal of 17.8 μm for sample 4 increased the LIDT of sample 4 by 1.18 times compared to that of sample 1.
When analyzing the data on the LIDT of all samples studied, we can see the following pattern regardless of whether preliminary polishing was performed by the classical method before MPO polishing: with a decrease in the depth of MPO polishing to less than 40 μm, an increase in the LIDT is observed compared to samples that have not undergone MPO polishing.
The experimental dependencies indicate that, in practice, taking into account the productivity and efficiency of using MRO when processing ZGP crystals, it is recommended to remove not more than 20 μm. In the future, it is advisable to study in more detail changes in the LIDT for the range of removal from 0 to 20 μm during MRO.
It is clear from the presented results that the use of MPO for polishing ZGP crystals can improve the LIDT and reduce surface roughness under certain polishing process conditions.

6. Conclusions

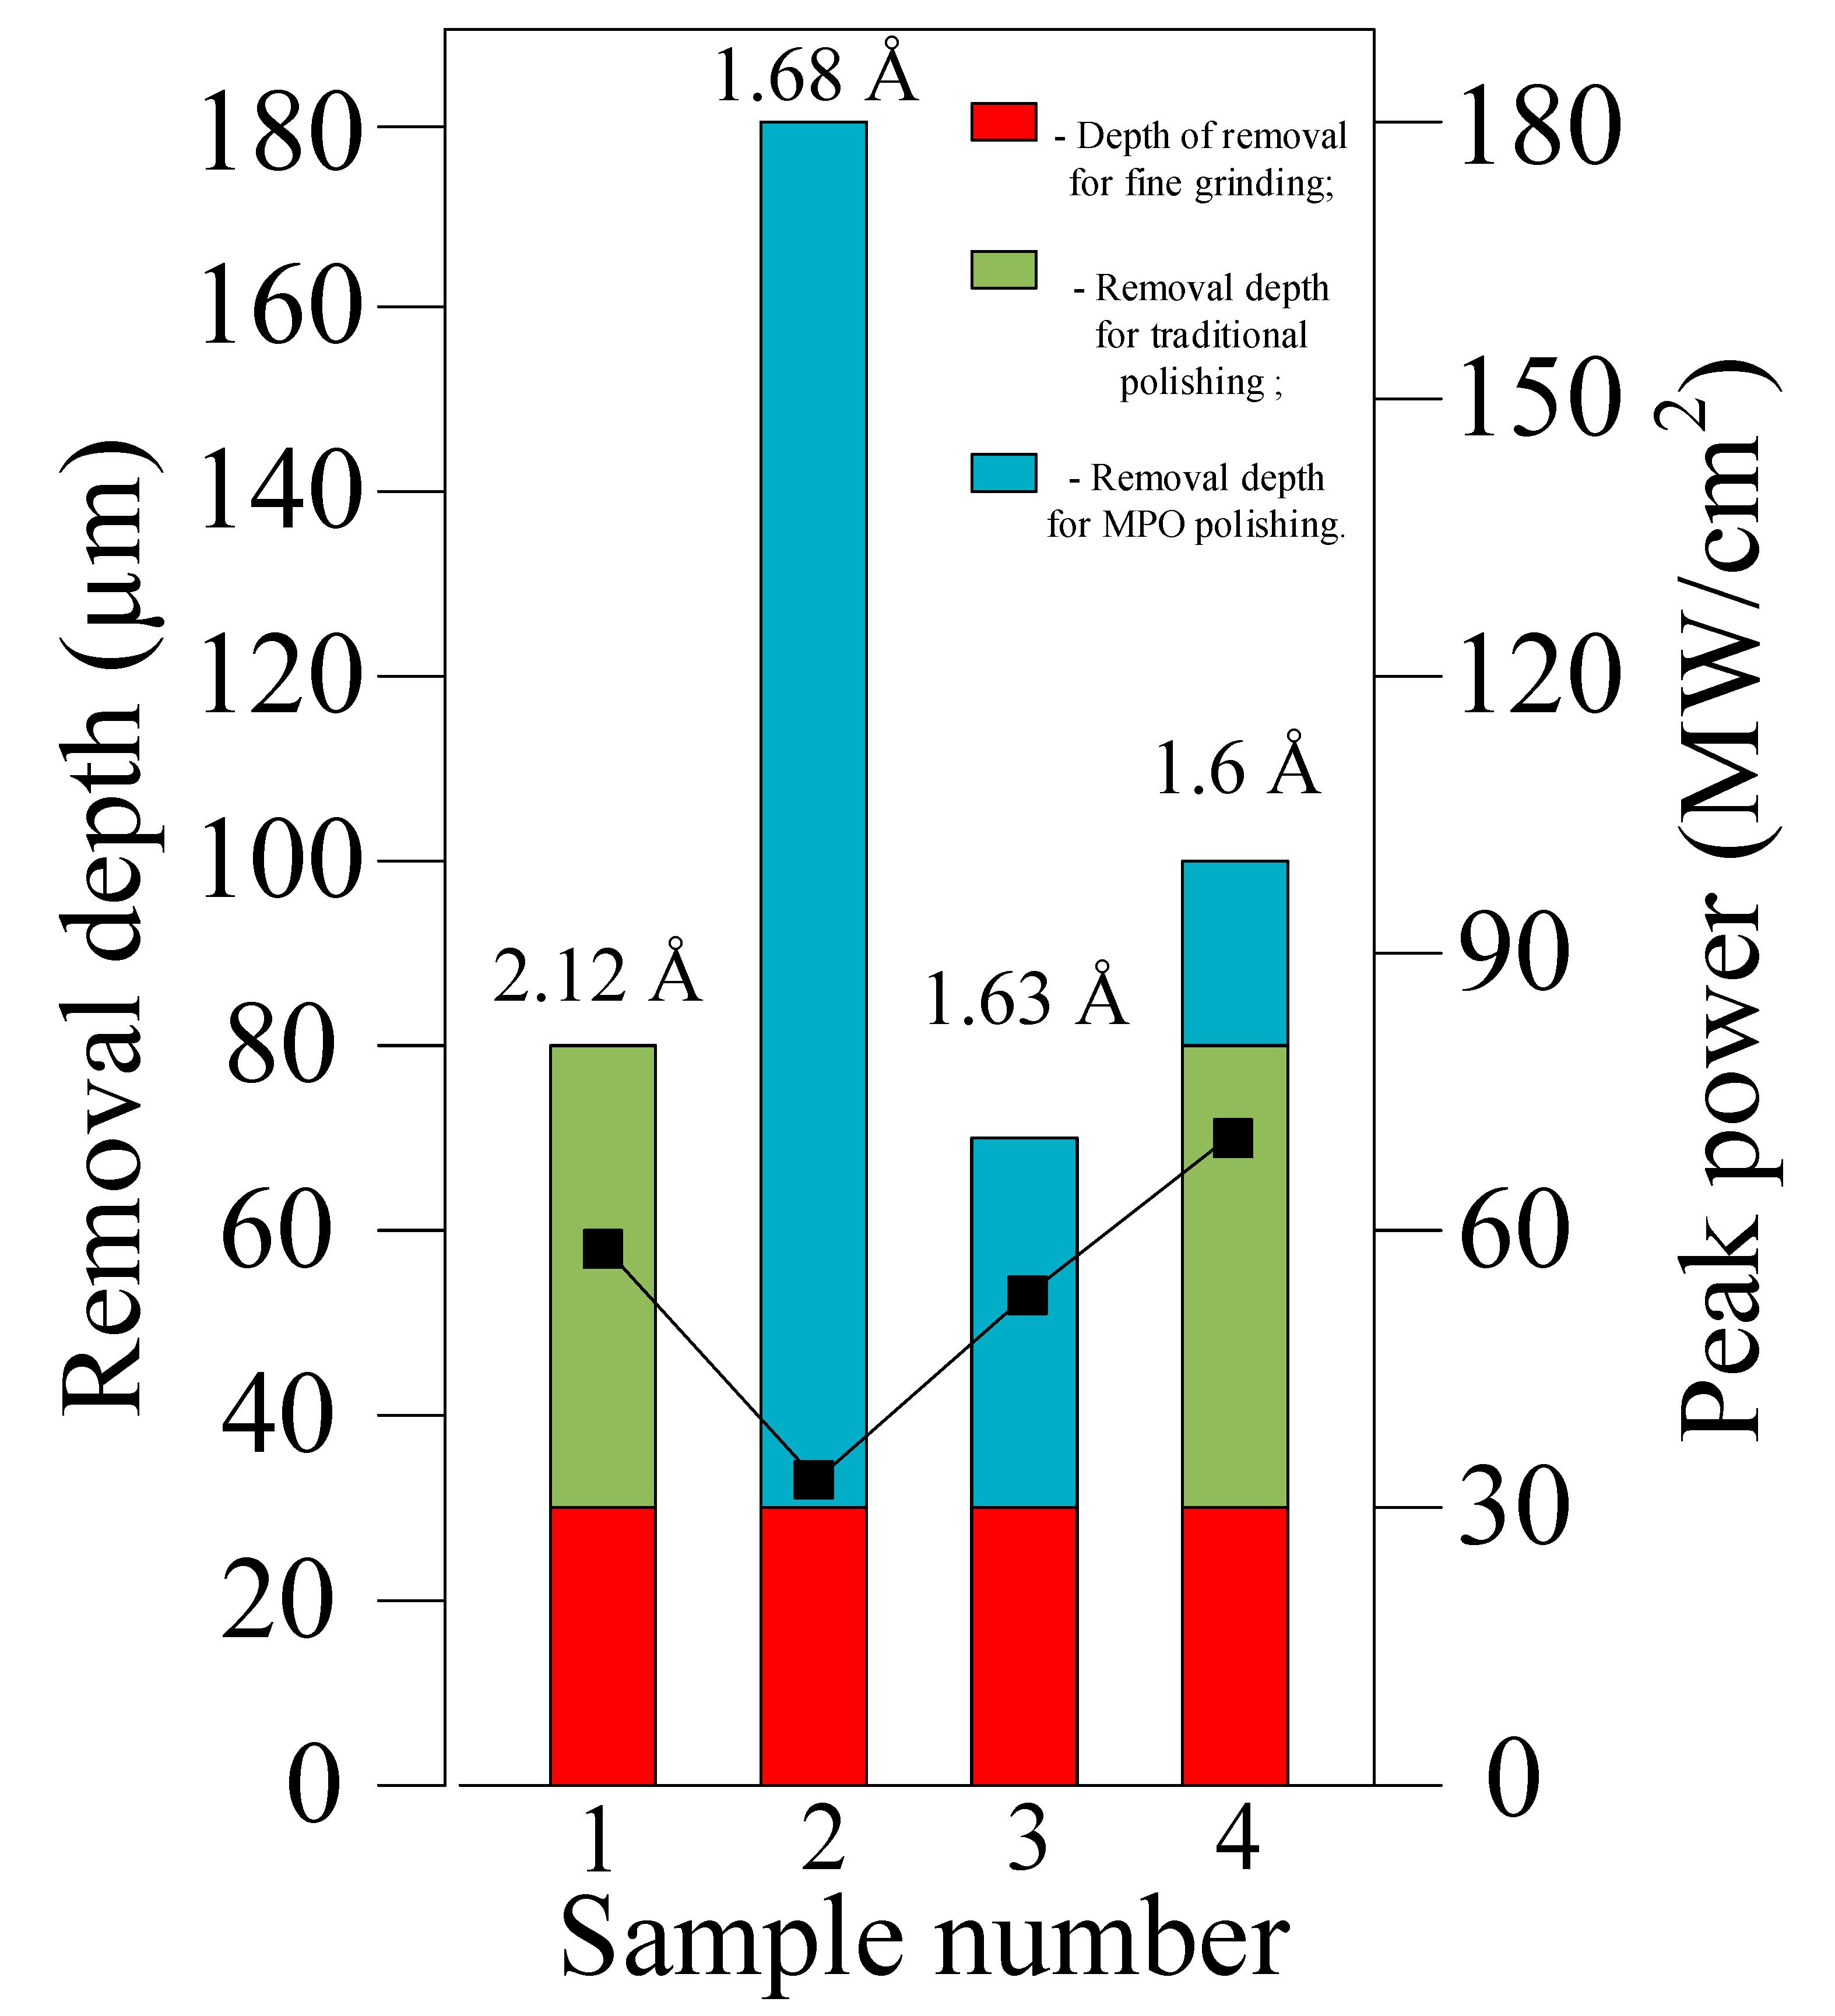
  • A comprehensive assessment of the influence of various parameters on the magnitude of optical breakdown was carried out during deep removal (up to 150 μm) from the surface of a ZGP single crystal by magnetic rheological polishing.
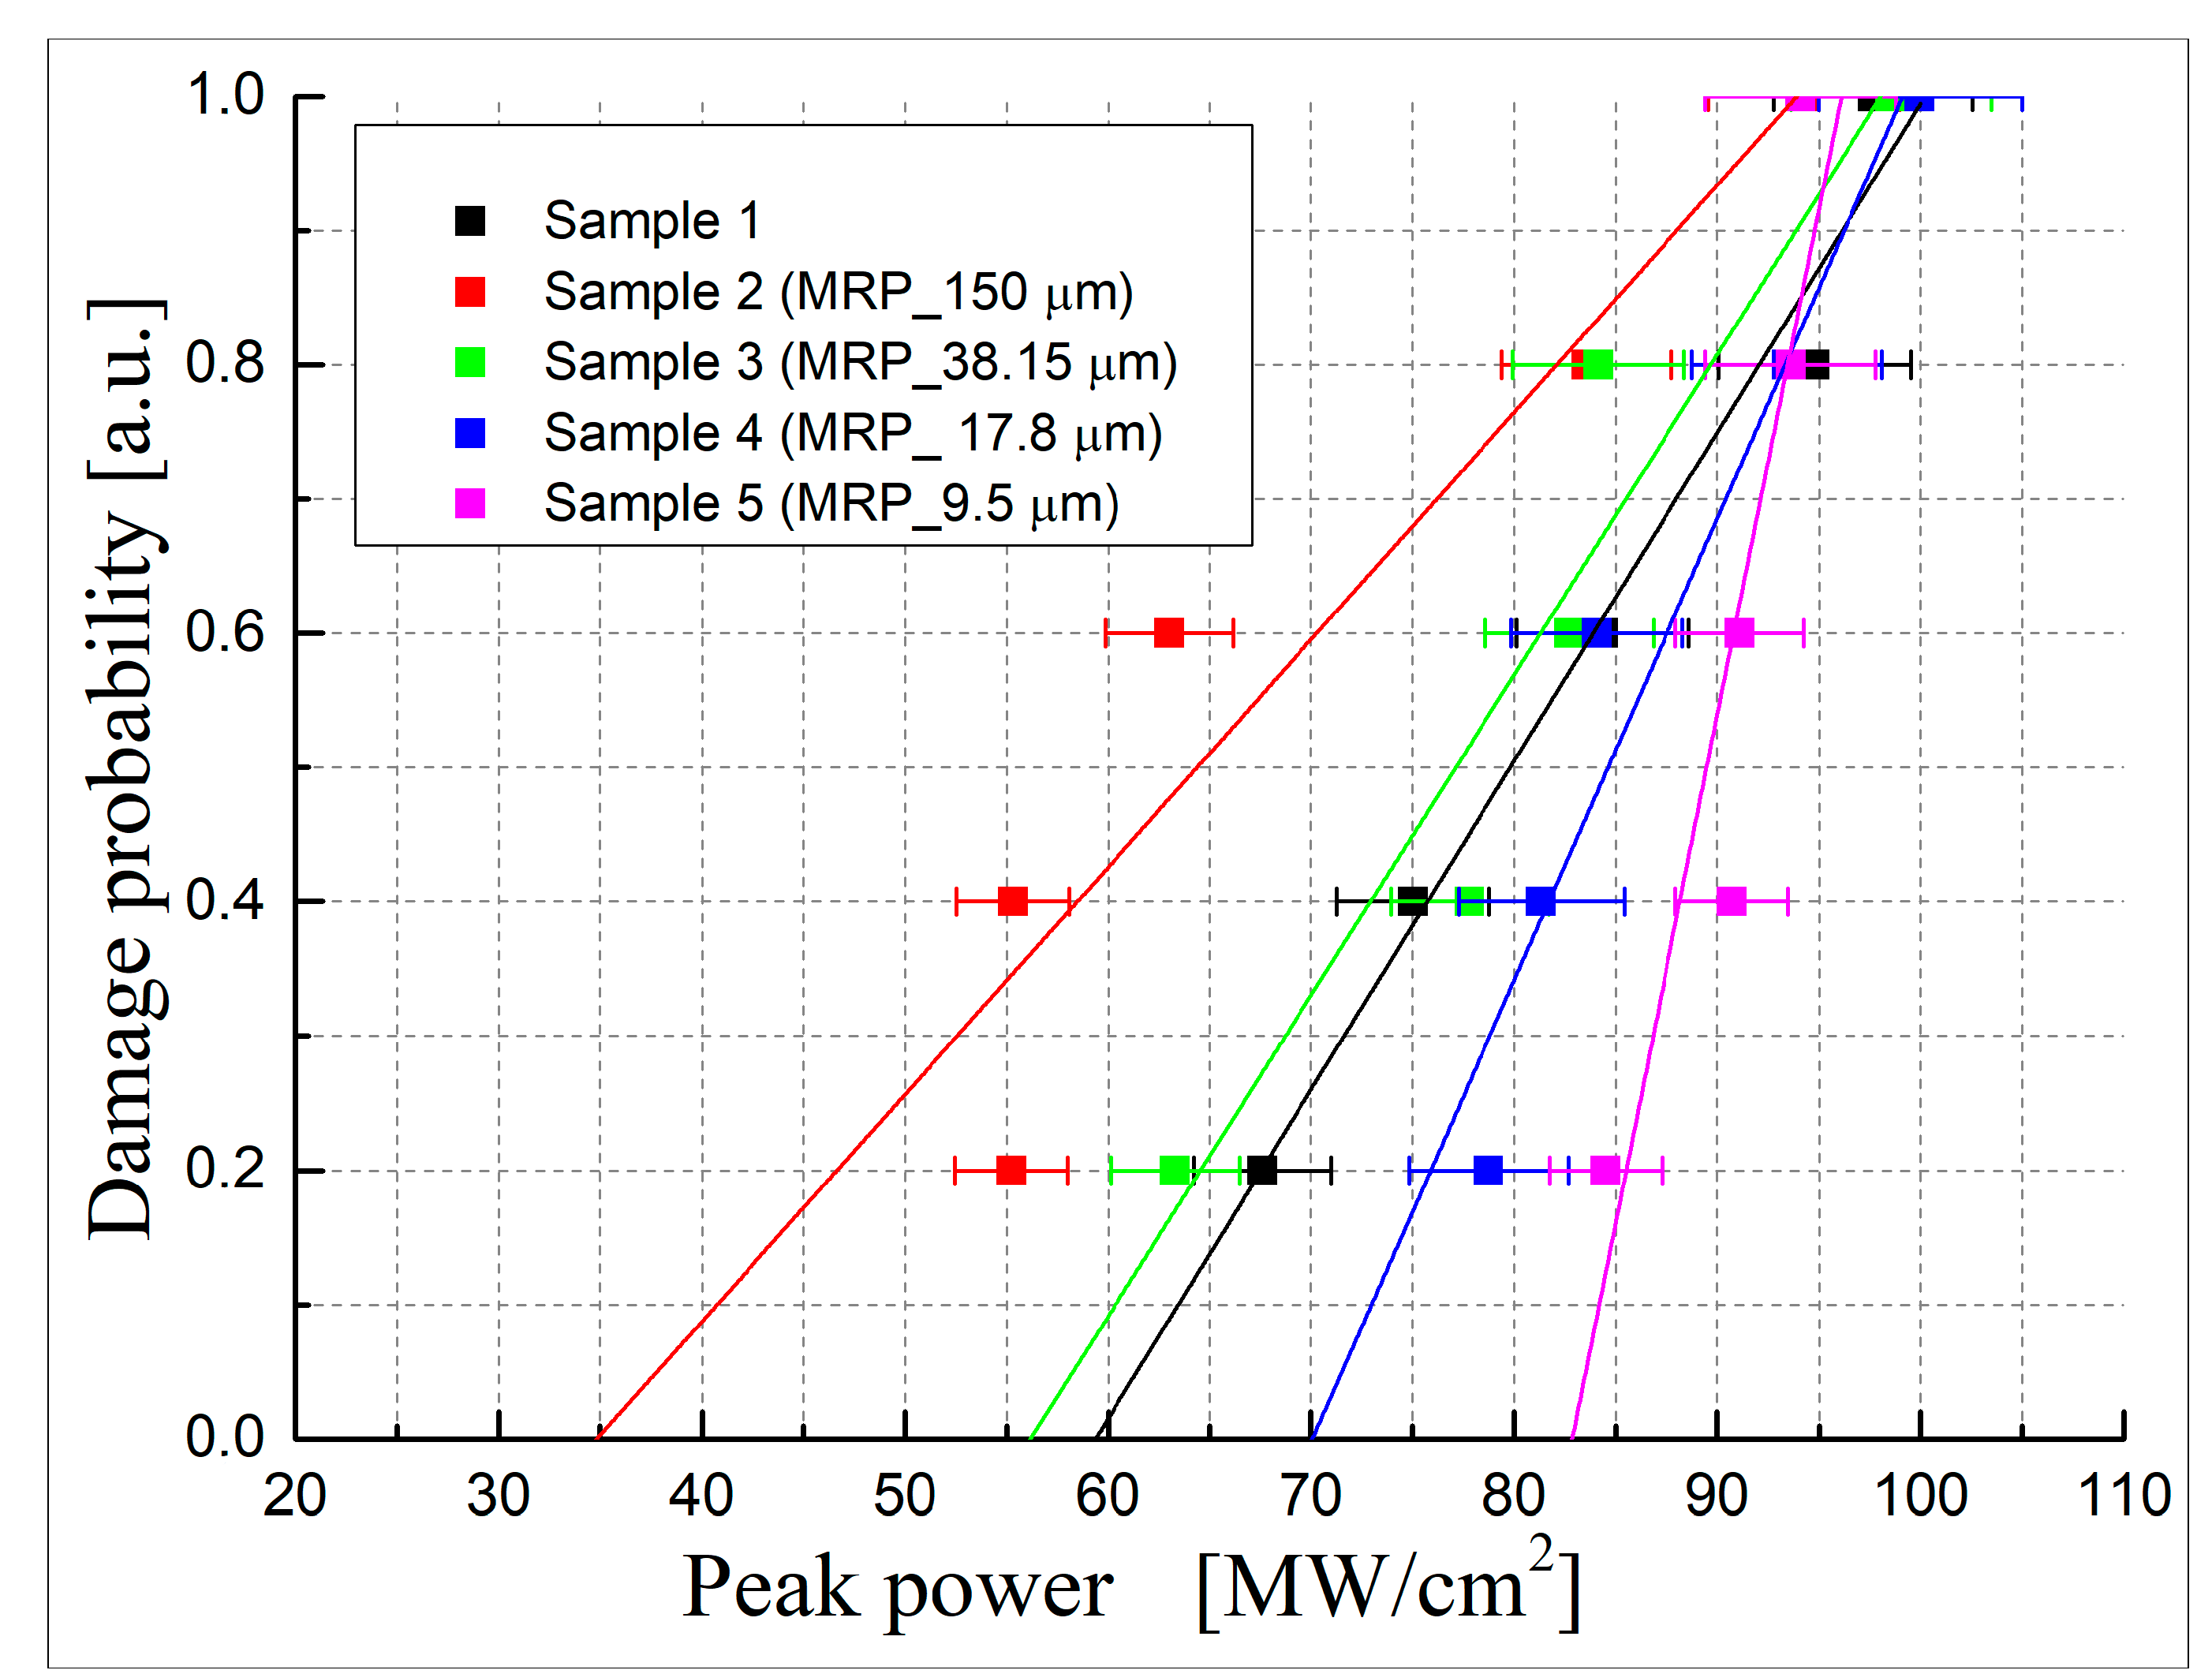
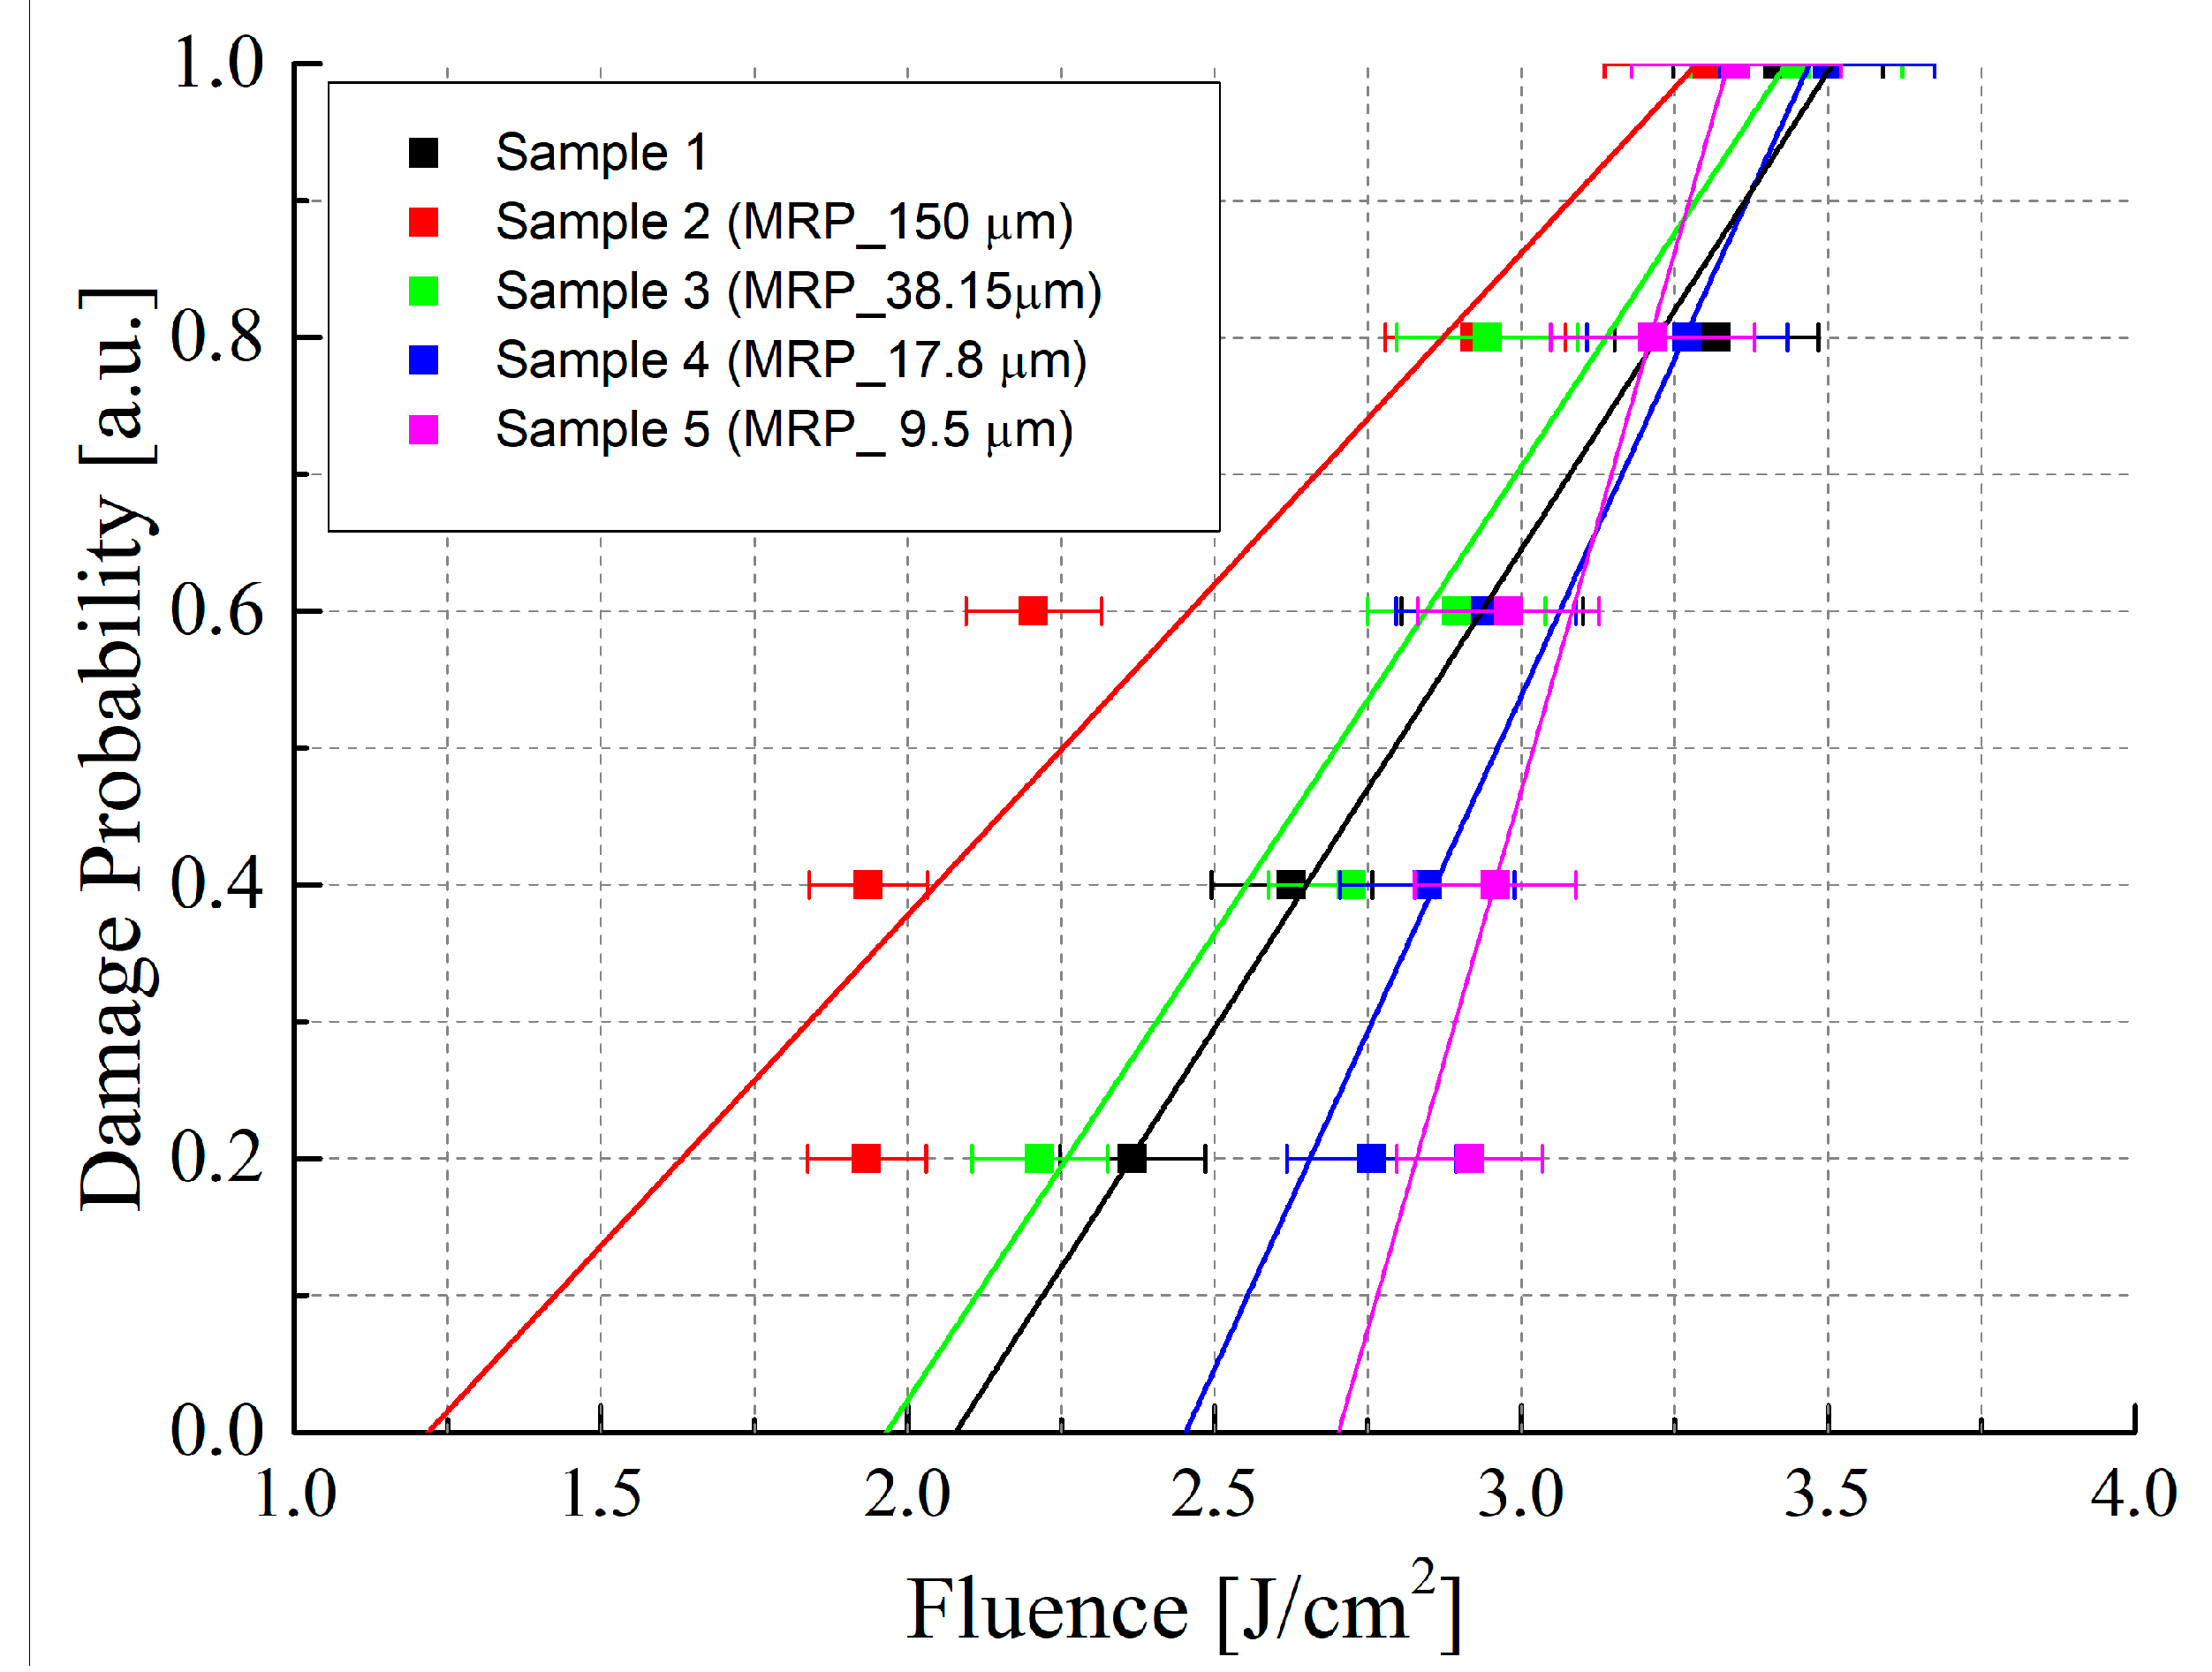
  • Experimental studies of the influence of MPO polishing parameters on the LIDT of ZGP crystals were carried out. It was shown that the depth of MPO polishing has a significant effect on the LIDT of a ZGP crystal. With MPO removal of material from the surface of the crystal of more than 30 μm, a significant decrease in the LIDT of the ZGP surface was observed, whereas for the depth of MPO polishing of 17.8 μm, an increase in the LIDT was observed compared to a ZGP crystal with standard polishing. With a depth of material removal of 17.8 μm, the LIDT increased by 1.18 times.
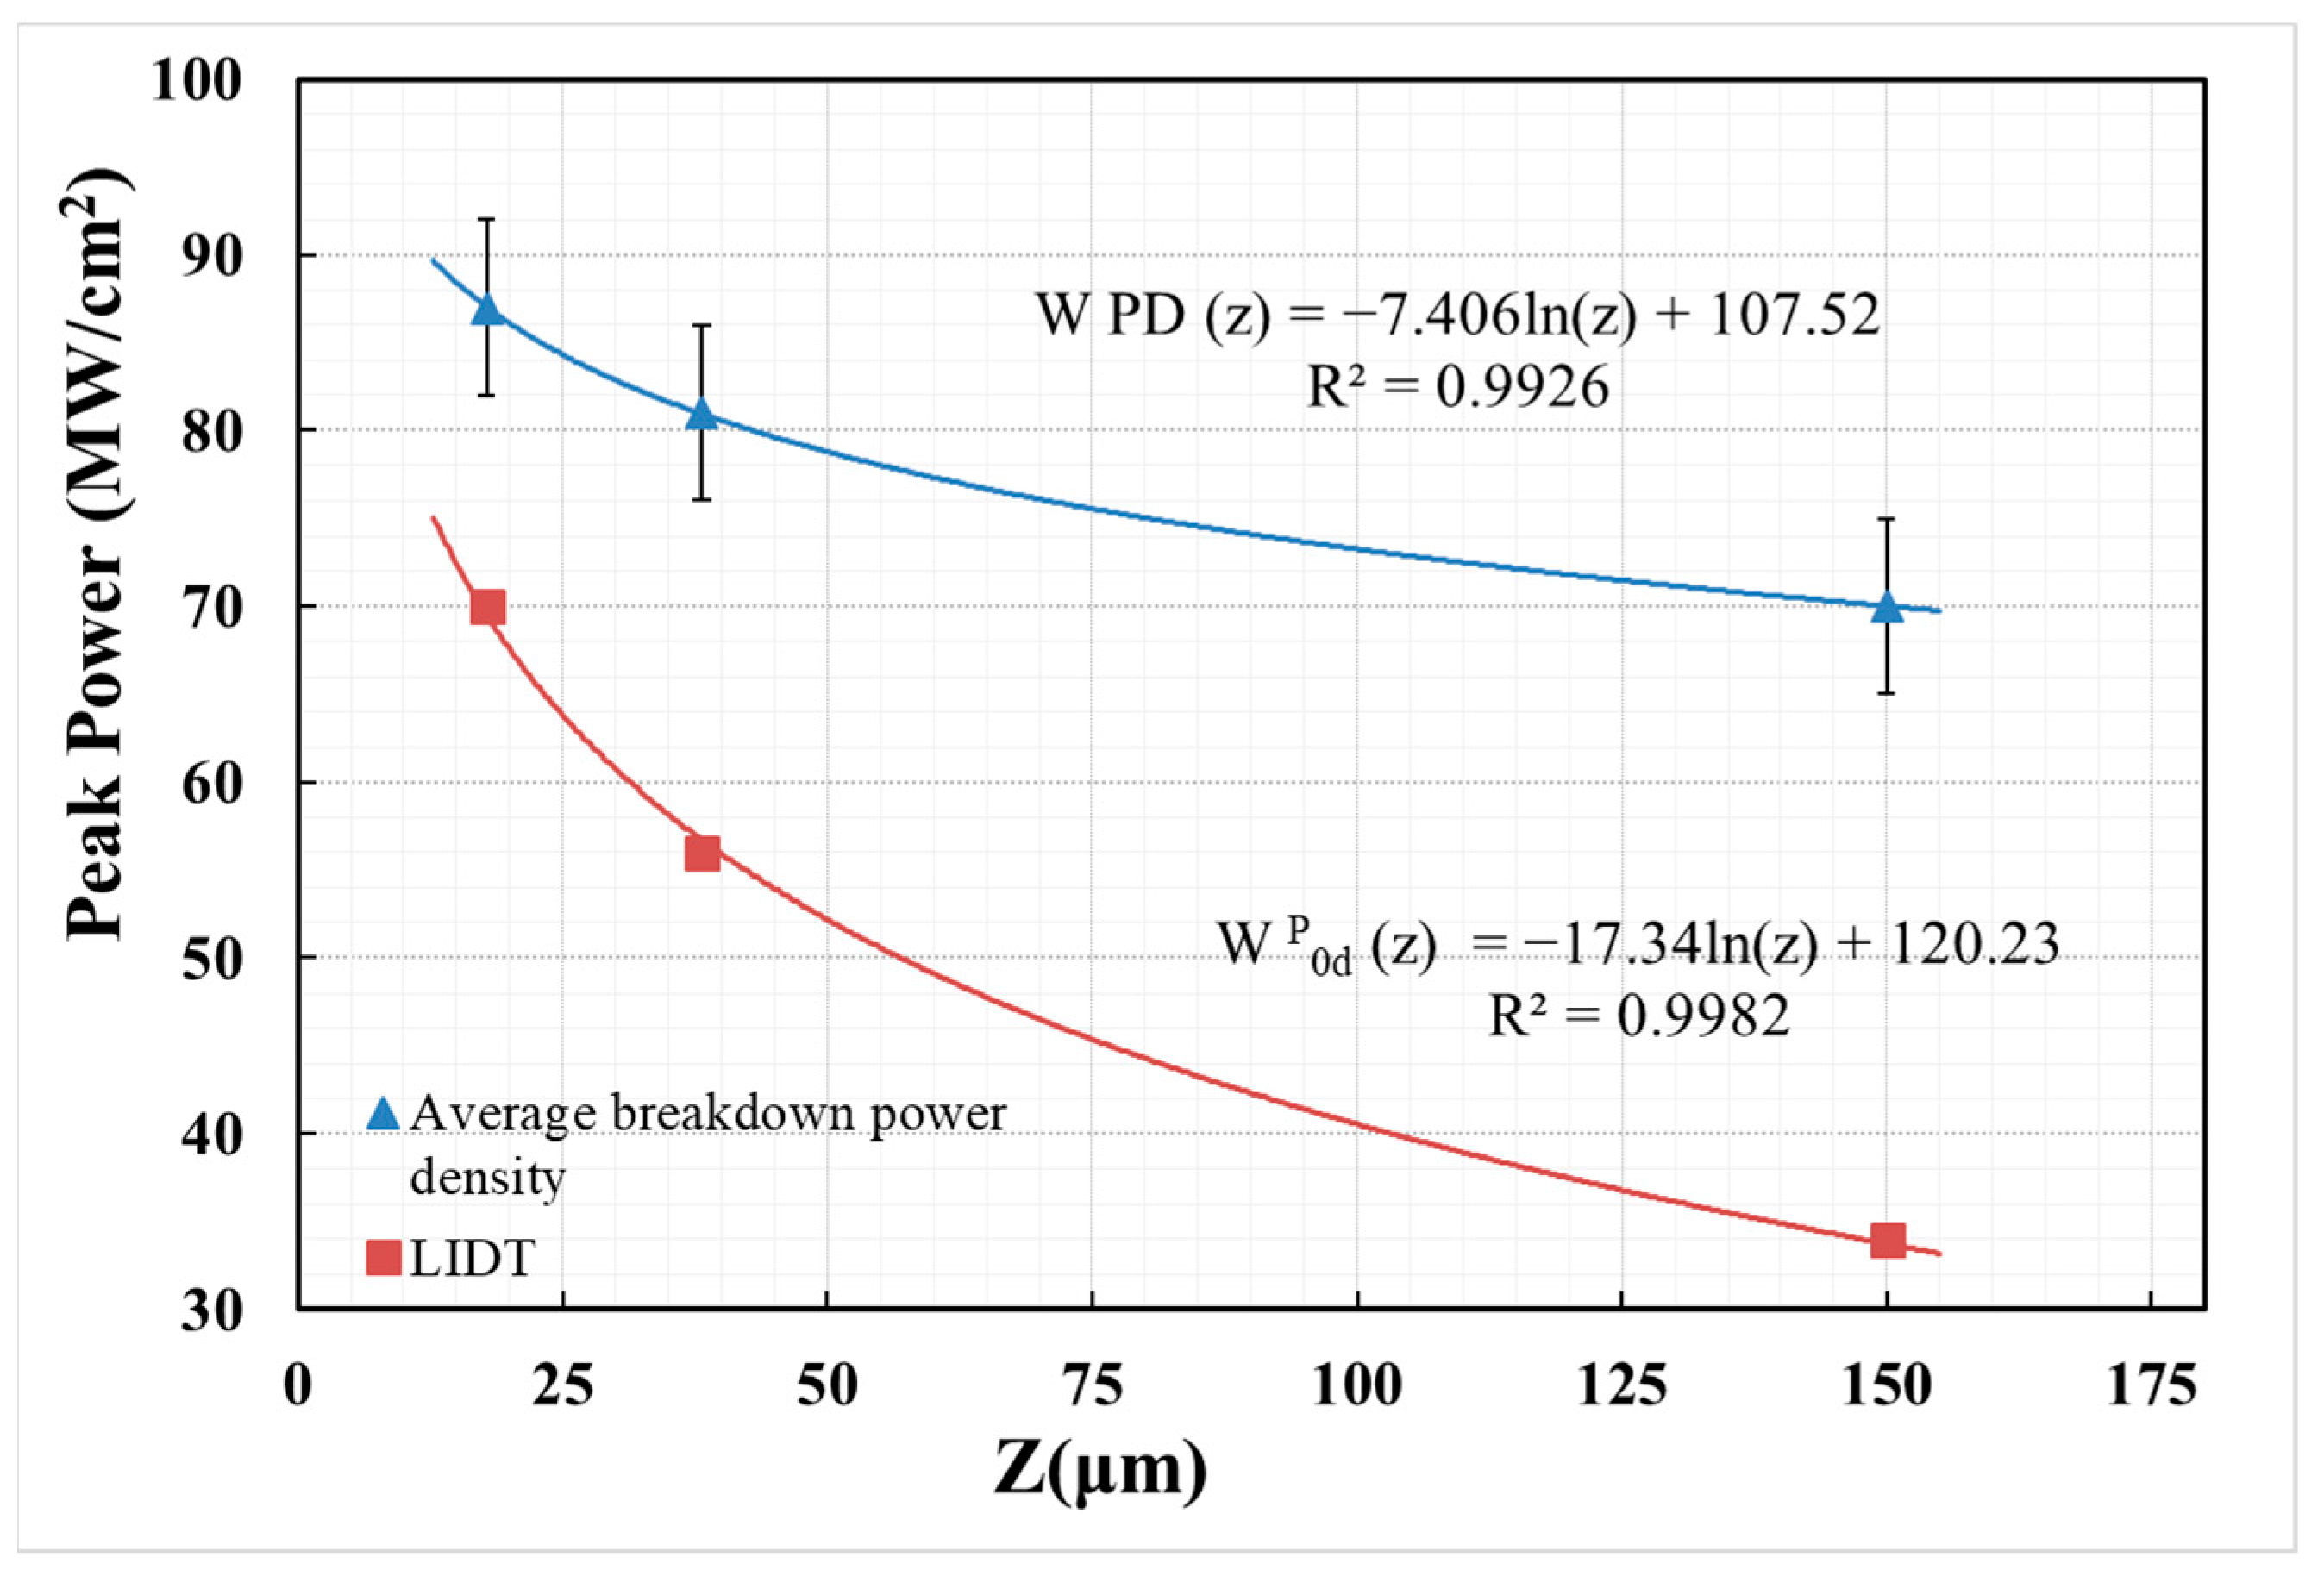
  • It was shown that the dependence of the LIDT of ZGP on the depth of MPO polishing is a smooth monotonically decreasing logarithmic function. It is assumed that the obtained logarithmic dependence indicates the thermal nature of optical breakdown and the dependence of the LIDT of ZGP on the concentration of surface absorbing defects. The obtained dependencies predict that a decrease in the depth of MPO polishing to several microns will lead to a further increase in the LIDT. However, these theoretical assumptions require experimental confirmation.
  • It is recommended that, in practice, MRO processing of ZGP crystals be carried out with material removal from the surface of no more than 20 μm.

Author Contributions

Conceptualization, N.N.Y. and A.K. (Andrei Khudoley); methodology, A.K. (Andrei Khudoley), G.G., P.K. and S.K.; software, P.K., M.Z., E.S. and V.K.; validation, N.N.Y., E.S., S.P., O.A.R., H.B., A.G. and S.K.; formal analysis, A.L. and A.K. (Andrey Kalsin); investigation, E.S., S.P., G.G., A.K. (Andrey Kalsin), A.L., A.G. and P.K.; resources, O.A.R., A.K. (Andrei Khudoley) and S.K.; data curation, E.S. and M.Z.; writing—original draft preparation, E.S.; writing—review and editing, N.N.Y. and H.B.; visualization, V.K., A.K. (Andrey Kalsin), A.L. and A.G.; supervision, N.N.Y. and A.K. (Andrei Khudoley); project administration, A.K. (Andrei Khudoley), S.K. and O.A.R.; funding acquisition, N.N.Y. All authors have read and agreed to the published version of the manuscript.

Funding

The work was financially supported by the Ministry of Science and Higher Education of the Russian Federation («Development of a Lidar System to Study the Dynamics and Control of the Gas Composition of the Atmosphere» project, agreement no. 075-15-2022-1209).

Data Availability Statement

Data is contained within the article.

Conflicts of Interest

The authors declare no conflict of interest.

References

  1. Su, Y.; Meng, J.; Wei, T.; Xie, Z.; Jia, S.; Wenlong, T.; Zhu, J.; Wang, W. 150 Gbps multi-wavelength FSO transmission with 25-GHz ITU-T grid in the mid-infrared region. Opt. Express 2023, 31, 15156–15169. [Google Scholar] [CrossRef] [PubMed]
  2. Yevtushenko, A.; Rozniakowska-Klosinska, M. Encyclopedia of Thermal Stresses, Laser-Induced Thermal Splitting in Homo-Geneous Body with Coating; Springer: Berlin/Heidelberg, Germany, 2014. [Google Scholar] [CrossRef]
  3. Parfenov, V.A. Laser Materials Microprocessing; SPbGETU “LETI”: Sankt-Petersburg, Russia, 2011; pp. 5–11. [Google Scholar]
  4. Soldatov, A.N.; Vasilyeva, A.V.; Polunin, Y.P.; Kuksgauzen, D.A.; Kostyrya, I.D. Strontium vapor generator-amplifier system for bone ablation. Bio-Technosphere 2012, 3–4, 47. [Google Scholar]
  5. Kozub, J.; Ivanov, B.; Jayasinghe, A.; Prasad, R.; Shen, J.; Klosner, M.; Heller, D.; Mendenhall, M.; Piston, D.W.; Joos, K.; et al. Raman-shifted alexandrite laser for soft tissue ablation in the 6- to 7-µm wavelength range. Biomed. Opt. Express 2011, 2, 1275–1281. [Google Scholar] [CrossRef] [PubMed]
  6. Lv, Z.; Shen, Y.; Zong, N.; Bian, Q.; Wang, E.-P.; Chang, J.-Q.; Bo, Y.; Cui, D.-F.; Peng, Q.-J. 1.53 W all-solid-state nanosecond pulsed mid-infrared laser at 6.45 µm. Opt. Lett. 2022, 47, 1359–1362. [Google Scholar] [CrossRef] [PubMed]
  7. Bobrovnikov, S.M.; Matvienko, G.G.; Romanovsky, O.A.; Serikov, I.B.; Sukhanov, A.Y. Lidar Spectroscopic Gas Analysis of the Atmosphere; IOA SB RAS: Tomsk, Russia, 2014; p. 510. [Google Scholar]
  8. Romanovskii, O.; Sadovnikov, S.; Kharchenko, O.; Yakovlev, S. Development of Near/Mid IR differential absorption OPO lidar system for sensing of atmospheric gases. Opt. Laser Technol. 2019, 116, 43–47. [Google Scholar] [CrossRef]
  9. Bochkovskii, D.A.; Vasil’eva, A.V.; Matvienko, G.G.; Polunin, Y.P.; Romanovskii, O.A.; Soldatov, A.N.; Kharchenko, O.V.; Yudin, N.A.; Yakovlev, S.V. Application of a strontium vapor laser to laser remote sounding of atmospheric composition. Atmos. Ocean. Opt. 2012, 25, 166–170. [Google Scholar] [CrossRef]
  10. Schunemann, P.G.; Zawilski, K.T.; Pomeranz, L.A.; Creeden, D.J.; Budni, P.A. Advances in nonlinear optical crystals for mid-infrared coherent sources. J. Opt. Soc. Am. B 2016, 33, D36–D43. [Google Scholar] [CrossRef]
  11. Hemming, A.; Richards, J.; Davidson, A.; Carmody, N.; Bennetts, S.; Simakov, N.; Haub, J. 99 W mid-IR operation of a ZGP OPO at 25% duty cycle. Opt. Express 2013, 21, 10062–10069. [Google Scholar] [CrossRef]
  12. Haakestad, M.W.; Fonnum, H.; Lippert, E. Mid-infrared source with 02 J pulse energy based on nonlinear conversion of Q-switched pulses in ZnGeP_2. Opt. Express 2014, 22, 8556–8564. [Google Scholar] [CrossRef]
  13. Qian, C.-P.; Yao, B.-Q.; Zhao, B.-R.; Liu, G.-Y.; Duan, X.-M.; Dai, T.-Y.; Ju, Y.-L.; Wang, Y.-Z. High repetition rate 102 W middle infrared ZnGeP2 master oscillator power amplifier system with thermal lens compensation. Opt. Lett. 2019, 44, 715–718. [Google Scholar] [CrossRef]
  14. Hildenbrand, A.; Kieleck, C.; Tyazhev, A.; Marchev, G.; Stöppler, G.; Eichhorn, M.; Schunemann, P.G.; Panyutin, V.L.; Petrov, V.P. Laser damage of the nonlinear crystals CdSiP2 and ZnGeP2 studied with nanosecond pulses at 1064 and 2090 nm. Opt. Eng. 2014, 53, 122511. [Google Scholar] [CrossRef]
  15. Gribenyukov, A.I.; Dyomin, V.V.; Olshukov, A.S.; Podzyvalov, S.N.; Polovtsev, I.G.; Yudin, N.N. Investigation of the process of laserinduced damage of ZnGeP2 crystals using digital holography. Russ. Phys. J. 2019, 61, 2042–2052. [Google Scholar] [CrossRef]
  16. Chumside, J.H.; Wilson, J.J.; Gribenyukov, A.I.; Shubin, S.F.; Dolgii, S.I.; Andreev, Y.M.; Zuev, V.V.; Boulder, V. Frequency conversion of a CO2 laser with ZnGeP2. In NOAA Technical Memorandum ERL WPL-224 WPL-224WPL; Air Resources Laboratory: Silver Spring, MD, USA, 1992; p. 18. [Google Scholar]
  17. Yudin, N.; Antipov, O.; Gribenyukov, A.; Eranov, I.; Podzyvalov, S.; Zinoviev, M.; Voronin, L.; Zhuravleva, E.; Zykova, M. Effect of postgrowth processing technology and laser radiation parameters at wavelengths of 2091 and 1064 nm on the laser-induced damage threshold in ZnGeP2 single crystal. Quantum Electron. 2021, 51, 306–316. [Google Scholar] [CrossRef]
  18. Andreev, Y.M.; Badikov, V.V.; Voevodin, V.G.; Geiko, L.G.; Geiko, P.P.; Ivashchenko, M.V.; I Karapuzikov, A.; Sherstov, I.V. Radiation resistance of nonlinear crystals at a wavelength of 9.55 μm. Quantum Electron. 2001, 31, 1075–1078. [Google Scholar] [CrossRef]
  19. Peterson, R.D.; Schepler, K.L.; Brown, J.L.; Schunemann, P.G. Damage properties of ZnGeP_2 at 2 μm. J. Opt. Soc. Am. B 1995, 12, 2142–2146. [Google Scholar] [CrossRef]
  20. Zawilski, K.T.; Setzler, S.D.; Schunemann, P.G.; Pollak, T.M. Increasing the laser-induced damage threshold of single-crystal ZnGeP_2. J. Opt. Soc. Am. B 2006, 23, 2310–2316. [Google Scholar] [CrossRef]
  21. Yudin, N.; Zinoviev, M.; Kuznetsov, V.; Slyunko, E.; Podzvalov, S.; Voevodin, V.; Lysenko, A.; Kalsin, A.; Shaimerdenova, L.; Baalbaki, H.; et al. Effect of Dopants on Laser-Induced Damage Threshold of ZnGeP2. Crystals 2023, 13, 1940737. [Google Scholar] [CrossRef]
  22. Guha, S.; Bartsch, M.; Hopkins, F.K.; Eaton, M.P.; Setzler, S.D.; Schunemann, P.G.; Pollak, T.M. Nonlinear absorption and laser damage threshold measurements of doped ZnGeP2. In Operational Characteristics and Crystal Growth of Nonlinear Optical Materials; International Society for Optics and Photonics: Bellingham, WA, USA, 1999; Volume 3793, pp. 9–12. [Google Scholar] [CrossRef]
  23. Peng, Y.; Wei, X.; Wang, W. Mid-infrared optical parametric oscillator based on ZnGeP2 pumped by 2-m laser. Chin. Opt. Lett. 2011, 9, 061403. [Google Scholar] [CrossRef]
  24. Yudin, N.; Khudoley, A.; Zinoviev, M.; Podzvalov, S.; Slyunko, E.; Zhuravleva, E.; Kulesh, M.; Gorodkin, G.; Kumeysha, P.; Antipov, O. The Influence of Angstrom-Scale Roughness on the Laser-Induced Damage Threshold of Single-Crystal ZnGeP2. Crystals 2022, 12, 83. [Google Scholar] [CrossRef]
  25. Yudin, N.; Antipov, O.; Eranov, I.; Gribenyukov, A.; Verozubova, G.; Lei, Z.; Zinoviev, M.; Podzvalov, S.; Slyunko, E.; Voevodin, V.; et al. Laser-Induced Damage Threshold of Single Crystal ZnGeP2 at 2.1 µm: The Effect of Crystal Lattice Quality at Various Pulse Widths and Repetition Rates. Crystals 2022, 12, 652. [Google Scholar] [CrossRef]
  26. Verozubova, G.A.; Gribenyukov, A.I.; Mironov, Y.P. Two-temperature synthesis of ZnGeP2. Inorg. Mater. 2007, 43, 1040–1045. [Google Scholar] [CrossRef]
  27. ISO 11146-1:2005; Lasers and Laser-Related Equipment—Test Methods for Laser Beam Widths, Divergence Angles and Beam Propagation Ratios. International Organization for Standardization: Geneva, Switzerland, 2005.
  28. ISO 2602:1980; Statistical Interpretation of Test Results—Estimation of the Mean—Confidence Interval. International Organization for Standardization: Geneva, Switzerland, 1980.
  29. Fisher, R.A.; Rothamsted, M.A. Statistical methods for research workers. Metron 1925, 5, 90. [Google Scholar]
  30. Dyomin, V.; Gribenyukov, A.; Davydova, A.; Zinoviev, M.; Olshukov, A.; Podzyvalov, S.; Polovtsev, I.; Yudin, N. Holography of particles for diagnostics tasks. Appl. Opt. 2019, 58, 300–310. [Google Scholar] [CrossRef]
  31. Shi, Z.; Sun, L.; Shao, T.; Liu, H.; Huang, J.; Ye, X.; Wang, F.; Yang, L.; Zheng, W. Statistically Correlating Laser-Induced Damage Performance with Photothermal Absorption for Fused Silica Optics in a High-Power Laser System. Photonics 2022, 9, 137. [Google Scholar] [CrossRef]
Figure 1. Single sample of ZGP nonlinear optical crystal: (a) dimensions, crystallographic directions, and crystal planes; (b) general appearance of the crystal.
Crystals 14 00032 g001
Figure 2. (a) Photo of the setup; (b) Schematic diagram of the setup: 1—Ho:YAG laser, 2—attenuator based on a half-wave plate and polarizer, 3—lens with a focal length of 200 mm, 4—studied sample in a holder, 5—Ophir power meter.
Crystals 14 00032 g002
Figure 3. An example of a reconstructed multiple holographic image of the volume of a ZGP single crystal that does not contain volumetric defects.
Crystals 14 00032 g003
Figure 4. Surface topography and roughness profile of sample 2: (a) after fine grinding (before MPO), (b) after MPO.
Crystals 14 00032 g004
Figure 5. Dependence of the probability of the optical breakdown of samples on the energy density of the incident laser radiation, data on LIDT of sample 5 are taken from [29].
Crystals 14 00032 g005
Figure 6. Dependence of the probability of the optical breakdown of samples on the power density of the incident laser radiation, data on LIDT of sample 5 are taken from [29].
Crystals 14 00032 g006
Figure 7. Relationship between the LIDT and average breakdown power density for ZGP with different MPO polishing depths.
Crystals 14 00032 g007
Figure 8. The ratio of the breakdown spot diameter and the intensity profile of the test laser beam on the surface of the sample.
Crystals 14 00032 g008
Figure 9. Generalized histogram of the values of removal, roughness parameters, and damageability of samples 1–4.
Crystals 14 00032 g009
Table 1. Surface roughness parameters of samples 1–4.
Roughness Parameter (×50 Lens), nmSample 1 (Traditional Polishing)Sample 2Sample 3Sample 4
Fine GrindingMPOFine GrindingMPOTraditional PolishingMPO
Rz1.672204.01.162175.01.1401.281.13
Ra0.212274.00.168262.00.1630.1840.16
Rq0.294355.00.213341.00.2070.2330.204
Table 2. Results of determining the LIDT for ZGP samples.
SampleMPO Removal Depth, µmk W D E , J/cm2 W 0 d E , J/cm2 W 0 d P , MW/cm2 W D P , MW/cm2
102.8(2.9 ± 0.5)2.0859(88 ± 15)
21502.8(2.5 ± 0.7)1.2234(70 ± 22)
338.152.8(2.8 ± 0.5)1.9656(81 ± 15)
417.82.8(3.0 ± 0.5)2.4570(87 ± 11)
59.52.8(3.2 ± 0.2)2.982(90 ± 5)
Disclaimer/Publisher’s Note: The statements, opinions and data contained in all publications are solely those of the individual author(s) and contributor(s) and not of MDPI and/or the editor(s). MDPI and/or the editor(s) disclaim responsibility for any injury to people or property resulting from any ideas, methods, instructions or products referred to in the content.

