Abstract
A novel non-centrosymmetric NdSr4O(BO3)3 borate and solid solutions of Nd(Ca1−xSrx)4O(BO3)3 (x = 0.0, 0.1, 0.2, 0.3, 0.4, 0.5, 0.7, 1.0) were synthesized by solid-state reactions as well as crystallization from a melt. The crystal structures of the Nd(Ca1−xSrx)4O(BO3)3 solid solutions with x = 0.2, 0.5 and 1.0 were determined from single crystal X-ray diffraction data and refined in the monoclinic space group Cm to Robs = 0.028, 0.034 and 0.028, respectively. The thermal expansion of the samples with x = 0, 0.2 and 0.5 was investigated using powder high-temperature X-ray diffraction in the temperature range of 25–1000 °C. A similarity of the thermal and compositional (Ca-Sr substitution) deformations of Nd(Ca1−xSrx)4O(BO3)3 solid solutions is revealed: Heating of Nd(Ca0.5Sr0.5)4O(BO3)3 by 1 °C leads to the same deformations of the crystal structure as increasing the amount of Sr atoms in Nd(Ca0.5Sr0.5)4O(BO3)3 by 0.26 at% Sr. The SHG signal of the series of Nd(Ca1−xSrx)4O(BO3)3 solid solutions has a maximum at approximately x = 0.2.
1. Introduction
The calcium lanthanide oxyborates with the general formula of LnCa4O(BO3)3 (Ln = Y, La–Lu) (LnCOB) became the focus of a number of studies. These oxoborates were first described by Khamaganova et al. [1]. They crystallized in the monoclinic system, space group Cm [1,2,3]. Research [4,5,6,7,8,9,10] showed that the family of LnCOB borates is a source of crystals with good NLO properties. The LnCOB is comparable with well-known active media, such as Nd-activated YAl3(BO3)4, LaSc3(BO3)4, and (Ce,Gd)Sc3(BO3)4, in lasing and non-linear optical properties [11,12,13]. It has been reported that GdCa4O(BO3)3 (GdCOB), YCa4O(BO3)3 (YCOB) and solid solutions of GdxY1−xCa4O(BO3)3 (GdYCOB) are suitable for blue to near-UV generation [14,15,16,17,18]. GdYCOB crystal is unique in that its birefringence is tunable by controlling the composition ratio of Gd to Y. The optical non-linearity of a crystal can be improved through doping processes, for example, with partial substitution of Yb for Y in YCa4O(BO3)3 [19].
The crystal structure of LnCa4O(BO3)3 consists of M1–M3 octahedra (M = Ca2+, Ln3+) and BO3 trigonal planar groups [1,2,20]; the M3 polyhedra can be described as eightfold polyhedra [13,21]. Ions occupied these positions partially orderly: rare earths elements filled mainly the M1 positions, calcium—M2 and M3. Currently, there are studies of structures in which Ca2+ ions are replaced by other metal ones, mainly Sr2+; the effect of these substitutions on various properties has been studied [22,23,24]. According to Liu et al. [22], the NLO properties of GdCa4O(BO3)3 crystals can be significantly improved by doping with 4% Sr2+. The SHG efficiency achieved with Sr-doped and undoped GdCa4O(BO3)3 was 37 and 28%, respectively. It was shown in [24] that 35% of Sr ions can be incorporated instead of Ca into Gd(Ca1−xSrx)4O(BO3)3 solid solutions. Moreover, by adjusting the Sr content in La(Ca1−xSrx)4O(BO3)3 crystals (x = 0–0.4), the optical birefringence can be controlled and the blue light can be obtained in the range of 495–473 nm through type-I NCPM SHG of the corresponding fundamental wavelengths [23]. Wide ranges of Ca → Sr substitution are due to the closeness of the ionic radii of Ca2+ and Sr2+ (1.14 Å and 1.32 Å, respectively, for coordination number 6 [25]) and this maintains the congruent melting property, enabling the production of high-quality crystals. At the same time, the combination of coupled substitution with Na and REE is very limited, and the combination of Ca with Sr, Na and Gd could not be synthesized [24].
Some studies on LnCa4O(BO3)3 have focused on a variety of properties: melting points [2,21,26], thermal expansion [27], photoluminescence [28,29,30,31], thermal conductivity [27], dielectric, elastic and piezoelectric behavior [26,32,33] and magnetism [20,34]. However, thermal expansion of the LnCa4O(BO3)3 family is poorly studied; there are only thermal expansion coefficients along the crystallographic axes for GdCa4O(BO3)3 [27], which is insufficient to characterize an anisotropy of thermal expansion for a monoclinic crystal. In the case of oblique crystals, it is necessary to calculate the principal values of the thermal expansion tensor in order to study the expansion anisotropy. In addition, LnCOB has shown itself to be a promising material for efficient non-linear frequency conversion through non-critical phase matching (NCPM), and ongoing research is exploring its potential applications in optical technology [23]. The family of rare earth calcium oxoborates, LnCOB, contains promising candidates for pyro- and piezoelectric applications; their use is not limited to phase transitions [24]. Due to its congruent melting and absence of phase transitions, it can be grown from the melt directly and used in pyro- and piezoelectrics.
Here, in order to investigate the influence of cation substitutions on NLO properties and to expand the RCOB (R = REE) family, we report the results of synthesis and complex investigations of new NLO Nd(Ca1−xSrx)4O(BO3)3 solid solutions and a new NdSr4O(BO3)3 compound. In the series of NdCa4O(BO3)3 compounds, it was possible to almost double the Ca → Sr substitution limits for Nd (x is approximately 0.7) in comparison to Gd (x = 0.35) and La (x = 0.4) [24]. In addition, a new non-centrosymmetric NdSr4O(BO3)3 compound obtained in the present studies can be considered as the prototype of a new REESr4O(BO3)3 series, where doped additives can be introduced into the position of a rare earth element to study the luminescent properties of these multifunctional materials.
2. Materials and Methods
2.1. Synthesis
Polycrystalline samples of Nd(Ca1−xSrx)4O(BO3)3 (x = 0; 0.1; 0.2; 0.3; 0.4; 0.5; 0.7; 0.8; 0.9; 1) were synthesized by multi-step solid-state reactions from CaCO3, SrCO3, Nd2O3 and H3BO3 (99.90% purity). Boric acid was added with an excess of 3% as noted in [24]. To remove the adsorption moisture, the reagents were pre-calcined: strontium and calcium carbonate at 600 °C/6 h, neodymium oxide at 800 °C/3 h. After homogeneous grinding and mixing in an agate mortar for 1 h, tablets were pressed from the powder using a hydraulic press at a pressure of 80 kg/cm2, after the tablet was heated at 900 °C for 9 h. The polycrystalline products with the common formula Nd(Ca1−xSrx)4O(BO3)3 were synthesized by a three-step sintering process. The first step was heating tablets in a platinum crucible at 1200 °C and exposing them for 30 h with slow cooling in the Nabertherm HTC furnace. In the second step, heating was carried out to 1300 °C for 60 h, followed by slow cooling in the furnace by switching off the furnace. The last step was heating at 1350 °C with exposure for half an hour. All powder samples were examined by means of X-ray powder diffraction (XRD). To obtain small single crystals, the samples were heated in platinum crucibles above melting temperature of 1430 °C for half an hour, after which they were slowly cooled in the furnace.
2.2. Powder X-ray Diffraction
Powder diffraction data of the Nd(Ca1−xSrx)4O(BO3)3 samples after three heat treatments were collected using a Rigaku MiniFlex II diffractometer (CuKα, 2θ = 10–70°, step 0.02°). The phase composition was determined using PDXL-integrated X-ray powder diffraction software and PDF-2 2016 (ICDD) database [35]. Quantitative phase analysis of the samples and unit cell parameters of Nd(Ca1−xSrx)4O(BO3)3 solid solutions were refined by Rietveld method in the RTT program software [36]. X-ray powder diffraction patterns of the Nd(Ca1−xSrx)4O(BO3)3 samples after heat treatment at 1300 °C are given in Figure S1.
2.3. Single Crystal X-ray Diffraction
Single crystals of Nd(Ca1−xSrx)4O(BO3)3, x = 0.2, 0.5 were selected in polarized light using an optical microscope and attached to a glass fiber using epoxy glue. The experimental data were collected on a Bruker Apex II diffractometer utilizing MoKα radiation. Lorentz and polarization corrections were applied. The absorption correction based on a crystal shape was performed. The structures were solved using a charge-flipping method [37] implemented in JANA2006 [38]. The structures could be refined to Robs = 0.028, 0.034 and 0.28 for x = 0.2, 0.5 and 1.0, respectively. Details of data collection and structure refinement are summarized in Table 1. Atomic coordinates, occupancies and atomic anisotropic displacement parameters are given in Tables S1–S6, selected bond lengths are in Table S7. Further details of the crystal structure investigations can be obtained from the Cambridge Structural Database by quoting the depository numbers CSD 2286252 (NdCa3.2Sr0.8O(BO3)3), 2286231 (NdCa2Sr2O(BO3)3) and 2286250 (NdSr4O(BO3)3). Data visualization was performed with the Vesta 3 [39] software.

Table 1.
Crystal data and experimental details for structures of Nd(Ca1−xSrx)4O(BO3)3 (x = 0, 0.2, 0.5, 1) solid solutions.
2.4. High-Temperature Single-Crystal X-ray Diffraction
The temperature-dependent structural behavior of Nd(Ca0.8Sr0.2)4O(BO3)3 solid solution (x = 0.2) under heating in the air was studied in situ by high-temperature single-crystal X-ray diffraction using a XtaLAB Synergy-S diffractometer (Rigaku Oxford Diffraction, Japan) operated with monochromated MoKα radiation (λ[MoKα] = 0.71073 Å) at 50 kV and 40 mA and equipped with an HyPix-6000HE detector with a unique high-temperature FMB Oxford system. The sample heating is performed using a gas blower up to 1000 (±1) °C, which consists of a hot air generator controlled by a Eurotherm regulator and gas flow controller. For this experiment, the single crystal with an approximate size of 30 μm × 20 μm × 40 μm was mounted on the glass fiber, which was placed into the quartz capillary. Diffraction data were collected at different temperatures without changing the orientation of the crystal in the range of 27–1000 °C with a temperature step of 100 °C. The crystal structures were refined at 11 temperatures, including room temperature after heating. Crystal data and experimental details for 6 are given in Table S8, selected bond lengths are in Table S9. Anisotropic displacement parameters were refined for all atoms.
2.5. High-Temperature Powder X-ray Diffraction
Homogeneous solid solutions of Nd(Ca1−xSrx)4O(BO3)3, x = 0, 0.2, 0.5, were investigated by X-ray powder diffraction at high temperatures using the Rigaku Ultima IV diffractometer (CuKα1+2, 40 kV/30 mA, 25−1000 °C, temperature step of 20 °C, Rigaku R-300 high-temperature attachment). A Pt-Pt/Rh thermocouple was used to control the temperature. As an example, a 2D-top view of HTXRD pattern of the sample Nd(Ca0.5Sr0.5)4O(BO3)3 is presented in Figure S2. Multi-stage processing of experimental data was carried out using the RietveldToTensor 2.0 software [37]. The first step included the refinement of the unit cell parameters and quantitative phase composition at different temperatures by the Rietveld method using the room-temperature crystallographic information file (CIF) obtained in this work from single-crystal XRD data as a model for Rietveld refinement. Then temperature dependences of unit-cell parameters and volume were approximated by polynomial functions for all samples (Table S10), the components of the tensor (αij) of thermal expansion were determined in a Cartesian crystal-physical coordinate system using the coefficients of approximation and finally drawing figures of thermal expansion coefficients (α) were performed in the RietveldToTensor software. A detailed description of the data processing and calculation of eigenvalues of thermal expansion tensor is given in [36]. Standard orientation of the crystallographic axes (set II for monoclinic systems) with respect to the crystal-physical axes has been used. The eigenvalues of the tensors of thermal expansion and TECs along crystallographic axes were calculated (see Table 3), and the latter are compared to the results obtained in [27].
2.6. Thermal Analysis
The high-temperature behavior was studied by differential scanning calorimetry (DSC) and thermogravimetry (TG) on a NETZSCH STA 429 thermal analyzer. Measurements were performed on tablets containing approximately 20–50 mg placed in a Pt-Rh crucible. The heating and cooling rate was 20 °C/min in the heating range of 20–1450 °C and then cooled at 900 °C. For example, microphotographs of the tablet of NdCa4O(BO3)3 in the Pt crucible before (left) and after (right) heating to 1445 °C are given in Figure S3. The temperatures of the thermal effects were estimated as the first derivative onset temperatures, when possible, and as maximum temperatures in the case of multiple peaks overlapping. According to the TG data, very small mass losses gradually occurred during heating, apparently due to the high heating rate.
2.7. Spectroscopy
UV–Vis absorption spectra were measured using a PerkinElmer Lambda 1050 spectrophotometer equipped with a 150-mm integrated sphere. Barium sulfate (BaSO4) sample was used as a blank. Raman spectra were collected with a Horiba LabRam HR800spectrometer at 632.8 nm excitation.
2.8. Second Harmonic Generation (SHG) Measurements
SHG measurements were made using the Kurtz−Perry method against polycrystalline α-quartz (grain size of 0.07−0.5 μm). A 31-A femtosecond Ti:Sapphire amplifier with a pulse energy of 1 mJ, pulse duration of 35 fs and repetition rate of 1 kHz as a source of radiation at λω = 800 nm was used. The SHG signal was registered in reflection mode and measured by a spectrometer based on a single monochromator M266 and multichannel CCD detector UC-12T3.
3. Results
3.1. Powder X-ray Diffraction Studies
After heat treatment at 1200 °C, the samples of Nd(Ca1−xSrx)4O(BO3)3 were homogeneous in the range of xSr compositional parameter x = 0–0.3, and peaks corresponded to the XRD patterns of LnCa4O(BO3)3 borate in accordance with the data (PDF-2 ICDD). The samples with x = 0.4 and 0.5 contained a few additional peaks of Sr3B2O6. After heat treatment at 1300 °C, the samples of Nd(Ca1−xSrx)4O(BO3)3 were homogeneous up to x = 0.5 and the sample with x = 0.7 contained approximately 7 wt % of Sr3B2O6 as an impurity (Figure S1). The substitution of Ca by Sr shows that Sr can be incorporated up to an amount of 70 at. % and homogeneous solid solutions were found for xSr = 0–0.7. With further increasing content, the peaks of Sr3B2O6 and NdBO3 could appear in the PXRD patterns: in the sample with xSr = 0.8, the content of the Nd(Ca1−xSrx)4O(BO3)3 solid solution (x ~ 0.7) decreased to approximately 65 wt % respectively, while the Sr3B2O6 content increased to approximately 25 wt % and additional peaks of unidentified phase were observed (Figure S1). In the PXRD pattern of the sample with x = 0.9, the content of the Nd(Ca1−xSrx)4O(BO3)3 solid solution (x ~ 0.7) decreased gradually to 50 wt %, Sr3B2O6 and NdBO3 appeared at approximately 25 and 25 wt %. After heat treatment at 1350 °C, the Nd(Ca1−xSrx)4O(BO3)3 solid solutions were homogeneous in the same region as the compositional parameter (x = 0.5); the sample with x = 0.7 also contained a solid solution and approximately 7% of Sr3B2O6 borate. Multi-phase samples (x = 0.8, 0.9) melted and contained at least three phases: the Nd(Ca1−xSrx)4O(BO3)3 solid solutions (x ~ 0.7), Sr3B2O6 and NdBO3. Thus, the miscibility range can be estimated to be xSr ~ 0–0.7. This is almost twice the Ca → Sr substitutions in the Gd(Ca1−xSrx)4O(BO3)3 series [24]. The PXRD pattern of novel NdCa4O(BO3)3 borate (x = 1) contained also the Sr3B2O6 admixture in an amount of approximately 8 wt %.
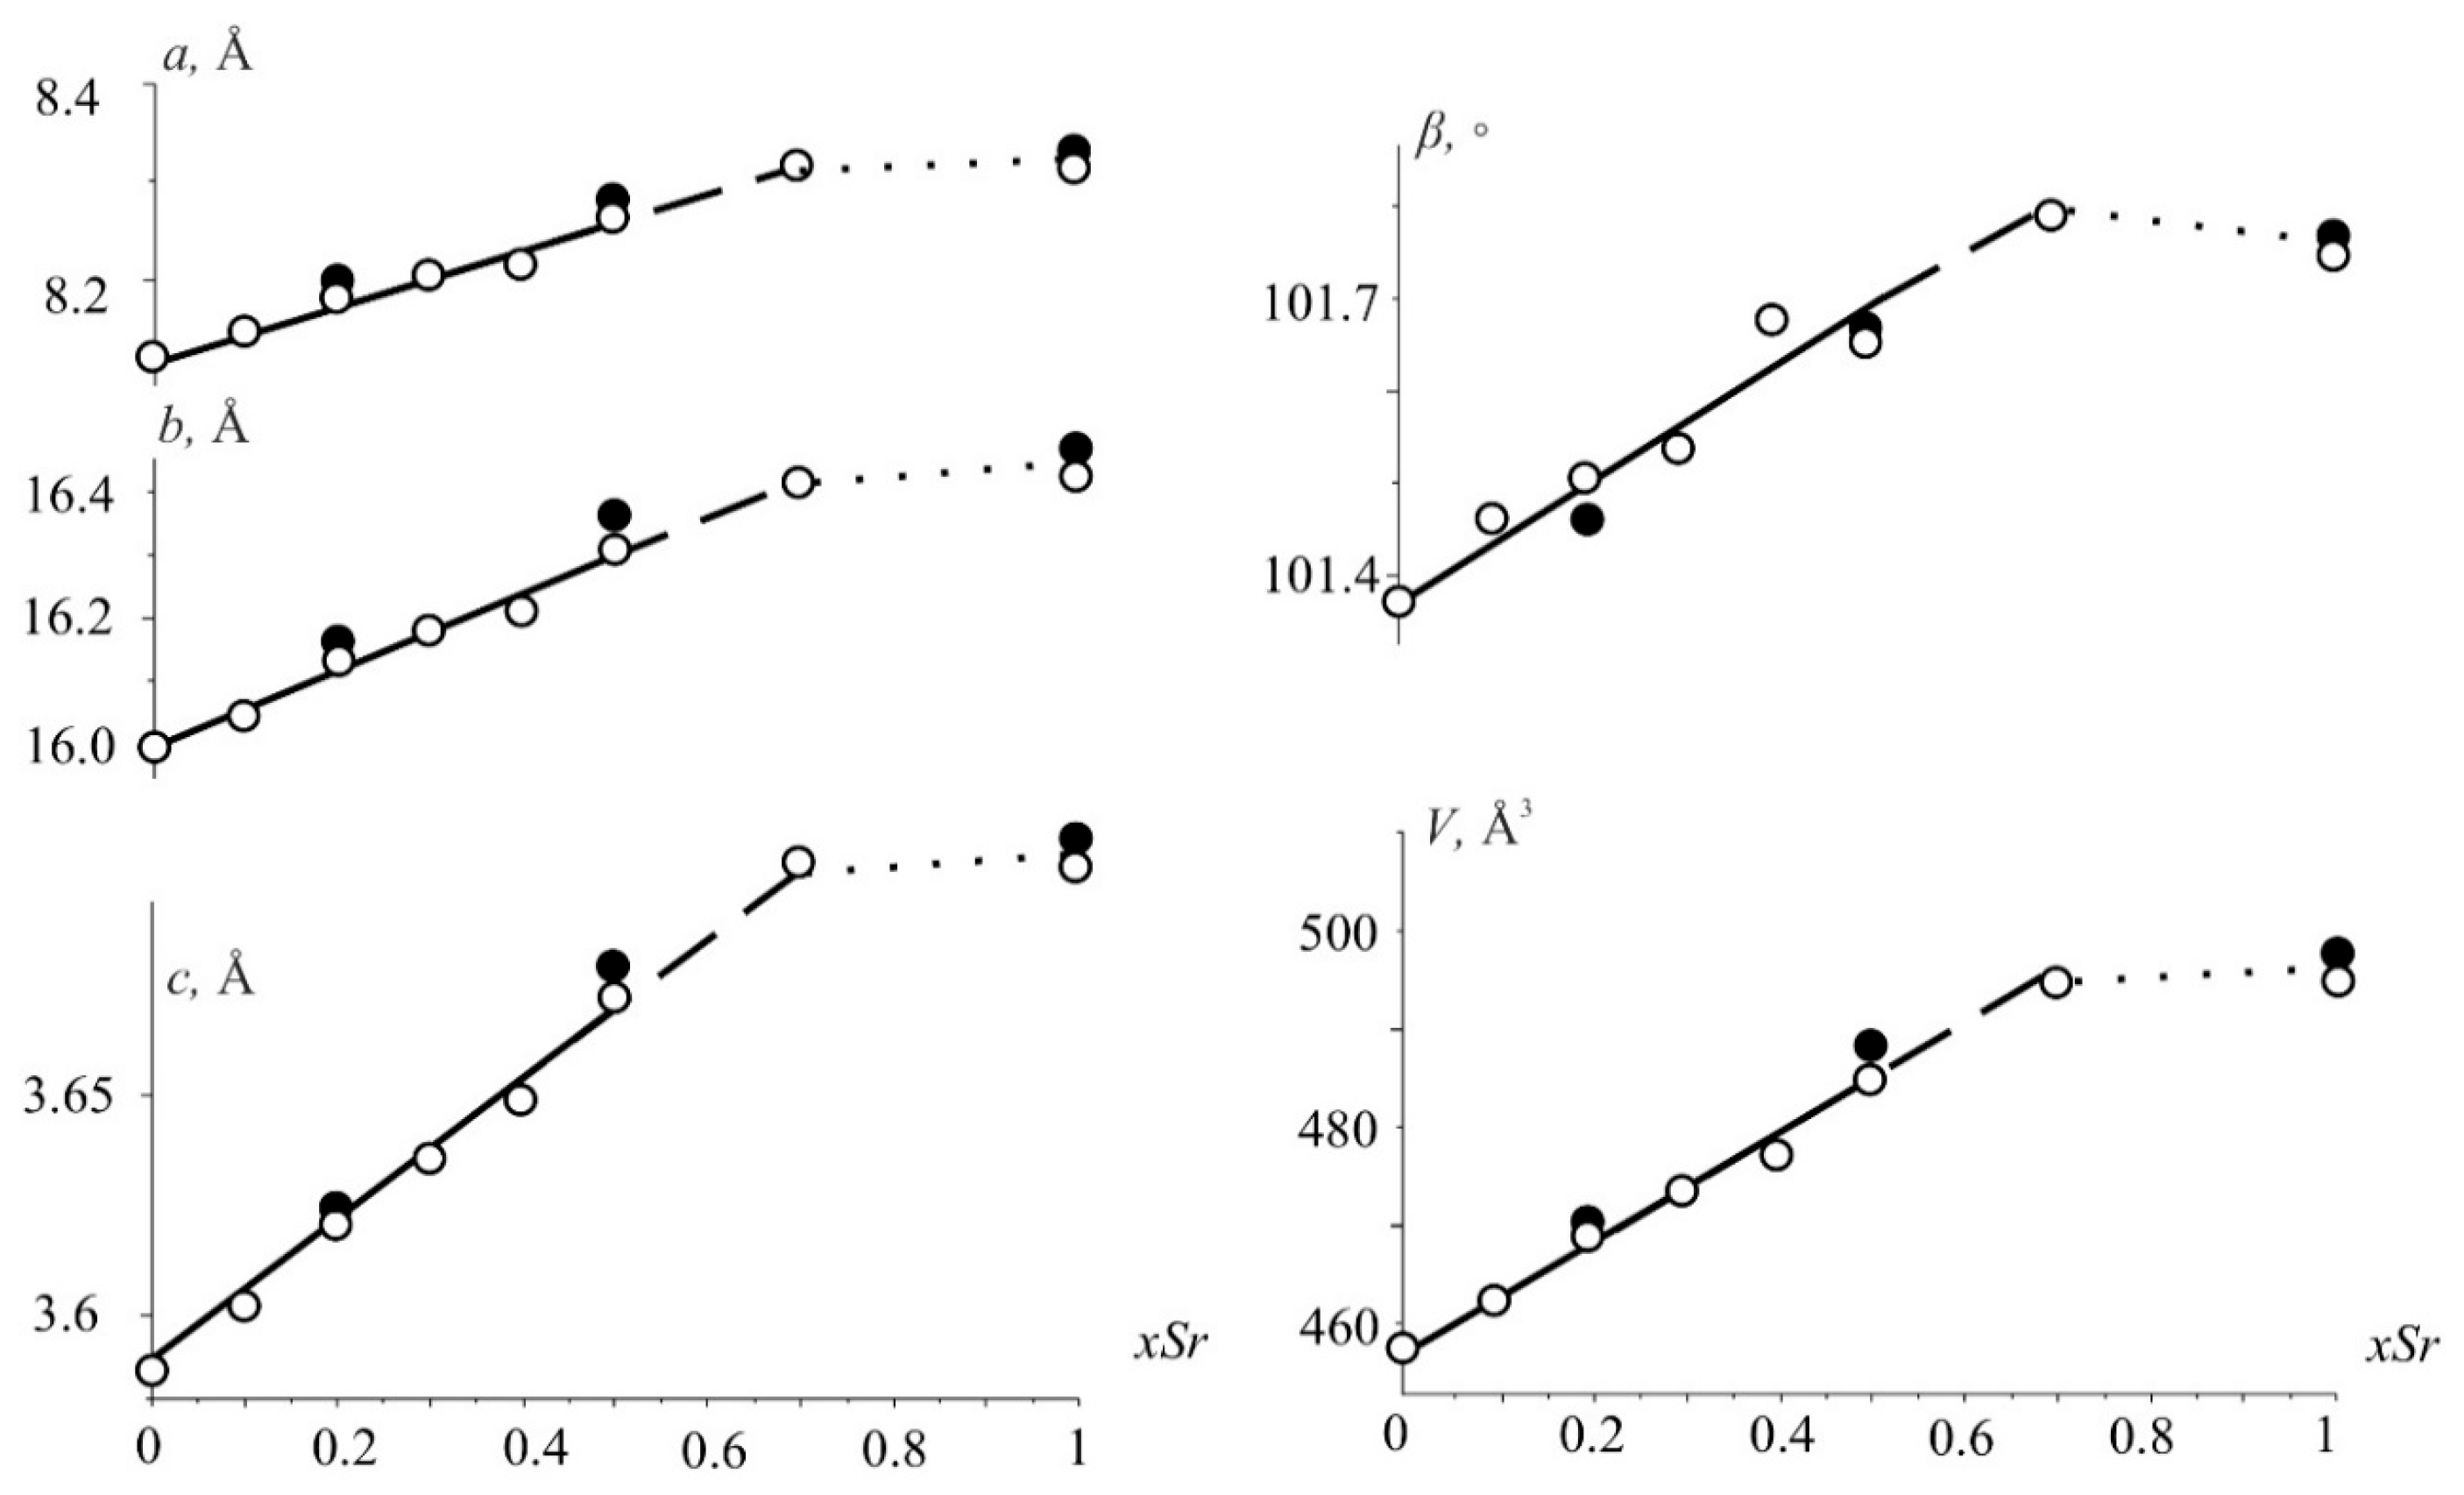
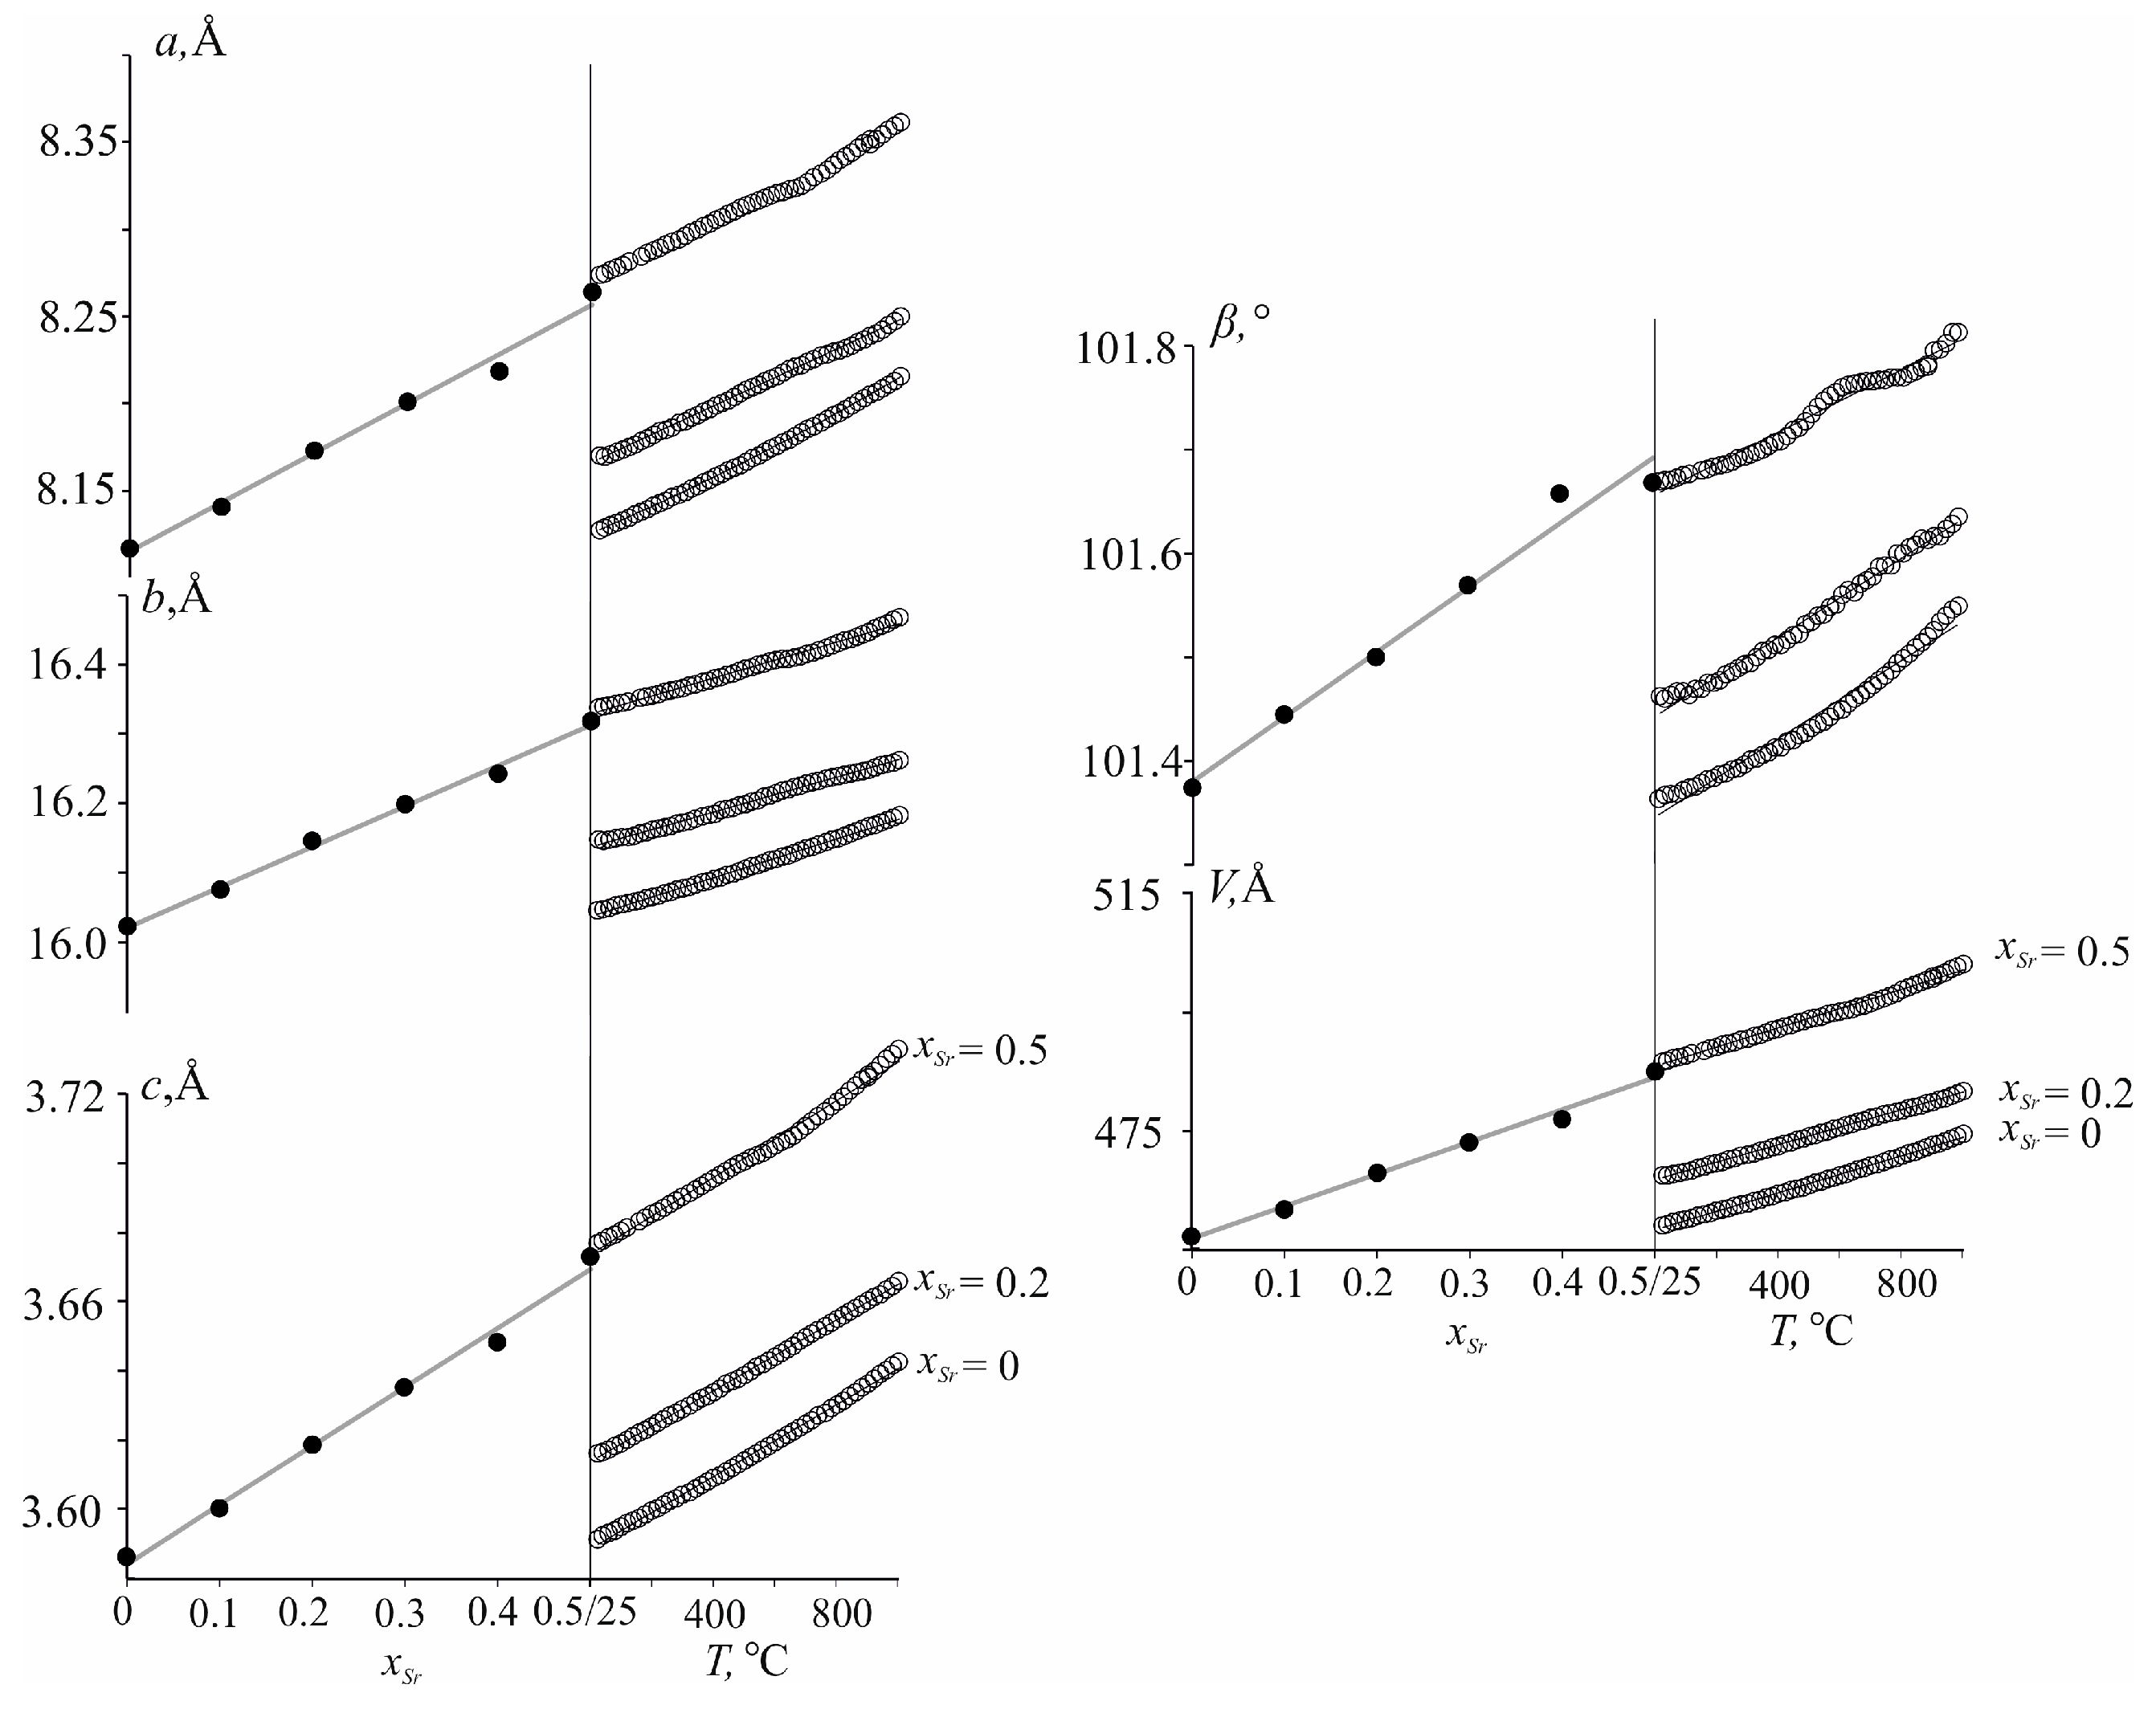
The unit cell parameters of Nd(Ca1−xSrx)4O(BO3)3 solid solutions after heat treatment at 1300 °C increase almost linearly with the gradual growth of Sr2+ content to x = 0.7 (Figure 1) according to the larger ionic radii of Sr2+ ([6] 1.32 Å) ions in comparison to Ca2+ ([6] 1.14 Å) ones [25]. The parameter c increases most strongly, while a and b change insignificantly, and the monoclinic angle increases by 0.4°. With a further increase in the content of strontium ions (x > 0.7), a multi-phase region appears in which the parameters remain practically unchanged to x = 1 (Figure 1), which may indicate the stability of the new NdSr4O(BO3)3 phase. The parameters determined from powder and single-crystal XRD data (Figure 1, open and filled circles) are in good agreement.

Figure 1.
The unit-cell parameters and the volume versus Sr-content in the Nd(Ca1−xSrx)4O(BO3)3 solid solution. Values obtained from powder and single-crystal XRD data are shown with open and filled circles.
3.2. Crystal Structures of Nd(Ca1−xSrx)4O(BO3)3 Solid Solutions
There are three M1–M3 sites for Nd and Ca and Sr cations, B1 and B2 and O1–O6 sites in asymmetric units in the series of Nd(Ca1−xSrx)4O(BO3)3 solid solutions (Tables S1–S6). The cations are distributed over the three sites (Table 2 and Tables S1–S3): in the Nd(Ca1−xSrx)4O(BO3)3 solid solutions (x = 0.2, 0.5) Nd3+ ions are situated at the M1 (2a) and M3 (4b) crystallographic sites; the Sr2+ ions occupy the two M2 (4b) and M3 (4b) sites, while Ca2+ occupy all three sites; in the new NdSr4O(BO3)3 compound cations are ordered, Nd3+ ions occupy only the M1 (2a) site, Sr—M2 (4b) and M3(4b) ones. This distribution of the cations over the three sites agrees with the bond valence sum (BVS) of the sites (Table 2). For instance, in the case of solid solutions, the BVS (M1) is less than 3, since, in addition to Nd3+, the position is partially filled with Ca2+, while in the NdSr4O(BO3)3 borate, the BVS (M1) is closer to 3 due to ordering cation distribution.
Table 2.
The average bond lengths M—O (Å) and occupancies of M sites in Nd(Ca1−xSrx)4O(BO3)3 solid solutions.
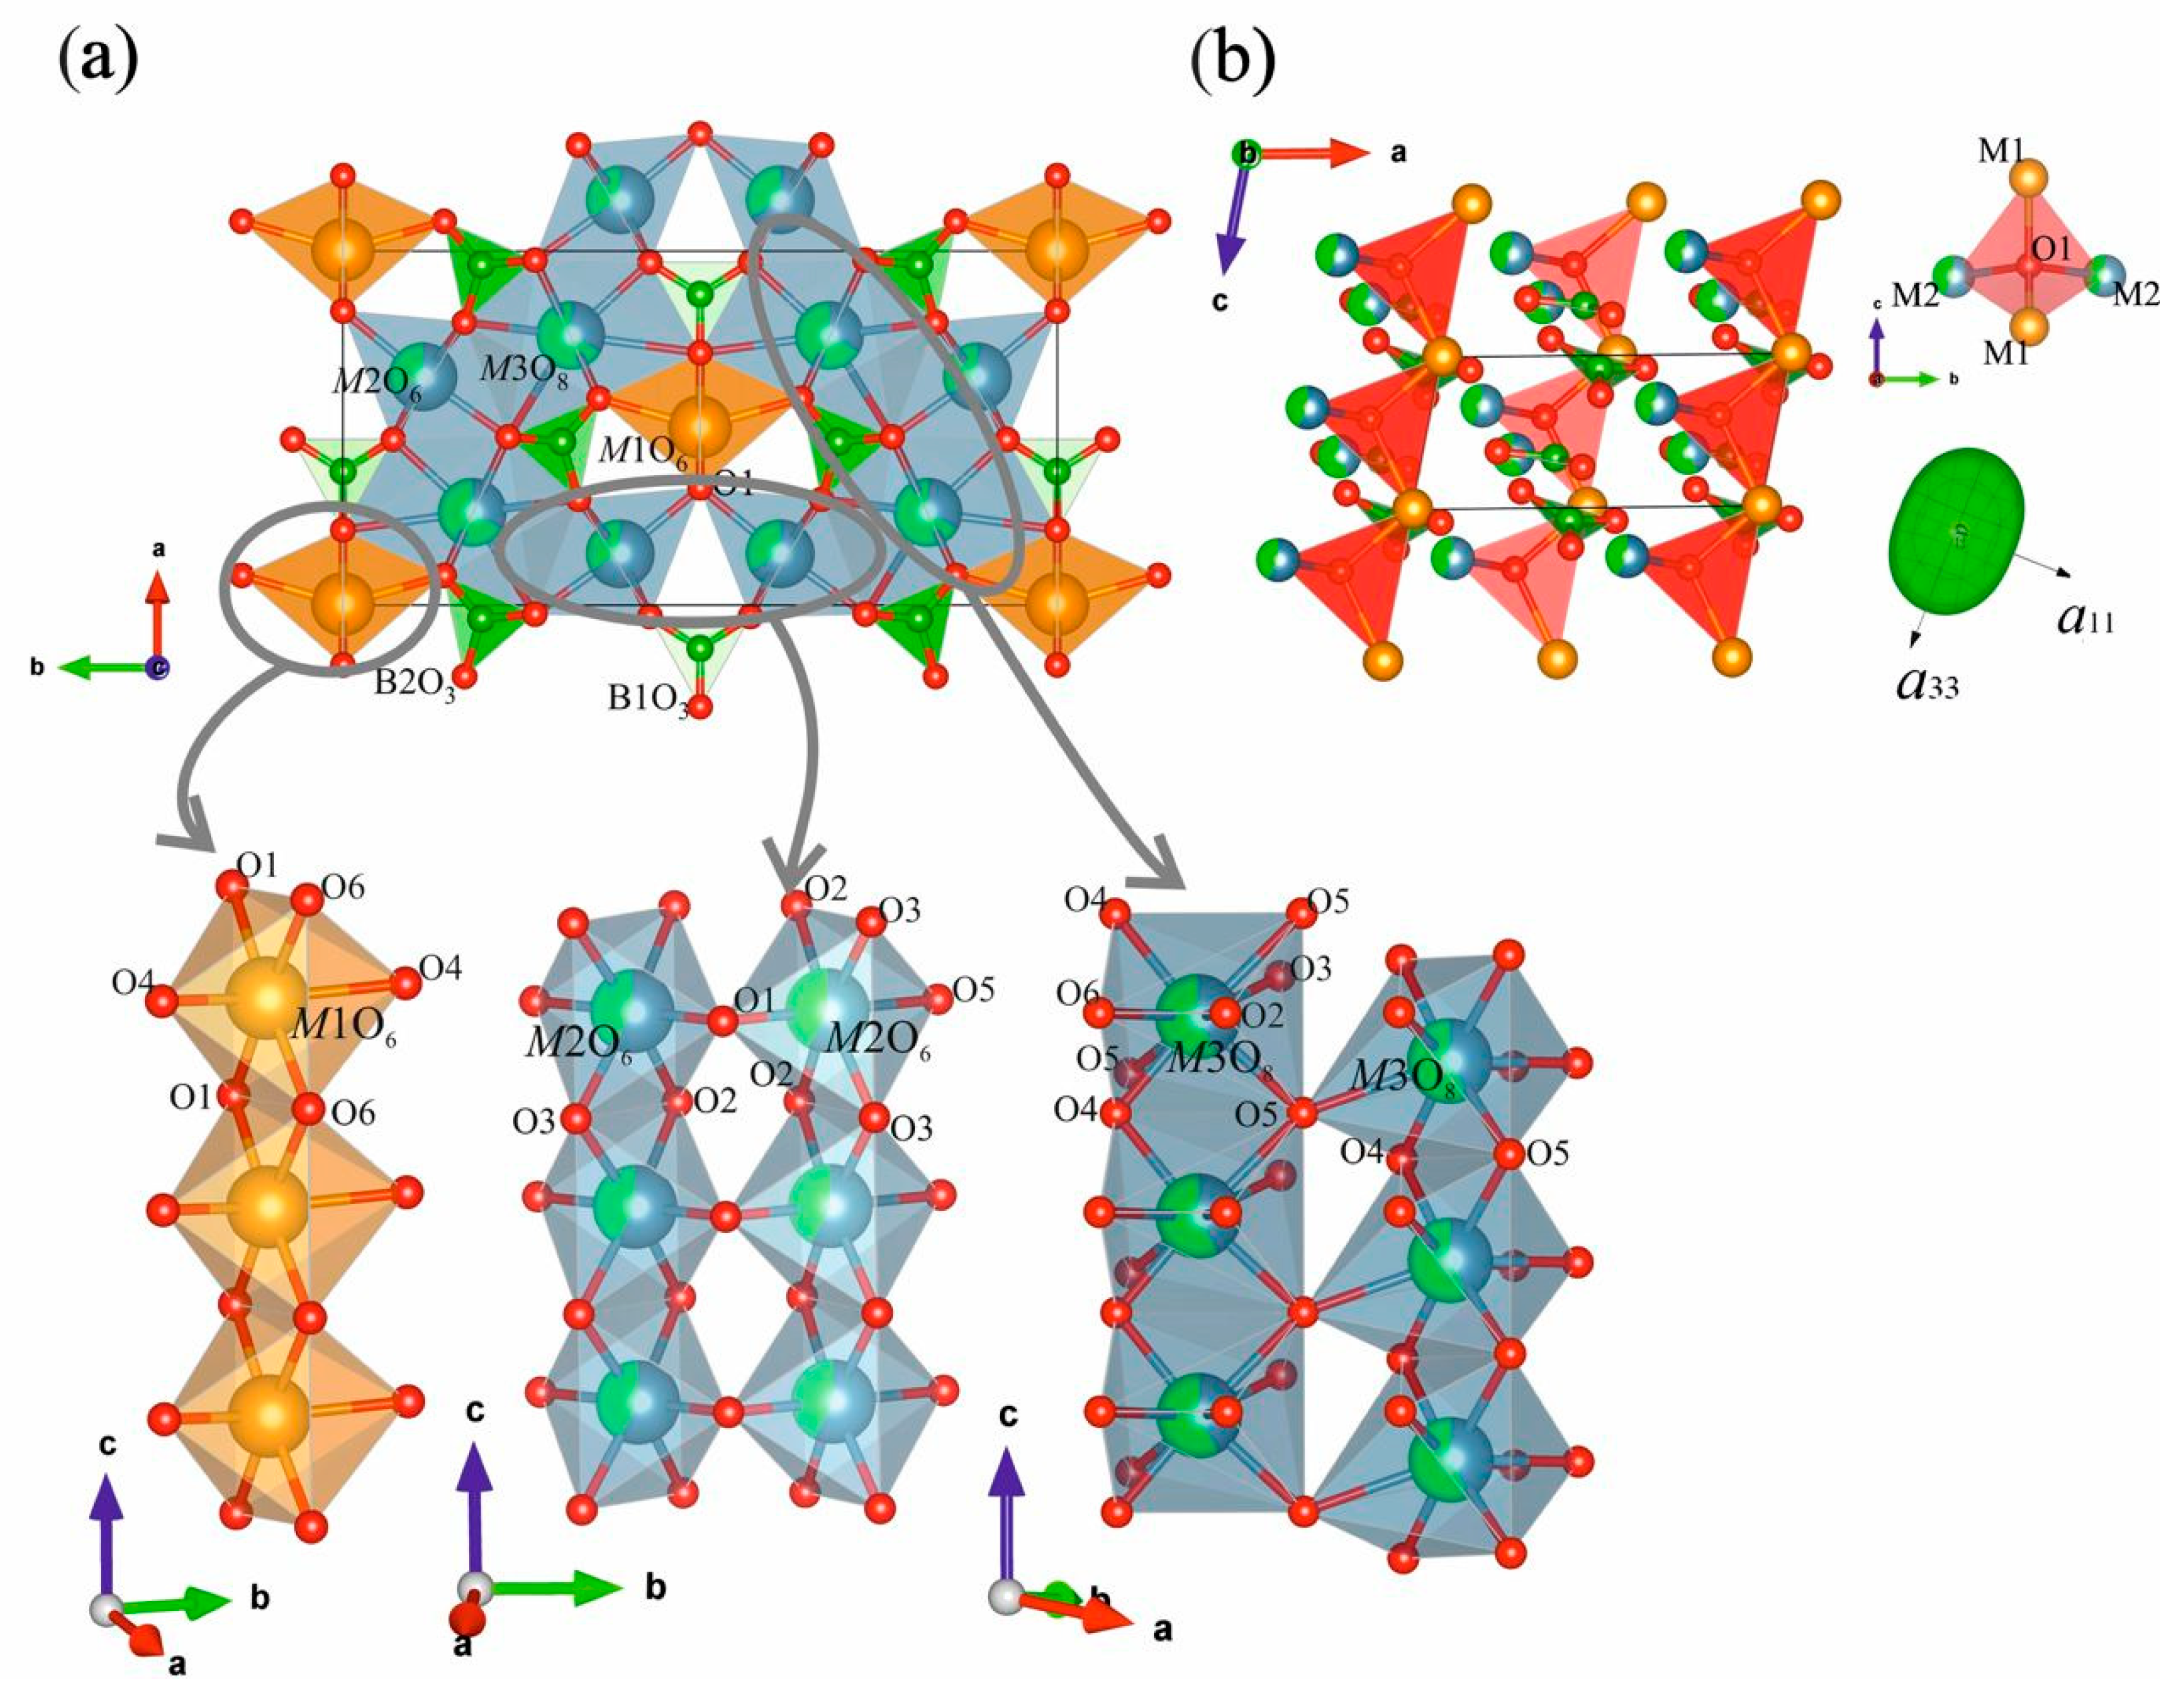
The crystal structures of Nd(Ca1−xSrx)4O(BO3)3 borates consist of four groups: M1, M2, M3 polyhedra and two independent isolated [BO3]− groups (Figure 2a). In all structures, M1 and M2 are both six-coordinated polyhedra and M3 is an eightfold-coordinated one. While two of the eight M3—O bond lengths are significantly longer than the other six (Table S7), the M3 site may be treated as eight-coordinated. In the compounds, the ‘long’ M3—O bond lengths are all greater than 2.90 Å whereas the other bonds range 2.35–2.65 for x = 0.2 and 2.39–2.71 Å for x = 0.5 (Table S7). The M1–M3 polyhedra are either edge or corner-connected. There are three edge-linked polyhedral chains along the c axis: M1 octahedra are connected via O1—O6 edges to form single chains; M2 and M3 polyhedra—via O2—O3 and O4—O5 edges to form double chains (Figure 2a, bottom), respectively. These chains are connected by the vertices of the polyhedra to form a cationic framework. The M3O8 polyhedra share edges with trigonal planar [BO3]− groups, which are tilted at different angles relative to the ab-plane.
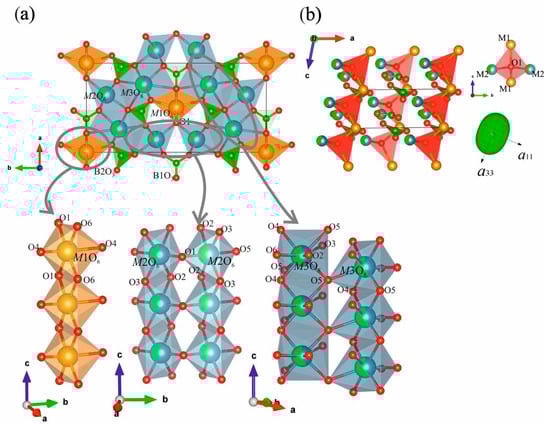
Figure 2.
View of the Nd(Ca0.5Sr0.5)4O(BO3)3 crystal structure in terms of cation-centered polyhedral along the c axis (a, top left), chains of M1–M3 edge-shared polyhedra extended along the c axis (a, bottom left), the Nd(Ca0.5Sr0.5)4O(BO3)3 structure in the ac-plane in terms of oxy-centered polyhedra (b) and the figures of thermal expansion tensor of this solid solution.
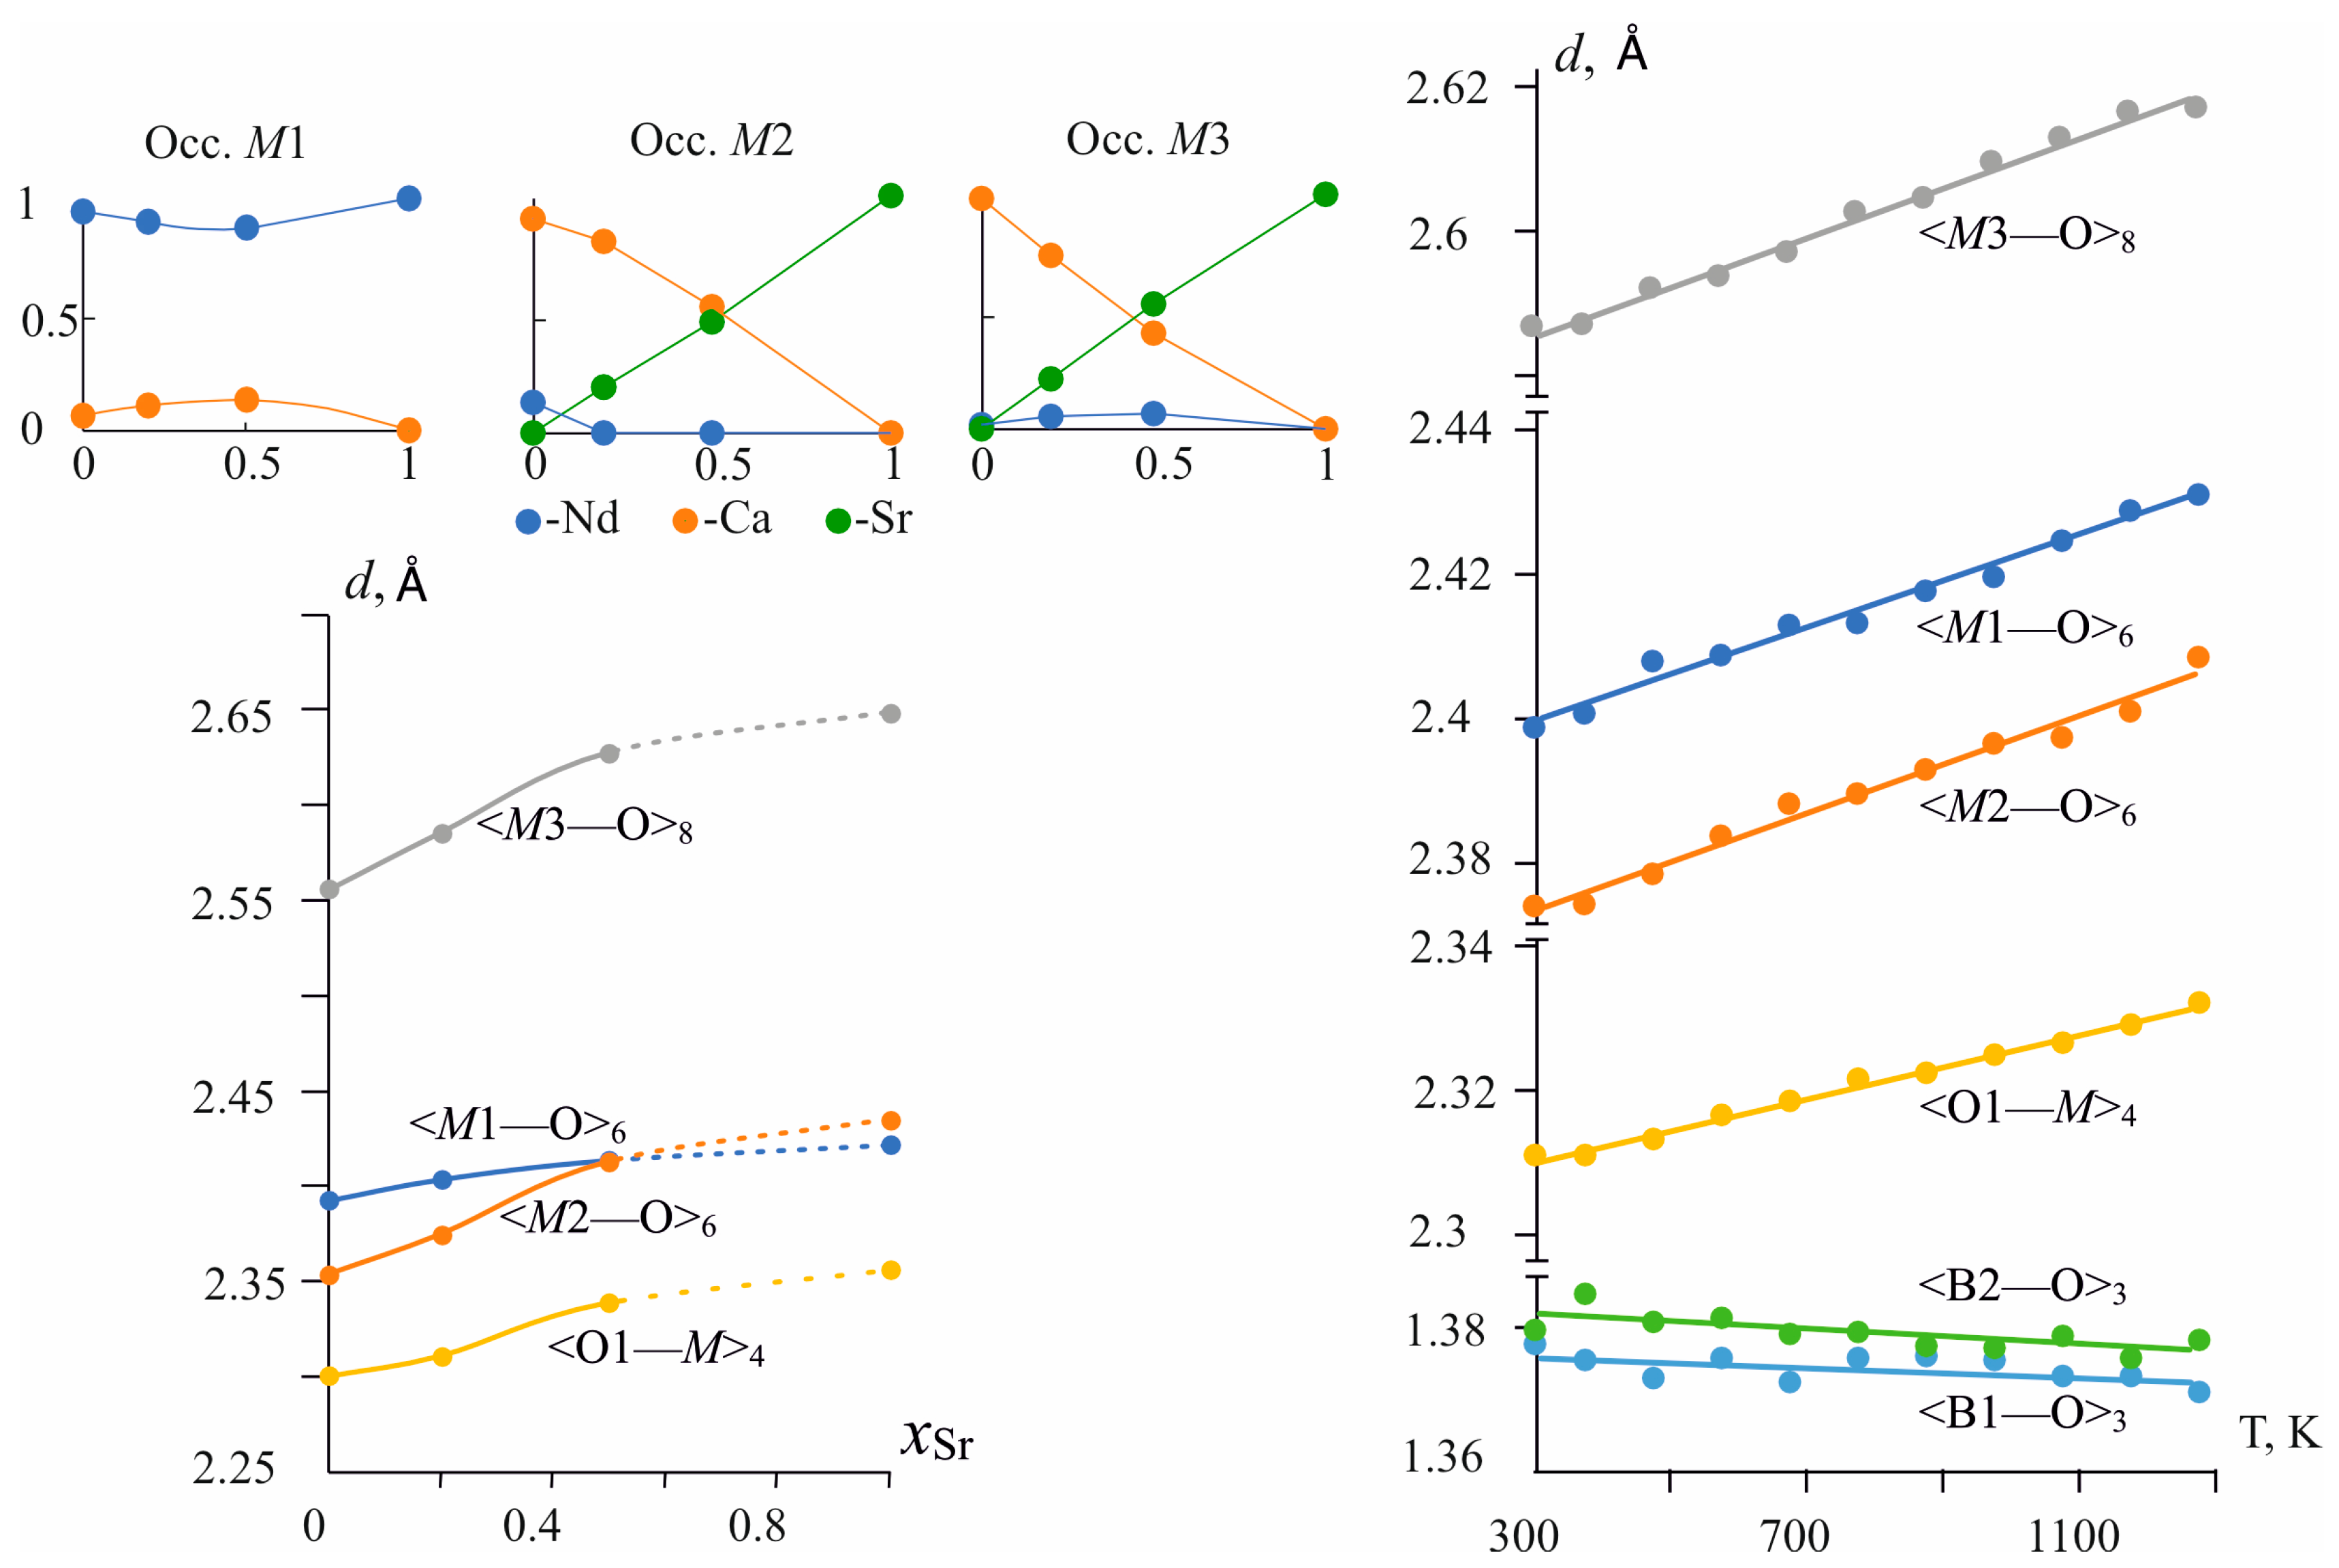
Upon the Ca → Sr substitutions, the average bond length in the M1O6 octahedra is practically constant. It increases by 0.03 Å, while the average bond lengths in M2O6 and in M3O8 polyhedra increase by 0.08 Å and 0.09 Å, i.e., approximately three times more (Table 2 and Table S7). The <M2—O> average bond length increases from 2.354 Å [20] to 2.435 Å, <M3—O>—from 2.556 Å to 2.65 Å, while the <M1—O> bond length in M1O6 polyhedra—from 2.40 to 2.42 Å (Figure 3 bottom left, Table 2 and Table S7). Individual bond lengths change more sharply a few of them are even reduced, such as d(M1—O4) decreased by −0.03 Å. The bonds located close to the c axis and connecting the polyhedra in chains, for example, the M1—O6 bonds by 0.12 Å, M2—O1 by 0.08 Å, and the M3—O5 by 0.06 Å, are more elongated. This correlates with the maximum γ33 axis of the compositional deformation tensor, which is also located close to the c axis (see § 3.3.2). While the contracting bonds are located near the perpendicular direction, the chains, expanding in a direction close to the c axis, have to contract in the framework slightly.
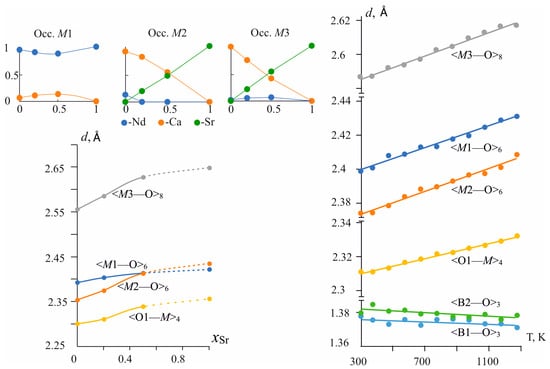
Figure 3.
Distribution of cations over M1–M3 positions (top left), changes of average bond lengths in the cationic M1–M3 polyhedra and oxy-centered OM4 tetrahedra versus chemical composition (bottom left) and temperature (right).
The reason for structural changes is obvious in the partially ordered substitution of Ca2+ by Sr2+ ions in the M1–M3 positions. Since the M1 position is predominantly occupied by Nd3+ ions, the substitution does not strongly affect the average bond length in the M1O6 polyhedron. As Ca2+ ions are replaced by Sr2+ ones, the latter are gradually distributed over the M2 and M3 positions approximately equally (Figure 3 top left), although among M1–M3 polyhedra it is the M3O8 polyhedron that is the largest and most distorted, i.e., it could be expected that it would be mainly filled with strontium. Note that in NdCa4O(BO3)3 M2O6 is the smallest and least distorted octahedron; however, it becomes larger than the M1O6 octahedron (Figure 3 bottom left), as Ca2+ ions are replaced by Sr2+ ones due to the larger size of Sr2+ ions. In the case of solid solutions, the Ca, Sr and Nd cations are more randomly distributed over the M1–M3 sites than in the new NdSr4O(BO3)3 borate, in which they are completely ordered. In the RCOB family, REE and Ca cations are completely ordered in the case of large REE ions, such as La [40] (ICSD #93152); [41] (ICSD #180596), and they are disordered as the radii of REE decrease [20]. For instance, for LuCa4O(BO3)3 [3] (ICSD #39718), the cationic distribution is the following: Occ M1 0.64, Ca 0.36; M2: Ca 0.82, Lu 0.18: M3 Ca 1.
Both [BO3]− triangles are tilted at different angles from the ab-plane. The tiltings of each of these borate groups are 12.66° and 34.59° for x = 0.2, 13.53° and 34.78° for x = 0.5, and 13.23 and 34.32 for x = 1.0. Some studies [34,42] found that the tilting of these borate groups changed regularly as the size of the lanthanide ions varied.
There are O1 oxygen atoms not linked with boron. Hence, this crystal structure can be described in terms of oxy-centered polyhedra (Figure 1b). Additional oxygen atoms have [O(1)M(1)2M(2)2] tetrahedral coordination and form corner-shared chains along the c axis. Compared to an increase in average bond lengths in M1–M3 polyhedra, the average bond length in OM4 tetrahedra increases weaker (Figure 3 bottom left) hence, an oxy-centered OM4 tetrahedron could be considered as the rigid structural unit. A weak increase of the tetrahedron is caused by the substitution of smaller Ca atoms with larger Sr ones in the M2 position, which leads to the elongation of O1—M2 bonds and an increasing c parameter.
The major contribution to the optical non-linearity originates from the [BO3]− groups that form delocalized π-type bonds perpendicular to the [BO3] plane. The CaO6 octahedra share corners with the [BO3] group. The Sr—O—B bonding angles will be more stretched compared to the Ca—O—B bonding since the radius of the Sr2+ ion is larger than that of the Ca2+ ion, resulting in a more distorted p-type electron cloud in the BO3 group. The M1—O4—B2 angles are equal to 109.8°, 111.9° and 113.4°; M3—O5—B2—121.8°, 123.1° and 121.6° for x = 0.2, 0.5 and 1, respectively. The other bond angles vary within the error. It is possible that these changes in angles affect the π-bonds of borate triangles and, accordingly, their non-linear optical properties.
3.3. Compositional versus Thermal Properties in Nd(Ca1−xSrx)4O(BO3)3 Solid Solutions
It is well known [43,44,45,46,47] that in compounds with a mainly ionic character, the replacement of a smaller cation by a bigger one changes the crystal structure in a similar way to heating. The coefficient of the thermal expansion αa = (1/a)(da/dt) is analogous to the coefficient of the compositional deformation γa = (1/a)(da/dx), where x, the compositional parameter, is a characteristic of the chemical composition [46]. Thus, we can calculate the compositional equivalents of the thermal expansion [46].
3.3.1. Thermal Expansion
The thermal behavior of Nd(Ca1−xSrx)4O(BO3)3 solid solutions with x = 0, 0.2 and 0.5 was investigated within a temperature range of 25–1000 °C from powder HTXRD data. Within this range, only the diffraction peaks of the Nd(Ca1−xSrx)4O(BO3)3 solid solutions were observed for x = 0 and 0.2, while for x = 0.5, with further heating above 900 °C, weak additional reflections marked as stars in Figure S2 appeared in the HTXRD patterns at approximately 900 °C. Apparently, this solid solution starts to decompose. By the way, anomalies in the HTXRD patterns at approximately 900 °C were noted in [27].
The unit cell parameters increase in heating from 25 °C to 1000 °C for all phases (Figure 4). For x = 0.5, a distinctive convex bend was found in the range of 400–600 °C in the temperature dependence of the monoclinic β angle. The deviation from the “linear” growth of the parameters can probably be caused by the redistribution of Nd3+, Ca2+ and Sr2+ cations over the M1–M3 sites with temperature. Temperature dependencies of the monoclinic unit-cell parameters and the volume of Nd(Ca1−xSrx)4O(BO3)3, x = 0.0, 0.2 and 0.5, were approximated independently using quadratic polynomials in the temperature range 25–800 °C, in which no phase transformations occur (Table S10). Thermal expansion coefficients along principal axes of the tensor and its orientation in the monoclinic plane defined by µ1a angle equal to the angle between α11 and a axis, as well as coefficients along crystallographic axes and volume for Nd(Ca1−xSrx)4O(BO3)3 (x = 0, 0.2, 0.5) solid solutions, are given in Table 3.
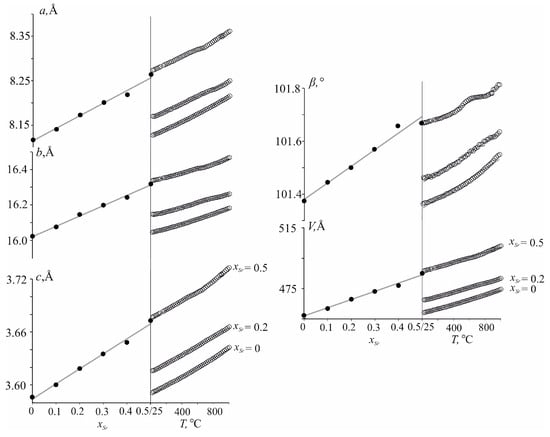
Figure 4.
Dependencies of unit-cell parameters of the Nd(Ca1−xSrx)4O(BO3)3 versus chemical composition (left) and temperature (right). E.s.d. for the cell parameters is comparable with the size of the data points.
Table 3.
Thermal expansion coefficients α (×10−6 °C−1) along principal axes of tensor and along crystallographic axes for Nd(Ca1−xSrx)4O(BO3)3 (x = 0, 0.2, 0.5).
The structures expand to their maximum along the α33 axis of the thermal expansion tensor, which is close to the c axis, where edge-shared chains of M1–M3 polyhedra extend in parallel in the cationic framework of the structure. Almost perpendicular to the c axis, the planes of the BO3 triangles are also located, which may be the reason for the greater expansion of the structure perpendicular to the planes of the triangles in accordance with the principles of high-temperature crystallochemistry of borates [48].
3.3.2. Compositional Properties
In Figure 4, the compositional deformations of the Nd(Ca1−xSrx)4O(BO3)3 oxoborates are compared with the thermal expansion using the procedure developed by Filatov [46]. Compositional dependencies of the cell parameters for Nd(Ca1−xSrx)4O(BO3)3 were approximated linearly within 0–0.5: a = 8.1133(44) + 0.0292(14)x, b = 16.0241(58) + 0.0586(16)x, c = 3.5844(22) + 0.01709(69)x, β = 101.391(11) + 0.0583(4)x, V = 456.7560 + 5.4970980x. The linear equations for temperature dependence of the Nd(Ca0.5Sr0.5)4O(BO3)3 unit-cell parameters were: a = 8.27172(31) + 0.00008213(65)t, b = 16.333360(45) + 0.00012072(96)t, c = 3.67479(19) + 0.00005123(39)t, β = 101.6544(23) + 0.1545(51)t, V = 486.2392 + 0.0150446t (Figure 4). The compositional and thermal expansions of Nd(Ca0.5Sr0.5)4O(BO3)3 lead to similar changes in the linear (a, b and c) and angular (β) parameters and the V volume, as well as in the principal axes of both tensors and their orientation. Thus, the structure of the Nd(Ca0.5Sr0.5)4O(BO3)3 solid solution of RCOB family type undergoes similar distortions upon heating (Figure 4, right side) and with increasing the Sr2+ ion content in Nd(Ca1−xSrx)4O(BO3)3 (Figure 4, left side). Eigenvalues (γ11, γ22, γ33) of the tensor of the compositional deformation, γaver and γV are given in Table 4. For compositional deformations µ1a, the angle between α11 and a axis equal to 27° is comparable with the same angle (23–27° of the thermal expansion tensor (Table 4).
Table 4.
Thermal (α) and compositional (γ) deformation coefficients and their equivalents (α/γ) for NdCa4O(BO3)3, Nd(Ca0.8Sr0.2)4O(BO3)3 and Nd(Ca0.5Sr0.5)4O(BO3)3.
For quantitative comparison, one can use the compositional equivalent of the thermal expansion, α/γ (0.01 at% Sr/°C) [46]. The average compositional equivalent of the thermal expansion of the Nd(Ca0.5Sr0.5)4O(BO3)3 structure is calculated to be 0.00026 at% Sr/°C (Table 4, (α/γ)aver = αV). This means that heating Nd(Ca0.5Sr0.5)4O(BO3)3 by 1 °C leads to the same deformations as increasing the Sr2+ ion content in the compounds by 0.26 at%. The closeness of (α/γ)11, (α/γ)22 and (α/γ)33 (0.28, 0.21 and 0.29 at%/°C) to the average value (0.26 at%/°C) indicates a high degree of similarity of the deformations occurring with changes in temperature and chemical composition.
3.3.3. Temperature-Dependent Structural Evolution of Nd(Ca0.8Sr0.2)4O(BO3)3 Solid Solution from Single-Crystal XRD Data
To expand our knowledge of the structure response to increasing temperature, we investigated the temperature-dependent structural behavior of Nd(Ca0.8Sr0.2)4O(BO3)3 solid solution in the range of 300–1273 K. First, we examine the thermal redistribution of Nd, Ca and Sr cations over M1–M3 positions. It turned out that the redistribution of cations does not exceed 5–10%.
The thermal expansion of unit-cell parameters of the solid solution is discussed in Section 3.3.2 and here we present data on the thermal expansion of bonds in the Nd(Ca0.8Sr0.2)4O(BO3)3 solid solution. Individual and average bond lengths increase with temperature (Figure S4, Table S9). Changes in individual bond lengths vary from 0.012 Å to 0.072 Å. As a rule, stronger increases offer enough long bond lengths; for example, in an M1O6 octahedron (M1—O6) bond, the length equal to 2.515 Å at room temperature increases by 0.072 Å, for others see Table S9. In spite of the difference in oxygen atoms surrounding the M1–M3 positions (C.N. range from six to eight), the change in the average <M—O> distances with temperature is almost the same for all of the polyhedra (approximately 0.003 Å between 300 K and 1273 K) (Figure 3, right, Table S9). The coefficients of thermal expansion calculated for average distances of the M—O bond lengths are <αM1—O> = 13.2 × 10⁻⁶ °C−1, <αM2—O> = 14.0 × 10⁻⁶ °C−1, <αM1—O> = 13.0 × 10⁻⁶ °C−1. These values are in good agreement to data for average distances of the M—O bonds equal to <αCa[CN 6]—O> = 13.8 × 10⁻⁶ °C−1 for Ca, <αSr[CN 6]—O> = 13.8×10⁻⁶ °C−1 and <αSr[CN 8]—O> = 16.4 × 10⁻⁶ °C−1 from [45,49].
In the oxy-centered tetrahedra, O1M4 bond lengths weakly increase with temperature increasing (Figure 3, right, Table S9). Thermal expansion calculated for an average distance of the O1—M bond length is <αM1—O> = 9 × 10⁻⁶ °C−1 that is one and a half times less than the <αM—O> in M1–M3 polyhedra. This indicates more significant rigidity in this group.
Individual B—O bond lengths within [BO3] triangular groups practically do not change with temperature, and even most of them decrease slightly (Table S9). The average B—O bond lengths are also almost constant with temperature: the changes in the <B—O> lengths are −0.002 and −0.007 Å (Figure 3, right, Table S9). This contraction of bond lengths seems to be an artifact of the X-ray diffraction method. The effect of thermal motion on the estimation of bond lengths from a diffraction experiment is well known and described in detail [47,48,50,51]. The B—O bonds seem to be a very rigid group, as the whole vibrates as a rigid body motion that leads to a slight decrease of the boron–oxygen distances with a temperature increase from XRD data. The refinement of the anisotropic parameters of thermal vibrations for the O atoms demonstrates that the vibration amplitudes increase approximately twice (1.9–2.5). Groups are located in a preferred orientation that dictates the anisotropy of thermal expansion in the direction perpendicular to plane triangles (Figure 3, right).
3.4. Melting Processes of Nd(Ca1−xSrx)4O(BO3)3 Solid Solutions from DCS Data
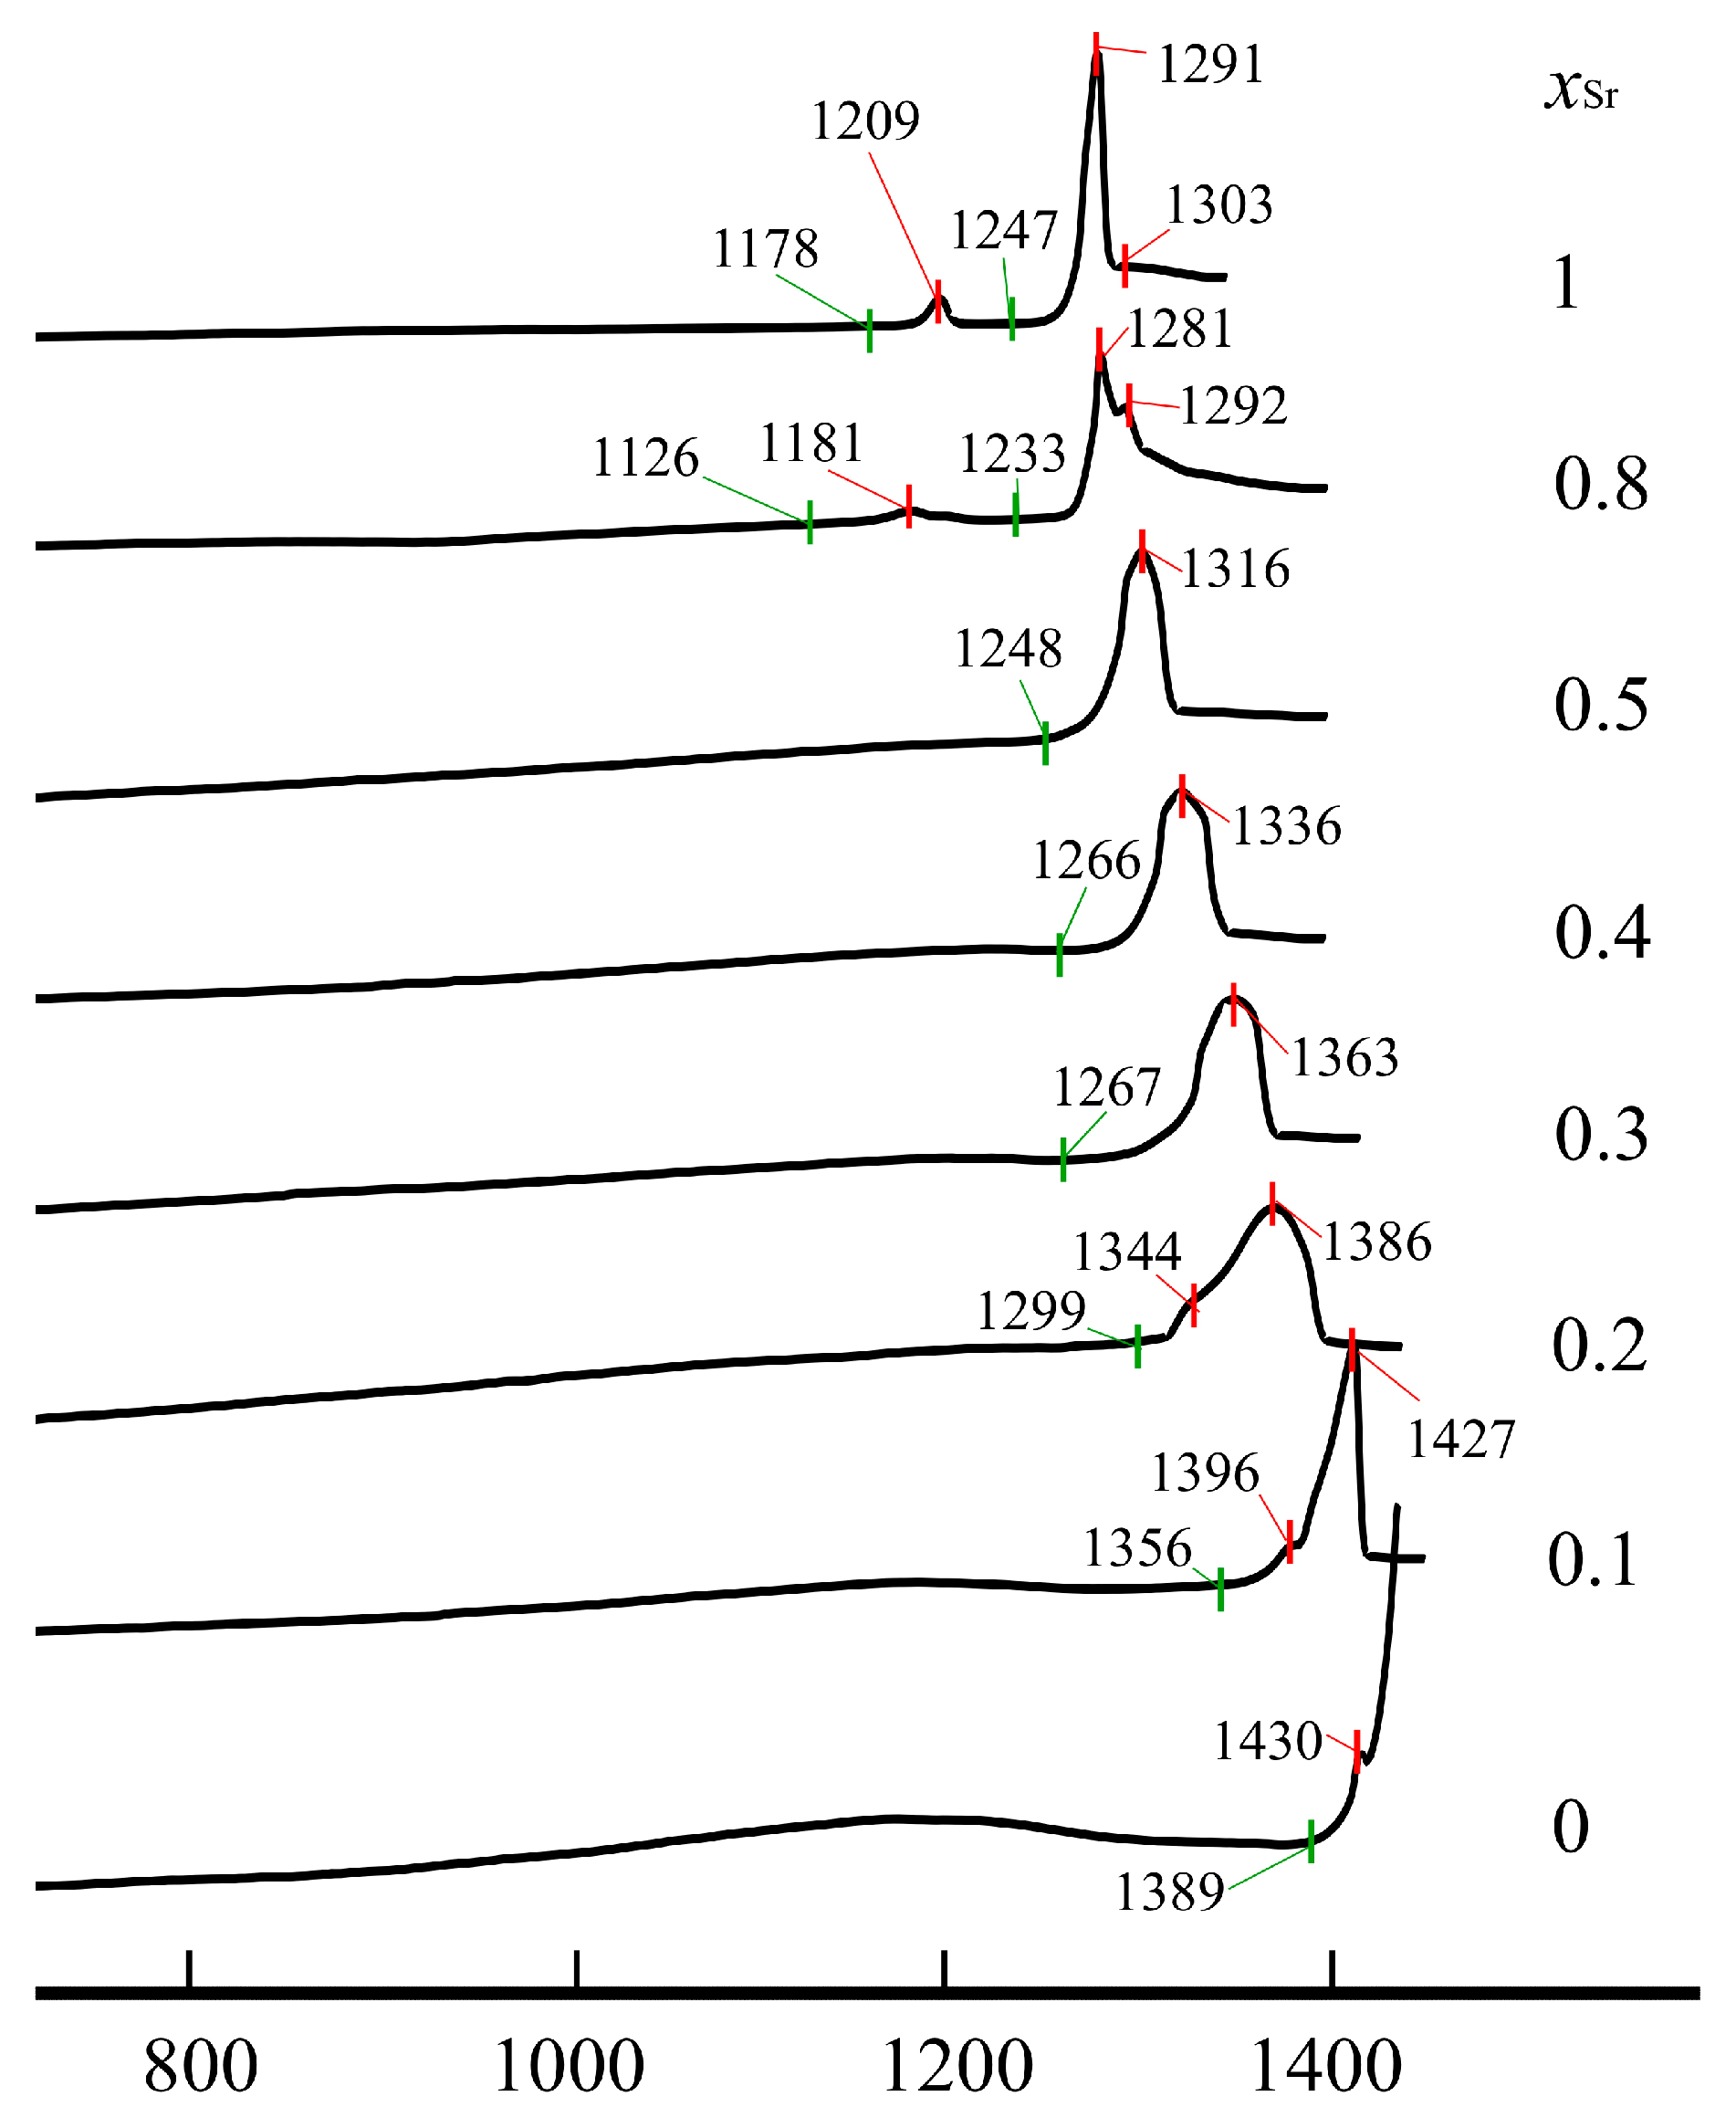
DSC curves on heating of Nd(Ca1−xSrx)4O(BO3)3 samples demonstrate strong thermal endothermic effects corresponding to melting processes (Figure 5): onset temperatures for homogeneous solid solutions melting (x = 0–0.5) decreased from 1389 °C to 1246 °C (1389, 1356, 1299, 1267, 1266, 1246 °C for x = 0, 0.1, 0.2, 0.3, 0.4 and 0.5, respectively) as well as the temperature of maximum endothermic effects from 1455 °C to 1316 °C (1455, 1427, 1386, 1363, 1336 and 1316 °C) as Ca is replaced by Sr. This is due to the fact that the strength of the Ca—O bonds is shorter and therefore weaker than the Sr—O bond strength; therefore, with an increase in the content of Sr ions, a decrease in the temperature of solid solutions can be expected. The peaks corresponding to the melting of solid solutions are broadened, especially for x = 0.2 and 0.3 (Figure 5), due to melting processes occurring in a two-phase region—here recrystallization in the presence of a liquid phase takes place. Overlapping peaks can be split, as in samples with x = 0.1 and 0.2, where the first weak peaks (1396 and 1344 °C for x = 0.1 and 0.2) might be attributed to solidus temperature while the strong peaks are to liquidus temperature. It is noteworthy that the difference in liquidus and solidus temperatures decreases to x = 0.5. Multiphase samples melt by eutectic reaction. In the case of insignificant second phase amounts, peaks appeared before strong peaks, such as in the sample with x = 1, where there are two peaks, a small one at 1209 °C according to the eutectic point and a strong one at 1291 °C—liquidus point—in the binary eutectic NdSr4O(BO3)3–Sr3B2O6 system. In the case of three phases existence, first, apparently a small ternary eutectic mix melts at 1181 °C, then the endothermic effect at 1281 °C corresponds to liquius temperature in the ternary system, and the endothermic effect at 1281 °C could be interpreted as liquius temperature in the binary system (Figure 5).
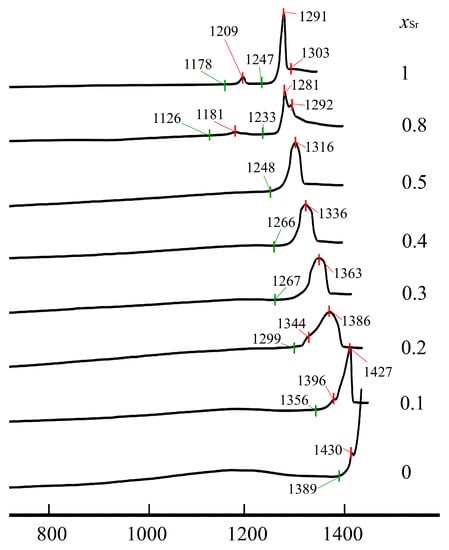
Figure 5.
DCS heating curves of Nd(Ca1−xSrx)4O(BO3)3 samples after heat-treatment at 1300 °C.
On the cooling curves, crystallization occurs at a lower temperature due to hysteresis in the melting and crystallization temperatures. It is noteworthy that the hysteresis reaches a maximum in solid solutions up to 70–80 °C for x = 0.2, 0.3 and decreases in single chemical compounds and multiphase samples to 20–40 °C.
3.5. Raman Spectra
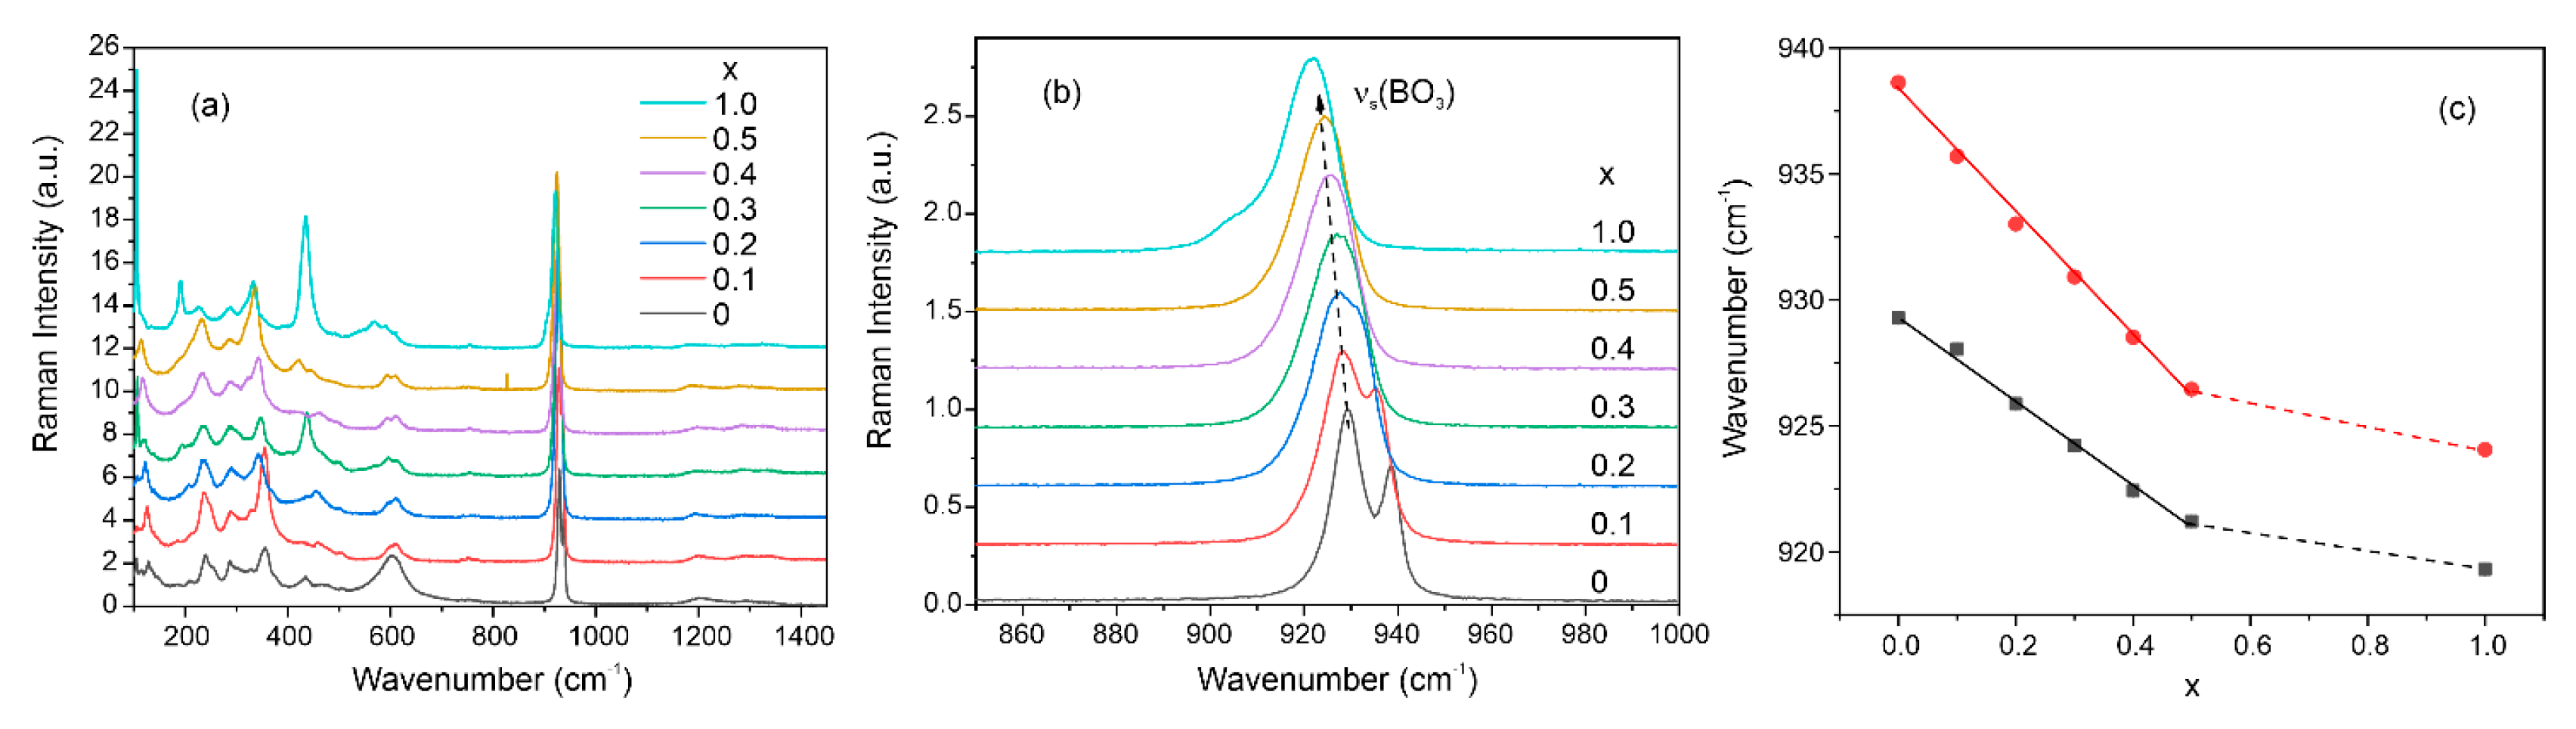
Raman spectra of the Nd(Ca1−xSrx)4O(BO3)3 samples are presented in Figure 6a. Peaks below 500 cm−1 associated with libration modes of the (BO3) matrix units. The wide peak around 600 cm−1 corresponds to the bending vibrations of (BO3) triangles. The most intensive peak in the region of 925 cm−1 is associated with symmetric stretching vibrations νs(BO3) [52]. This peak consists of two bands, the position of the maxima of which shifts to the low-frequency region with an increase in the concentration of strontium in the samples (Figure 6b). The presence of two bands is probably due to two symmetrically independent boron atoms, as was shown in the structural part. In this case, with an increase in the Sr concentration, the position of both maxima shifts linearly towards low frequencies (Figure 6c). According to one of the theoretical models, the shift of the phonon band towards low frequencies can be associated with an increase in mass upon isovalent substitution in a solid solution [53]. For example, this shift is observed in Ca3(BO3)2 and Sr3(BO3)2 crystalline samples [54].
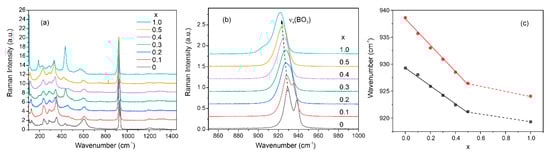
Figure 6.
Raman spectra of Nd(Ca1−xSrx)4O(BO3)3 samples (a); νs(BO3) peaks shift (b); dependencies of νs(BO3) peaks maxima on the Sr concentration (c).
3.6. Optical Bandgap
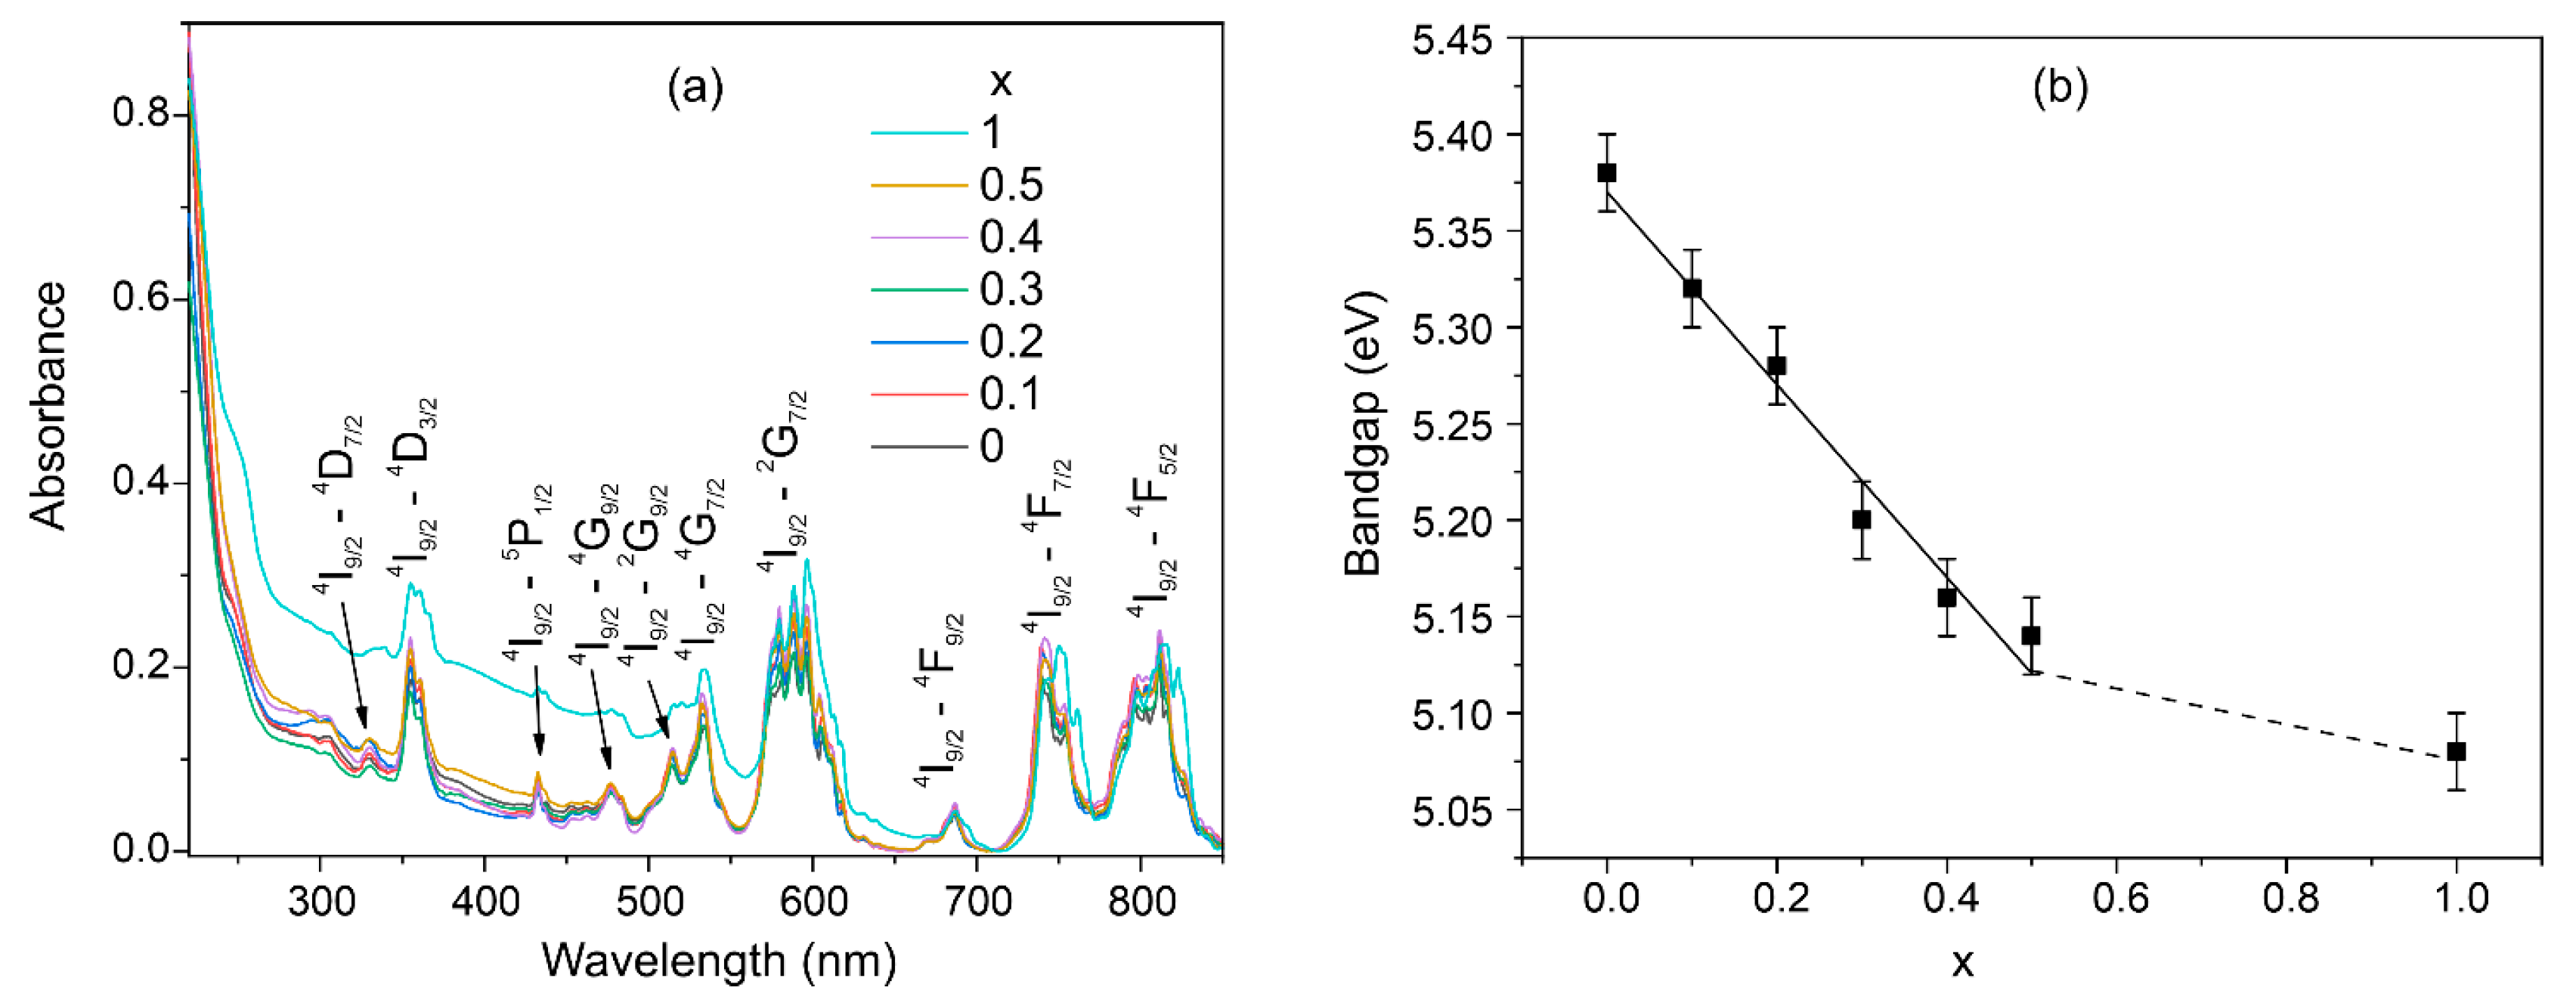
The absorption spectra show a set of bands that all correspond to neodymium transitions (Figure 7a). It should be noted that the concentration of Nd3+ ions in the samples is so high that no luminescence is observed due to concentration quenching. In the spectral region below 250 nm, a blue edge of the transparency window is observed, which is associated with fundamental absorption. The position of the fundamental edge of optical absorption was used to determine the optical band gap using the Tauc plot graphics. It was found that there is a decrease in the optical band gap when calcium is substituted by strontium ions (Figure 7a). This is consistent with the theory of the influence of the mass of substituting ions on the band gap [53].
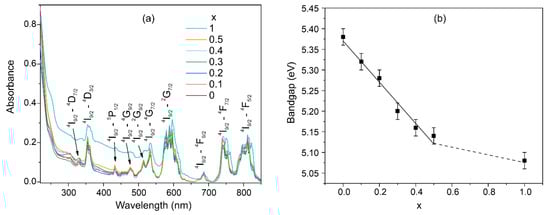
Figure 7.
Absorption spectra of the Nd(Ca1−xSrx)4O(BO3)3 samples (a); dependence of optical bandgap on the Sr concentration (b).
3.7. Second Harmonic Generation
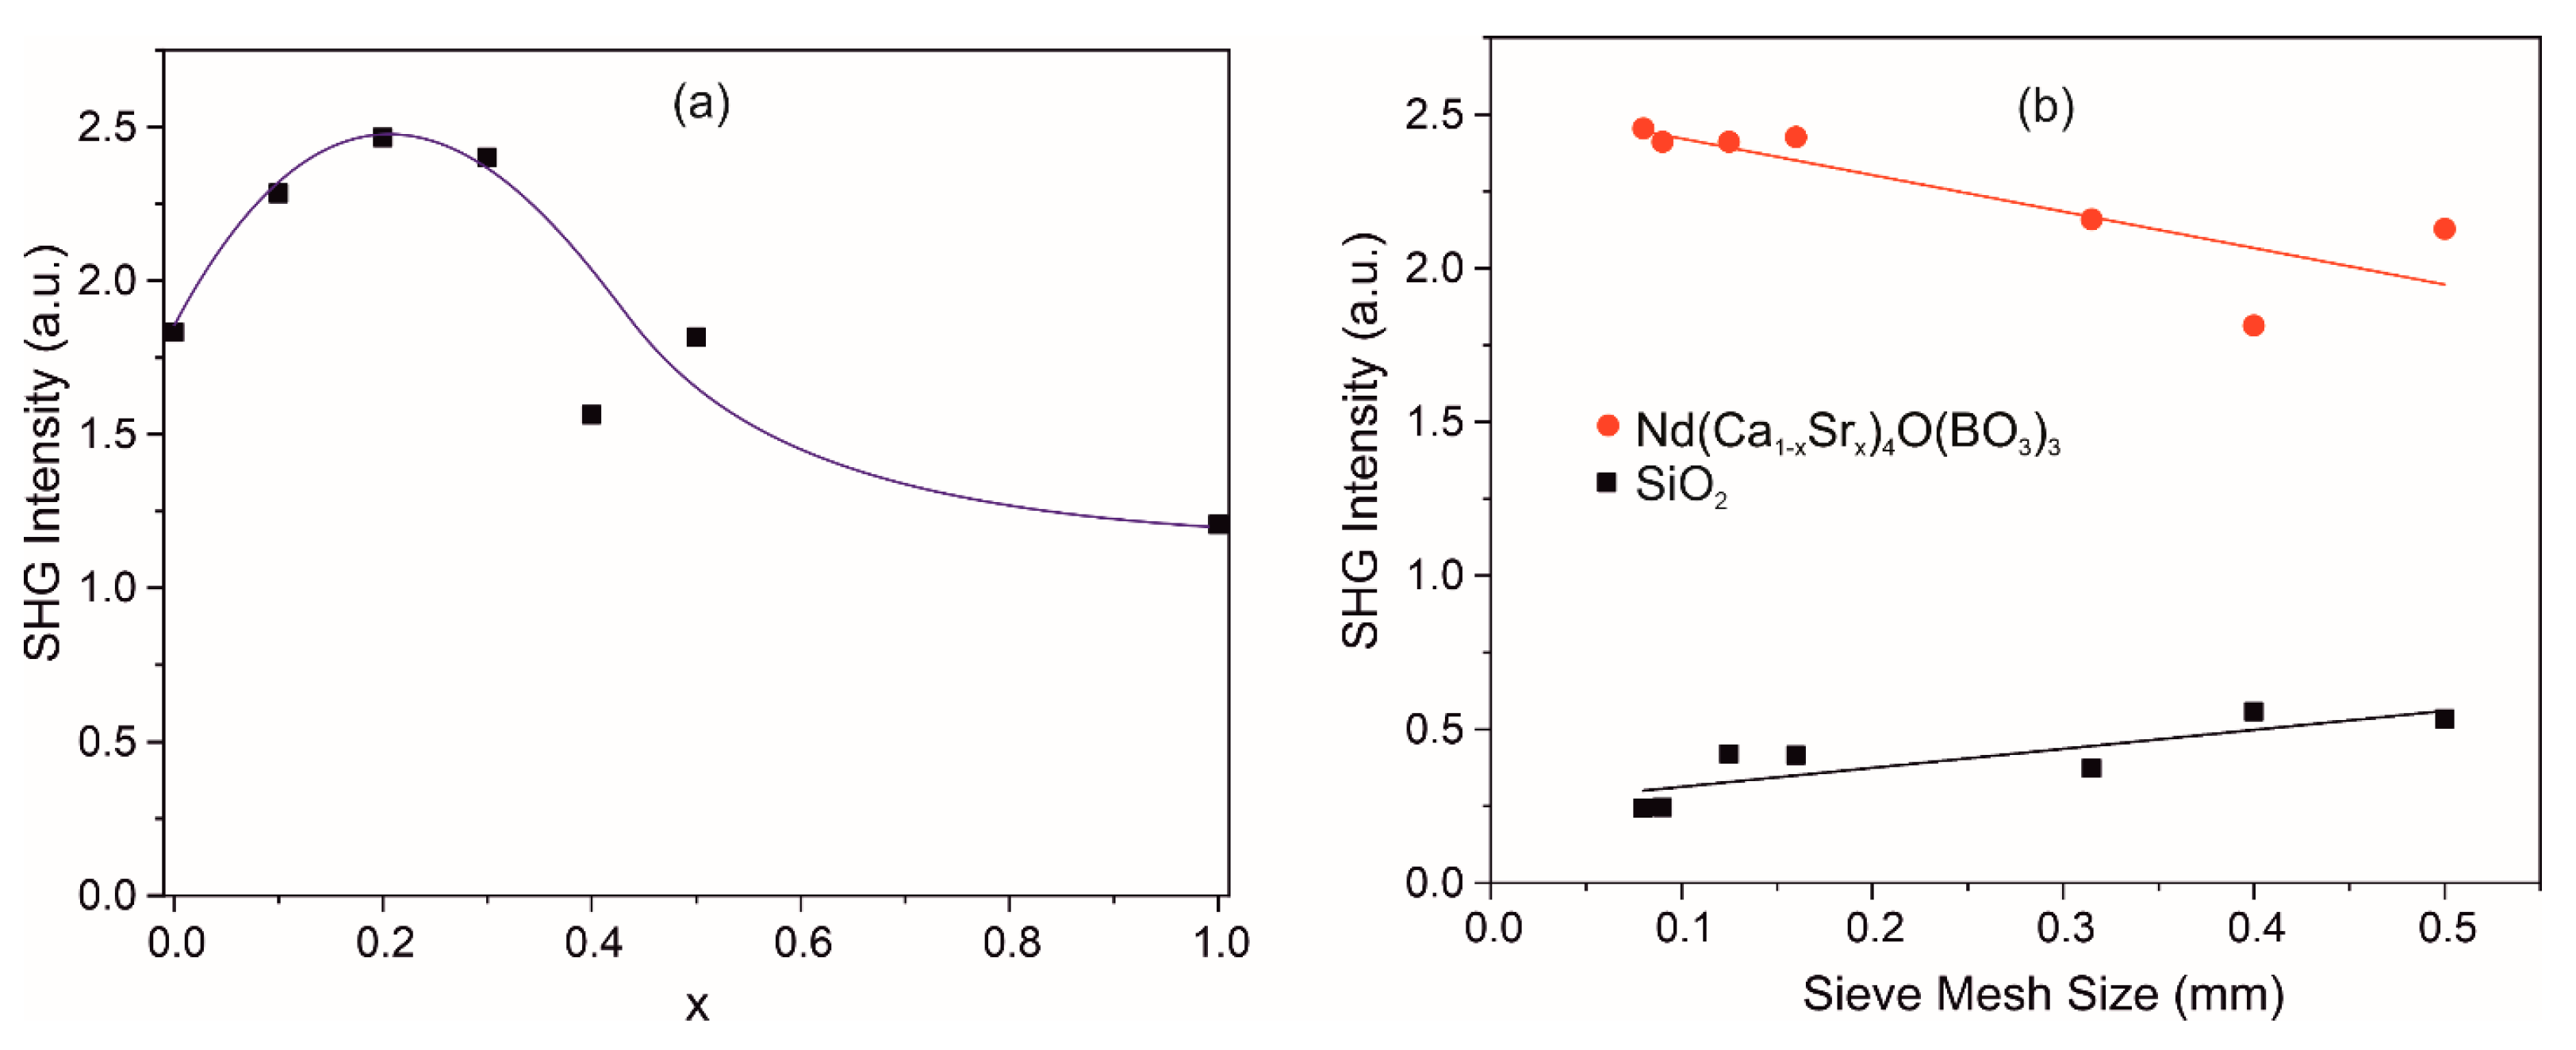
SHG signal was recorded for the Nd(Ca1−xSrx)4O(BO3)3 samples under otherwise equal conditions, which makes it possible to qualitatively estimate the efficiency of light conversion into the second harmonic of the investigated solid solutions (Figure 8a). The obtained experimental results show that the optical nonlinearity of the Nd(Ca1−xSrx)4O(BO3)3 crystals can be improved with partial substitution of Sr2+ ions for Ca2+ ions in the crystal up to x = 0.2. To determine the SHG efficiency, the obtained results were compared with the results of crystalline quartz with the same particle size distribution (Figure 8b). Obviously, the synthesized solid solutions demonstrate an order of magnitude better ability to generate the second harmonic compared to crystalline quartz, although the SHG response shown in Figure 8b is indeed not typical. This is most likely due to the peculiarities of the polycrystalline samples, where microparticles are agglomerates of smaller particles. Probably, in the samples with different sizes of granules, not all agglomerates were separated into individual particles, which led to the dependence of SHG response.
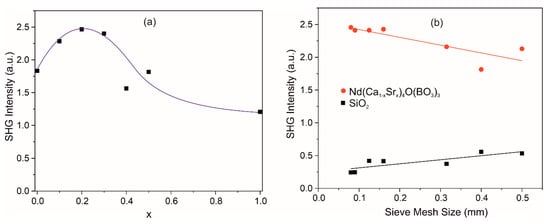
Figure 8.
SHG signal dependence on Sr concentration for Nd(Ca1−xSrx)4O(BO3)3 samples (a); SHG signal dependencies as a function of particle size for Nd(Ca0.8Sr0.2)4O(BO3)3 and SiO2 polycrystals as the reference (b).
Finally, consider the features of the structure that may affect the optical nonlinearity. In addition to the already reported factors improving the optical nonlinearity in this borate family, such as a partial substitution of Yb for Y in YCa4O(BO3)3 [19] or doping of Sr for Ca in GdCa4O(BO3)3 [22], we believe that, in accordance with the anion group theory [55,56,57,58], the significant contribution to the NLO properties originates also from the BO3 groups that form delocalized π-type bonds perpendicular to the BO3 plane. Accordingly, special attention is therefore paid in borates to the orientation of the triangular groups [48,58,59,60]. In this family [BO3], triangular groups are located at a small angle to each other (see Figure 3). Another relatively new crystal chemistry factor that can affect the optical non-linearity is the additional oxygen atom, which is not bonded to the B atom. Its role in influencing the optical nonlinearity is not quite clear; however, its influence in [61] has already been noted, apparently for the first time. It is coordinated by metal atoms and forms a rigid O1M4 tetrahedron, which leads to distortion of cationic M polyhedra. This situation is described in detail in the case of Ca-Sr substitution in GdCOB, similar to Ca-Sr substitution in NdCOB (see Section 3.2).
4. Conclusions
Novel non-centrosymmetric Nd(Ca1−xSrx)4O(BO3)3 solid solutions and a new NdSr4O(BO3)3 compound with large second harmonic generation responses were synthesized by solid-state reactions and characterized by powder and single crystal X-ray diffraction in the wide range of temperatures. It turned out that Ca ions can be replaced by Sr ones up to approximately 70% which exceeds practically twice similar substitutions in the REE(Ca1−xSrx)4O(BO3)3 solid solution seria (x = 0.35 for Gd and 0.4 for La). Moreover, a new non-centrosymmetric NdSr4O(BO3)3 borate has been obtained and structurally characterized from single-crystal XRD data, which can be a prototype of a new LnSr4O(BO3)3 series that may exhibit important properties for practical applications due to the features of the crystal structure.
The anisotropy of thermal expansion of Nd(Ca1−xSrx)4O(BO3)3 solid solutions with x = 0, 0.2, 0.5 is not very sharp (αmax/αmin < 2), it is apparently caused by thermal vibrations of rigid BO3 groups perpendicular to the plane of groups in accordance with the principles of high-temperature crystal chemistry of borates. Anisotropy of thermal expansion of Nd(Ca1−xSrx)4O(BO3)3 solid solutions (x = 0, 0.2, 0.5) is similar to compositional deformations that occur during Ca–Sr substitutions, a compositional equivalent of the thermal expansion, α/γ (0.01 at% Sr/°C) was applied.
The experimental results showed that the optical nonlinearity of the Nd(Ca1−xSrx)4O(BO3)3 crystals can be improved by the partial substitution of Sr2+ ions for Ca2+ ions up to x = 0.2 in the structure. Crystal chemistry basis may contribute to this: location of plain BO3 groups, distortions of M polyhedra as a result of Ca-Sr substitutions, existence of additional oxygen atoms tetrahedrally coordinated by M metal ions.
Supplementary Materials
The following supporting information can be downloaded at: https://www.mdpi.com/article/10.3390/cryst13091395/s1. Figure S1. XRD patterns of the Nd(Ca1−xSrx)4O(BO3)3 solid solutions synthesized at 1300 °C; Figure S2. 2D-top view of HTXRD pattern of the sample Nd(Ca0.5Sr0.5)4O(BO3)3. The dotted line indicates the beginning of the appearance of the impurity; Figure S3. Microshtographs of the planchette in the form of NdCa4O(BO3)3 before (left) and after (right) heating to 1445 °C; Figure S4. Changes of bond lengths in the cationic M1–M3 polyhedra and oxy-centered OM4 tetrahedra (top left) with increasing temperature; Table S1. Atomic coordinates, isotropic or equivalent isotropic displacement parameters (Å2) in the structure of Nd(Ca0.8Sr0.2)4O(BO3)3; Table S2. Atomic coordinates, isotropic or equivalent isotropic displacement parameters (Å2) and in the structure of Nd(Ca0.5Sr0.5)4O(BO3)3; Table S3. Atomic coordinates, isotropic or equivalent isotropic displacement parameters (Å2) and in the structure of NdSr4O(BO3)3; Table S4. Atomic displacement parameters (Å2) for Nd(Ca0.8Sr0.2)4O(BO3)3; Table S5. Atomic displacement parameters (Å2) for Nd(Ca0.5Sr0.5)4O(BO3)3; Table S6. Atomic displacement parameters (Å2) for NdSr4O(BO3)3; Table S7. Bond lengths (Å) of Nd(Ca1−xSrx)4O(BO3)3 (x = 0.2, 0.5, 1); Table S8. Crystal data and experimental details for structures of Nd(Ca0.8Sr0.2)4O(BO3)3 in the temperature range 300–1273 K; Table S9. Change in bond lengths (Å) of Nd(Ca0.8Sr0.2)4O(BO3)3 in the temperature range 273–1273 K; Table S10. Coefficients of approximation of temperature dependencies by polynomial function (pT = p0 + p1T + p2T2) of Nd(Ca1−xSrx)4O(BO3)3 (x = 0, 0.2, 0.5) solid solutions.
Author Contributions
Writing—original draft, R.B., V.Y. and A.P.; Writing—review and editing, M.K., S.F., R.B. and V.Y.; Investigation, A.Y., M.K., A.P., S.V. and V.U.; Project administration, R.B.; Data curation, V.Y., R.B. and S.F.; Visualization, A.Y., A.P., V.U. and V.Y.; Supervision, R.B. All authors have read and agreed to the published version of the manuscript.
Funding
This work was supported by the Russian Science Foundation [grant number 22-23-01133] (data evaluation and generalization, XRD and NLO-investigation, Raman and absorption spectroscopy) and the Ministry of Science and Higher Education of the Russian Federation within the scientific tasks of the Institute of Silicate Chemistry (Russian Academy of Sciences) [project number 0081-2022-0002] (synthesis).
Data Availability Statement
CCDC 2286252, 2286231 and 2286250 contain the crystallographic data for this paper. These data can be obtained free of charge via https://www.ccdc.cam.ac.uk/Community/Depositastructure/CSDCommunications/ (accessed on 2 August 2023).
Acknowledgments
The X-ray diffraction experiments were performed at the Centre for X-ray Diffraction Studies (Saint Petersburg State University). The Raman spectra and NLO-measurements were collected at the Center for Optical and Laser Materials Research, Research Park of Saint-Petersburg State University.
Conflicts of Interest
The authors declare no conflict of interest.
References
- Khamaganova, T.N.; Trunov, V.K.; Dzuhrinskii, B.F. The crystal structure of calcium samarium oxide borate Ca8Sm2O2(BO3)6. Russ. J. Inorg. Chem. 1991, 36, 484–485. [Google Scholar]
- Norrestam, R.; Nygren, M.; Bovin, J.-O. Structural investigations of new calcium-rare earth (R) oxyborates with the composition Ca4RO(BO3)3. Chem. Mater. 1992, 4, 737–743. [Google Scholar] [CrossRef]
- Ilyukhin, A.B.; Dzhurinskii, B.F. Crystal structures of binary oxoborates LnCa4O(BO3)3 (Ln = Gd, Tb, and Lu) and Eu2CaO(BO3)2. Russ. J. Inorg. Chem. 1993, 38, 847–850. [Google Scholar]
- Sasaki, T.; Mori, Y.; Yoshimura, M.; Yap, Y.K.; Kamimura, T. Recent development of nonlinear optical borate crystals: Key materials for generation of visible and UV light. Mater. Sci. Eng. R 2000, 30, 1–54. [Google Scholar] [CrossRef]
- Aka, G.; Kahn-Harari, A.; Vivien, D.; Benitez, J.M.; Salin, F.; Godard, J. A new non-linear and neodymium laser self-frequency doubling crystal with congruent melting: Ca4GdO(BO3)3 (GdCOB). Eur. J. Solid State Inorg. Chem. 1996, 33, 727–736. [Google Scholar] [CrossRef]
- Iwai, M.I.M.; Kobayashi, T.K.T.; Furuya, H.F.H.; Mori, Y.M.Y.; Sasaki, T.S.T. Crystal growth and optical characterization of rare-earth (Re) calcium oxyborate ReCa4O(BO3)3 (Re = Y or Gd) as new nonlinear optical material. Jpn. J. Appl. Phys. 1997, 36, L276. [Google Scholar] [CrossRef]
- Aka, G.; Kahn-Harari, A.; Mougel, F.; Vivien, D.; Salin, F.; Coquelin, P.; Damelet, J.P. Linear-and nonlinear-optical properties of a new gadolinium calcium oxoborate crystal, Ca4GdO(BO3)3. J. Opt. Soc. Am. B 1997, 14, 2238–2247. [Google Scholar] [CrossRef]
- Adams, J.J.; Ebbers, C.A.; Schaffers, K.I.; Payne, S.A. Nonlinear optical properties of LaCa4O(BO3)3. Opt. Lett. 2001, 26, 217–219. [Google Scholar] [CrossRef]
- Druon, F.; Balembois, F.; Georges, P.; Brun, A.; Courjaud, A.; Hönninger, C.; Vivien, D. Generation of 90-fs pulses from a mode-locked diode-pumped Yb3+: Ca4GdO(BO3)3 laser. Opt. Lett. 2000, 25, 423–425. [Google Scholar] [CrossRef]
- Vincent, B.; Boudrioua, A.; Loulergue, J.C.; Moretti, P.; Tascu, S.; Jacquier, B.; Vivien, D. Channel waveguides in Ca4GdO(BO3)3 fabricated by He+ implantation for blue-light generation. Opt. Lett. 2003, 28, 1025–1027. [Google Scholar] [CrossRef]
- Chai, B.H. Advances in bulk inorganic nonlinear optical materials. Opt. Phot. News 1999, 10, 31. [Google Scholar] [CrossRef]
- Kuz’micheva, G.M.; Kaurova, I.A.; Rybakov, V.B.; Podbel’skiy, V.V. Crystallochemical design of huntite-family compounds. Crystals 2019, 9, 100. [Google Scholar] [CrossRef]
- Kuz’micheva, G.M.; Ageev, A.Y.; Rybakov, V.B.; Panyutin, V.L.; Yu, Y.M.; Chizhikov, V.I. Growth and X-ray diffraction study of YCa4O(BO3)3: Ce, Er, Yb crystals. Inorg. Mater. 2001, 37, 1051–1060. [Google Scholar] [CrossRef]
- Yang, H.C.; Li, C.Y.; He, H.; Tao, Y.; Xu, J.H.; Su, Q. VUV–UV excited luminescent properties of LnCa4O(BO3)3: RE3+ (Ln = Y, La, Gd; Re = Eu, Tb, Dy, Ce). J. Lumin. 2006, 118, 61–69. [Google Scholar] [CrossRef]
- Furuya, H.; Nakao, H.; Yamada, I.; Ruan, Y.F.; Yap, Y.K.; Yoshimura, M.; Mori, Y.; Sasaki, T. Alleviation of photoinduced damage in GdxY1–xCa4O(BO3)3 at elevated crystal temperature for noncritically phase-matched 355-nm generation. Opt. Lett. 2000, 25, 1588–1590. [Google Scholar] [CrossRef] [PubMed]
- Umemura, N.; Nakao, H.; Furuya, H.; Yoshimura, M.; Mori, Y.; Sasaki, T.; Yoshida, K.; Kato, K. 90° phase-matching properties of YCa4O(BO3)3 and GdxY1−xCa4O(BO3)3. Jpn. J. Appl. Phys. 2001, 40, 596. [Google Scholar] [CrossRef]
- Wang, Z.; Xu, X.; Fu, K.; Song, R.; Wang, J.; Wei, J.; Liu, Y.; Shao, Z. Non-critical phase matching of GdxY1−xCa4O(BO3)3 (GdxY1−xCOB) crystal. Solid State Commun. 2001, 120, 397–400. [Google Scholar] [CrossRef]
- Nakao, H.; Kawamura, K.; Furuya, H.; Yamada, I.; Yoshimura, M.; Mori, Y.; Sasaki, T. Investigation of the Gd variation of GdxY1−xCa4O(BO3)3 crystal and its application. Jpn. J. Appl. Phys. 2002, 41, L723. [Google Scholar] [CrossRef]
- Jang, W.; Ye, Q.; Hammons, D.; Eichenholz, J.; Lim, J.; Richardson, M.; Chai, B.H.T.; Van Stryland, E. Improved Second-Harmonic Generation by Selective Yb Ion Doping in a New Nonlinear Optical Crystal YCOB. IEEE J. Quant. Electr. 1999, 35, 1826–1833. [Google Scholar]
- Kelly, N.D.; Savvin, S.; Dutton, S.E. Crystal structure and specific heat of calcium lanthanide oxyborates Ca4LnO(BO3)3. Z. Kristallogr. 2022, 237, 317–327. [Google Scholar] [CrossRef]
- Möckel, R.; Reuther, C.; Götze, J. REECOB: 20 years of rare earth element calcium oxoborates crystal growth research. Cryst. Growth Des. 2013, 371, 70–76. [Google Scholar] [CrossRef]
- Liu, J.; Wang, Z.; Zhang, S.; Wang, J.; Chen, H.; Shao, Z.; Jiang, M. Second-harmonic generation of 1.06 μm in Sr doped GdCa4O(BO3)3 crystal. Opt. Commun. 2001, 195, 267–271. [Google Scholar] [CrossRef]
- Achim, A.; Gheorghe, L.; Voicu, F.; Stanciu, G. Blue light production by type-I non-critical phase matching second-harmonic generation in La(Ca1−xSrx)4O(BO3)3 single crystals. Cryst. Eng. Comm. 2015, 17, 4098–4101. [Google Scholar] [CrossRef]
- Weigel, T.; Mehner, E.; Stöcker, H.; Meyer, D.C.; Götze, J.; Hanzig, J. Crystal Structure of Gd(Ca3.319Sr0.681)O[BO3]3 and Gd(Ca2.592Sr1.408)O[BO3]3. Cryst. Res. Technol. 2023, 58, 2200255. [Google Scholar] [CrossRef]
- Shannon, R.D. Revised effective ionic radii and systematic studies of interatomic distances in halides and chalcogenides. Acta Crystallogr. Sect. A Found. Crystallogr. 1976, 32, 751–767. [Google Scholar] [CrossRef]
- Münchhalfen, M.; Schreuer, J.; Reuther, C.; Mehner, E.; Stöcker, H. Elastic, piezoelectric, and dielectric properties of rare-earth calcium oxoborates RCa4O(BO3)3 (R = Er, Y, Dy, Gd, Sm, Nd, La). J. Appl. Phys. 2021, 130, 095102. [Google Scholar] [CrossRef]
- Mougel, F.; Kahn-Harari, A.; Aka, G.; Pelenc, D. Structural and thermal stability of Czochralski grown GdCOB oxoborate single crystals. J. Mater. Chem. 1998, 8, 1619–1623. [Google Scholar] [CrossRef]
- Dirksen, G.E.; Blasse, G. Tetracalcium gadolinium oxoborate (Ca4GdO(BO3)3) as a new host lattice for luminescent materials. J. Alloys Compd. 1993, 191, 121–126. [Google Scholar] [CrossRef]
- Zhang, Y.; Li, Y. Photo-luminescent properties of Eu3+ ion-doped Ca4REO(BO3)3 (RE La, Y, Gd). J. Lumin. 2005, 113, 45–49. [Google Scholar] [CrossRef]
- Kuo, T.W.; Chen, T.M. Synthesis and luminescence of Ca4YO(BO3)3: Eu3+ for fluorescent lamp application. Opt. Mater. 2010, 32, 882–885. [Google Scholar] [CrossRef]
- Ju, G.; Hu, Y.; Chen, L.; Wang, X.; Mu, Z.; Wu, H.; Kang, F. The luminescence of bismuth and europium in Ca4YO(BO3)3. J. Lumin. 2012, 132, 717–721. [Google Scholar] [CrossRef]
- Yu, F.; Zhang, S.; Zhao, X.; Guo, S.; Duan, X.; Yuan, D.; Shrout, T.R. Investigation of the dielectric and piezoelectric properties of ReCa4O(BO3)3 crystals. J. Phys. D Appl. Phys. 2011, 44, 135405. [Google Scholar] [CrossRef]
- Münchhalfen, M.; Schreuer, J.; Reuther, C.; Möckel, R.; Götze, J.; Mehner, E.; Stöcker, H.; Meyer, D. Order/disorder processes and electromechanical properties of monoclinic GdCa4O(BO3)3. Z. Kristallogr. 2019, 234, 707–723. [Google Scholar] [CrossRef]
- Kelly, N.D.; Dutton, S.E. Magnetic properties of quasi-one-dimensional lanthanide calcium oxyborates Ca4LnO(BO3)3. Inorg. Chem. 2020, 59, 9188–9195. [Google Scholar] [CrossRef] [PubMed]
- Kalakkodu, S. ICDD, PDF-2 2011, Database; ICDD: Newtown Square, PA, USA, 2011. [Google Scholar]
- Bubnova, R.S.; Firsova, V.A.; Volkov, S.N.; Filatov, S.K. RietveldToTensor: Program for processing powder X-ray diffraction data under variable conditions. Glass Phys. Chem. 2018, 44, 33–40. [Google Scholar] [CrossRef]
- Palatinus, L.; Chapuis, G. SUPERFLIP—A computer program for the solution of crystal structures by charge flipping in arbitrary dimensions. J. Appl. Crystallogr. 2007, 40, 786–790. [Google Scholar] [CrossRef]
- Petříček, V.; Dušek, M.; Palatinus, L. Crystallographic Computing System JANA2006: General features. Z. Kristallogr. Cryst. Mater. 2014, 229, 345–352. [Google Scholar] [CrossRef]
- VESTA: Visualization for Electronic and Structural Analysis. Available online: https://jp-minerals.org/vesta/en/ (accessed on 17 November 2021).
- Zhang, Y.; Chen, X.L.; Liang, J.K.; Cao, Y.G.; Xu, T. Phase relations in the system La2O3–CaO–B2O3. J. Alloys Compd. 2001, 315, 198–202. [Google Scholar] [CrossRef]
- Reuther, C.; Moeckel, R.; Hengst, M.; Goetze, J.; Schwarzer, A.; Schmidt, H. Growth and structure of Ca4La[O(BO)3)3]. J. Cryst. Growth 2011, 320, 90–94. [Google Scholar] [CrossRef]
- Crossno, S.K. Tetracalcium Lanthanide Borate Oxide: Structures and Optical Properties. Master’s Thesis, Oregon State University, Corvallis, ON, USA, 1997. [Google Scholar]
- Filatov, S.K. Nekotoryye strukturno-geometricheskiye izmereniya deformatsiy kristallov pri ispol’zovanii temperatury, davleniya i khimizm. Kristallogr. Kristallokh. 1973, 2, 5. [Google Scholar]
- Hazen, R.M. Temperature, pressure, and composition: Structurally analogous variables. Phys. Chem. Miner. 1977, 1, 83–94. [Google Scholar] [CrossRef]
- Hazen, R.M.; Finger, L.W. Comparative Crystal Chemistry; John Wiley & Sons: New York, NY, USA, 1982; Volume 231. [Google Scholar]
- Filatov, S.K. Vysokotemperaturnaya kristallokhimiya; Nedra: Leningrad, Russia, 1990; Volume 288. [Google Scholar]
- Hazen, R.M.; Downs, R.T.; Prewitt, C.T. Principles of comparative crystal chemistry. Rev. Mineral. Geochem. 2000, 41, 1–33. [Google Scholar] [CrossRef]
- Bubnova, R.S.; Filatov, S.K. High-temperature borate crystal chemistry. Z. Kristallogr. 2013, 228, 395–428. [Google Scholar] [CrossRef]
- Hazen, R.M.; Prewitt, C.T. Effects of temperature and pressure on interatomic distances in oxygen-based mineral. Amer. Miner. 1977, 62, 309–315. [Google Scholar]
- Cruickshank, D.W.J. Errors in bond lengths due to rotational oscillations of molecules. Acta Cryst. 1956, 9, 757–758. [Google Scholar] [CrossRef]
- Busing, W.R.; Levy, H.A. The effect of thermal motion on the estimation of bond lengths from diffraction measurements. Acta Cryst. 1964, 17, 142–146. [Google Scholar] [CrossRef]
- Biryukov, Y.P.; Bubnova, R.S.; Krzhizhanovskaya, M.G.; Filatov, S.K.; Povolotskiy, A.V.; Ugolkov, V.L. Thermal behavior of polymorphic modifications of LuBO3. Solid State Sci. 2020, 99, 106061. [Google Scholar] [CrossRef]
- Yasseri, M.; Schüpfer, D.; Chen, L.; Kamila, H.; Müller, E.; de Boor, J.; Klar, P.J. Raman Spectroscopic Study of the Optical Phonons of Mg2Si1−xSnx Solid Solutions. Phys. Status Solidi. 2020, 14, 1900574. [Google Scholar] [CrossRef]
- Wang, X.; Qi, H.; Li, Y.; Yu, F.; Wang, H.; Chen, F.; Zhao, X. Synthesis and characterization of new Sr3(BO3)2 crystal for stimulated Raman scattering applications. Crystals 2017, 7, 125. [Google Scholar] [CrossRef]
- Chen, C.; Sasaki, T.; Li, R.; Wu, Y.; Lin, Z.; Mori, Y.; Hu, Z.; Wang, J.; Uda, S.; Yoshimura, M.; et al. Nonlinear Optical Borate Crystals: Principals and Applications; John Wiley & Sons: New York, NY, USA, 2012; Volume 406. [Google Scholar]
- Becker, P. Borate materials in nonlinear optics. Adv. Mater. 1998, 10, 979–992. [Google Scholar] [CrossRef]
- Shen, Y.; Zhao, S.; Luo, J. The role of cations in second-order nonlinear optical materials based on π-conjugated [BO3]3− groups. Coord. Chem. Rev. 2018, 366, 1–28. [Google Scholar] [CrossRef]
- Gong, P.F.; Liu, X.M.; Kang, L.; Lin, Z.S. Inorganic planar π-conjugated groups in nonlinear optical crystals: Review and outlook. Inorg. Chem. Front. 2020, 7, 839–852. [Google Scholar] [CrossRef]
- Mutailipu, M.; Poeppelmeier, K.R.; Pan, S. Borates: A Rich Source for Optical Materials. Chem. Rev. 2021, 121, 1130–1202. [Google Scholar] [CrossRef]
- Bubnova, R.; Volkov, S.; Albert, B.; Filatov, S.K. Borates—Crystal Structures of Prospective Nonlinear Optical Materials: High Anisotropy of the Thermal Expansion Caused by Anharmonic Atomic Vibrations. Crystals 2017, 7, 93. [Google Scholar] [CrossRef]
- Bubnova, R.S.; Shablinskii, A.P.; Stefanovich, S.Y.; Arsent’ev, M.Y.; Krzhizhanovskaya, M.G.; Lazoryak, B.I.; Ugolkov, V.L.; Filatov, S.K. Expanding gaudefroyite family to Sr2MBi(REEO)3(BO3)4 (M = Ca, Sr, Ba; REE = Y, Eu) borates with large second harmonic generation responses. Ceram. Intern. 2023, 49, 15082–15090. [Google Scholar] [CrossRef]
Disclaimer/Publisher’s Note: The statements, opinions and data contained in all publications are solely those of the individual author(s) and contributor(s) and not of MDPI and/or the editor(s). MDPI and/or the editor(s) disclaim responsibility for any injury to people or property resulting from any ideas, methods, instructions or products referred to in the content. |
© 2023 by the authors. Licensee MDPI, Basel, Switzerland. This article is an open access article distributed under the terms and conditions of the Creative Commons Attribution (CC BY) license (https://creativecommons.org/licenses/by/4.0/).