Abstract
To better understand and control the crystallization of different polymorphs, a comprehensive crystal structure analysis was conducted by using fluralaner as a model compound, and the thermodynamic stability, phase transformation, and selective nucleation mechanisms were studied. Various analytical techniques such as powder X-ray diffraction, thermal analysis, and FT-IR spectra were used to comprehensively characterize Form I, Form Ⅱ, and Form III of fluralaner, and it was found that there is structural similarity between Form I and Form III, which was further confirmed by single crystal X-ray diffraction. However, it was found that Form Ⅱ had unique molecular conformation and packing pattern. The lattice energy was calculated by Materials Studio 7.0 and the thermodynamic stability of three forms was explored by phase transformation experiments, which suggested that the order of thermodynamic stability was Form Ⅱ > Form I > Form III. The selective nucleation of Form I and Form III with similar structure was studied through FT-IR spectra and molecular dynamics simulations. The results indicated that the addition of n-hexane may hinder the solute–solute interaction in the solution, thus resulting in the nucleation of different polymorphs.
1. Introduction
It is well-known that polymorphism is common in active pharmaceutical ingredients (APIs), which can lead to diverse physicochemical properties such as solubility, hygroscopicity, stability, dissolution, etc., further affecting their bioavailability [1,2,3,4]. For metastable forms, potential transformation can happen during filtration, drying, formulation, storage, and transportation. The disappearing ritonavir form event is a typical example, where a phase transformation occurred during the production process, resulting in serious economic losses [5]. Therefore, a comprehensive characterization and phase transformation study of polymorph and determination of thermodynamic relationships between the different forms can assist in the selection of the best solid form for development [6,7,8]. In addition, it is important to understand the selective nucleation of different polymorphs so that polymorphism can be precisely regulated and predicted to guide product and process development [9,10].
In recent years, researchers have conducted numerous studies on the link between solution chemistry and crystal structure [11,12,13,14,15]. Davey et al. [12] demonstrated that the polymorphs of 2,6-dihydroxybenzoic acid have some relationship with the arrangement of molecular clusters in solution, while solvents can significantly influence the supramolecular structure of the pre-nucleated aggregates. Chen et al. [11] found that tetrolic acid can exist as different molecular self-assemblies in different solvents, which is consistent with the corresponding synthons in the structure. However, Du et al. [16] reported that nucleation of tolfenamic acid polymorphs in toluene and ethanol solutions was independent of the solute molecular aggregation pattern. Piedade et al. [17] demonstrated that the different 5-hydroxynicotinic acid tautomers can selectively crystallized as a hydrate or a DMSO solvate in water and DMSO, respectively, while they transformed to the same tautomeric form once the solvent is removed. Davey et al. [18] found that benzoic acid molecules exist essentially as monomers in methanol, while the molecules form cyclic dimer units in the crystal structure obtained by crystallization from methanol. This suggests that the relationship between the pattern of solute molecules presented in solution and the synthon in the resulting polymorph is ambiguous and controversial. Therefore, it is not clear how the selectivity of polymorphs crystallization is affected by different solution environments [19,20]. It is therefore necessary to explore the mechanisms of selective crystallization of polymorphs in different solvents.
Fluralaner is a new broad-spectrum veterinary drug for the treatment of ectoparasitic diseases [21,22,23], the chemical structure of which is shown in Figure 1. Although three polymorphs are known [24], studies carried out up to now were mainly focused on efficacy, toxicity, and pharmacokinetics [25,26,27,28], and no detailed studies related to polymorphism of fluralaner have been reported. In order to achieve precise regulation of fluralaner polymorphs and provide theoretical guidance for drug development and production as well as research on polymorphs, it is necessary to systematically study the thermodynamic stability, phase transformation, and selective nucleation of fluralaner polymorphs.
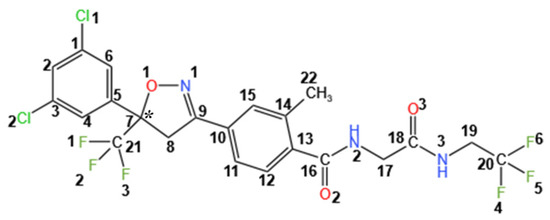
Figure 1.
Chemical structure of fluralaner. ("*" represents chiral center).
In this study, various analytical techniques such as PXRD, DSC, TG, and FT-IR were used to comprehensively characterize Form I, Form Ⅱ, and Form III of fluralaner. Through detailed crystal structure analysis, the differences and similarities in the structure of Form I, Form Ⅱ, and Form III were comprehensively studied. The phase transformation between Form I, Form Ⅱ, and Form III was investigated by thermal analysis methods (DSC and HSM) and solvent-mediated phase transformation experiments. Materials Studio 7.0 was used to calculate the lattice energy of the three forms, and the thermodynamic stability of the three forms was investigated in combination with phase transformation experiments and calculation results. In order to explain the selective nucleation of Form I and Form III with similar structures, the relationship between solution chemistry and crystal structure was investigated through FT-IR spectra and molecular dynamics simulations.
2. Experimental Section
2.1. Materials
Fluralaner (Form Ⅰ) with purity higher than 99% was provided by Tianjin Ringpu Bio-technology Co., Ltd. (Tianjin, China). All analytical-grade organic solvents (>99% purity) were purchased from Tianjin Kermel Chemical Reagent Co., Ltd. Reagents were used without further purification.
2.2. Preparation of Fluralaner Polymorphs
2.2.1. Preparation of Form I
A total of 120 mg of fluralaner was added to 2 mL of isopropanol and dissolved completely at 60 °C. Then, the solution was quickly quenched from 60 °C to 20 °C and left for one day to obtain Form I. Single crystals of Form I were prepared by slowly evaporating 2 mL of a saturated methanol solution at room temperature (23 ± 2 °C) for 2 days.
2.2.2. Preparation of Form Ⅱ
At 25 °C, 0.2 g of fluralaner was dissolved in 1 mL of ethyl acetate and the solution was then filtered through a 0.22 µm nylon filter into a 10 mL beaker. The beaker was then sealed with cling film, and a small hole was punctured on the cling film with a syringe needle for evaporation. After 3 days, Form Ⅱ was obtained from the solution. Single crystals of Form II were prepared by slowly evaporating 4 mL of a saturated ethanol/isopropyl ether (1:1 v/v) solution at room temperature (23 ± 2 °C).
2.2.3. Preparation of Form Ⅲ
At 50 °C, 60 mg of fluralaner API was dissolved in a solvent mixture of 1 mL of isopropanol and 1 mL of n-hexane, and then the solution was filtered through a 0.22 µm nylon filter into a 10 mL beaker. The beaker was placed in a vacuum drying oven at 50 °C with pressure of 0.1 MPa, and after rapid evaporation of the solvent, Form III was obtained. Single crystals of Form III were obtained by adding 60 mg of fluralaner to 12 mL of isopropanol /n-hexane (1:5 v/v) and quenching rapidly from 50 °C to 20 °C and leaving for one day.
2.3. Characterization
2.3.1. Powder X-ray Diffraction (PXRD)
PXRD analyses of fluralaner polymorphs were performed on a Rigaku D/max-2500 X-ray diffractometer (Rigaku, Tokyo, Japan) using Cu Kα radiation (1.54178 Å) at 100 mA and 40 kV. The samples were scanned continuously at ambient temperature over a range of 2θ from 2~40° at a speed of 8°/min. All data were collected at room temperature (23 ± 2 °C) and analyzed using Jade 6.0 software [29,30].
2.3.2. Differential Scanning Calorimetry (DSC)
Differential scanning calorimetry (DSC) of fluralaner polymorphs was carried out on a DSC 1/500 (Mettler Toledo, Switzerland). Samples weighing 5–10 mg were placed into a standard aluminum pan and heated from 30 to 200 °C at a rate of 10 °C/min under nitrogen purge at flow rate of 50 mL/min. The instrument was calibrated against the melting properties of indium.
2.3.3. Thermogravimetric Analysis (TGA)
Thermogravimetric analyses of fluralaner polymorphs were performed on a TGA/DSC 1 STARe System (Mettler Toledo, Greifensee, Switzerland). Samples weighing 5–10 mg were placed into a standard alumina crucible and heated from 30 to 400 °C at a rate of 10 °C/min under nitrogen purge at flow rate of 20 mL/min. The temperature was calibrated by testing on standards such as Zn, Al, Au, and Pd. The built-in balance of TGA/DSC 1 is equipped with two high-quality ring calibration weights for fully automatic internal calibration of the balance.
2.3.4. Morphology Analysis
Morphology of the samples were investigated using an optical microscope (Leica Optical Instruments Co., Ltd., Tianjin, China) with a CCD camera (DXC-390, Sony Corporation, Tokyo, Japan) connected to a computer. The Hot-Stage Microscopy (HSM) experiments were carried out on a polarizing microscope (Olympus BX-51, Tokyo, Japan), and the DSC600 hot-level Linkam system was connected to control the temperature. Samples were heated from 30 to 180 °C at a heating rate of 0.5 °C/min.
2.3.5. Solid-State Nuclear Magnetic Resonance (SSNMR)
The 13C NMR spectra of fluralaner polymorphs were recorded on a Bruker Avance III WB 400 (Bruker, Karlsruhe, Germany) using the cross-polarization magic angle spinning (CP/MAS) method. The measurements were carried out using a 4 mm rotor with a spinning rate of 12 kHz, contact time of 1 ms, a pulse delay time of 4 s (D1), and 512 scans were accumulated. Solid-state NMR experiments were carried out at 20 ± 2 °C.
2.3.6. Fourier Transform Infrared (FTIR)
FTIR spectra of the polymorphs were collected using an ALPHA ATR platinum instrument (Bruker, Germany) with a resolution of 4 cm−1 and 32 scans per spectra at 4000–400 cm−1 range. FTIR spectra of liquid samples were recorded on an FTIR spectrometer (ReactIRTM45, Mettler-Toledo) to study the interactions between molecules in solution with different supersaturation at 20 °C. The wavenumber range obtained was 2800~650 cm−1 with a resolution of 4 cm−1. The background of the corresponding solvent in the liquid sample was subtracted when acquiring the sample spectra.
2.3.7. Single Crystal X-ray Diffraction (SCXRD)
SCXRD measurements of Form I and Form Ⅲ were performed on a Rigaku Saturn 70 CCD diffractometer using graphite monochromator with Mo-Kα radiation (λ = 0.71073 Å). SCXRD measurements of Form Ⅱ was performed on a ROD, Synergy Custom DW system, HyPix diffractometer using graphite monochromator with Cu-Kα radiation (λ = 1.54184 Å). In Olex2 [31], the structures were solved with the SHELXT [32] structure solution program using intrinsic phasing and were refined with the SHELXL [33] refinement package using least squares minimization. The PXRD patterns were simulated using Mercury software [34].
2.4. Hirshfeld Surface Analysis
Crystal Explorer 17 was used for the Hirshfeld surface analysis of molecules in different crystal structures [35,36], so as to reveal the intermolecular interactions in crystal structures.
2.5. Solvent-Mediated Phase Transformation Experiment
Solvent-mediated phase transformation experiments for Form I and Form III of fluralaner were carried out in methanol, with the powders of Form I and Form III being added to 10 mL vials containing 1 mL of methanol solvent and the suspensions stirred at 300 rpm for 72 h at 30 °C. Samples were taken for filtration at different times and the resulting powders were characterized by PXRD.
2.6. Single Point Energy Calculations
The chiral R-configuration molecules of fluralaner were extracted directly from the asymmetric units of three crystal structures. The single point energy calculations were performed at the B3LYP/6-311+G (d, p) level of theory with GAUSSIAN09 [37].
2.7. Lattice Energy Calculation
The lattice energy of different forms was calculated on Materials Studio 7.0 at 298 K. The geometry optimization was performed in the Forcite module using the COMPASS II (a class II ab initio calculation of consistent force fields for condensed matter optimization for atomic level simulation studies) force field [38]. The charge was set to Forcefield assigned method, and the electrostatic and van der Waals interactions were calculated using the Ewald and atom-based summation methods, respectively. Furthermore, the supercells of each form were built with different sizes, and the lattice energies were calculated until its value became stable. The stable value was taken as the lattice energy of the corresponding form.
2.8. Molecular Dynamics (MD) Simulations
MD simulations were carried out using the Forcite module of Materials Studio 7.0 to study intermolecular interactions under supersaturated conditions in different solvents. The Smart method, which combines the conjugate-gradient method and steepest-descent method, was used in the energy minimization procedure. The amorphous cell module was used to construct cubic cells with 500 solvent molecules and a certain number of solute molecules according to solubility and experimental supersaturation, and the geometry optimization simulation was carried out after the completion of the construction. A 200 ps run for equilibration was performed in an NVT ensemble with a time step of 1 fs, which is followed by a 2 ns production run in the NPT ensemble with a time step of 1 fs. The temperature was maintained at 293.15 K by a Nose thermostat and the pressure was maintained at 101.325 kPa by a Berendsen barostat. The electrostatic and van der Waals interactions were calculated using the Ewald and atom-based summation methods, respectively. The properties of simulation system are shown in Table S5. After performing molecular dynamics calculations, the equilibrated final structure was to calculate the solvation free energy. The solvation free energy (ΔGsolv) can be calculated as the sum of three contribution: ΔGid, ΔGvdw, and ΔGelec, as shown in Equation (1). Each contribution needs to be calculated separately. Set contribution as ALL and run each contribution calculation sequentially. Equilibration steps and production steps are set to 50,000 and 100,000 respectively, and the coupling parameter steps are set to 5.
where ΔGid, ΔGvdw, and ΔGelec represent the ideal contribution of the solvation free energy, the van der Waals contribution of the solvation free energy, and the electrostatic contribution of the solvation free energy, respectively.
ΔGsolv = ΔGid + ΔGvdw + ΔGelec
2.9. Radial Distribution Function (RDF)
Radial distribution functions (RDFs) were used to analyze the conformations and molecular scale features in solution. RDFs provide information on the probability of finding an atom at a certain distance from a selected atom. In this study, the results of the last 1 ns of the MD simulation trajectory were used to calculate the RDFs.
3. Results and Discussion
3.1. Characterization of Polymorphs
PXRD analysis was used to identify Form I, Form Ⅱ, and Form III, and the results are shown in Figure 2. The specific characteristic peaks of them are summarized in Table S1. Surprisingly, it was found that the PXRD patterns of Form I and Form III are close, suggesting that their crystal structures may have some degree of similarity. Although the PXRD patterns of Form I and Form III are very similar, some characteristic peaks have undergone a certain degree of shift, and there are also some weaker characteristic peaks that differ. For example, Form I and Form III can be distinguished by the characteristic peaks at 2θ = 17.98°, 27.16°, and 29.74° for Form I, and 2θ = 19.70°, 26.96°, and 29.56° for Form III. The PXRD pattern of Form II shows distinct differences from Form I and Form III, with the main characteristic peaks located at 2θ = 18.48°, 20.06°, and 26.70°. The morphology of single crystals of Form I, Form Ⅱ, and Form III observed through an optical microscope are shown in Figure 3, indicating a distinct contrast in the appearance of these three forms. Form I has a regular parallelogram appearance (Figure 3a), and Form II has a rectangular shape (Figure 3b), whereas Form III is rod-like (Figure 3c). To further identify Form I and Form III, the solid-state NMR spectra of fluralaner Form I and Form III were determined, and the results are shown in Figure S1 (in Supplementary Materials). The results indicate that the NMR spectra of Form I and Form III are very similar, with subtle differences. The characteristic peak with a chemical shift of 43.20 ppm in Form I shifted slightly to 43.37 ppm in Form III, while the characteristic peak with a chemical shift of 21.07 ppm in Form I shifted to 18.80 ppm in Form III. These observations suggest that the structures of Form I and Form III are similar, but the chemical environment of the molecules in the crystal structure is slightly different. Solid-state NMR spectra are an effective method for identifying polymorphs.
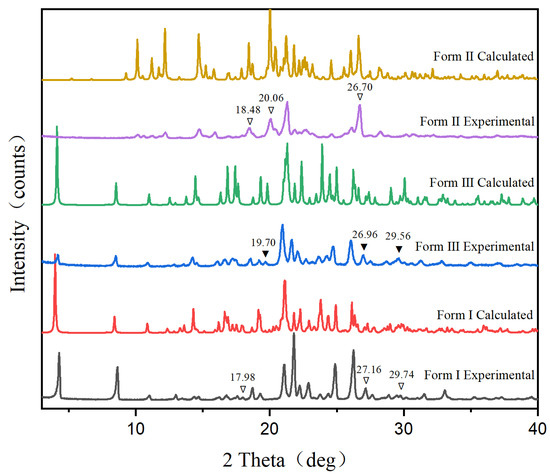
Figure 2.
Experimental and simulated PXRD patterns of Form I, Form Ⅱ, and Form III.
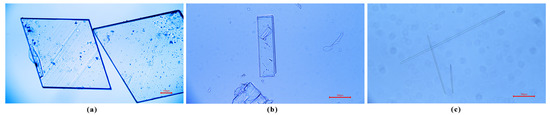
Figure 3.
Optical microscopy images of (a) Form I, (b) Form Ⅱ, (c) and Form Ⅲ.
FT-IR spectra can be used to identify polymorphs and analyze intermolecular interactions in different forms [39]. The FT-IR spectra of Form I, Form Ⅱ, and Form III are shown in Figure S2. There are two amide groups in the fluralaner molecule, which are the main hydrogen bond donor-acceptors. Therefore, the amide group (-NH) and the carbonyl group (-C=O) were used as the two main characteristic functional groups to analyze the FT-IR spectra of Form I, Form Ⅱ, and Form III. The stretching vibration and bending vibration peaks of the amide group (-NH) in Form I occurs at 3266 cm−1 and 1531 cm−1 respectively, which is blue-shifted to 3267 cm−1 and 1531 cm−1 in Form III. Furthermore, the stretching vibration of the amide group (-C=O) in Form I appears at 1631 cm−1, while it is blue-shifted to 1632 cm−1 in Form III. The differences between vibration frequencies of both Form I and Form III are all considerably smaller than the spectral resolution of 4 cm−1 given in the Section 2, indicating that the differences in the strength of the hydrogen bonding interactions are small and that the crystal structures of the two forms are similar. However, the stretching vibration and bending vibration peaks of the amide group (-NH) in Form II occurs at 3311 cm−1 and 1505 cm−1, respectively, and the vibration of the amide group (-C=O) appears at 1649 cm−1. These values differ significantly from those of Form I and Form III, indicating that Form II may have a unique crystal structure. The shift in the vibrational frequencies of -NH and -C=O in Form II relative to Form I and Form III may indicate that the hydrogen bonding interactions are weaker in Form II than in Form I and Form III.
3.2. Molecular Conformations and Crystal Structure Analysis
3.2.1. Crystal Structure Analysis
Since Form I and Form III are structurally similar according to the results of PXRD and FT-IR, the crystal structures of the three forms were analyzed in detail to further investigate this phenomenon. Single crystals of fluralaner polymorphs were obtained for the first time, and information on the crystal structure of Form I, Form Ⅱ, and Form III is summarized in Table 1. There are eight molecules in the unit cell of Form I, and four molecules in the unit cells of Form Ⅱ and Form III.

Table 1.
Crystallographic data for Form I, Form Ⅱ, and Form III of fluralaner.
The crystal structures of Form I, Form Ⅱ, and Form III of fluralaner are shown in Figure 4, Figure 5 and Figure 6. Molecules with different configurations are represented by different colors. Two molecules with different chirality can be found in the asymmetric unit of Form I. R-configuration molecules are represented in green, and S-configuration molecules are represented in blue. The dimer (Figure 4a) is linked ‘hand in hand’ by hydrogen bonding interactions between the N2-H2 of the amide bond in the R-configuration molecule and the O2 of the amide bond in the S-configuration molecule (2.796(5) Å). In addition, weak interactions C12-H12⋯C15 are also formed between the carbons of the benzene rings of the two molecules, and weak interactions C17-H17B⋯O3, N3-H3⋯O3 are formed between O3 in the R-configuration molecules and C17-H17B and N3-H3 in the S-configuration molecules. Along the a-axis, adjacent dimers are linked into a chain by intermolecular interactions N2-H2⋯O2 (2.786(5) Å), C17-H17B⋯O3 and N3-H3⋯O3 (Figure 4b). Along the b-axis, the chiral molecules are connected by weak π−π interactions and Cl2⋯F2 (3.166 Å) interactions are formed by Cl2 on the benzene ring and F2 in the trifluoromethyl group (Figure 4b). As shown in Figure S3, the distance between the centroids of two parallel benzene rings is 3.955Å, and the distance from the centroid of one benzene ring to the plane of the other benzene ring is 3.510Å. The chains are arranged side by side to form a two-dimensional network structure on the a-b plane (Figure 4b). Along the c-axis, adjacent dimers are connected to each other by intermolecular interactions of molecules of the same configuration. The two-dimensional network structure is stacked along the c-axis to form a three-dimensional structure (Figure 4c).
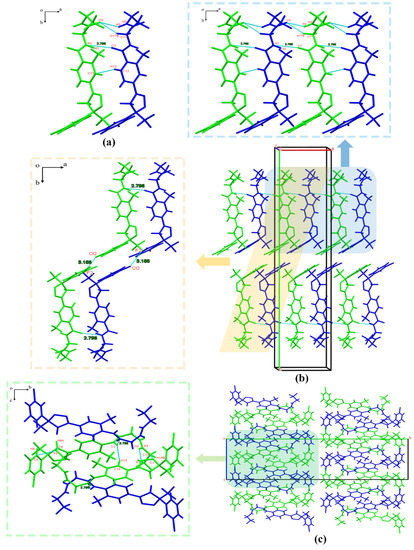
Figure 4.
(a) Dimer of fluralaner Form I, (b) 2D packing of Form I in a−b plane, (c) 3D packing of Form I.
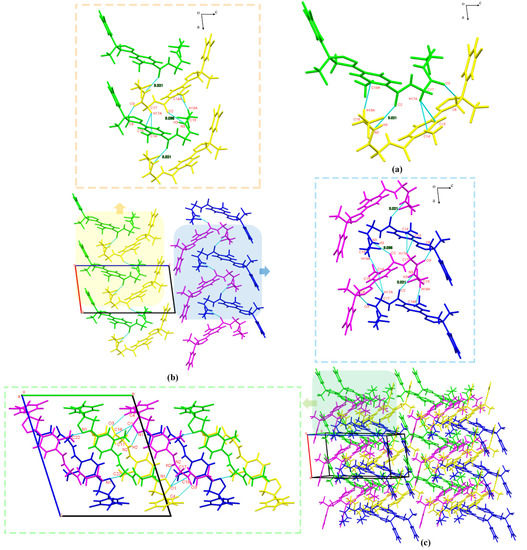
Figure 5.
(a) Dimer of fluralaner Form II, (b) 2D packing of Form II in the a−c plane, (c) 3D packing of Form II.
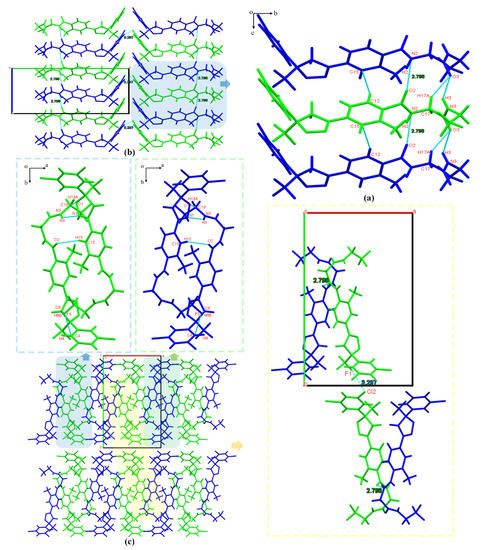
Figure 6.
(a) Interaction between fluralaner Form III asymmetric units, (b) 2D packing of Form III in the b–c plane, (c) 3D packing of Form III.
Two molecules were found in the asymmetric unit of Form II, but this dimer was composed of two molecules with the same chirality with different conformations. The green and yellow molecules were named as R (1) and R (2), and the mirror image of the molecules were named as S (1) and S (2), respectively. In Form II, the dimer (Figure 5a) is like a small ‘boat’, which was formed by intermolecular hydrogen bonding between O2 in the R (1) molecular and N3-H3 in the R (2) molecular (N3⋯O2 distance of 3.021 Å). Along the a-axis, adjacent dimers were linked to each other into a chain by the same intermolecular interactions as described above. Hydrogen bonds were formed by the N3-H3 of the R (1) molecule and the O2 of the R (2) molecule in the adjacent dimer (3.036 Å) (Figure 5b). The S (1) and S (2) molecules were connected in the same way to form a chain, in the opposite direction to the R molecules chain. Along the c-axis, the S-configuration and R-configuration molecular chains were connected by weak π-π interactions and extended in alternating arrangements to form a two-dimensional network structure on the a-c plane (Figure 5b). Along the b-axis, the S-configuration and R-configuration molecular chains also extended in alternating arrangements. The S (2) and R (1) molecules in the same cell were connected by C22-H22⋯N1 interactions, as shown in Figure 5c, and the S (1) and R (2) molecules were connected in the same way as above. The R and S molecular chains in the different cells were linked mainly by C4-H4⋯O3, C17-H17⋯O1, and N2-H2⋯N1 interactions between the R (2) and S (2) molecules. Thus, the two-dimensional network structure on the a-c plane was stacked along the b-axis to form a three-dimensional structure (Figure 5c).
The arrangement of the molecules in Form III is similar to that of Form I. Only one independent molecule can be found in the asymmetric unit of Form III. The S-configuration molecules are also shown as blue and the R-configuration molecules are shown as green. A two-dimensional network structure on the b-c plane is shown in the Figure 6a, while Figure 6b is a magnified view of Figure 6a. Along the c-axis (Figure 6b), adjacent S-configuration and R-configuration molecules are connected by N2-H2⋯O2 (2.798(5) Å) hydrogen bonds and arranged alternately to extend into a chain. Consistent with Form I (Figure 6a), weak interaction C12-H12⋯C15 is formed between the carbon atoms of the benzene rings of the two molecules, and weak interactions C17-H17B⋯O3, N3-H3⋯O3 are formed between O3 in the R-configuration molecules and C17-H17B, N3-H3 in the S-configuration molecules. The chains (Figure 6a) are connected by Cl2⋯F1 (3.297 Å) interactions between Cl2 and F1 from the same chiral configuration, and extend along the b-axis in an alternating arrangement. Along the a-axis, chains are connected by interactions between molecules with the same chirality (Figure 6c). Two R-configuration molecules are linked by weak interactions such as C19-H19A⋯O1, N3-H3⋯N1, and the two S-configuration molecules are linked in the same way as above. The three-dimensional structure (Figure 6c) is formed by the stacking of two-dimensional network structures along the a-axis. The data related to hydrogen bonds in Form I, Form Ⅱ and Form III are shown in Supporting Information (Table S2). The results of crystal structure analysis indicate that Form I and Form III have structural similarity, while Form II possesses a unique molecular packing pattern.
3.2.2. Crystal Structure Comparison
Detailed comparative analysis was conducted on the crystal structures of Form I and Form III. As shown in Figure 7, the difference in crystal structure between the two forms is mainly the arrangement between adjacent molecular chains. As shown in Figure 7a,c, the adjacent molecular chains of Form I extend in opposite directions, while the adjacent molecular chains in Form III are identical. Viewed by local magnification, as shown in Figure 7b, the benzene rings of the molecules in the adjacent molecular chains of Form I are parallel, while in Form III the benzene rings of the molecules in the adjacent molecular chains are arranged at an angle. The arrangement of Form I is more conducive to the formation of intermolecular interactions, with Cl2 and F2 atoms forming interaction between them (3.166 Å), whereas the distance between these two atoms in Form III (6.893 Å) is relatively far. Based on the results, it can be concluded that the different molecular arrangement is the dominant factor that cause the crystal structure difference in Form I and Form III, and the stacking pattern suggests that Form I may be more stable than Form III.
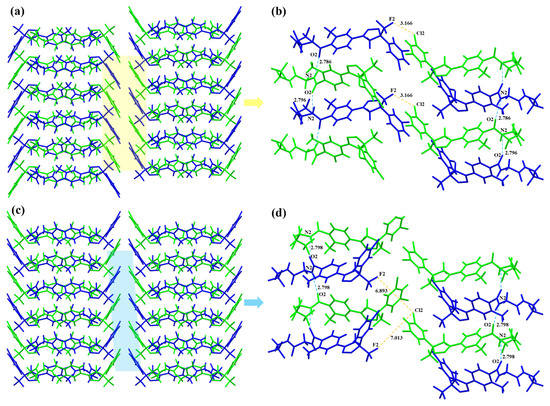
Figure 7.
Comparison of the crystal structures of Form I and Form III. (a) Crystal structure of Form I, (b) partially enlarged crystal structure of Form I, (c) crystal structure of Form III, (d) partially enlarged crystal structure of Form III.
3.2.3. Molecular Conformations
The molecular conformation is an important parameter in relation to hydrogen bonding network and crystal packing [40,41]. Hence, the molecular conformations of Form I, Form Ⅱ and Form III were analyzed to further investigate the similarity and difference between the three forms (Figure 8). The specific torsion angle data are shown in Table S3. The main torsion angles with differences in various conformers are shown in Table S4. It can be found that the molecular conformations of Form I and Form III are similar. The molecular conformations of Form II differ significantly from that of Form I and Form III. In addition, the single point energy of conformations extracted from the crystals were also calculated using GAUSSIAN 09 and the results are shown in Table 2. It can be found that the relative conformational energies of the molecular conformations in Form I and Form III are similar, indicating that the similar molecular conformation may be one of the factors that lead to the close crystal structure of Form I and Form III. However, the conformations of the two molecules in the asymmetrical unit of Form II are similar, with the same relative conformational energies (1.57 kcal/mol) but higher than those of Form I and Form III, indicating a relatively weaker stability of molecular conformation in Form II.
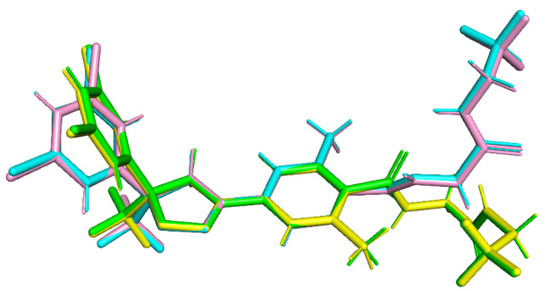
Figure 8.
Overlays of conformations of Form I-R (green), Form II-R1 (cyan), Form II-R2 (pink), and Form III-R (yellow).
Table 2.
Energy calculation results.
3.2.4. Hirshfeld Surface Analysis
The Hirshfeld surface analysis is a commonly used method for analyzing intermolecular interactions, which can compare crystallographic stacking patterns of polymorphs and quantify intermolecular interactions [35,36]. It is also a useful way of comparing the similarities and differences between various forms. To further compare the structural similarity between Form I and Form III, the Hirshfeld surface analysis was performed. The Hirshfeld surfaces (with dnorm descriptor) and two-dimensional fingerprint profiles of the fluralaner molecules in Form I and Form III are shown in the Figures S4 and S5, respectively. The Hirshfeld surfaces of Form I and Form III show a similar shape, which is consistent with the conclusions of the crystal structure analysis. Red and blue represent shorter interatomic distances and longer interatomic distances, respectively [42,43]. Distinctive red circles can be observed on the amide group in Form I and Form III, corresponding to the predominant N-H⋯O hydrogen bonds in the crystal structures.
The percentages of the different interactions were summarized in Figure 9. It can be suggested that F⋯H interactions account for the largest percentage, due to the presence of two trifluoromethyl groups in the fluralaner molecule and the strong electronegativity of the F atom. The contribution of O⋯H interactions in the two polymorphs are the same (13.5%), due to the fact that the molecules of Form I and Form III are connected by similar N-H⋯O hydrogen bonding interactions. In addition, it can be seen that the contribution of the F⋯H and Cl⋯H interaction is greater in Form III than that in Form I, due to the fact that F (Cl) atoms in Form III are easier to form hydrogen bonding interactions with molecules in adjacent molecular chains.
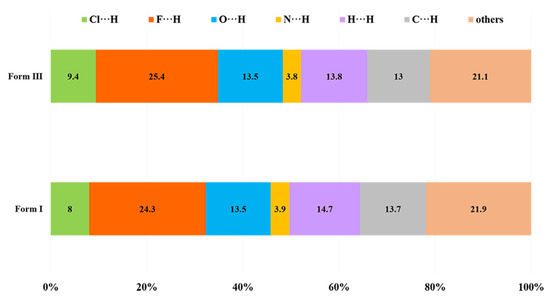
Figure 9.
Relative contributions of various intermolecular contacts to the Hirshfeld surface areas.
3.3. Thermal Analysis
Thermal analysis of Form I, Form Ⅱ, and Form III was carried out by TGA and DSC. As shown in Figure 10, at a heating rate of 10 °C/min, only one distinct endothermic peak was observed in the DSC curves for both Form I and Form Ⅱ. Form I began to melt at 175.27 °C, with a melting peak of 177.61 °C, and Form Ⅱ began to melt at 171.38 °C, with a melting peak of 174.74 °C. Two incompletely separated endothermic peaks were observed in the DSC curve of Form III with peak temperatures of 169.22 °C and 176.31 °C. The TGA curves for three forms show no significant weight loss before decomposition temperature (approximately 290 °C), indicating that Form I, Form Ⅱ, and Form III are anhydrous.
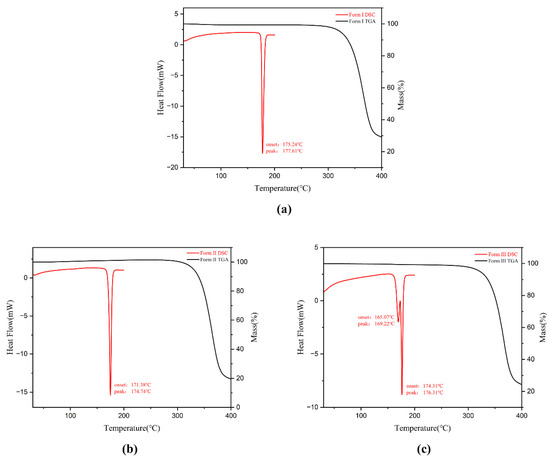
Figure 10.
DSC and TGA curves of fluralaner (a) Form I, (b) Form Ⅱ, and (c) Form III.
The enthalpies of the observed thermal events for Form I, Form Ⅱ, and Form III are shown in Table S6. It was suggested that, compared with the enthalpy of the melting process, the transformation enthalpy of Form III is much smaller, indicating that the phase transformation barrier is lower and the transformation is more likely to occur.
DSC was conducted combined with PXRD and HSM to investigate the polymorph transformation of Form III during heating. Slower heating rates were applied to better separate endothermic peaks and facilitate PXRD analysis at different temperatures. As shown in the Figure S6, the two endothermic peaks on the Form III DSC curve become more apparent as the heating rate decreased. At a heating rate of 3 °C/min, a clear endothermic–exothermic–endothermic process can be observed. The PXRD result at 165 °C was consistent with Form III (Figure S7), indicating that the crystal did not undergo a phase transformation before this temperature. However, at 171 °C, the typical peak of Form I appeared (Figure S7), indicating the transformation of Form III to Form I during heating, and the second endothermic peak is corresponding to the melting of Form I. The detailed process of the transformation was also observed through the HSM (Figure S8). It was found that the morphology of the crystals did not change significantly until they were heated to 170 °C at a rate of 0.5 °C/min. At 172 °C, the crystals began to partially melt. However, at 173 °C, the crystals no longer melted and showed a tendency to grow. After 176 °C, the crystals totally transformed into Form I, followed by the melting of Form I.
3.4. Solvent-Mediated Phase Transformation
To further investigate the phase transformation and thermodynamic relationships between Form I and Form III, solvent-mediated phase transformation experiments were carried out in methanol. The PXRD results of the process are shown in Figures S9 and S10. The results show that both Form I and Form III transformed into Form II after suspension in methanol at 30 °C for 72 h. Interestingly, Form I transformed directly to Form II, whereas Form III first transformed rapidly to Form I and then continued to Form II.
The lattice energy calculations at 298 K were also conducted to compare the stability of the three forms (Table 2). The lattice energy refers to the energy of the interactions between atoms in a crystal and the conformation energy. The results indicate that the lattice energy of Form II (74.95 kcal/mol) is slightly greater than that of Form I (73.55 kcal/mol), while the lattice energy of Form III is the smallest (70.80 kcal/mol). Form II is more stable than Form I and Form III, and the lattice energy calculations are consistent with FT-IR analysis. The results of the phase transformation experiments and lattice energy calculations indicate that Form II is the stable form, while Form I and Form III are metastable forms. The order of stability of the three forms under environmental conditions is Form II > Form I > Form III. This provides evidence to support the statement that the low Z’ form (Form III) may not necessarily be more stable than the high Z’ form (Form I) as proposed several years ago [44,45,46,47].
3.5. Selective Nucleation Studies
The results of the rapid cooling crystallization experiments in different solvents are shown in Table S7. Though Form I and Form III are similar in crystal structure, interestingly, Form I was obtained in most pure solvents (e.g., isopropanol) by rapidly cooling crystallization, whereas Form III was obtained stably in mixed solvents (e.g., isopropanol/n-hexane) without transforming to Form I. It is worth noting that the absence of transformation from Form III to Form I refer to immediate precipitation of the solution without stirring, and the samples were sent for PXRD immediately after precipitation. In order to rationalize the phenomena, two solvent systems, isopropanol and isopropanol/n-hexane, were chosen for rapid cooling crystallization experiments to further study the selective nucleation mechanism of Form I and Form III. The experimental supersaturation in both isopropanol and isopropanol/n-hexane solvents was consistent. The supersaturation in the cooling crystallization experiments was controlled within the range of 1.0–4.0 (where supersaturation s = C/Cs−1, C is the actual concentration of the solution, and Cs is the saturation concentration of the solution), but no different polymorphs were observed with changes in supersaturation.
3.5.1. Solute–Solvent Interactions in Solution
FTIR spectra were collected at different supersaturation in the isopropanol and isopropanol/n-hexane systems. It can be found from the results that the FT-IR intensities of fluralaner in both solvent systems increased with increasing supersaturation (Figure 11). However, no FT-IR peak shifts were observed over 1 h, suggesting that the state of solute molecules may be stable in solution. As can be seen from Figure 11, the stretching vibration peaks of -C=O in the isopropanol and isopropanol/n-hexane solvent systems are located at 1655.70 cm−1 and 1655.80 cm−1, respectively, and the -NH bending vibration peaks are located at 1573.66 cm−1 and 1573.65 cm−1, respectively, indicating similar solute–solvent interactions in solution. The stretching vibration peak of -C=O and the -NH bending vibrational peak shifts towards higher wavenumbers compared with the solid FT-IR spectra (Figure S2), indicating that the strength of hydrogen bonding interactions in solution is weaker than that in solid.
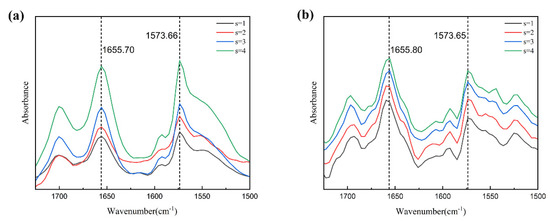
Figure 11.
FTIR spectra of (a) isopropanol and (b) isopropanol/n-hexane solutions of fluralaner at different supersaturation levels.
In order to further understand the interaction between the fluralaner molecules and the solvent molecules, molecular dynamics simulations were carried out and the free energies of solvation in both solvents was calculated. As shown in Table 3, the free energies of solvation in isopropanol and isopropanol/n-hexane are −27.986 kcal/mol and −23.053 kcal/mol, respectively, indicating that solute–solvent interactions are similar in isopropanol and isopropanol/n-hexane solvents, which is consistent with the FTIR analysis.
Table 3.
Free energy of solvation in Isopropanol and Isopropanol/n-hexane (kcal/mol).
3.5.2. Conformational Distribution of Fluralaner Molecules in Solution
Numerous studies have shown that the conformations of molecules in solution can affect selective nucleation [48,49]. Since the molecules in Form I and Form III have almost identical conformations, it can be suggested that the conformational distribution of the molecules may be similar in both the isopropanol and isopropanol/n-hexane systems. The results of the molecular dynamics simulations were analyzed for the distribution of conformations in different solvents using radial distribution function (RDF). The characteristic distances of N1-C22, H2-H3, C22-C20, and O2-C19 were selected to compare the conformational distributions, and the results are shown in Figure 12. The results of the RDF analysis in the two solvent systems are shown in Figure 13. As can be seen in Figure 13a, corresponding to the characteristic distances of the two different conformations in the crystal, there are two single peaks for the RDFs of N1-C22 in both solvents at 5.27 Å and 6.13 Å, and the broad peaks displayed by the RDFs of C22-C20 and O2-C19 (3.59–10.37 and 3.09–6.83 Å, respectively) suggest a diversity of conformations in solution. The RDF results at the four characteristic distances suggest that the conformational distribution of the fluralaner molecule is similar in isopropanol and isopropanol/n-hexane, which may be related to the fact that both forms crystallize by the same conformation.
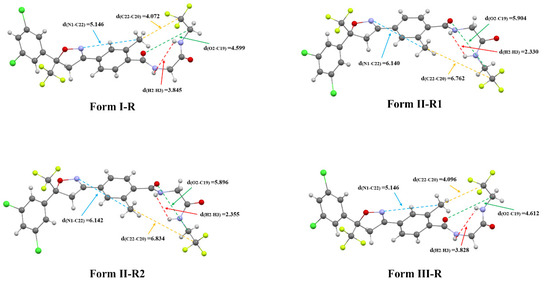
Figure 12.
The characteristic distance values for the conformations in the crystal structure.
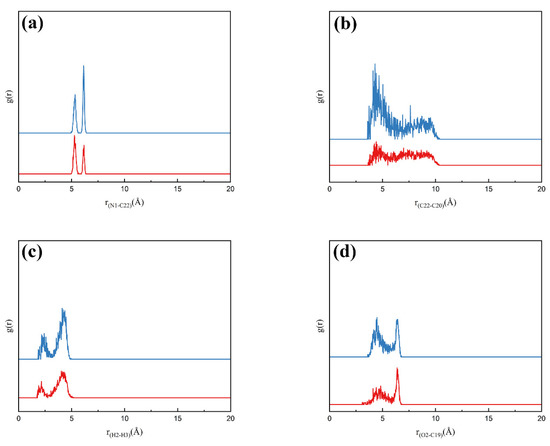
Figure 13.
Molecular dynamics simulation results: (a) intramolecular N1−C22 RDFs, (b) intramolecular C22-C20 RDFs, (c) intramolecular H2-H3 RDFs, and (d) intramolecular O2−C19 RDFs. The red and blue curves represent isopropanol and isopropanol/n-hexane solvent systems, respectively.
3.5.3. Solute–Solute Interactions in Solution
RDF analysis of the interatomic distances in different molecules (Cl2 for the R-configuration molecule and F2 for the S-configuration molecule) was also carried out. As shown in Figure 14a, in isopropanol, r(Cl2-F2) has a greater probability of occurring at 2.89–5.73 Å and has the greatest probability at 3.33 Å. In isopropanol/n-hexane, r(Cl2-F2) occurs with greater probability in the range of 5.93–8.35 Å and has a maximum probability at 6.75 Å (Figure 14b). This indicates that the addition of n-hexane to isopropanol solution may hinder the interactions between the Cl atom of the R-configuration molecule and the F atom of the S-configuration molecules, leading to a difference in the molecular state in the solution before nucleation.
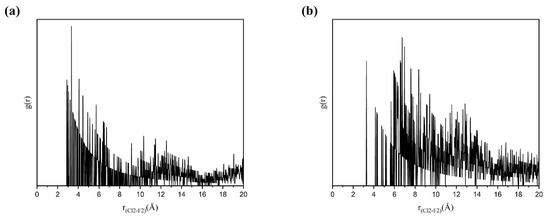
Figure 14.
(a) RDFs between the Cl2 of the R-configuration molecules and the F2 of the S-configuration molecules in isopropanol, (b) RDFs between the Cl2 of the R-configuration molecules and the F2 of the S-configuration molecules in isopropanol/n-hexane.
3.5.4. Selective Nucleation Mechanisms
The above results demonstrated that the solution chemistry can influence the self-assembly process of fluralaner molecules. The selective nucleation mechanism of Form I and Form III of fluralaner with similar crystal structures can be explained in terms of conformational distribution, solute–solvent interactions and solute–solute interactions, as shown in Figure 15. Firstly, there may be multiple conformations in solution, and the distribution of conformations of the fluralaner molecule in isopropanol and isopropanol/n-hexane may be similar, resulting in the same conformation in Form I and Form III. Secondly, the similarity of solute–solvent interactions in the isopropanol and isopropanol/n-hexane solutions leads to similar desolvation processes in both solvents. However, the addition of n-hexane reduces the probability of proximity of Cl2 of the fluralaner R-configuration molecule and F2 of the S-configuration molecule, so that intermolecular interactions are hindered, leading to difference in the interactions between solute molecules in solution before nucleation. This difference is retained during the self-assembly of fluralaner molecule. As a result, Form I with Cl2-F2 interactions in the structure is generated in isopropanol, while Form III is generated in isopropanol/n-hexane.
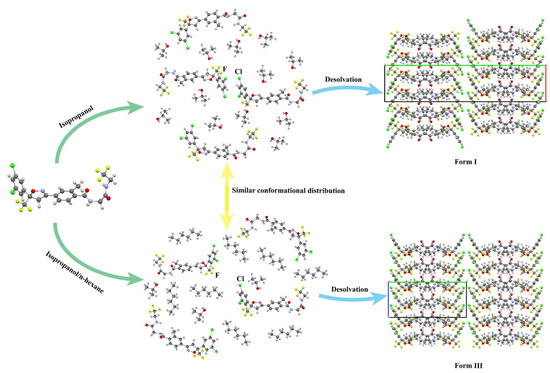
Figure 15.
Scheme of solution chemistry and polymorphic nucleation results.
4. Conclusions
In this work, Form I, Form Ⅱ, and Form III of fluralaner were investigated to explore their thermodynamic stability, phase transformation, and the selective nucleation mechanism of Form I and Form III with similar structure. Form I, Form Ⅱ, and Form III were comprehensively characterized by various analytical techniques such as PXRD, DSC/TGA, and FT-IR spectra, and it was found that Form I and Form III are structurally similar. The crystal structures of the three forms were analyzed and it was found that different molecular arrangements are the dominant factor in the differences in crystal structures of Form I and Form III, while Form Ⅱ had unique molecular conformation and packing pattern. The results of phase transformation experiments and lattice energy calculations show that the thermodynamic stability of the three forms is Form Ⅱ > Form I > Form III. Through FTIR spectra and MD simulations, it was found that the conformational distributions as well as solute–solvent interactions of fluralaner molecules in isopropanol and isopropanol/n-hexane are similar. However, the addition of n-hexane leads to a difference in the interactions between solute molecules in solution before nucleation. This difference is retained during the self-assembly of fluralaner molecules, leading to the nucleation of Form I in isopropanol while Form III in isopropanol/n-hexane.
Supplementary Materials
The following supporting information can be downloaded at: https://www.mdpi.com/article/10.3390/cryst13081241/s1, Figure S1: Solid-state NMR spectra of fluralaner Form I and Form III; Figure S2: The FT-IR curves of Form I, Form Ⅱ and Form III; Figure S3: Weak π-π interactions in the crystal structure of Form I; Figure S4: A view of Hirshfeld surface mapped over dnorm for crystal forms of Fluralaner: (a) Form I, (b) Form III; Figure S5: 2D Hirshfield fingerprint plots for Form I and Form III; Figure S6: DSC curves of Form III at different heating rates,(a) 10 °C/min, (b) 3/min, (c)1 °C/min; Figure S7: PXRD of Form III at different temperatures (165 °C and 171 °C); Figure S8: HSM images of Form III at different temperatures; Figure S9: The PXRD patterns of Form I in solvent-mediated phase transformation experiments; Figure S10: The PXRD patterns of Form III in solvent-mediated phase transformation experiments; Table S1: Experimental and simulated PXRD pattern peak positions (°) and relative intensities (%) of Form I, Form Ⅱ and Form III; Table S2: Hydrogen bonds in crystal structures of Form I, Form Ⅱ and Form III of fluralaner; Table S3: The detailed data of torsion angles; Table S4: Torsion angles of various conformers; Table S5: Molecular dynamics simulation details; Table S6: Thermal Data for Different Forms of Fluralaner Obtained by DSC; Table S7: The results of cooling crystallization experiment.
Author Contributions
Conceptualization, H.H.; methodology, T.W., X.H., N.W., B.T. and H.H.; software, G.L. and B.T.; validation, G.L.; formal analysis, G.L., L.Z. and Z.F.; investigation, G.L.; resources, B.T., A.L. and Y.L.; data curation, G.L. and Z.F.; writing—original draft preparation, G.L.; writing—review and editing, T.W.; supervision, T.W., X.H. and N.W.; project administration, L.Z.; funding acquisition, T.W. and H.H. All authors have read and agreed to the published version of the manuscript.
Funding
This project is funded by the National Natural Science Foundation of China (Grants 22208237 and 22108196).
Data Availability Statement
The data presented in this study are available in article and supplementary materials.
Acknowledgments
The authors acknowledge the financial support of the National Natural Science Foundation of China.
Conflicts of Interest
The authors declare no competing financial interest.
References
- Zhu, B.; Wang, J.-R.; Mei, X. Insight into the Phase Transformation among Various Solid Forms of Baicalein. Cryst. Growth Des. 2015, 15, 4959–4968. [Google Scholar] [CrossRef]
- Wang, J.-R.; Zhu, B.; Yu, Q.; Mei, X. Selective crystallization of vitamin D3for the preparation of novel conformational polymorphs with distinctive chemical stability. CrystEngComm 2016, 18, 1101–1104. [Google Scholar] [CrossRef]
- Bommaka, M.K.; Chaitanya Mannava, M.K.; Rai, S.K.; Suresh, K.; Nangia, A.K. Entacapone Polymorphs: Crystal Structures, Dissolution, Permeability, and Stability. Cryst. Growth Des. 2021, 21, 5573–5585. [Google Scholar] [CrossRef]
- Fandaruff, C.; Rauber, G.S.; Araya-Sibaja, A.M.; Pereira, R.N.; de Campos, C.E.M.; Rocha, H.V.A.; Monti, G.A.; Malaspina, T.; Silva, M.A.S.; Cuffini, S.L. Polymorphism of Anti-HIV Drug Efavirenz: Investigations on Thermodynamic and Dissolution Properties. Cryst. Growth Des. 2014, 14, 4968–4975. [Google Scholar] [CrossRef]
- Bauer, J.; Spanton, S.; Henry, R.; Quick, J.; Dziki, W.; Porter, W.; Morris, J. Ritonavir: An extraordinary example of conformational polymorphism. Pharm. Res. 2001, 18, 859–866. [Google Scholar] [CrossRef]
- Ding, Z.; Su, W.; Huang, X.; Tian, B.; Cheng, X.; Mao, Y.; Li, G.; Liu, H.; Hao, H. Understanding the Role of Water in Different Solid Forms of Avibactam Sodium and Its Affecting Mechanism. Cryst. Growth Des. 2020, 20, 1150–1161. [Google Scholar] [CrossRef]
- Hao, H.; Barrett, M.; Hu, Y.; Su, W.; Ferguson, S.; Wood, B.; Glennon, B. The Use of in Situ Tools To Monitor the Enantiotropic Transformation of p-Aminobenzoic Acid Polymorphs. Org. Process. Res. Dev. 2011, 16, 35–41. [Google Scholar] [CrossRef]
- Li, S.; Wang, T.; Huang, X.; Zhou, L.; Chen, M.; Liu, W.; Zhang, X.; Dong, Y.; Hao, H. The role of water in the formation of crystal structures: A case study of valnemulin hydrochloride. CrystEngComm 2021, 23, 47–55. [Google Scholar] [CrossRef]
- Davey, R.J.; Schroeder, S.L.; ter Horst, J.H. Nucleation of organic crystals--a molecular perspective. Angew. Chem. Int. Ed. Engl. 2013, 52, 2166–2179. [Google Scholar] [CrossRef]
- Van Driessche, A.E.S.; Van Gerven, N.; Bomans, P.H.H.; Joosten, R.R.M.; Friedrich, H.; Gil-Carton, D.; Sommerdijk, N.; Sleutel, M. Molecular nucleation mechanisms and control strategies for crystal polymorph selection. Nature 2018, 556, 89–94. [Google Scholar] [CrossRef]
- Chen, J.; Trout, B.L. Computational study of solvent effects on the molecular self-assembly of tetrolic acid in solution and implications for the polymorph formed from crystallization. J. Phys. Chem. B 2008, 112, 7794–7802. [Google Scholar] [CrossRef] [PubMed]
- Davey, R.J.; Blagden, N.; Righini, S.; Alison, H.; Quayle, M.J.; Fuller, S. Crystal polymorphism as a probe for molecular self-assembly during nucleation from solutions: The case of 2,6-dihydroxybenzoic acid. Cryst. Growth Des. 2001, 1, 59–65. [Google Scholar] [CrossRef]
- Gaines, E.; Di Tommaso, D. Solvation and Aggregation of Meta-Aminobenzoic Acid in Water: Density Functional Theory and Molecular Dynamics Study. Pharmaceutics 2018, 10, 12. [Google Scholar] [CrossRef] [PubMed]
- Li, X.; Wang, N.; Yang, J.; Huang, Y.; Ji, X.; Huang, X.; Wang, T.; Wang, H.; Hao, H. Molecular conformational evolution mechanism during nucleation of crystals in solution. IUCrJ 2020, 7, 542–556. [Google Scholar] [CrossRef]
- Zong, S.; Wang, J.K.; Wu, H.; Liu, Q.; Hao, Y.H.; Huang, X.; Wu, D.H.; Zhou, G.C.; Hao, H.X. Insight into the role of pre-assembly and desolvation in crystal nucleation: A case of p-nitrobenzoic acid. Acta Crystallogr. B 2019, 75, 845–854. [Google Scholar] [CrossRef]
- Du, W.; Cruz-Cabeza, A.J.; Woutersen, S.; Davey, R.J.; Yin, Q. Can the study of self-assembly in solution lead to a good model for the nucleation pathway? The case of tolfenamic acid. Chem. Sci. 2015, 6, 3515–3524. [Google Scholar] [CrossRef]
- Joseph, A.; Rodrigues Alves, J.S.; Bernardes, C.E.S.; Piedade, M.F.M.; Minas da Piedade, M.E. Tautomer selection through solvate formation: The case of 5-hydroxynicotinic acid. CrystEngComm 2019, 21, 2220–2233. [Google Scholar] [CrossRef]
- Burton, R.C.; Ferrari, E.S.; Davey, R.J.; Finney, J.L.; Bowron, D.T. The Relationship between Solution Structure and Crystal Nucleation: A Neutron Scattering Study of Supersaturated Methanolic Solutions of Benzoic Acid. J. Phys. Chem. B 2010, 114, 8807–8816. [Google Scholar] [CrossRef]
- Hylton, R.K.; Tizzard, G.J.; Threlfall, T.L.; Ellis, A.L.; Coles, S.J.; Seaton, C.C.; Schulze, E.; Lorenz, H.; Seidel-Morgenstern, A.; Stein, M.; et al. Are the Crystal Structures of Enantiopure and Racemic Mandelic Acids Determined by Kinetics or Thermodynamics? J. Am. Chem. Soc. 2015, 137, 11095–11104. [Google Scholar] [CrossRef]
- Mattei, A.; Li, T.L. Polymorph Formation and Nucleation Mechanism of Tolfenamic Acid in Solution: An Investigation of Pre-nucleation Solute Association. Pharm. Res. 2012, 29, 460–470. [Google Scholar] [CrossRef]
- de la Fuente, J.; Villar, M.; Contreras, M.; Moreno-Cid, J.A.; Merino, O.; Perez de la Lastra, J.M.; de la Fuente, G.; Galindo, R.C. Prospects for vaccination against the ticks of pets and the potential impact on pathogen transmission. Vet. Parasitol. 2015, 208, 26–29. [Google Scholar] [CrossRef] [PubMed][Green Version]
- Lehmann, T. Ectoparasites: Direct impact on host fitness. Parasitol. Today 1993, 9, 8–13. [Google Scholar] [CrossRef] [PubMed]
- Sarmah, A.K.; Meyer, M.T.; Boxall, A.B. A global perspective on the use, sales, exposure pathways, occurrence, fate and effects of veterinary antibiotics (VAs) in the environment. Chemosphere 2006, 65, 725–759. [Google Scholar] [CrossRef] [PubMed]
- Hiroyuki, K.; Shunsuke, F.; Yuji, M.; Manabu, Y.; Takashi, M. Manufacturing Method of Isoxazoline Substituted Benzamide Compounds. WO Patent WO2010005048A1, 9 July 2011. [Google Scholar]
- Bongiorno, G.; Meyer, L.; Evans, A.; Lekouch, N.; Doherty, P.; Chiummo, R.; Gradoni, L. Insecticidal efficacy against Phlebotomus perniciosus in dogs treated orally with fluralaner in two different parallel-group, negative-control, random and masked trials. Parasites Vectors 2022, 15, 18. [Google Scholar] [CrossRef] [PubMed]
- Dos Santos, K.C.; Chiummo, R.M.; Heckeroth, A.R.; Zschiesche, E.; Brandao Guedes, P.E.; Harvey, T.V.; de Jesus, A.V.; da Paixao Seva, A.; de Oliveira, J.T.S.; Dos Santos Freire, Z.; et al. Efficacy of oral fluralaner (Bravecto) against Tunga penetrans in dogs: A negative control, randomized field study in an endemic community in Brazil. PLoS Negl. Trop. Dis. 2022, 16, e0010251. [Google Scholar] [CrossRef]
- Sari, A.B.; Gunes, Y.; Anlas, C.; Ustun Alkan, F.; Guncum, E.; Ustuner, O.; Bakirel, T. Effects of feed intake and water hardness on fluralaner pharmacokinetics in layer chickens. J. Vet. Sci. 2022, 23, e64. [Google Scholar] [CrossRef]
- Xiong, T.; Ling, S.Q.; Liu, J.L.; Zeng, X.N. Insecticidal and P450 mediate metabolism of fluralaner against red imported fire ant, Solenopsis invicta (Hymenoptera: Formicidae). Pestic. Biochem. Physiol. 2022, 187, 105184. [Google Scholar] [CrossRef]
- Yan, Y.; Feng, L.; Shi, M.; Cui, C.; Liu, Y. Effect of plasma-activated water on the structure and in vitro digestibility of waxy and normal maize starches during heat-moisture treatment. Food Chem. 2020, 306, 125589. [Google Scholar] [CrossRef]
- Ma, H.; Chen, S.; Song, Y.; Yin, D.; Li, X.; Li, X. Experimental investigation into the effects of composition and microstructure on the tensile properties and failure characteristics of different gypsum rocks. Sci. Rep. 2021, 11, 14517. [Google Scholar] [CrossRef]
- Dolomanov, O.V.; Bourhis, L.J.; Gildea, R.J.; Howard, J.A.K.; Puschmann, H. OLEX2: A complete structure solution, refinement and analysis program. J. Appl. Crystallogr. 2009, 42, 339–341. [Google Scholar] [CrossRef]
- Sheldrick, G.M. SHELXT—Integrated space-group and crystal-structure determination. Acta Crystallogr. A 2015, 71, 3–8. [Google Scholar] [CrossRef] [PubMed]
- Sheldrick, G.M. Crystal structure refinement with SHELXL. Acta Crystallogr. C 2015, 71, 3–8. [Google Scholar] [CrossRef] [PubMed]
- Macrae, C.F.; Edgington, P.R.; McCabe, P.; Pidcock, E.; Shields, G.P.; Taylor, R.; Towler, M.; van De Streek, J. Mercury: Visualization and analysis of crystal structures. J. Appl. Crystallogr. 2006, 39, 453–457. [Google Scholar] [CrossRef]
- Martin, A.D.; Hartlieb, K.J.; Sobolev, A.N.; Raston, C.L. Hirshfeld Surface Analysis of Substituted Phenols. Cryst. Growth Des. 2010, 10, 5302–5306. [Google Scholar] [CrossRef]
- McKinnon, J.J.; Fabbiani, F.P.A.; Spackman, M.A. Comparison of polymorphic molecular crystal structures through Hirshfeld surface analysis. Cryst. Growth Des. 2007, 7, 755–769. [Google Scholar] [CrossRef]
- Wang, Y.; Verma, P.; Jin, X.S.; Truhlar, D.G.; He, X. Revised M06 density functional for main-group and transition-metal chemistry. Proc. Natl. Acad. Sci. USA 2018, 115, 10257–10262. [Google Scholar] [CrossRef]
- Sun, H.; Jin, Z.; Yang, C.W.; Akkermans, R.L.C.; Robertson, S.H.; Spenley, N.A.; Miller, S.; Todd, S.M. COMPASS II: Extended coverage for polymer and drug-like molecule databases. J. Mol. Model. 2016, 22, 47. [Google Scholar] [CrossRef]
- Al-Zoubi, N.; Koundourellis, J.E.; Malamataris, S. FT-IR and Raman spectroscopic methods for identification and quantitation of orthorhombic and monoclinic paracetamol in powder mixes. J. Pharm. Anal. 2002, 29, 459–467. [Google Scholar] [CrossRef] [PubMed]
- Csermely, P.; Palotai, R.; Nussinov, R. Induced fit, conformational selection and independent dynamic segments: An extended view of binding events. Trends Biochem. Sci. 2010, 35, 539–546. [Google Scholar] [CrossRef]
- Taylor, R.; Macrae, C.F. Rules governing the crystal packing of mono- and dialcohols. Acta Crystallogr. B 2001, 57, 815–827. [Google Scholar] [CrossRef]
- Tan, S.L.; Jotani, M.M.; Tiekink, E.R.T. Utilizing Hirshfeld surface calculations, non-covalent interaction (NCI) plots and the calculation of interaction energies in the analysis of molecular packing. Acta Crystallogr. Sect. E 2019, 75, 308–318. [Google Scholar] [CrossRef] [PubMed]
- Jemai, M.; Khalfi, M.; Issaoui, N.; Roisnel, T.; Kazachenko, A.S.; Al-Dossary, O.; Marouani, H.; Malyar, Y.N. Role of Non-Covalent Interactions in Novel Supramolecular Compound, Bis(4-phenylpiperazin-1-ium) Oxalate Dihydrate: Synthesis, Molecular Structure, Thermal Characterization, Spectroscopic Properties and Quantum Chemical Study. Crystals 2023, 13, 875. [Google Scholar] [CrossRef]
- Das, D.; Banerjee, R.; Mondal, R.; Howard, J.A.; Boese, R.; Desiraju, G.R. Synthon evolution and unit cell evolution during crystallisation. A study of symmetry-independent molecules (Z′ > 1) in crystals of some hydroxy compounds. Chem. Commun. 2006, 5, 555–557. [Google Scholar] [CrossRef]
- Joseph, A.; Bernardes, C.E.S.; Druzhinina, A.I.; Varushchenko, R.M.; Nguyen, T.Y.; Emmerling, F.; Yuan, L.; Dupray, V.; Coquerel, G.; da Piedade, M.E.M. Polymorphic Phase Transition in 4′-Hydroxyacetophenone: Equilibrium Temperature, Kinetic Barrier, and the Relative Stability of Z′ = 1 and Z′ = 2 Forms. Cryst. Growth Des. 2017, 17, 1918–1932. [Google Scholar] [CrossRef]
- Desiraju, G.R. On the presence of multiple molecules in the crystal asymmetric unit (Z' > 1). CrystEngComm 2007, 9, 91–92. [Google Scholar] [CrossRef]
- Steed, K.M.; Steed, J.W. Packing problems: High Z' crystal structures and their relationship to cocrystals, inclusion compounds, and polymorphism. Chem. Rev. 2015, 115, 2895–2933. [Google Scholar] [CrossRef] [PubMed]
- Derdour, L.; Pack, S.K.; Skliar, D.; Lai, C.J.; Kiang, S. Crystallization from solutions containing multiple conformers: A new modeling approach for solubility and supersaturation. Chem. Eng. Sci. 2011, 66, 88–102. [Google Scholar] [CrossRef]
- Derdour, L.; Skliar, D. A review of the effect of multiple conformers on crystallization from solution and strategies for crystallizing slow inter-converting conformers. Chem. Eng. Sci. 2014, 106, 275–292. [Google Scholar] [CrossRef]


Disclaimer/Publisher’s Note: The statements, opinions and data contained in all publications are solely those of the individual author(s) and contributor(s) and not of MDPI and/or the editor(s). MDPI and/or the editor(s) disclaim responsibility for any injury to people or property resulting from any ideas, methods, instructions or products referred to in the content. |
© 2023 by the authors. Licensee MDPI, Basel, Switzerland. This article is an open access article distributed under the terms and conditions of the Creative Commons Attribution (CC BY) license (https://creativecommons.org/licenses/by/4.0/).