
An Optimized Approach for Serial Crystallography Using Chips

 , , and
Abstract
1. Introduction
2. Materials and Methods
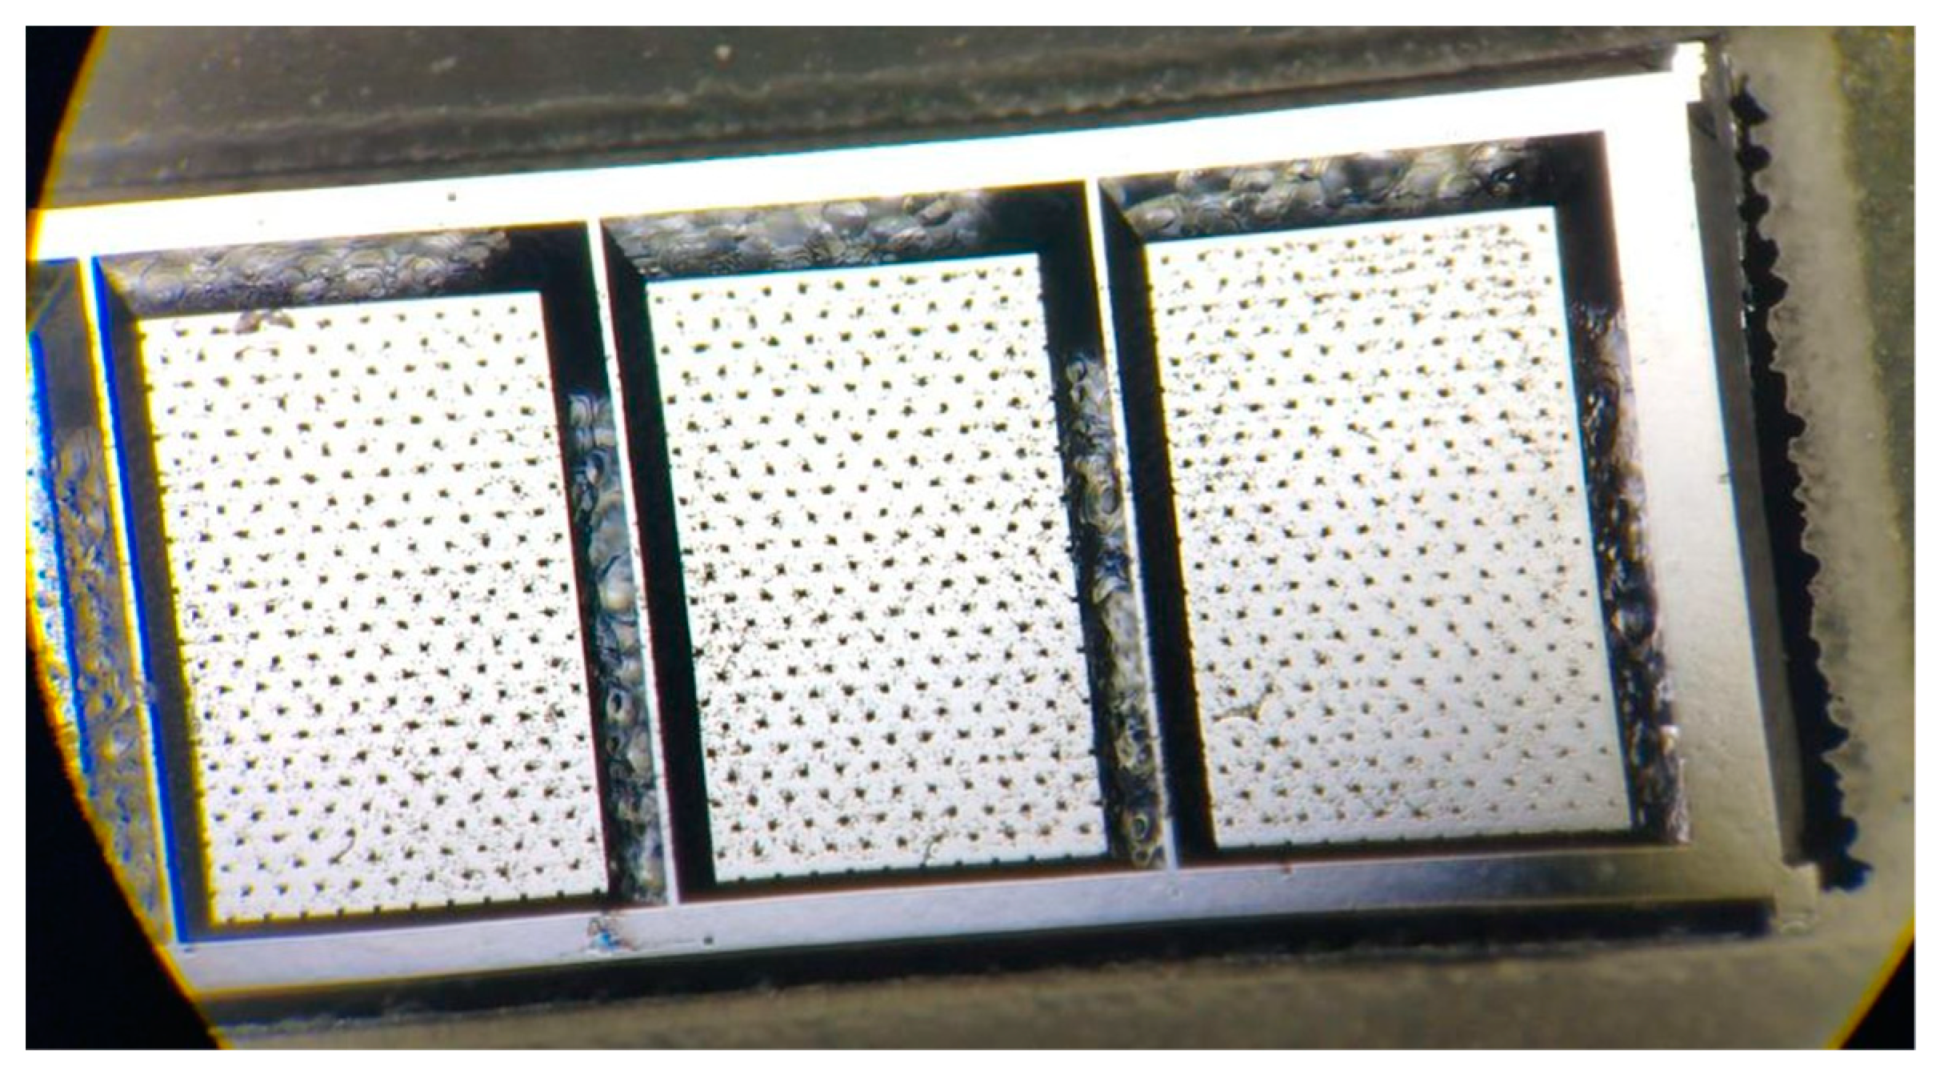
2.1. Sample Preparation
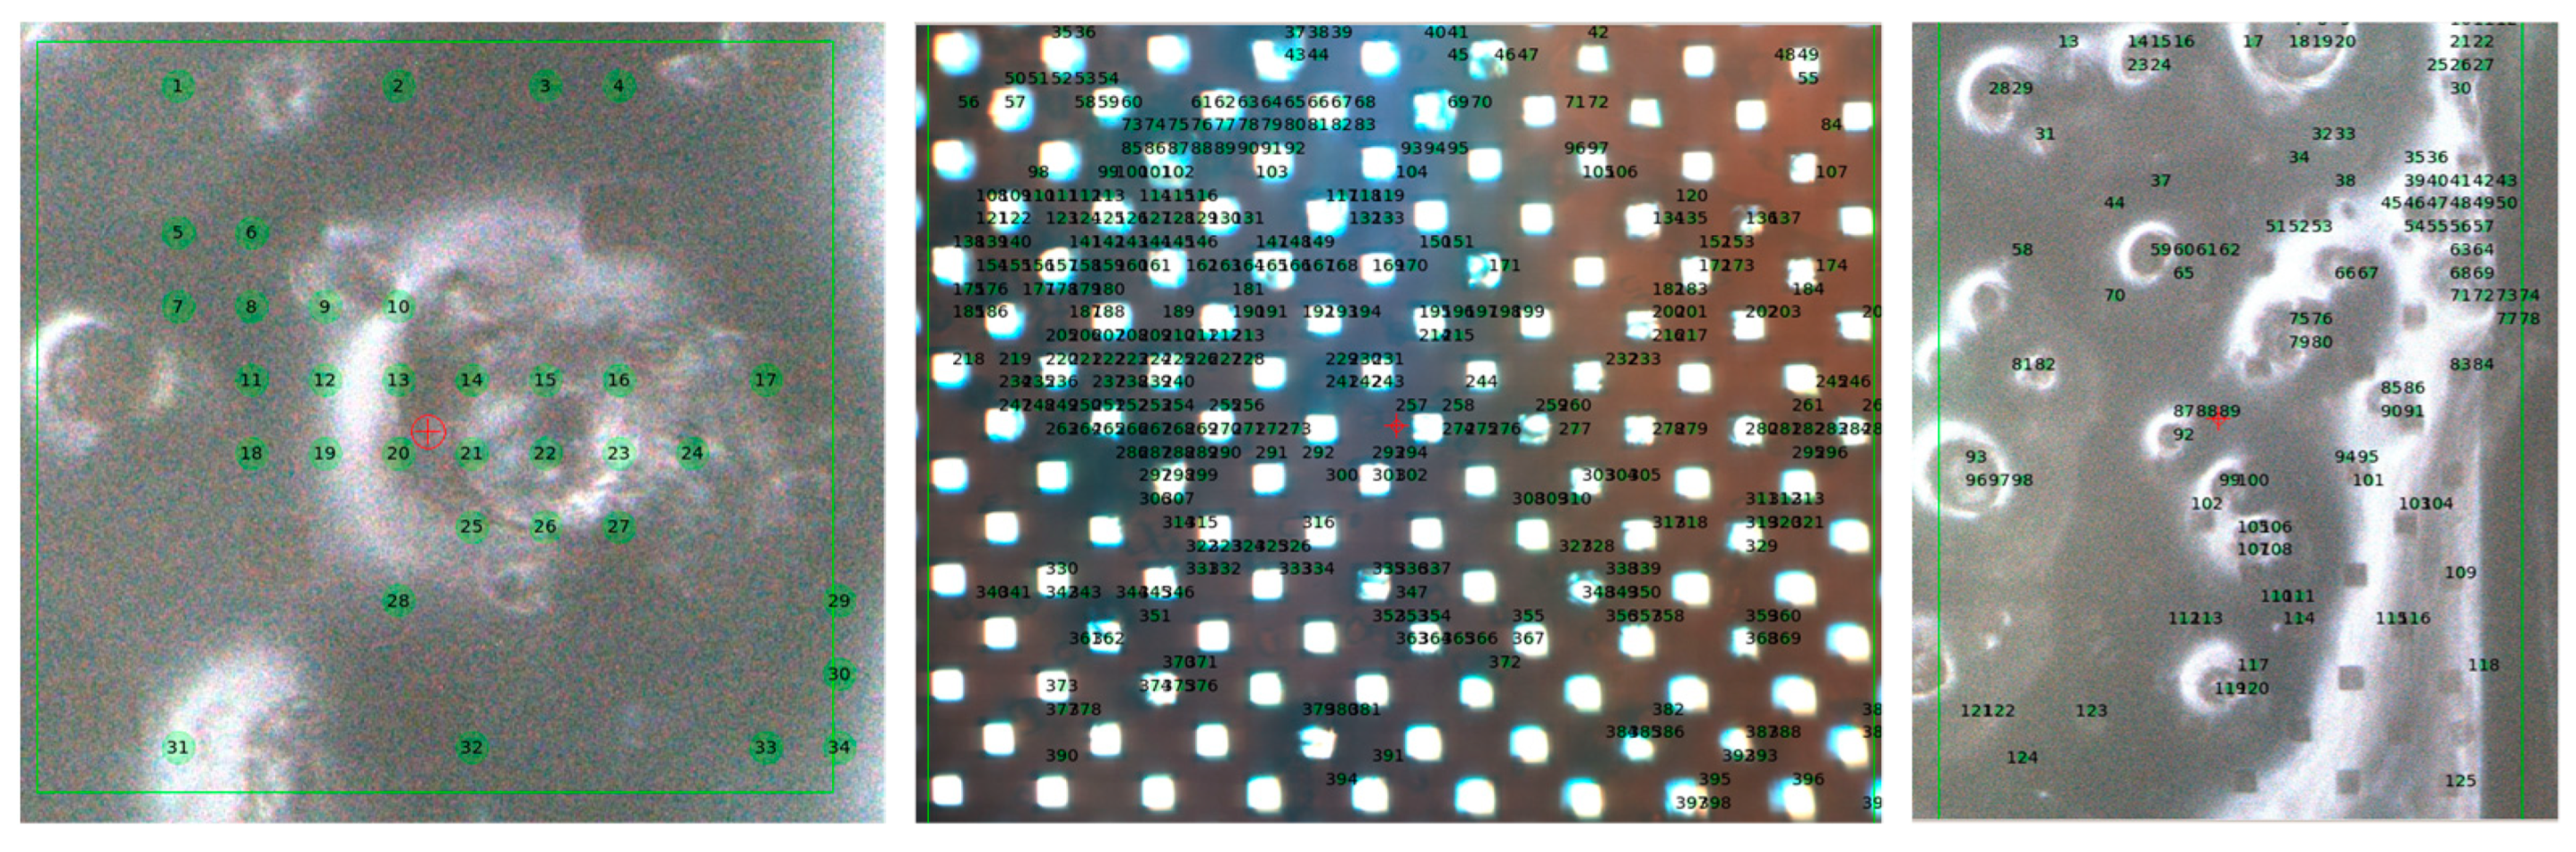
2.2. Experimental Setup and Data Collection
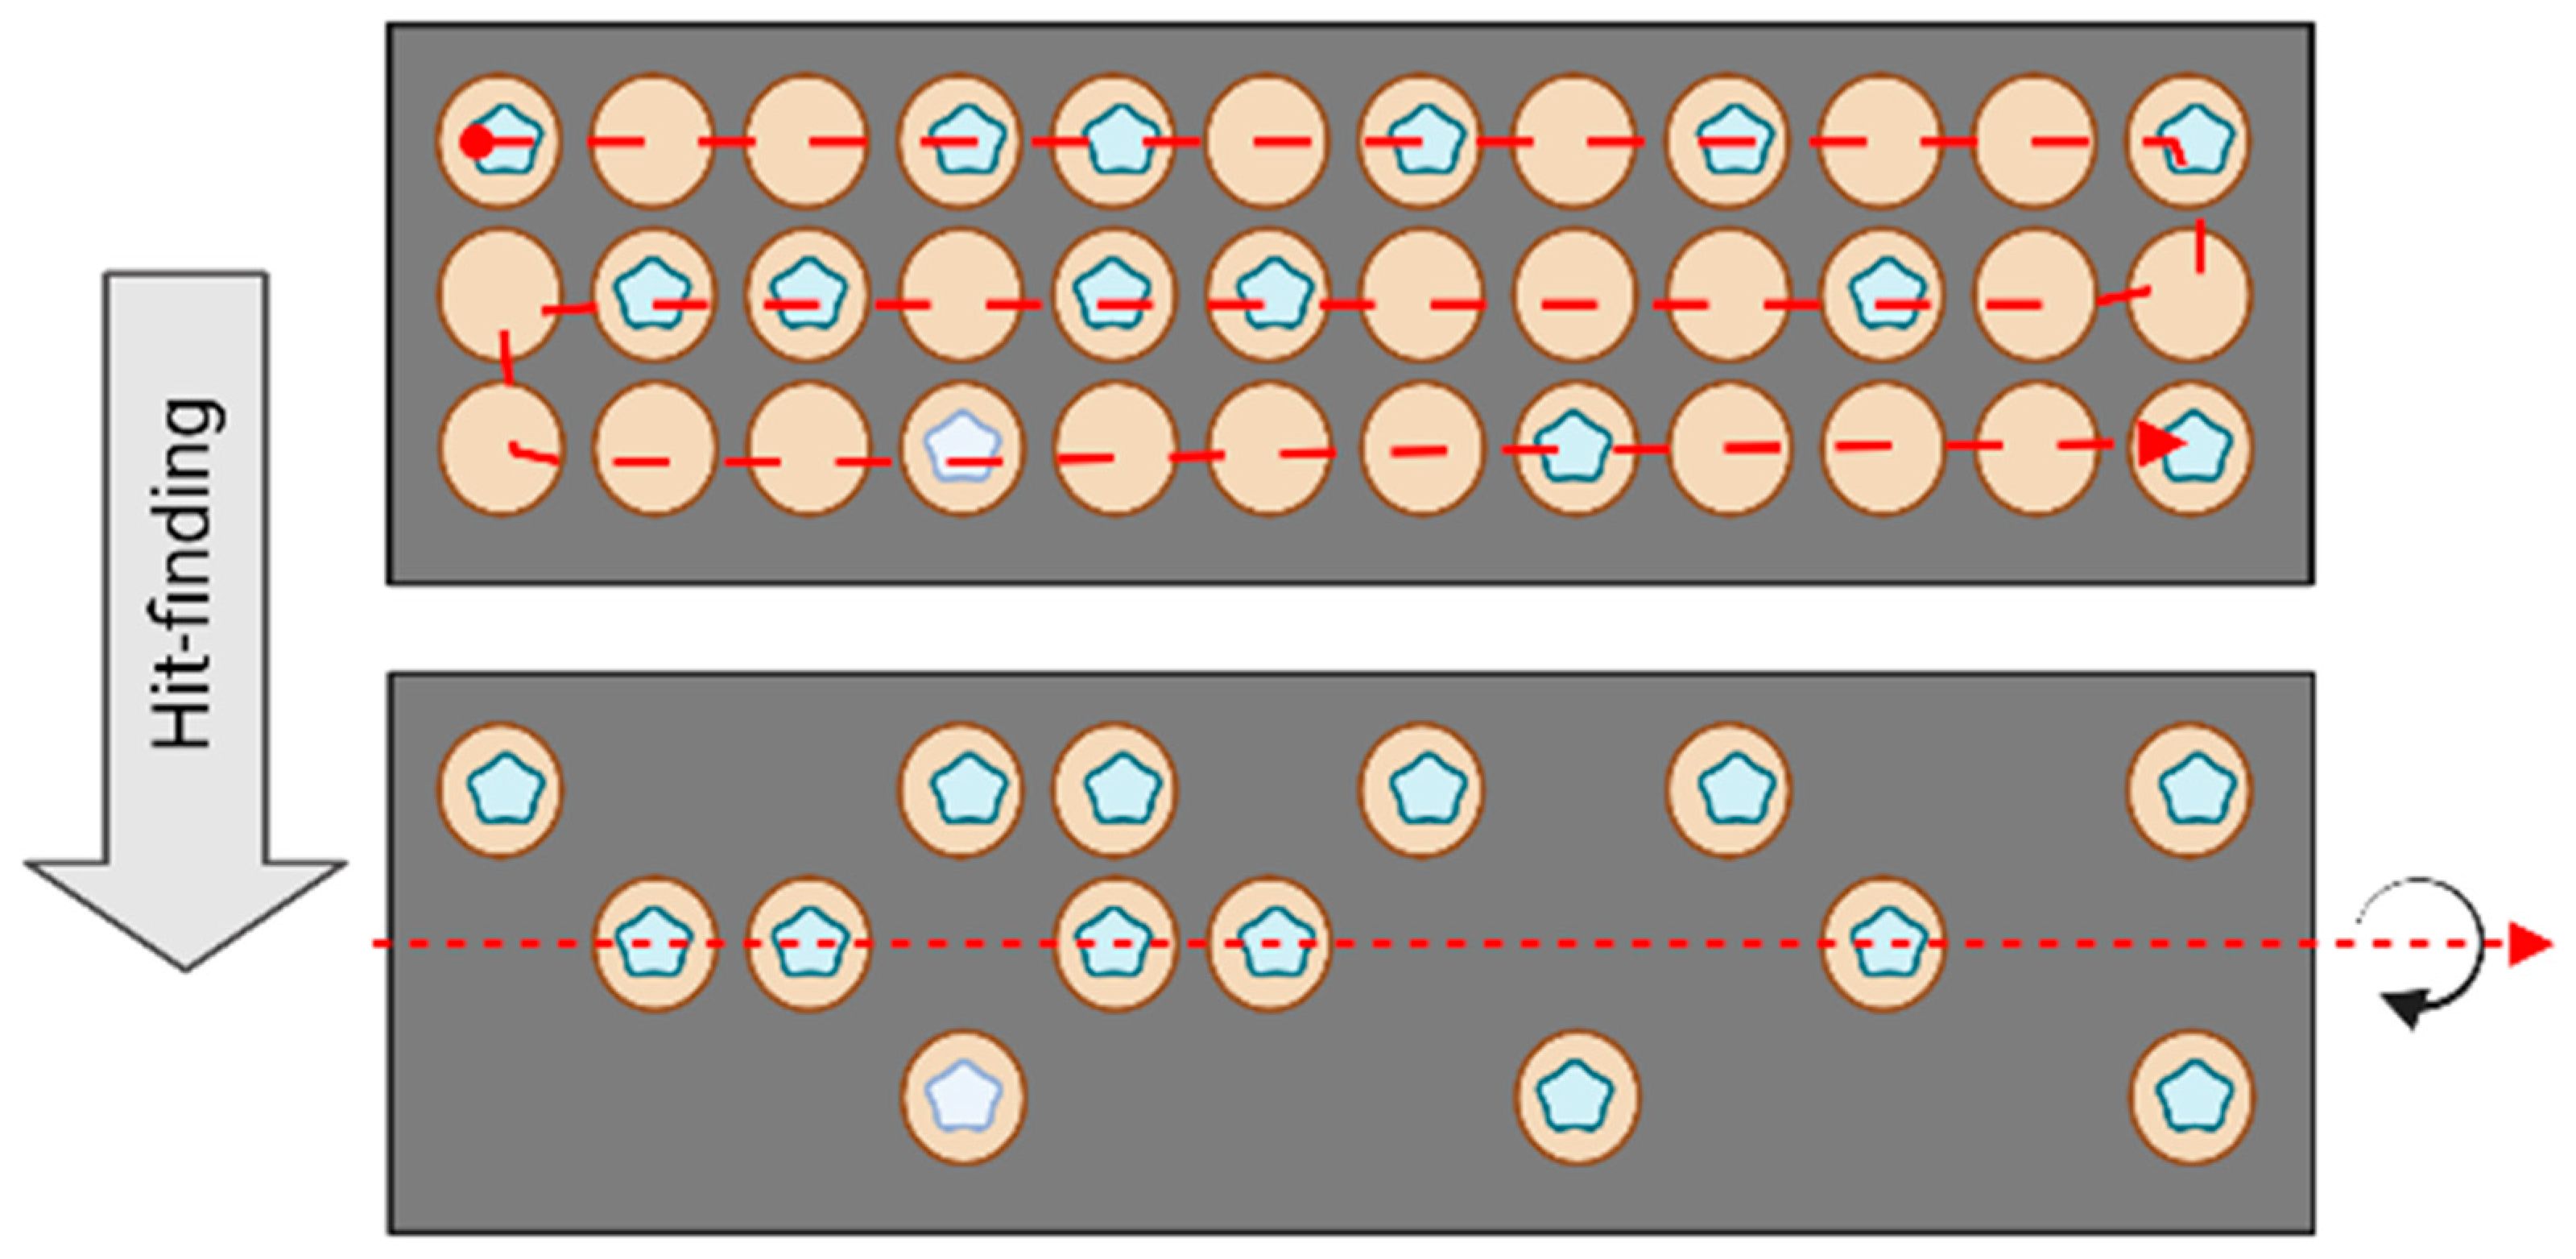
2.3. Data Analysis
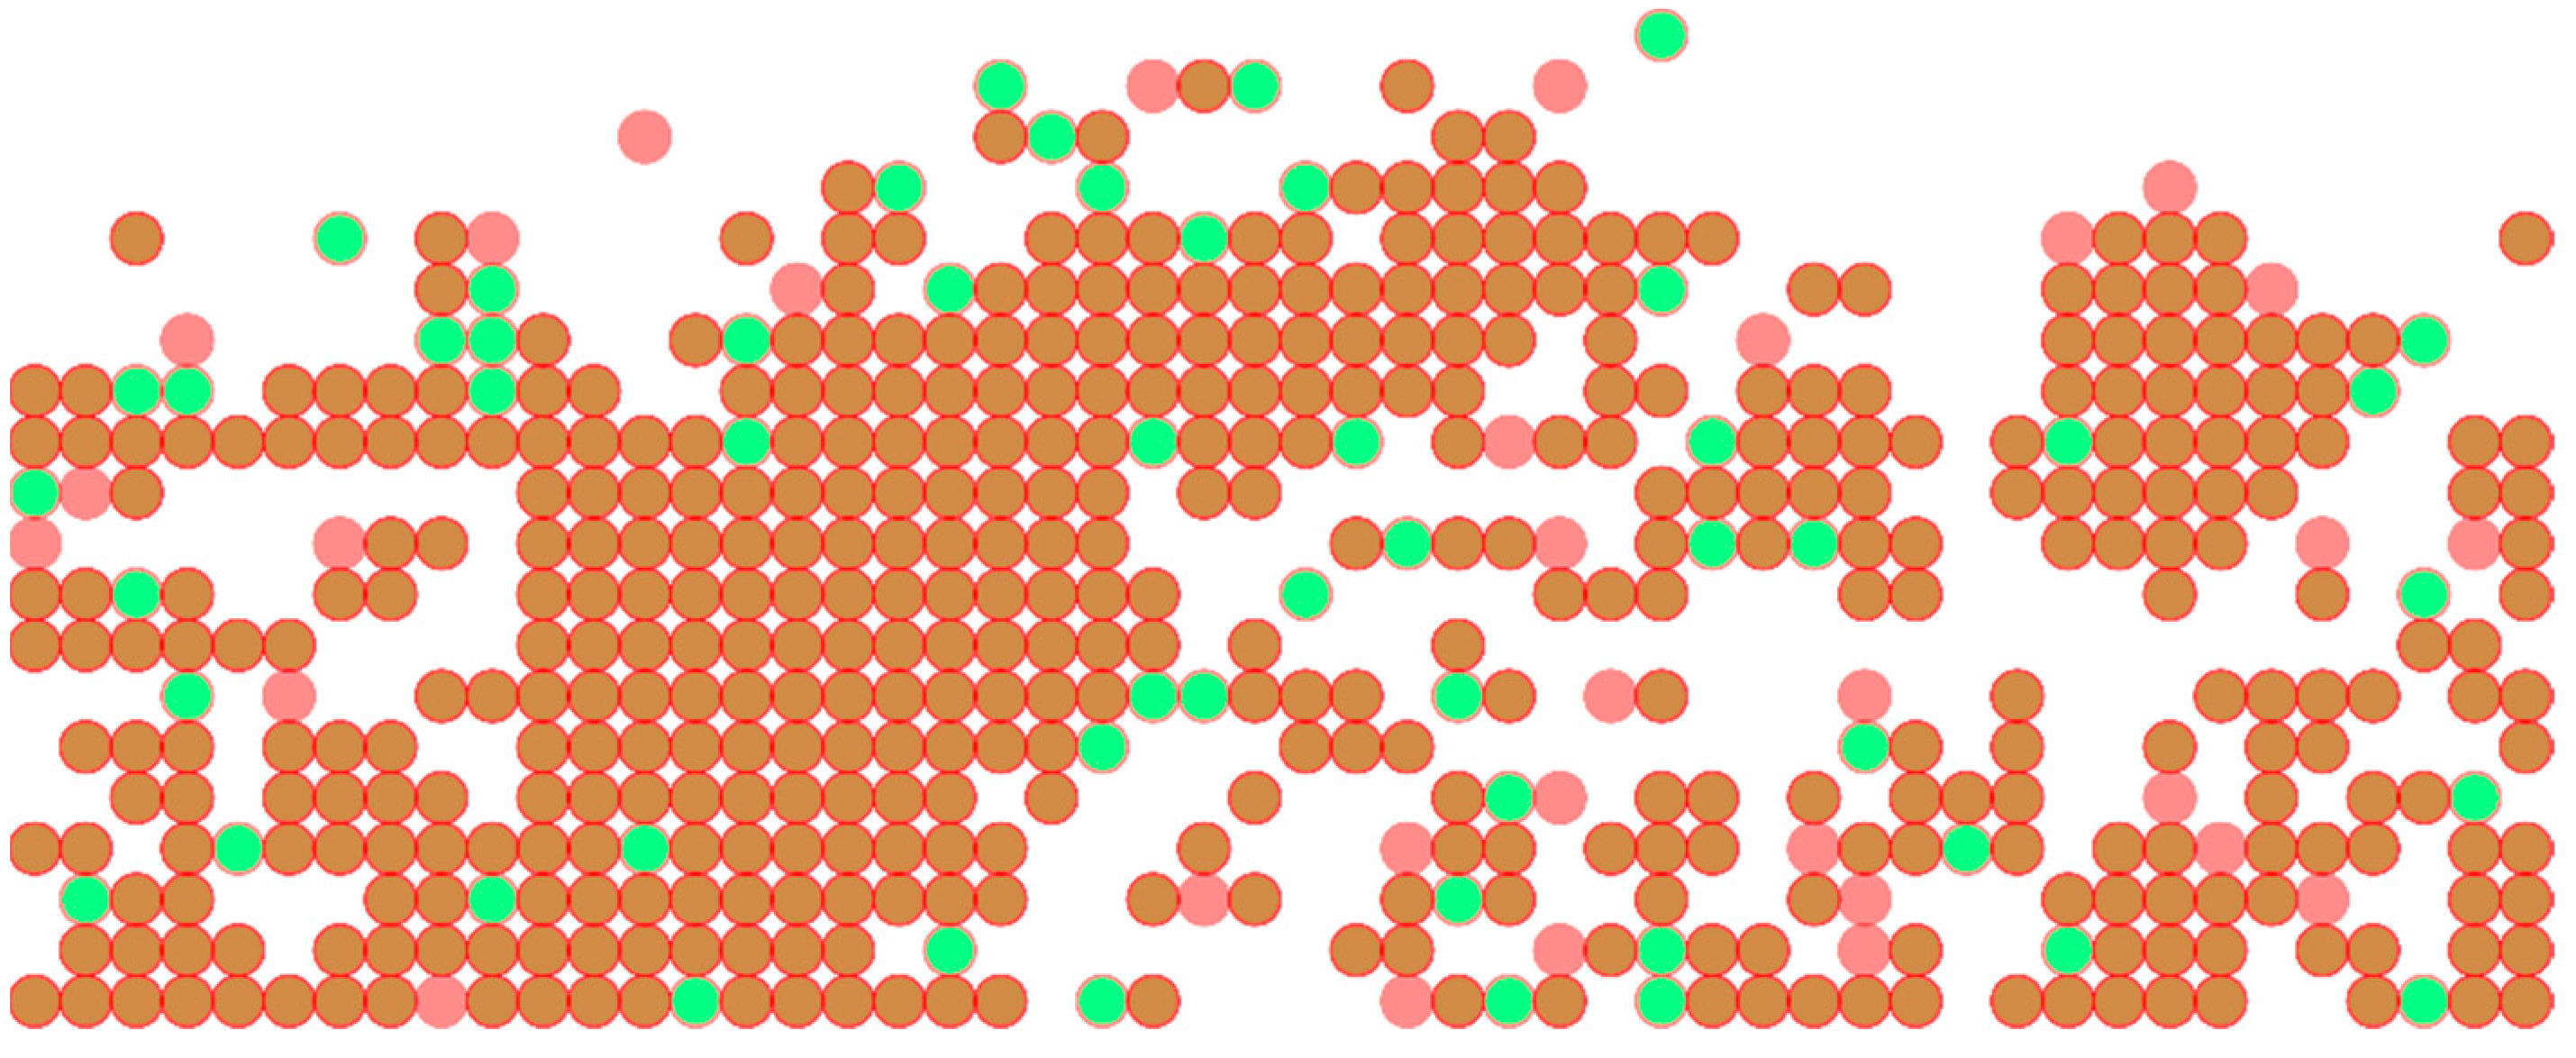
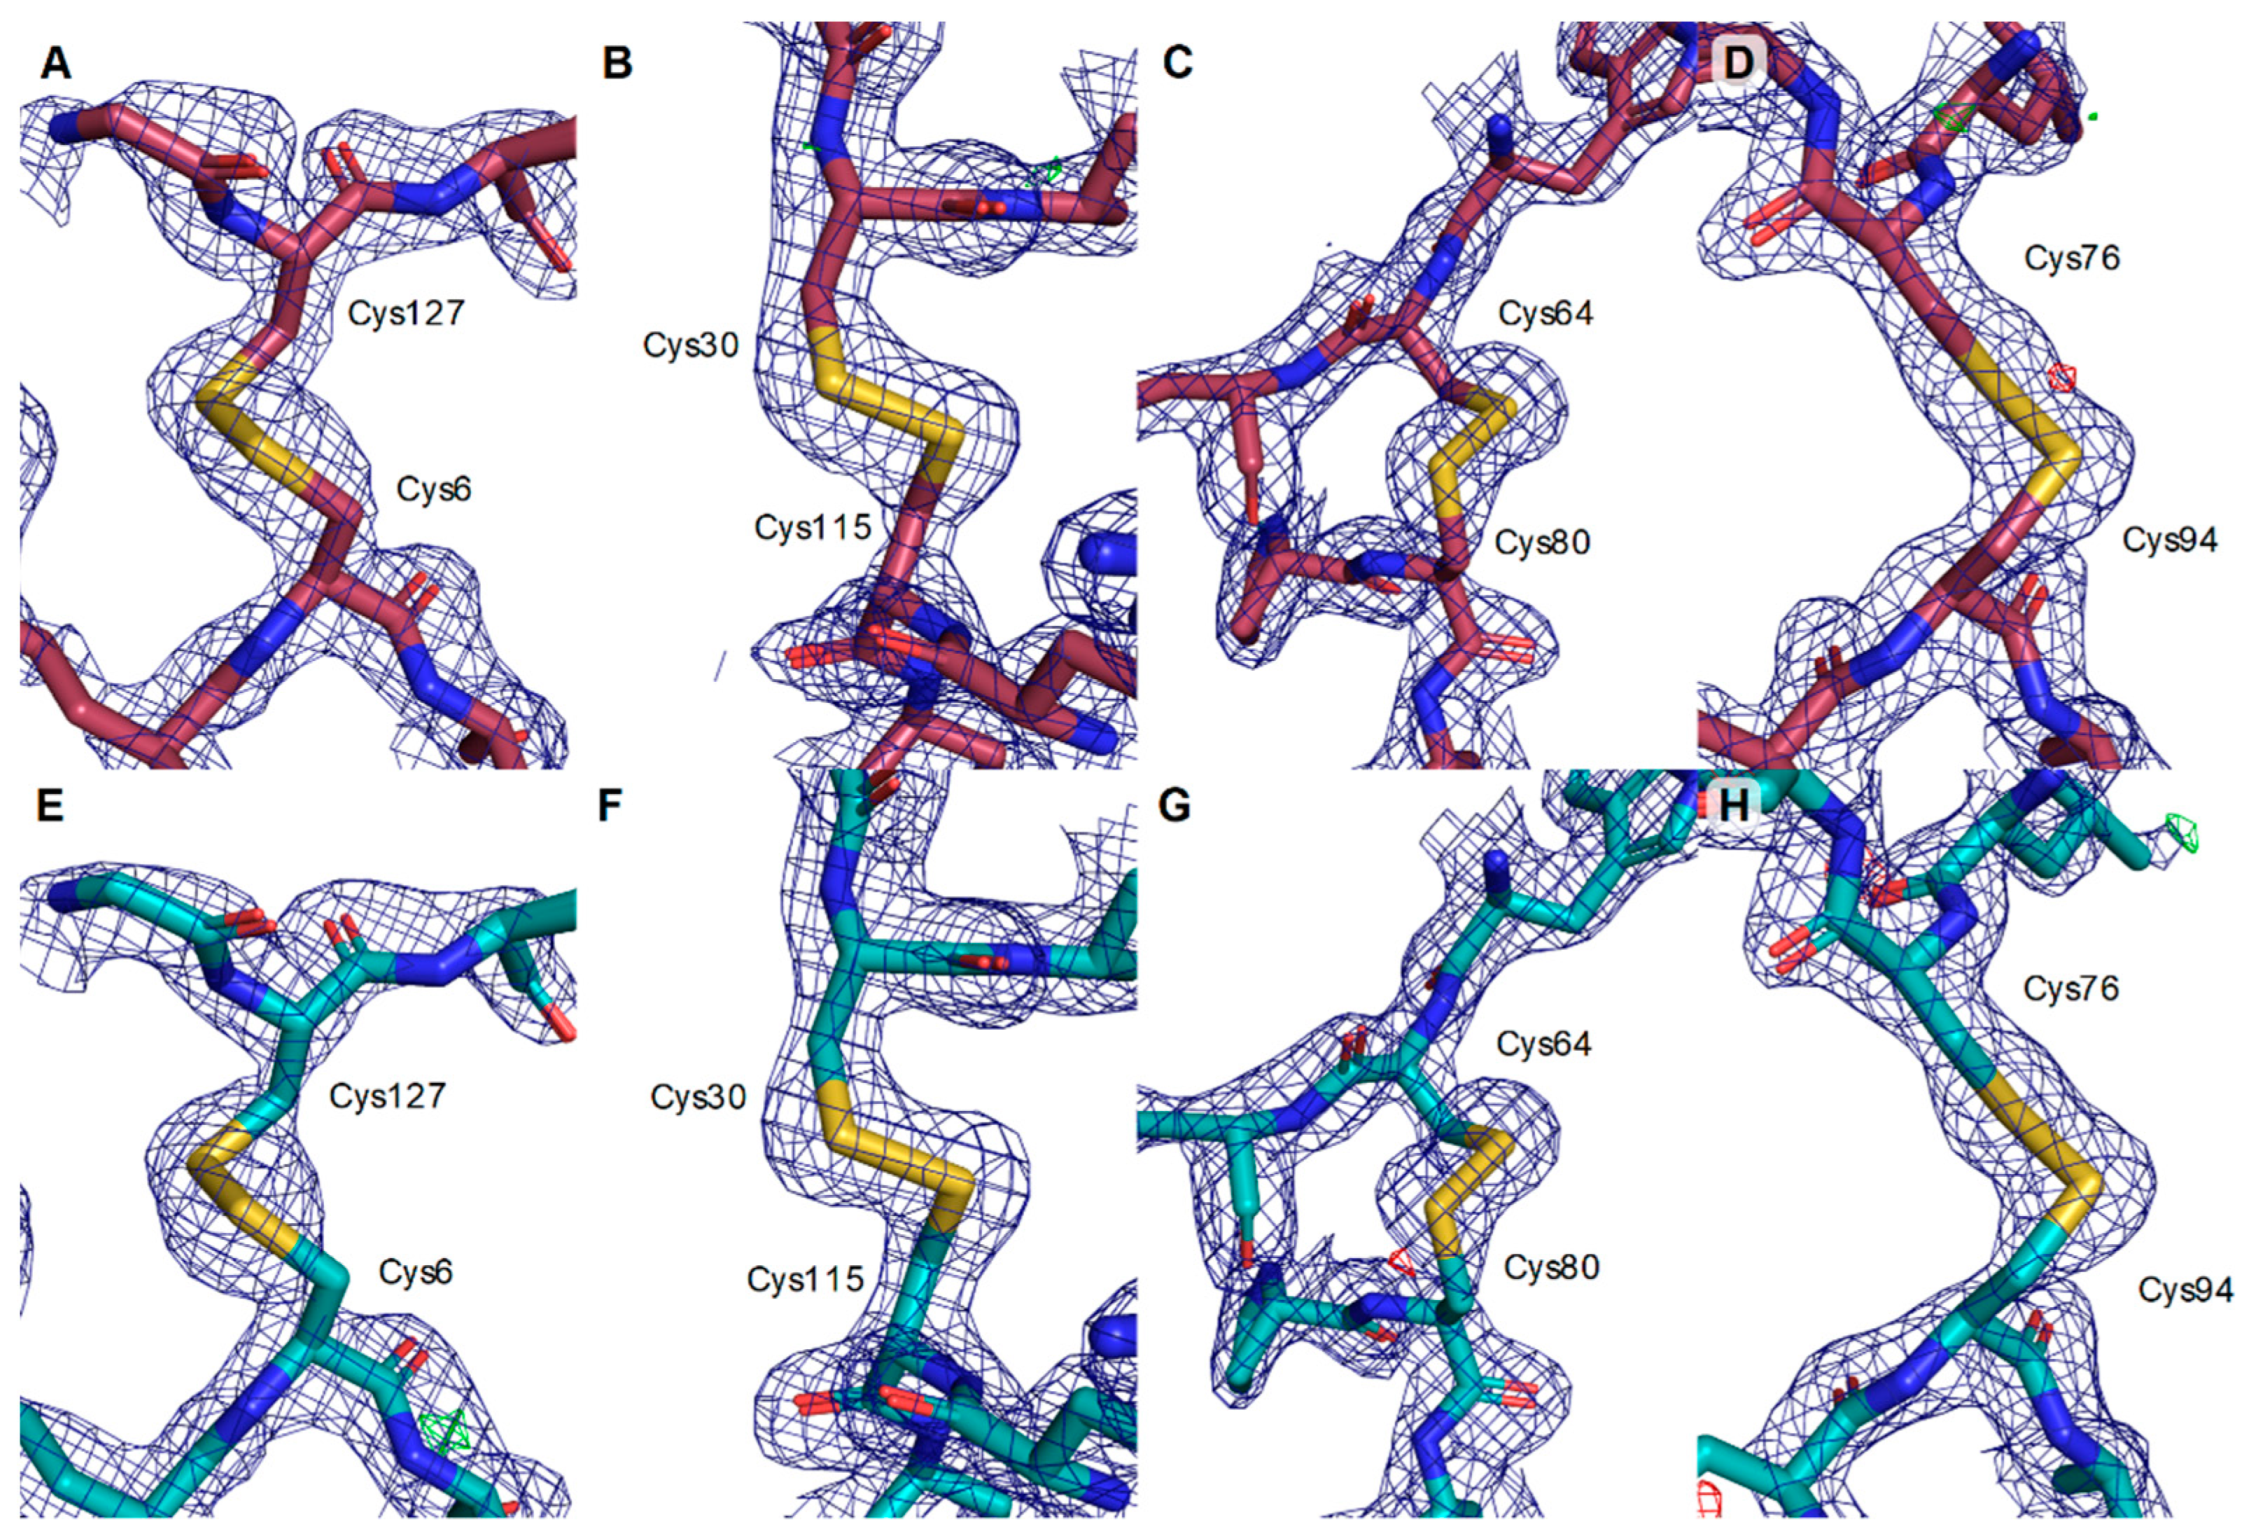
3. Results
4. Discussion
Author Contributions
Funding
Data Availability Statement
Acknowledgments
Conflicts of Interest
References
- Garman, E.F. Radiation Damage in Macromolecular Crystallography: What Is It and Why Should We Care? Acta Crystallogr. Sect. D Biol. Crystallogr. 2010, 66, 339–351. [Google Scholar] [CrossRef]
- Nass, K. Radiation Damage in Protein Crystallography at X-ray Free-Electron Lasers. Acta Crystallogr. D Struct. Biol. 2019, 75, 211–218. [Google Scholar] [CrossRef]
- Brändén, G.; Neutze, R. Advances and Challenges in Time-Resolved Macromolecular Crystallography. Science 2021, 373, eaba0954. [Google Scholar] [CrossRef]
- Chapman, H.N.; Fromme, P.; Barty, A.; White, T.A.; Kirian, R.A.; Aquila, A.; Hunter, M.S.; Schulz, J.; DePonte, D.P.; Weierstall, U.; et al. Femtosecond X-Ray Protein Nanocrystallography. Nature 2011, 470, 73–77. [Google Scholar] [CrossRef]
- Boutet, S.; Lomb, L.; Williams, G.J.; Barends, T.R.M.; Aquila, A.; Doak, R.B.; Weierstall, U.; DePonte, D.P.; Steinbrener, J.; Shoeman, R.L.; et al. High-Resolution Protein Structure Determination by Serial Femtosecond Crystallography. Science 2012, 337, 362–364. [Google Scholar] [CrossRef]
- Stellato, F.; Oberthür, D.; Liang, M.; Bean, R.; Gati, C.; Yefanov, O.; Barty, A.; Burkhardt, A.; Fischer, P.; Galli, L.; et al. Room-Temperature Macromolecular Serial Crystallography Using Synchrotron Radiation. IUCrJ 2014, 1, 204–212. [Google Scholar] [CrossRef]
- Gati, C.; Bourenkov, G.; Klinge, M.; Rehders, D.; Stellato, F.; Oberthür, D.; Yefanov, O.; Sommer, B.P.; Mogk, S.; Duszenko, M.; et al. Serial Crystallography on in Vivo Grown Microcrystals Using Synchrotron Radiation. IUCrJ 2014, 1, 87–94. [Google Scholar] [CrossRef]
- Schmidt, M. Time-Resolved Macromolecular Crystallography at Pulsed X-ray Sources. Int. J. Mol. Sci. 2019, 20, 1401. [Google Scholar] [CrossRef]
- Schmidt, M. Reaction Initiation in Enzyme Crystals by Diffusion of Substrate. Crystals 2020, 10, 116. [Google Scholar] [CrossRef]
- Grünbein, M.L.; Nass Kovacs, G. Sample Delivery for Serial Crystallography at Free-Electron Lasers and Synchrotrons. Acta Crystallogr. D Struct. Biol. 2019, 75, 178–191. [Google Scholar] [CrossRef]
- Zhao, F.; Zhang, B.; Yan, E.; Sun, B.; Wang, Z.; He, J.; Yin, D. A Guide to Sample Delivery Systems for Serial Crystallography. FEBS J. 2019, 286, 4402–4417. [Google Scholar] [CrossRef]
- DePonte, D.P.; Weierstall, U.; Schmidt, K.; Warner, J.; Starodub, D.; Spence, J.C.H.; Doak, R.B. Gas Dynamic Virtual Nozzle for Generation of Microscopic Droplet Streams. J. Phys. D Appl. Phys. 2008, 41, 195505. [Google Scholar] [CrossRef]
- Oberthuer, D.; Knoška, J.; Wiedorn, M.O.; Beyerlein, K.R.; Bushnell, D.A.; Kovaleva, E.G.; Heymann, M.; Gumprecht, L.; Kirian, R.A.; Barty, A.; et al. Double-Flow Focused Liquid Injector for Efficient Serial Femtosecond Crystallography. Sci. Rep. 2017, 7, 44628. [Google Scholar] [CrossRef]
- Weierstall, U.; James, D.; Wang, C.; White, T.A.; Wang, D.; Liu, W.; Spence, J.C.H.; Bruce Doak, R.; Nelson, G.; Fromme, P.; et al. Lipidic Cubic Phase Injector Facilitates Membrane Protein Serial Femtosecond Crystallography. Nat. Commun. 2014, 5, 3309. [Google Scholar] [CrossRef]
- Henkel, A.; Maracke, J.; Munke, A.; Galchenkova, M.; Rahmani Mashhour, A.; Reinke, P.; Domaracky, M.; Fleckenstein, H.; Hakanpää, J.; Meyer, J.; et al. CFEL TapeDrive 2.0: A Conveyor Belt-Based Sample-Delivery System for Multi-Dimensional Serial Crystallography. Acta Crystallogr. A Found. Adv. 2022, 78, e560. [Google Scholar] [CrossRef]
- Hunter, M.S.; Segelke, B.; Messerschmidt, M.; Williams, G.J.; Zatsepin, N.A.; Barty, A.; Benner, W.H.; Carlson, D.B.; Coleman, M.; Graf, A.; et al. Fixed-Target Protein Serial Microcrystallography with an x-Ray Free Electron Laser. Sci. Rep. 2014, 4, 6026. [Google Scholar] [CrossRef]
- Mueller, C.; Marx, A.; Epp, S.W.; Zhong, Y.; Kuo, A.; Balo, A.R.; Soman, J.; Schotte, F.; Lemke, H.T.; Owen, R.L.; et al. Fixed Target Matrix for Femtosecond Time-Resolved and in Situ Serial Micro-Crystallography. Struct. Dyn. 2015, 2, 054302. [Google Scholar] [CrossRef]
- Roedig, P.; Vartiainen, I.; Duman, R.; Panneerselvam, S.; Stübe, N.; Lorbeer, O.; Warmer, M.; Sutton, G.; Stuart, D.I.; Weckert, E.; et al. A Micro-Patterned Silicon Chip as Sample Holder for Macromolecular Crystallography Experiments with Minimal Background Scattering. Sci. Rep. 2015, 5, 10451. [Google Scholar] [CrossRef]
- Oghbaey, S.; Sarracini, A.; Ginn, H.M.; Pare-Labrosse, O.; Kuo, A.; Marx, A.; Epp, S.W.; Sherrell, D.A.; Eger, B.T.; Zhong, Y.; et al. Fixed Target Combined with Spectral Mapping: Approaching 100% Hit Rates for Serial Crystallography. Acta Crystallogr. D Struct. Biol. 2016, 72, 944–955. [Google Scholar] [CrossRef]
- Owen, R.L.; Axford, D.; Sherrell, D.A.; Kuo, A.; Ernst, O.P.; Schulz, E.C.; Miller, R.J.D.; Mueller-Werkmeister, H.M. Low-Dose Fixed-Target Serial Synchrotron Crystallography. Acta Crystallogr. D Struct. Biol. 2017, 73, 373–378. [Google Scholar] [CrossRef]
- Kisselman, G.; Qiu, W.; Romanov, V.; Thompson, C.M.; Lam, R.; Battaile, K.P.; Pai, E.F.; Chirgadze, N.Y. X-CHIP: An Integrated Platform for High-Throughput Protein Crystallization and on-the-Chip X-Ray Diffraction Data Collection. Acta Crystallogr. D Biol. Crystallogr. 2011, 67, 533–539. [Google Scholar] [CrossRef]
- Roedig, P.; Ginn, H.M.; Pakendorf, T.; Sutton, G.; Harlos, K.; Walter, T.S.; Meyer, J.; Fischer, P.; Duman, R.; Vartiainen, I.; et al. High-Speed Fixed-Target Serial Virus Crystallography. Nat. Methods 2017, 14, 805–810. [Google Scholar] [CrossRef]
- Meents, A.; Wiedorn, M.O.; Srajer, V.; Henning, R.; Sarrou, I.; Bergtholdt, J.; Barthelmess, M.; Reinke, P.Y.A.; Dierksmeyer, D.; Tolstikova, A.; et al. Pink-Beam Serial Crystallography. Nat. Commun. 2017, 8, 1281. [Google Scholar] [CrossRef]
- Park, S.-Y.; Choi, H.; Eo, C.; Cho, Y.; Nam, K.H. Fixed-Target Serial Synchrotron Crystallography Using Nylon Mesh and Enclosed Film-Based Sample Holder. Crystals 2020, 10, 803. [Google Scholar] [CrossRef]
- Gilbile, D.; Shelby, M.L.; Lyubimov, A.Y.; Wierman, J.L.; Monteiro, D.C.F.; Cohen, A.E.; Russi, S.; Coleman, M.A.; Frank, M.; Kuhl, T.L. Plug-and-Play Polymer Microfluidic Chips for Hydrated, Room Temperature, Fixed-Target Serial Crystallography. Lab Chip 2021, 21, 4831–4845. [Google Scholar] [CrossRef]
- Lee, K.Y. Micromachining Applications of a High Resolution Ultrathick Photoresist. J. Vac. Sci. Technol. B 1995, 13, 3012. [Google Scholar] [CrossRef]
- Lieske, J.; Cerv, M.; Kreida, S.; Komadina, D.; Fischer, J.; Barthelmess, M.; Fischer, P.; Pakendorf, T.; Yefanov, O.; Mariani, V.; et al. On-Chip Crystallization for Serial Crystallography Experiments and on-Chip Ligand-Binding Studies. IUCrJ 2019, 6, 714–728. [Google Scholar] [CrossRef]
- Wierman, J.L.; Paré-Labrosse, O.; Sarracini, A.; Besaw, J.E.; Cook, M.J.; Oghbaey, S.; Daoud, H.; Mehrabi, P.; Kriksunov, I.; Kuo, A.; et al. Fixed-Target Serial Oscillation Crystallography at Room Temperature. IUCrJ 2019, 6, 305–316. [Google Scholar] [CrossRef]
- Asanov, A.N.; McDonald, H.M.; Oldham, P.B.; Jedrzejas, M.J.; Wilson, W.W. Intrinsic Fluorescence as a Potential Rapid Scoring Tool for Protein Crystals. J. Cryst. Growth 2001, 232, 603–609. [Google Scholar] [CrossRef]
- Chavas, L.M.G.; Yamada, Y.; Hiraki, M.; Igarashi, N.; Matsugaki, N.; Wakatsuki, S. UV LED Lighting for Automated Crystal Centring. J. Synchrotron Radiat. 2011, 18, 11–15. [Google Scholar] [CrossRef]
- Vernede, X.; Lavault, B.; Ohana, J.; Nurizzo, D.; Joly, J.; Jacquamet, L.; Felisaz, F.; Cipriani, F.; Bourgeois, D. UV Laser-Excited Fluorescence as a Tool for the Visualization of Protein Crystals Mounted in Loops. Acta Crystallogr. D Biol. Crystallogr. 2006, 62, 253–261. [Google Scholar] [CrossRef]
- Bourgeois, D.; Vernede, X.; Adam, V.; Fioravanti, E.; Ursby, T. A Microspectrophotometer for UV–Visible Absorption and Fluorescence Studies of Protein Crystals. J. Appl. Crystallogr. 2002, 35, 319–326. [Google Scholar] [CrossRef]
- Kissick, D.J.; Dettmar, C.M.; Becker, M.; Mulichak, A.M.; Cherezov, V.; Ginell, S.L.; Battaile, K.P.; Keefe, L.J.; Fischetti, R.F.; Simpson, G.J. Towards Protein-Crystal Centering Using Second-Harmonic Generation (SHG) Microscopy. Acta Crystallogr. D Biol. Crystallogr. 2013, 69, 843–851. [Google Scholar] [CrossRef]
- Murray, T.D.; Lyubimov, A.Y.; Ogata, C.M.; Vo, H.; Uervirojnangkoorn, M.; Brunger, A.T.; Berger, J.M. A High-Transparency, Micro-Patternable Chip for X-Ray Diffraction Analysis of Microcrystals under Native Growth Conditions. Acta Crystallogr. D Biol. Crystallogr. 2015, 71, 1987–1997. [Google Scholar] [CrossRef]
- Burkhardt, A.; Pakendorf, T.; Reime, B.; Meyer, J.; Fischer, P.; Stübe, N.; Panneerselvam, S.; Lorbeer, O.; Stachnik, K.; Warmer, M.; et al. Status of the Crystallography Beamlines at PETRA III. Eur. Phys. J. Plus 2016, 131, 56. [Google Scholar] [CrossRef]
- Barty, A.; Kirian, R.A.; Maia, F.R.N.C.; Hantke, M.; Yoon, C.H.; White, T.A.; Chapman, H. Cheetah : Software for High-Throughput Reduction and Analysis of Serial Femtosecond X-Ray Diffraction Data. J. Appl. Crystallogr. 2014, 47, 1118–1131. [Google Scholar] [CrossRef] [PubMed]
- Zander, U.; Bourenkov, G.; Popov, A.N.; de Sanctis, D.; Svensson, O.; McCarthy, A.A.; Round, E.; Gordeliy, V.; Mueller-Dieckmann, C.; Leonard, G.A. MeshAndCollect : An Automated Multi-Crystal Data-Collection Workflow for Synchrotron Macromolecular Crystallography Beamlines. Acta Crystallogr. D Biol. Crystallogr. 2015, 71, 2328–2343. [Google Scholar] [CrossRef]
- de la Mora, E.; Coquelle, N.; Bury, C.S.; Rosenthal, M.; Holton, J.M.; Carmichael, I.; Garman, E.F.; Burghammer, M.; Colletier, J.-P.; Weik, M. Radiation Damage and Dose Limits in Serial Synchrotron Crystallography at Cryo- and Room Temperatures. Proc. Natl. Acad. Sci. USA 2020, 117, 4142–4151. [Google Scholar] [CrossRef]
- Gevorkov, Y.; Yefanov, O.; Barty, A.; White, T.A.; Mariani, V.; Brehm, W.; Tolstikova, A.; Grigat, R.-R.; Chapman, H.N. XGANDALF—Extended Gradient Descent Algorithm for Lattice Finding. Acta Crystallogr. Sect. A Found. Adv. 2019, 75, 694–704. [Google Scholar] [CrossRef]
- Adams, P.D.; Afonine, P.V.; Bunkóczi, G.; Chen, V.B.; Davis, I.W.; Echols, N.; Headd, J.J.; Hung, L.-W.; Kapral, G.J.; Grosse-Kunstleve, R.W.; et al. PHENIX : A Comprehensive Python-Based System for Macromolecular Structure Solution. Acta Crystallogr. D Biol. Crystallogr. 2010, 66, 213–221. [Google Scholar] [CrossRef]
- White, T.A.; Kirian, R.A.; Martin, A.V.; Aquila, A.; Nass, K.; Barty, A.; Chapman, H.N. CrystFEL : A Software Suite for Snapshot Serial Crystallography. J. Appl. Crystallogr. 2012, 45, 335–341. [Google Scholar] [CrossRef]


| Dataset | Number of Indexable Patterns | Compression Rate |
|---|---|---|
| Lyso1_grid1 | 27 | 33.3 |
| Lyso1_grid2 | 94 | 9.6 |
| Lyso2_grid1 | 232 | 3.8 |
| Lyso3_grid1 | 545 | 1.7 |
| Lyso4_grid1 | 511 | 1.8 |
| Lyso5_grid1 | 155 | 5.8 |
| Experiment 11013662 | Experiment 11013278 | |
|---|---|---|
| Number of patterns | 9230 | 15023 |
| Indexed patterns/crystals | 1899/2088 | 1189/1321 |
| Resolution, Å | 79.00–2.00 (2.03–2.0) | 79.00–2.00 (2.03–2.0) |
| SNR | 4.81 (1.36) | 2.96 (0.33) |
| CC* | 0.975 (0.603) | 0.962 (0.284) |
| CC1/2 | 0.907 (0.222) | 0.860 (0.042) |
| Rsplit, % | 26.82 (106.18) | 35.97 (203.09) |
| Completeness, % | 100.0 (100.0) | 95.75 (75.12) |
| Multiplicity | 59.08 (41.6) | 16.25 (4.9) |
| Unique reflections | 8589 (414) | 8223 (311) |
| Wilson B-factor | 28.03 | 28.18 |
| Rfree/Rwork | 0.29/0.27 | 0.28/0.27 |
Disclaimer/Publisher’s Note: The statements, opinions and data contained in all publications are solely those of the individual author(s) and contributor(s) and not of MDPI and/or the editor(s). MDPI and/or the editor(s) disclaim responsibility for any injury to people or property resulting from any ideas, methods, instructions or products referred to in the content. |
© 2023 by the authors. Licensee MDPI, Basel, Switzerland. This article is an open access article distributed under the terms and conditions of the Creative Commons Attribution (CC BY) license (https://creativecommons.org/licenses/by/4.0/).
Share and Cite
Galchenkova, M.; Rahmani Mashhour, A.; Reinke, P.Y.A.; Günther, S.; Meyer, J.; Chapman, H.N.; Yefanov, O.M. An Optimized Approach for Serial Crystallography Using Chips. Crystals 2023, 13, 1225. https://doi.org/10.3390/cryst13081225
Galchenkova M, Rahmani Mashhour A, Reinke PYA, Günther S, Meyer J, Chapman HN, Yefanov OM. An Optimized Approach for Serial Crystallography Using Chips. Crystals. 2023; 13(8):1225. https://doi.org/10.3390/cryst13081225
Chicago/Turabian StyleGalchenkova, Marina, Aida Rahmani Mashhour, Patrick Y. A. Reinke, Sebastian Günther, Jan Meyer, Henry N. Chapman, and Oleksandr M. Yefanov. 2023. "An Optimized Approach for Serial Crystallography Using Chips" Crystals 13, no. 8: 1225. https://doi.org/10.3390/cryst13081225
APA StyleGalchenkova, M., Rahmani Mashhour, A., Reinke, P. Y. A., Günther, S., Meyer, J., Chapman, H. N., & Yefanov, O. M. (2023). An Optimized Approach for Serial Crystallography Using Chips. Crystals, 13(8), 1225. https://doi.org/10.3390/cryst13081225