Article

Effects of Fe and Ni Doping on the Electronic Structure and Optical Properties of Cu2ZnSnS4

College of Physics and Electronic Science, Anshun University, Anshun 561000, China
*
Author to whom correspondence should be addressed.
Crystals 2023, 13(7), 1082; https://doi.org/10.3390/cryst13071082
Submission received: 6 June 2023 / Revised: 5 July 2023 / Accepted: 6 July 2023 / Published: 11 July 2023

Abstract

:
This study evaluated the electronic structure and optical properties of Fe-doped, Ni-doped, and (Fe,Ni)-co-doped Cu2ZnSnS4 through the first-principles pseudopotential plane-wave method based on density functional theory. The results indicated that Fe single-doping and Ni single-doping Cu2ZnSnS4 can reduce the charge transfer number of adjacent S atoms, enhancing covalent bonding in Fe–S and Ni–S bonds and reducing the bond length, lattice constants a and c, and unit cell volume v. The formation energies for Fe-doping, Ni-doping, and (Fe,Ni)-co-doping were 1.0 eV, 0.58 eV, and 0.78 eV, respectively. Both Fe and Ni-doping introduced 3d electrons near the Fermi level, resulting in new impurity levels and a gradual decrease in the band gap of Cu2ZnSnS4 from 0.16 eV. The conduction band density of Cu2ZnSnS4 was primarilycontributed by Sn 5s, Sn 5p, and a portion of S 3p orbital electrons, whereas the valence band density mainly stemmed from Cu 3d, Sn 5p, and S 3p orbital electrons. Fe and Ni-doping also partly contributed to the 3d layer electrons. In the case of (Fe,Ni)-co-doping, the maximum static dielectric constant was 100.49, and the dielectric peak shifted toward the low-energy direction in the presence of both Fe and Ni. Within the visible light range, Fe-doping, Ni-doping, and (Fe,Ni)-co-doping in Cu2ZnSnS4 exhibited absorption coefficients greater than 104 cm−1, with the maximum absorption coefficient being 1.6 × 105 cm−1 in the case of (Fe,Ni)-co-doping. In the energy range from 1.5 to 6.3 eV, the reflectivity of Cu2ZnSnS4 doped with Fe, Ni, or both was lower than 30%. Notably, a high conductivity peak at 1.9 eV indicated that Cu2ZnSnS4 possesses good photoconductivity in the visible range. Fe-doping and Ni-doping resulted in a slight shift of the conductance peak position towardthe low-energy direction, accompanied by an increase in the peak value.

1. Introduction

The increasing depletion of fossil and other energy sources and the resulting energy crisis pose severe challenges to manufacturing industriesand daily life. Solar energy is considered an effective solution to energy scarcity [1]. Solar energy is converted into electricity primarily using solar cells, which are conventionally silicon-based [2]. Silicon-based solar cells are primarily used in solar cell arrays, which require large surface areas and ample solar radiation [3]. However, with the improving living standards, the demand for flexible and wearable solar cells has emerged, leading to the development of thin-film solar cells [4].Among various semiconductor materials, Cu2ZnSnS4 (CZTS) is considered the most promising material for thin-film solar cells [5]. This is attributed to its band gap falling between 1.4 and 1.6 eV and its absorption coefficient exceeding 104 cm−1, making it highly suitable as an absorption layer insolar cells [6]. Moreover, the elements constituting Cu2ZnSnS4 are non-toxic, environmentally friendly, and abundant in the Earth’s crust, making it a cost-effective and sustainable materialfor solar cells. Thus far, the highest conversion efficiency achievedby Cu2ZnSnS4 thin-film solar cells has been 12.6% [7], which is considerably lower than the theoretical conversion efficiency of 32.4% [8]. The primary factors affecting the conversion efficiency of Cu2ZnSnS4 thin-film solar cells are the open circuit voltage (Voc) and low fill factor (FF) [9,10]. Cu2ZnSnS4 system exhibits a narrow phase-stability region, making it susceptible to defects due to atomic loss or substitution [11]. For example, because of the similarity inion radii between Zn and Cu, shallow energy level defects, such as CuZn and ZnCu substitution defects, can easily form [12]. In addition, deep-level defects, such as SnZn substitution defects (SnZn) and sulfur vacancy defects (VS), can form within the Cu2ZnSnS4 system [13,14,15]. Furthermore, the system is susceptible to substitution defects, such as ZnSn, and vacancy defects, such as VCu, VZn, and VSn [16]. Studies have demonstrated that deep energy level defects or defect pairs in Cu2ZnSnS4 systems lead to the generation of tail states [17,18]. At low temperatures, tail states can capture photo-generated carriers, resulting innon-radiative recombination, which reduces the open-circuit voltage and affects the conversion efficiency of solar cells. In the case of Cu2ZnSnS4 thin-film solar cells, inhibiting the formation of deep-energy-level defects, enhancing crystal quality, and inhibiting tail states are effective approaches to improve the conversion efficiency. Previous research [19] has revealed that metal substitution doping can alter the phase structure of Cu2ZnSnS4, thereby serving as a defect passivation method. For example, various studies have incorporated metals, such as Li, Na, K, Ag, Cd, Mn, and Al, into Cu2ZnSnS4, yielding significant results [20,21,22,23,24,25]. However, studies on the elemental doping of Cu2ZnSnS4 have primarily focused on alkali metals, with limited reports on Fe and Ni-doping. Doping semiconductor materials with Fe and Ni can demonstrably enhance electrocatalytic performance, leading to considerable improvements in light absorption [26,27]. Therefore, this study analyzed the electronic structure and optical properties of Cu2ZnSnS4 doped with Fe, Ni, and their co-doping (Fe,Ni) through the pseudopotential plane-wave method based on density functional theory (DFT). The effects of Fe and Ni-doping on the structure, state density, and optical properties of Cu2ZnSnS4 bands were analyzed.

2. Theoretical Models and Calculation Methods

We used Cu2ZnSnS4 unit cells with a kesterite structure with the space group being I 4 ¯ ( N o .82 ) . Each unit cell consisted of 4 Cu atoms, 2 Zn atoms, 2 Sn atoms, and 8 S atoms, with lattice constants of a = 0.5428 nm and c = 1.0864 nm [28]. In the calculations for single-doping and co-doping, 2 × 1 ×1 superunit cells (a total of 32 atoms) were utilized. In Fe-doping, the Zn atom at the Zn 1 position of the superunit cell was substituted with an Fe atom. In Ni-doping, the Zn atom at the Zn 1 position was substituted by a Ni atom. In co-doping, the Zn atom at the Zn 1 position of the superunit cell and the Cu atom at the Cu 1 position were substituted by Fe and Ni, respectively. The doping model of the Cu2ZnSnS4 supercell is depicted in Figure 1.
The pseudopotential plane-wave method based on DFT [29,30] was adopted for calculations conducted using the CASTEP software package [31] in the Materials Studio [32] simulation platform. The Perdew–Burke–Ernzerhof (PBE) functional with generalized gradient approximation (GGA) [33] was employed to determinethe exchange correlation energy between electrons. Furthermore, the interactions between real ionic and electronic states were treated usingultra-soft pseudopotentials [34]. The plane-wave truncation energy was set to 380 eV, and the self-consistent convergence accuracy was set at 5.0×10⁻⁷ eV/atom. The Brillouin zone integrals were divided using Monkhorst–Pack’s 4 × 4 × 4 scheme.
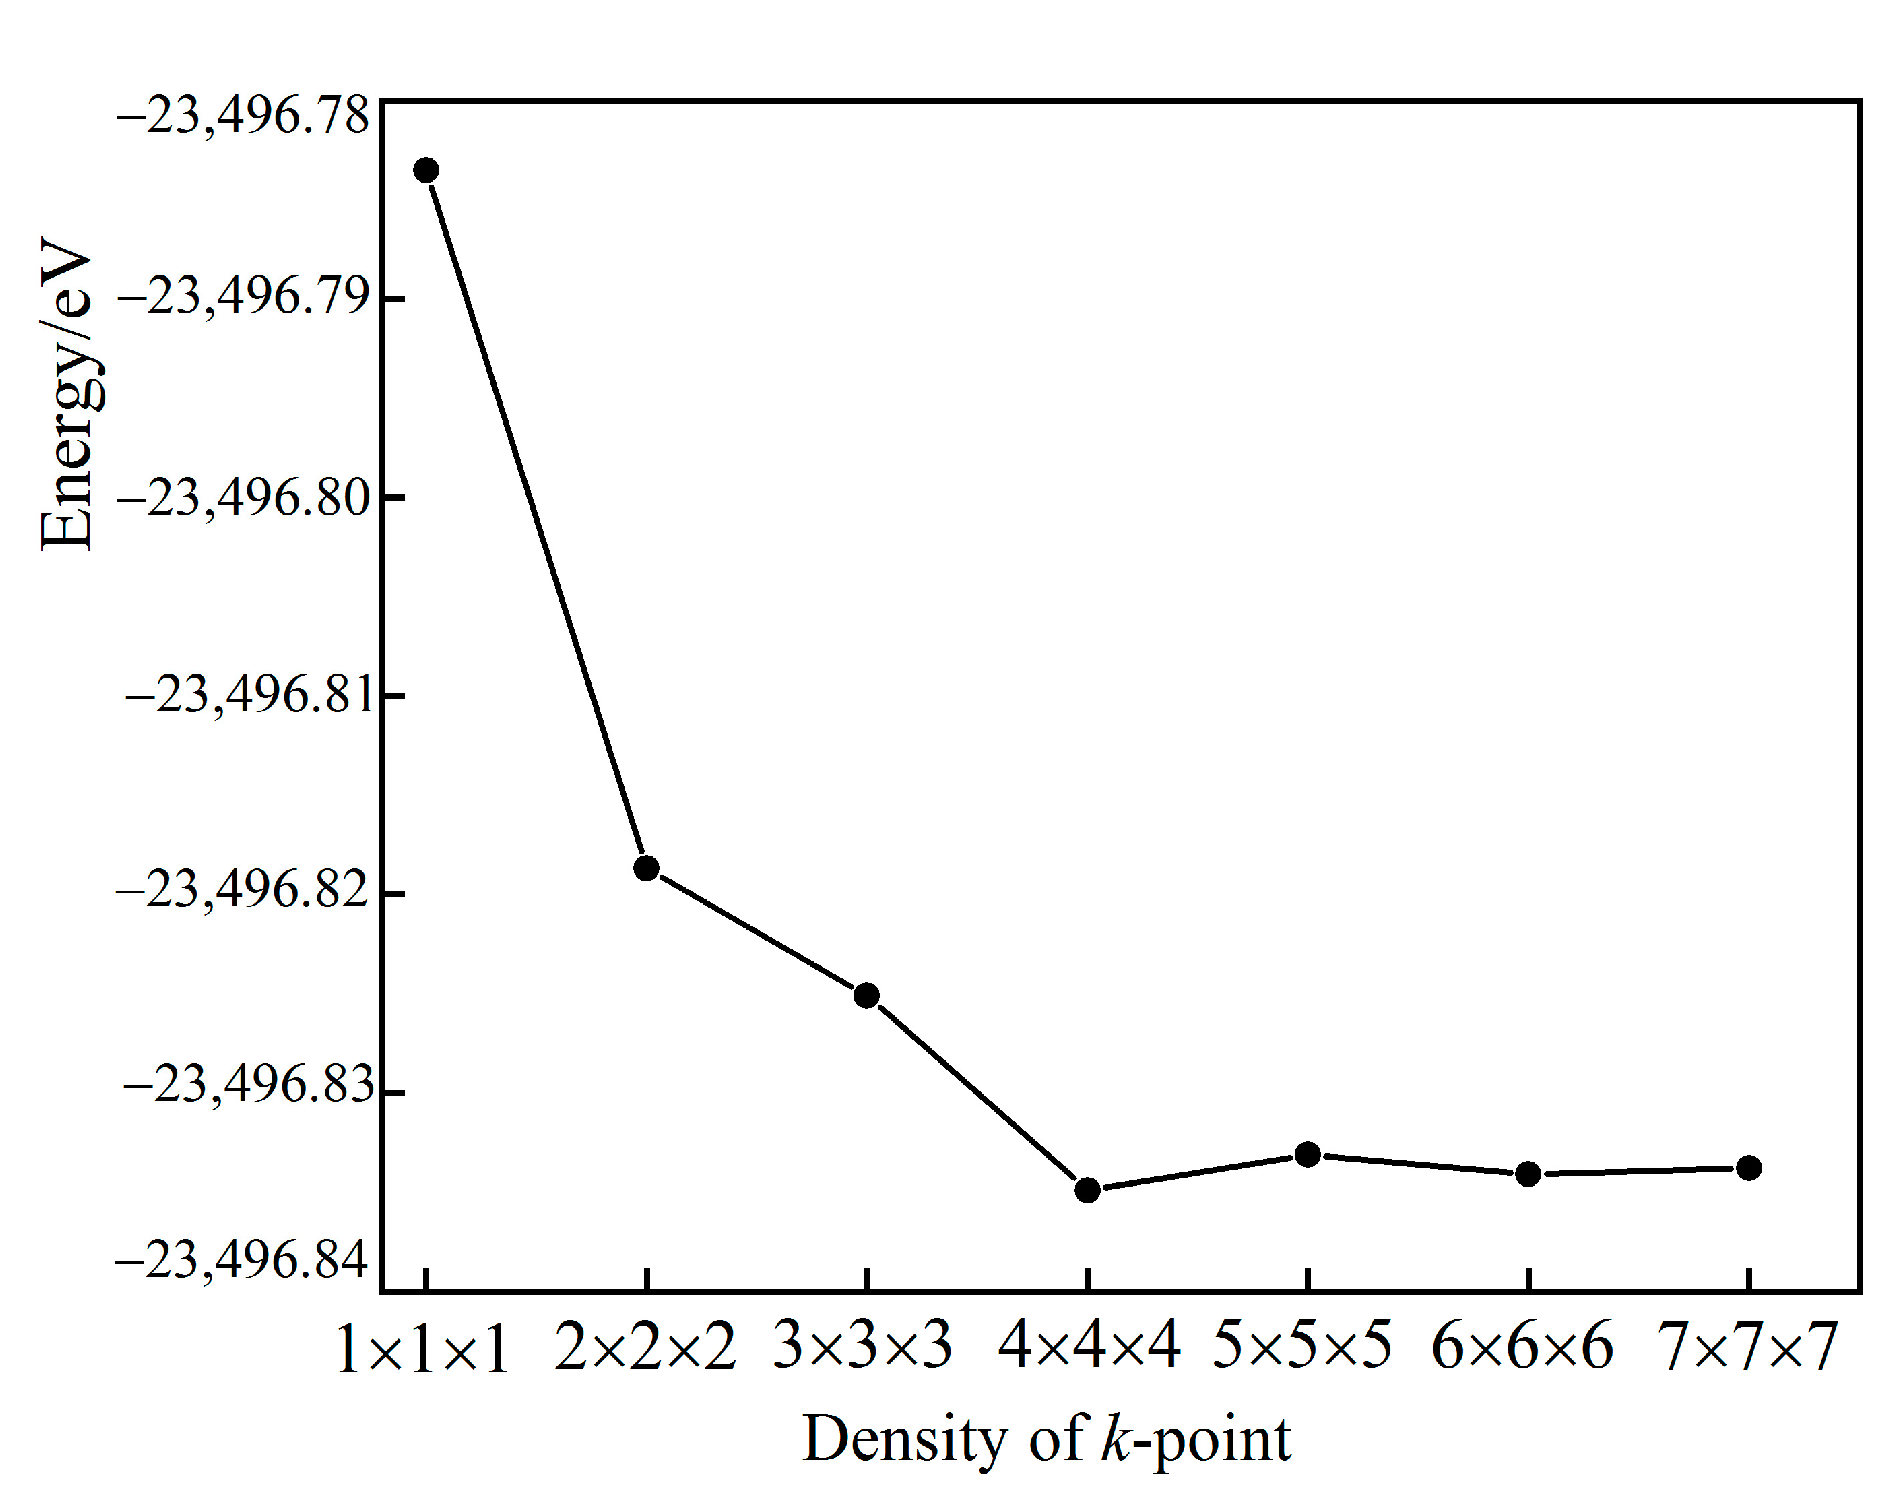
To ensure the convergence of the calculation results, a k-point convergence test was conducted within the range from 1 × 1 × 1 to 7 × 7 × 7. The total energy began to converge when the k-point was sampled as 4 × 4 × 4. Therefore, the k-point selected for this study ensured convergence. The results of the k-point convergence test are presented in Figure 2.
To assess the feasibility of atomic doping, the doping energies of Fe and Ni atoms were calculated individually, as well as for their co-doping in Cu2ZnSnS4. The doping formation energy was calculated as follows [35,36]:
E ( F e Z n ) f o r m = E ( F e ) d o p e d E p u r e + μ Z n μ F e
E ( N i Z n ) f o r m = E ( N i ) d o p e d E p u r e + μ Z n μ N i
                                   E ( F e Z n , N i C u ) f o r m = E ( F e , N i ) d o p e d E p u r e + ( μ Z n μ F e ) + ( μ C u μ N i ) E ( F e Z n ) f o r m , E ( N i Z n ) f o r m , E ( F e Z n , N i C u ) f o r m
representing the doping formation energies of Fe-doping, Ni-doping, and (Fe,Ni)-co-doping Cu2ZnSnS4, respectively. E ( F e ) d o p e d , E ( N i ) d o p e d , E ( F e , N i ) d o p e d represent the energies of Fe-doping, Ni-doping, and (Fe,Ni)-co-doping Cu2ZnSnS4 after optimization, respectively. Epure denotes the total energy of the undoped system ofCu2ZnSnS4. μZn, μFe, μNi, and μCu denote the chemical potential of the Zn atom, Fe atom, Ni atom, and Cu atom, respectively.

3. Results and Discussion

3.1. Geometric Structure Optimization

Table 1 presents the lattice constants and doping formation energy of undoped and doped Cu2ZnSnS4. Thelattice constants a and c were compared with experimental values. As indicated by the data in Table 1, the lattice constants a = 5.4690 Å and c = 10.9460 Å obtained from the geometric structure optimization of Cu2ZnSnS4 are consistent with both experimental and theoretical calculations [37,38]. Both Fe and Ni doping slightly reduced the lattice constants and cell volume v of Cu2ZnSnS4. Because the ionic radii of Ni2+(0.69 Å) and Fe3+(0.64 Å) are smaller than that of Zn2+(0.74 Å) [39,40], the atomic spacing decreased upon substituting Zn atoms with Fe and Ni atoms, resulting in a decrease in lattice constants and the unit cell volume.
After (Fe,Ni)-co-doping, the lattice constant a of Cu2ZnSnS4 decreased, while the lattice constant c and cell volume v increased slightly compared to those with single-doping.
As mentioned in Table 1, the formation energy of Fe-doping was 1.0 eV, whereas the formation energy of Ni-doping was 0.58 eV. Ni atoms integrated more easily into the Cu2ZnSnS4 lattice than Fe atoms. The co-doping formation energy of Fe and Ni atoms was 0.78 eV, which was lower than the formation energy of Fe-atom-doping. Under all three doping conditions, the doping formation energy was greater than 0 eV, indicating that Fe and Ni-doping defect states cannot form spontaneously, and defect states in Cu2ZnSnS4 can be controlled through co-doping.
The external electron arrangement of Fe is 3d64s2, while that of Ni is 3d84s2. The 3d state of Ni exhibits a denser and wider energy level than the 3d state of Fe, facilitating the capture of electrons. Upon substituting Zn, Ni tends to undergo acceptor doping [41], resulting in a lower doping formation energy. Therefore, Ni is more readily doped intoCu2ZnSnS4 than Fe. In co-doping, Fe substituted Cu. With the 3d104s1 electronic arrangement outside the nucleus of Cu, the 4s layer can accept electrons. In this scenario, Fe tends to undergo donor doping [41], leading to a higher doping formation energy. Thus, inco-doping, both acceptor doping and donor doping co-occur, resulting in an intermediate doping formation energy.

3.2. Electronic Structure

3.2.1. Energy Band Structure

The high symmetry points of Cu2ZnSnS4 are G, F, Q, and Z. The coordinates of these high symmetry points are listed in Table 2.
Figure 3 illustrates the band structure of Fe-doping and Ni-dopingin Cu2ZnSnS4. Figure 3a presents the band structure of undoped Cu2ZnSnS4, with the minimum band gap occurring at the high symmetry point G. The value ofthe undoped band gap was 0.16 eV, consistent with the findings of Zhao [42]. The band gap values for Fe-doped and Ni-doped Cu2ZnSnS4 were consistent with experimental values reported in the literature [43,44], indicating a decrease in the band gap values of Cu2ZnSnS4 after Fe and Ni-doping. The generalized gradient approximation (GGA) functional is a common functional used to calculate semiconductor materials, and underestimating band gap is a feature of this functional. Zhao [42] found that the band gap calculated using the GGA functional was about 1 eV lower than the experimental value.The calculated results were lower than the experimental values primarily because the DFT theoretical framework does not consider the discontinuity of the exchange correlation potential and underestimates the interaction between excited state electrons in the multi-particle system. However, this discrepancy did not affect subsequent calculations and analysis [45,46].
Figure 3b displays the energy band structure of Fe-doped Cu2ZnSnS4, Figure 3c shows the band structure of Ni-doping in Cu2ZnSnS4, and Figure 3d shows the band structure of (Fe,Ni)-co-doped Cu2ZnSnS4. It can be seen from the figure that there is almost no band gap after Fe and Ni-doping. The valence band of Cu2ZnSnS4 is mainly composed of the hybridization of Cu/Zn 3d states and S 3p states, while the conduction band is mainly composed of Sn 5s states and S 3p states. Both Fe and Ni have partially filled 3d orbitals, and these partially filled 3d orbitals have a stronger effect on the hybridization of orbital electrons. When Fe and Ni ions are doped, the 3d states of Fe and Ni are hybridized with the 3p states of S, which results in a narrower band gap [47]. In addition, after Fe or Ni-doping, the partially filled 3d orbit reduces the s-p repulsion between Sn and S and reduces the energy of the conduction band minimum(CBM) state, thus reducing the band gap [44]. After (Fe,Ni)-co-doping, more partially filled 3d orbitals are provided, and the 3d states of Fe and Ni are hybridized more strongly with the 3p orbitals of S, the valence band moves down more, and the band gap is smaller. Considering the above factors, Cu2ZnSnS4 doped with Fe and Ni does not show a band gap. Of course, this is only the result obtained by using the GGA functional calculation, but we believe that the actual experiment has a band gap, and our calculation results can provide some new ideas for the regulating band gap of Cu2ZnSnS4.

3.2.2. Electronic Density of States

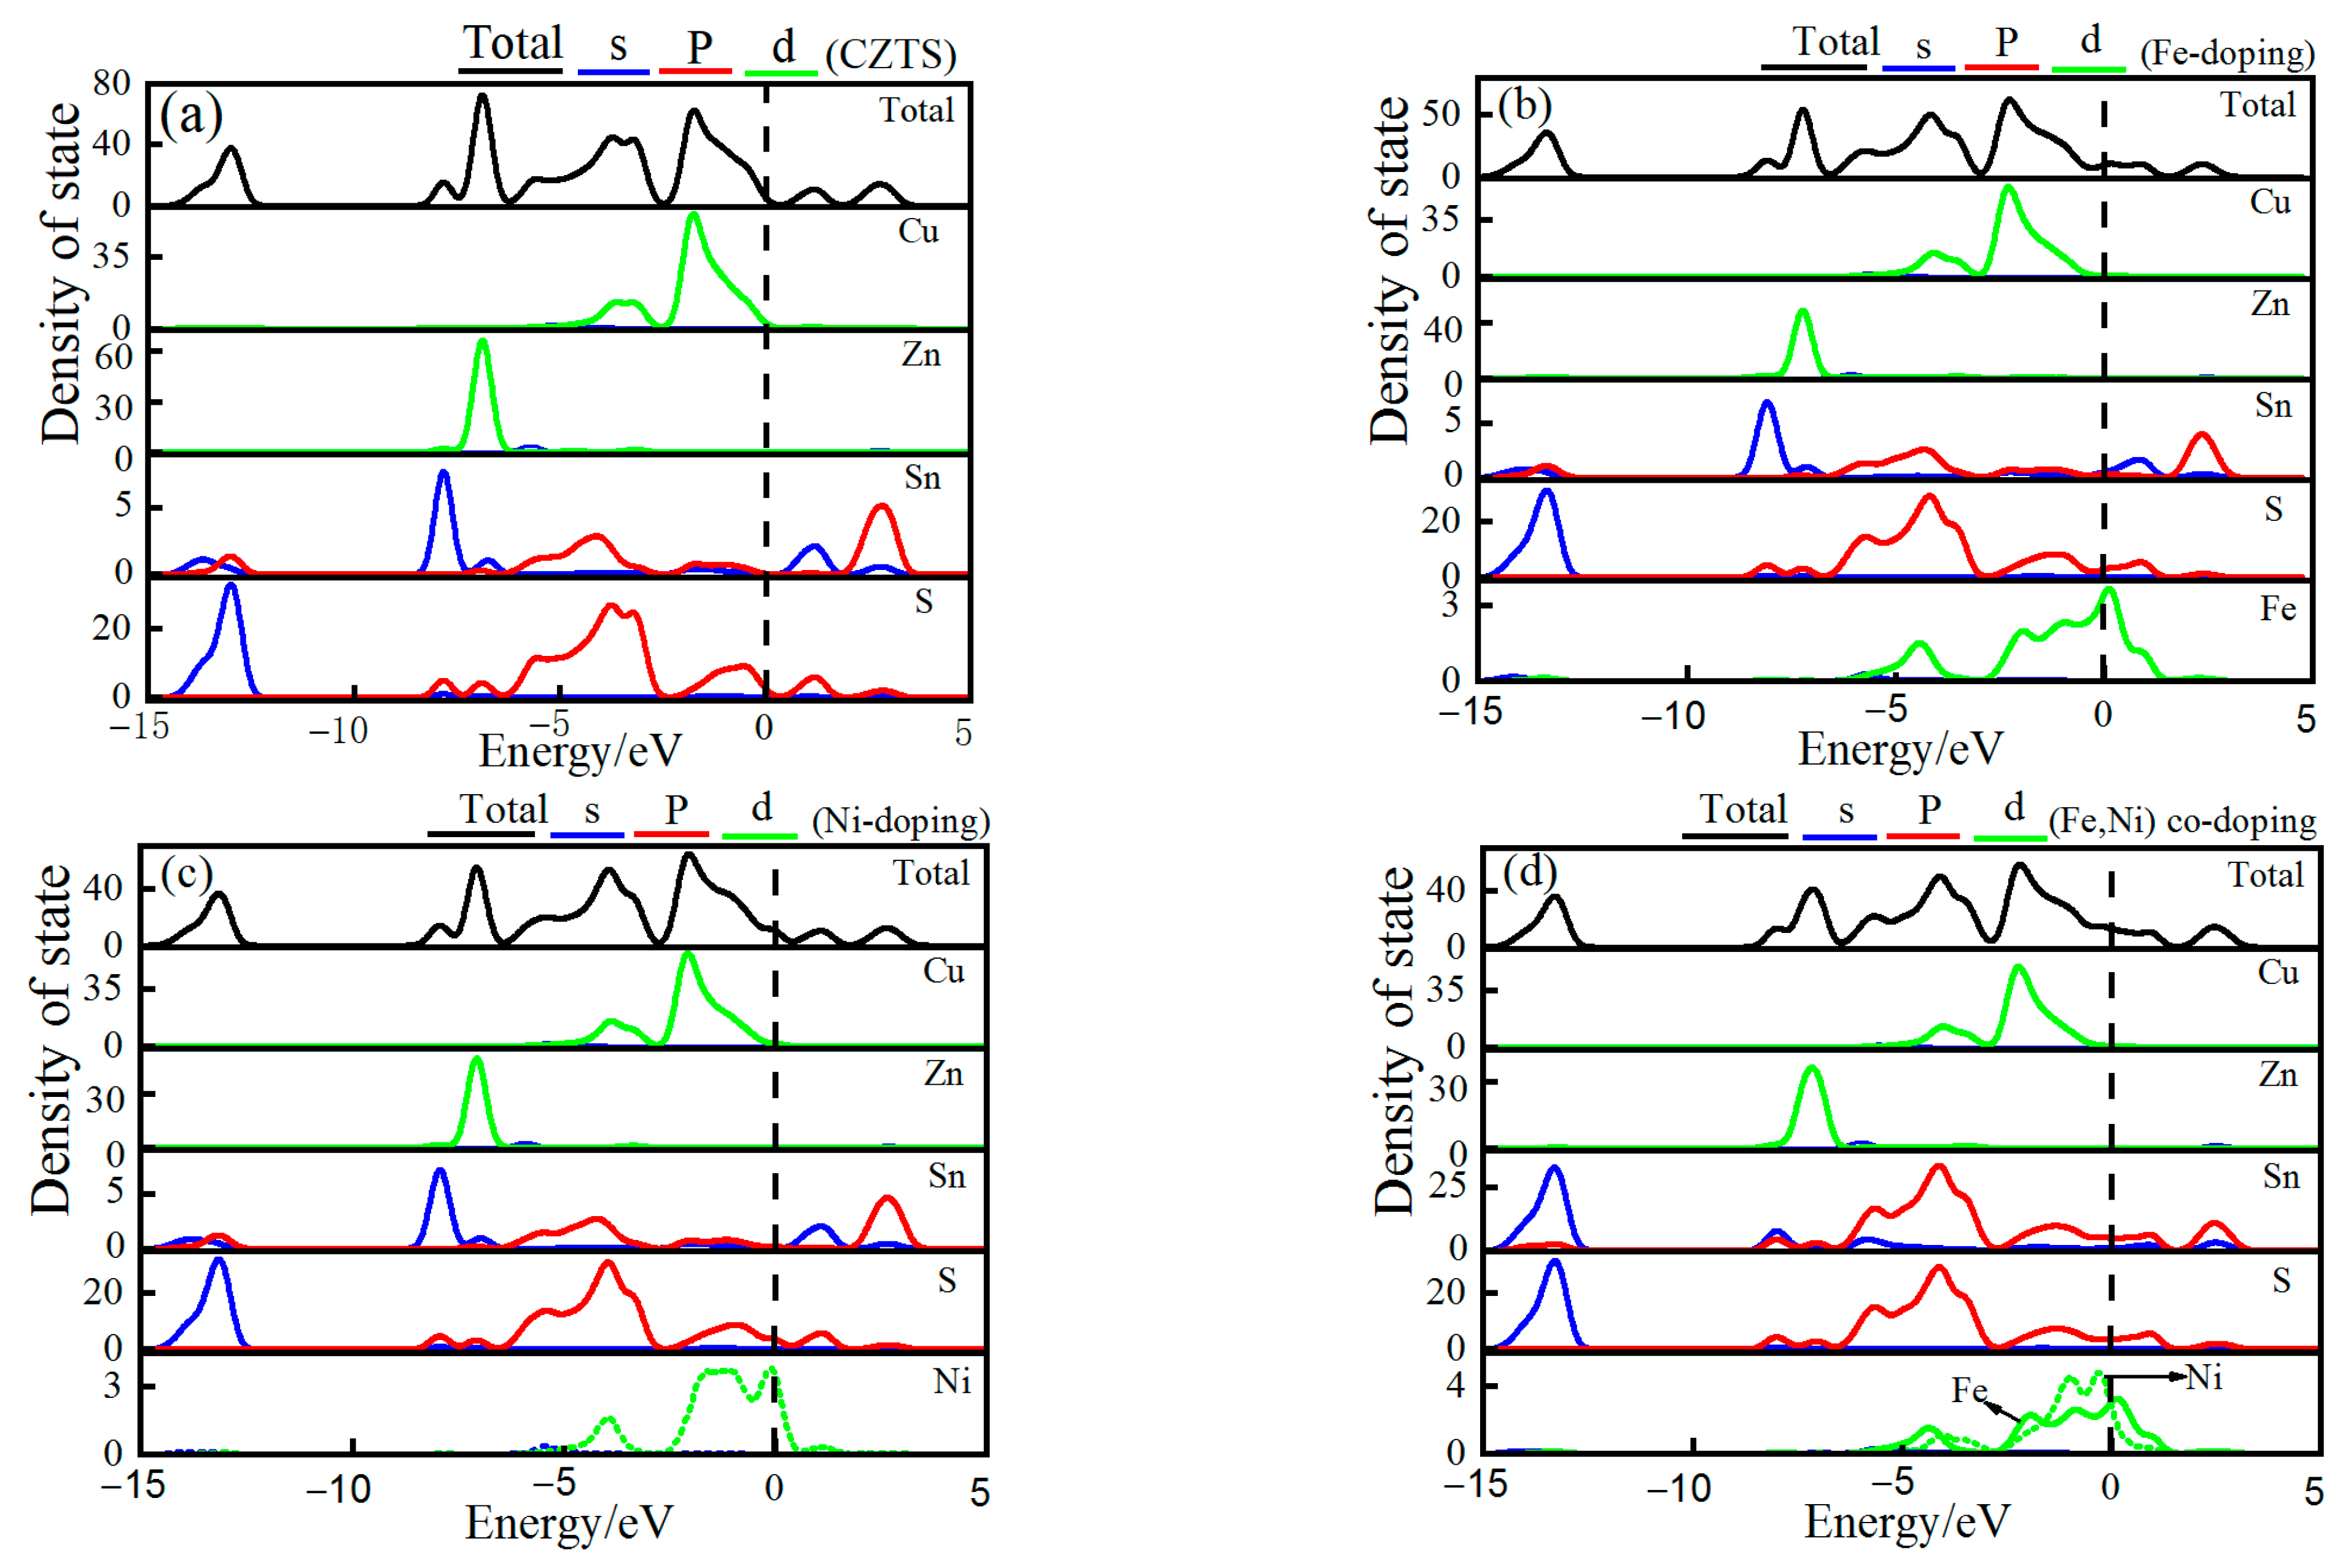
Figure 4 presents the total electronic density of states and the partial wave density of states for each sublayer of Fe-doping and Ni-doping Cu2ZnSnS4. Figure 4a illustrates the total electronic density of states and partial wave density of states for undoped Cu2ZnSnS4. The density of states primarily resulted from the 3d layer electrons of Cu, Zn, and S. Additionally, a few 5s and 5p layer electrons of Sn contributed to the density of states of Cu2ZnSnS4. The energy range from −14 to −12.4 eV can be primarily attributed to the 3s layer electrons of S and the 5s and 5p layer electrons of Sn. The energy range from −8.2 to −5.0 eV mainly comprises the 3s layer electrons of Zn, the 5s electrons of Sn, and the 3p layer electrons of S. The energy range from −5.0 to −0.21 eV is primarily influenced by the 3d layer electrons of Cu, the 5p layer electrons of Sn, and the 3p layer electrons of S. Lastly, the energy range from 0.6 to 3 eV is primarily associated with the electrons in the 3p layer of S and the 5s and 5p layers of Sn.
As illustrated in Figure 4b–d, all of Fe-doped, Ni-doped, and (Fe,Ni)-co-doped Cu2ZnSnS4 result in an increase in the electron state density around 0 eV. (Fe,Ni)-co-doping resulted in the highest increase of 12.9. This increase can be attributed to the 3d electrons provided by Fe-doping or Ni-doping at approximately 0 eV. After Fe-doping, Ni-doping, or (Fe,Ni)-co-doping, the peaks of density at −12.98 eV in the lower valence band, −6.8 eV in the middle band, and −3.7 eV and−1.7 eV in the upper valence band all shifted toward lower energylevels, with an average deviation of 0.35 eV in the density of the valence band. The peaks at 1.19 eV and 2.78 eV in the conduction band also shifted toward the low-energy region, leading to an average deviation of 0.41 eV of the density ofthe conduction zone. These shifts in peak positions indicate that Fe-doping and Ni-doping encourage electrons in the valence band and conduction band of Cu2ZnSnS4 to occupy low-energy orbits. Moreover, the downward shift of the orbital energy level in the conduction band was greater than that in the valence band, causing the Fermi energy level to be embedded in the valence band.

3.3. Mulliken Population Analysis

Table 3 presents the Mulliken population analysis results for atoms adjacent to Fe and Ni impurity atoms, and Table 4 displays the Mulliken population analysis results forbonds adjacent to Fe and Ni impurity atoms. The S 1, S 2, S 3, and S 4 atoms were adjacent to the Fe 1 and Ni 1 impurity atoms, whereas the S 5, S 6, S 7, and S 8 atoms were adjacent to the Ni 2 impurity atoms. As indicated by the data in Table 3, upon replacing Zn 1 with Fe 1, the charge transfer of the S atoms adjacent to Fe 1 increased from −0.37 e to −0.24 e and −0.26 e, suggesting a weakened charge transfer due to Fe-doping. This effect can be attributed to the smallerionic radius of Fe compared to Zn, which results in the stronger binding of charges. Conversely, upon replacing Zn 1 with Ni 1, the Ni atoms acquire a slight charge of −0.03 e because the 3d shell of Ni was not completely filled with electrons, making it vulnerable to capturing charges from adjacent atoms. Simultaneously, the average charge transfer of the S atoms adjacent to Ni 1 decreased by 0.09 e, which was influenced by the stronger binding capacity of Ni due to its smaller ionic radius compared with Zn.
After (Fe,Ni)-co-doping, the charge transfer of the S atoms adjacent to Fe 1 was consistent with that observed in single-doping scenarios. However, the charge transfer of S atoms adjacent to Ni 2 changed significantly, with an average increase of 0.05 e compared to single-doping. This change can be attributed to the use of Ni 2 to substitute for Cu 1 in co-doping. The smaller ionic radius of Ni resulted in a stronger binding capacity.
As indicated by the data in Table 4, both Fe-single-doping and Ni-single-doping, as well as (Fe,Ni)-co-doping, increase the number of Fe-S and Ni-S bonds while reducing their bond lengths.
This effect can be attributed to the smaller ionic radius of Fe and Ni compared with Zn and Cu, which leads to lattice distortion in Cu2ZnSnS4 after doping and an enhanced electrostatic effect. The average population of S atoms adjacent to Fe and Ni after co-doping was 0.54, which was smaller than the average population of 0.56 observed after Fe-doping and Ni-doping. Furthermore, the average bond length of S atoms adjacent to Fe and Ni after co-doping was 2.2 Å, which was slightly longer than the average bond length of 2.19 Å observed after Fe-doping and Ni-doping. Hence, (Fe,Ni)-co-doping weakened the covalent bond in Cu2ZnSnS4 while increasing the bond length. Consequently, the lattice constant in the c-axis direction was distorted, and the cell volume increased slightly.

3.4. Optical Properties

This study investigated the effects of Fe and Ni-doping on the optical properties of Cu2ZnSnS4, including the complex dielectric function, absorption coefficient, reflectivity, and complex conductivity. The macroscopic optical properties of solids are typically described usingthe complex dielectric function ε ( ω ) = ε 1 ( ω ) + i ε 2 ( ω ) . Optical constants, such as the complex dielectric function, absorption coefficient, reflectivity, and complex conductivity, were derived using the Kramer–Kronig (KK) transformation [45].

3.4.1. Complex Dielectric Function

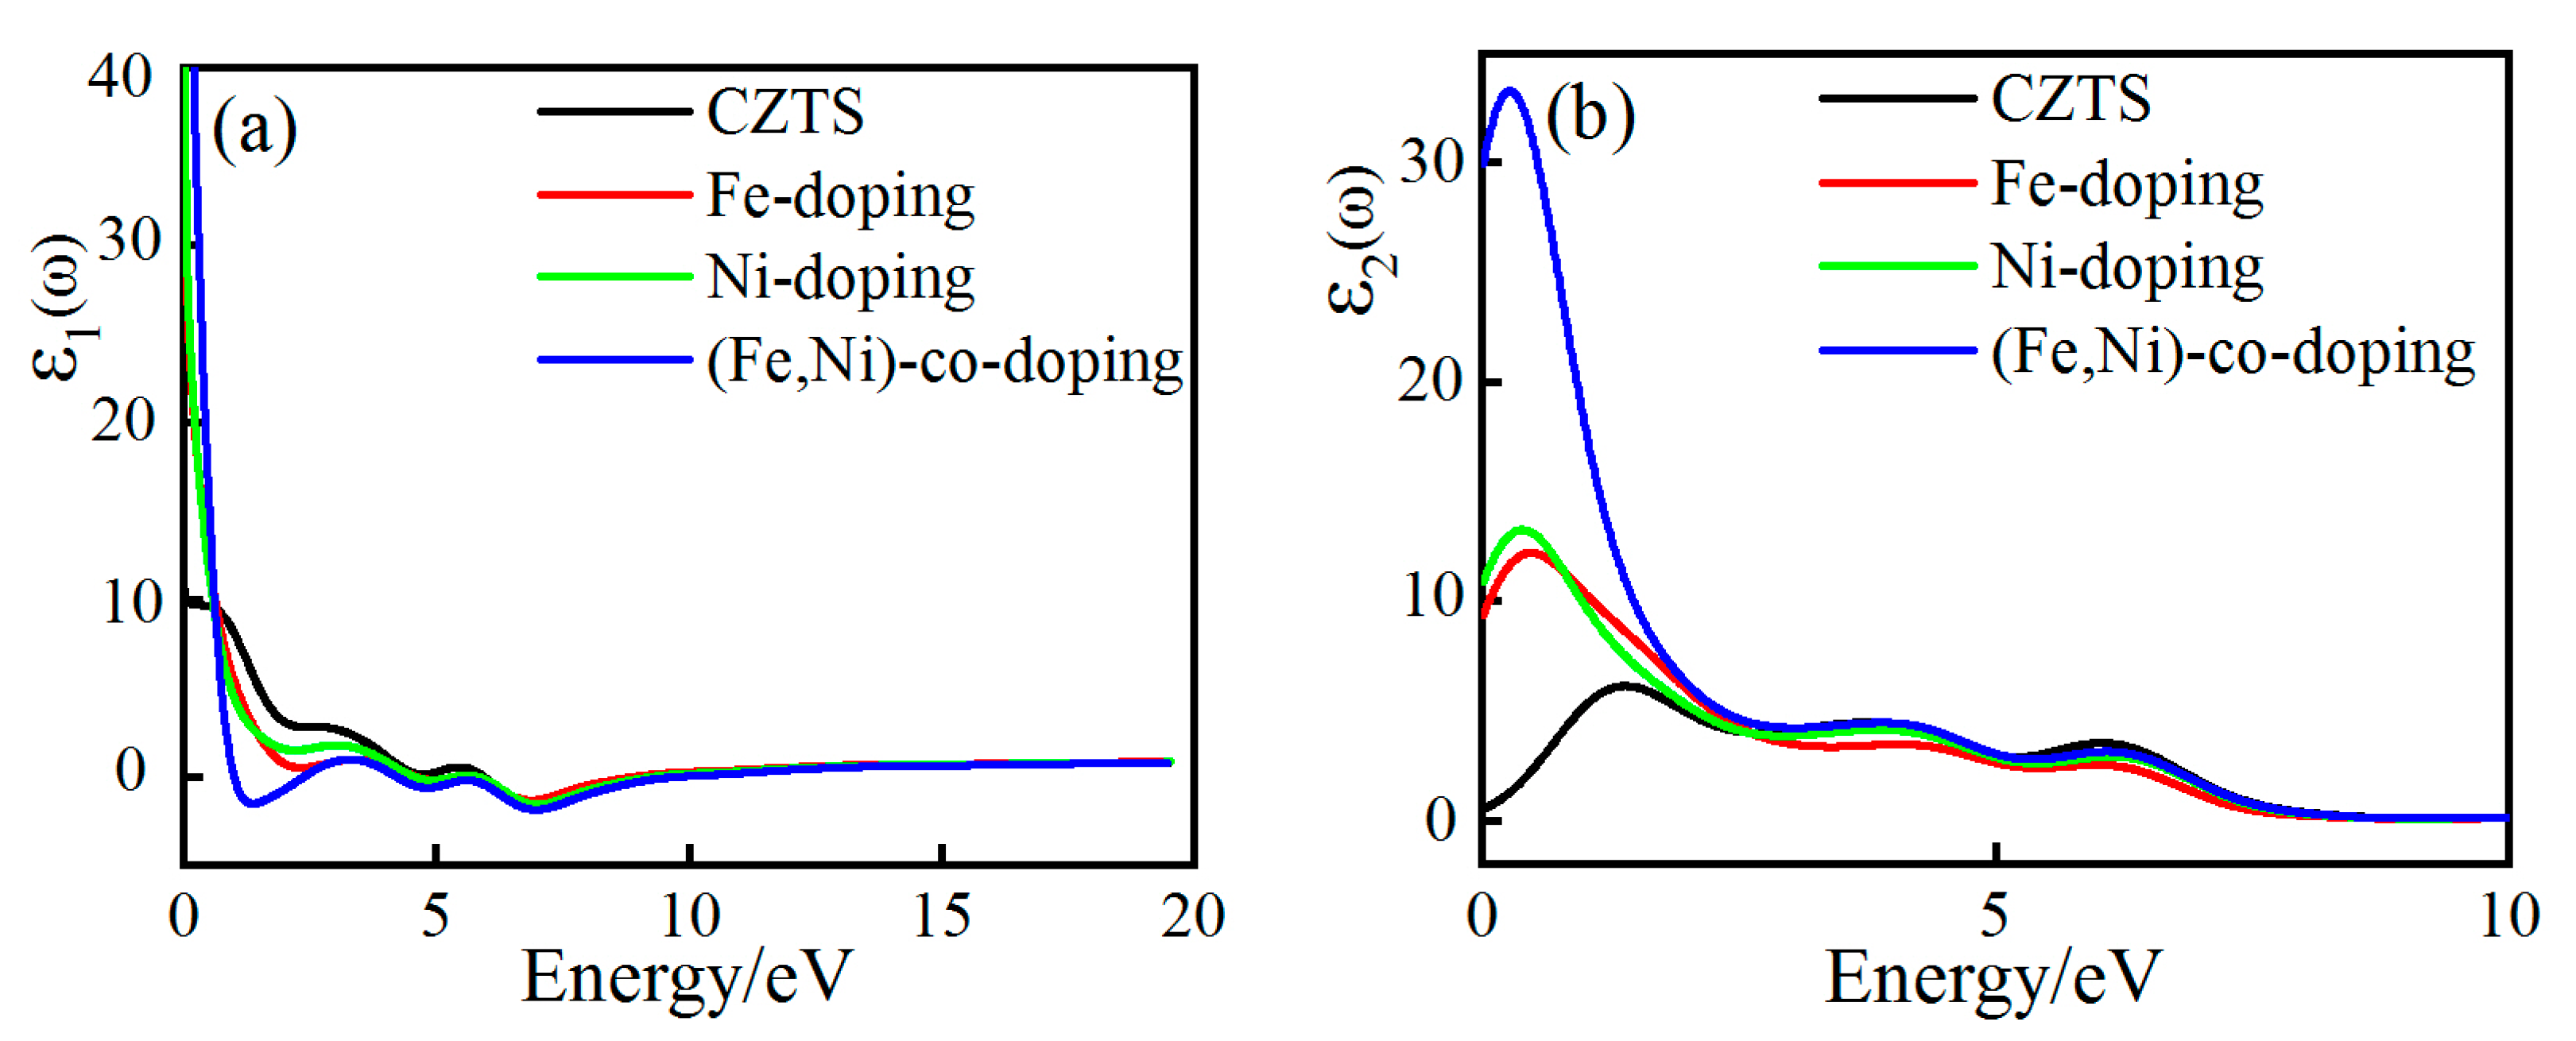
The dielectric function is generally represented as a complex number, with the imaginary part providing valuable information about electronic transitions and band structures [48]. Figure 5 illustrates the complex dielectric function of Fe-doping and Ni-doping Cu2ZnSnS4, where Figure 5a displays the real part and Figure 5b shows the imaginary part. As illustrated in Figure 5a, the static dielectric constant of undoped Cu2ZnSnS4, denoted as ε 1 ( 0 ) = 10.54 , was consistent with the findings in the literature [49]. Both Fe-single-doping and Ni-single-doping, as well as (Fe,Ni)-co-doping, led to an increase in the value of the static dielectric constant, ε 1 ( 0 ) . After co-doping, the static dielectric constant reached its maximum value of 100.49, which aligned with the results of the population analysis. Fe-doping and Ni-doping in Cu2ZnSnS4 introduce additional 3d electrons near the Fermi level. After doping, the covalent bond effect strengthened, leading to an intensified binding effect of the atomic nucleus charge, thus increasing the static dielectric constant. Figure 5b illustrates that the imaginary part, denoted as ε”(ω), of the intrinsic Cu2ZnSnS4 complex dielectric function exhibited three distinct dielectric peaks at 1.39 eV, 3.84 eV, and 6.04 eV. In the density of states plot, the dielectric peak at 1.39 eV corresponded to the Cu-3d to Sn-5s orbital electron transition, the 3.84 eV peak corresponded to the Cu-3d to S-3p orbital electron transition, and the 6.04 eV peak corresponded to the Cu-3d to Sn-5p orbital electron transition. In the low-energy range of 0 to 2.5 eV, the Cu2ZnSnS4 dielectric peak shifted toward lower energies due to Fe-doping and Ni-doping in Cu2ZnSnS4. This shift occurred because Fe-doping and Ni-doping reduced the Cu2ZnSnS4 band gap, resulting in a redshift of the absorption peak. In the energy range of 2.5 to 10 eV, the dielectric peaks of Fe-doping and Ni-doping Cu2ZnSnS4 closely aligned with the intrinsic dielectric peak of Cu2ZnSnS4. These findings indicated that the dielectric properties of Cu2ZnSnS4 in the visible light range can be effectively controlled through Fe-doping, Ni-doping, or (Fe,Ni)-co-doping.

3.4.2. Absorption and Reflection Spectra

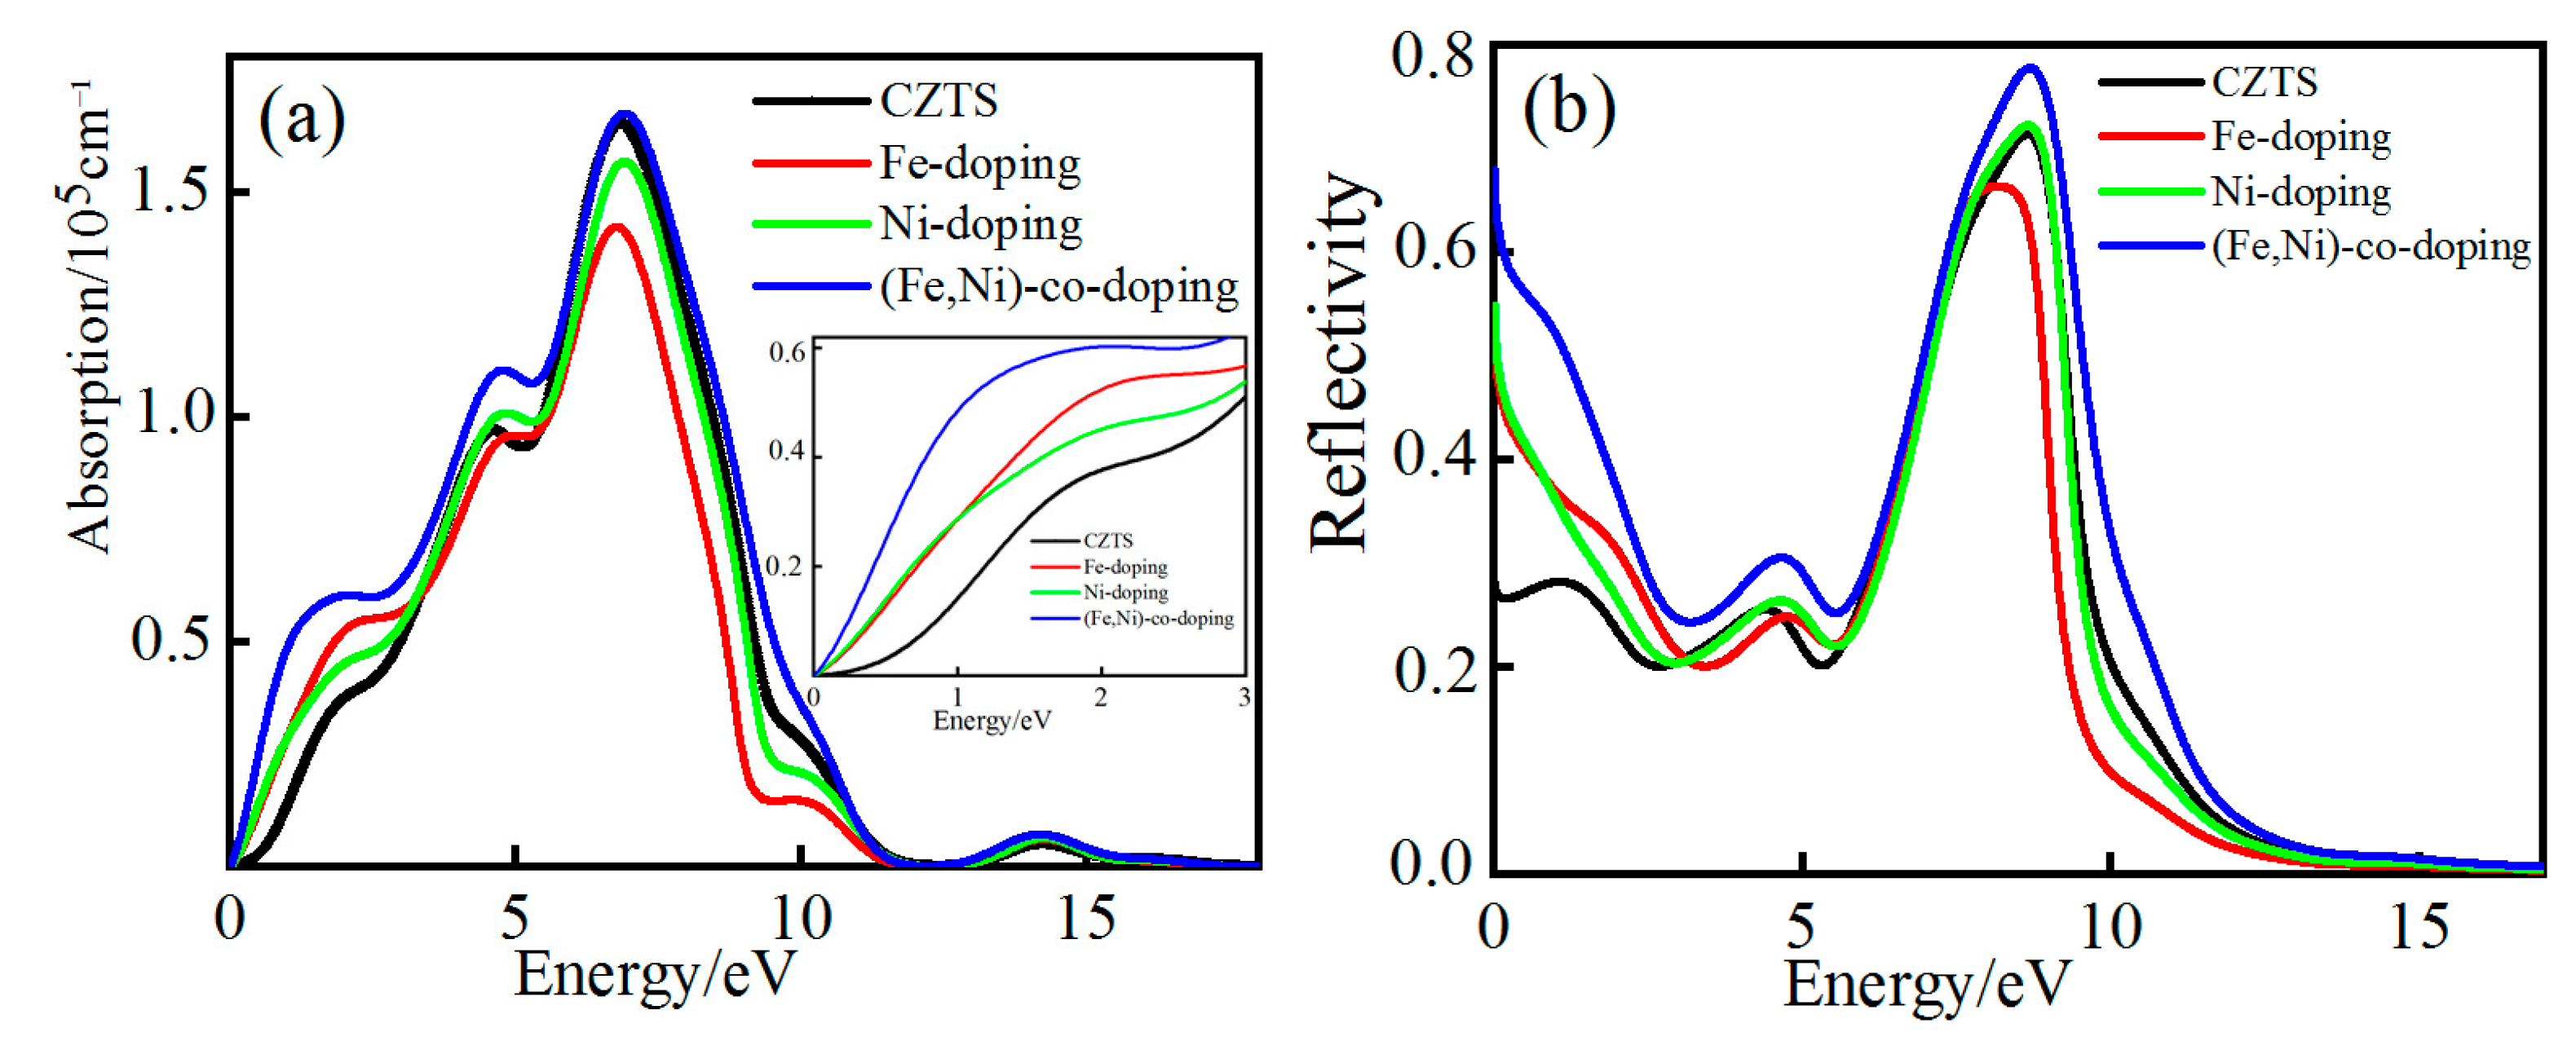
Figure 6 illustrates the absorption coefficient and reflection spectrum of Fe-doping and Ni-doping Cu2ZnSnS4. As illustrated in Figure 6a, the absorption spectrum of Cu2ZnSnS4 can be divided into three regions: the visible light region spanning from 0.16 eV to 3.2 eV, the ultraviolet light absorption region ranging from 3.2 eV to 11 eV, and the high-energy absorption region beyond 11 eV. The absorption edge of Cu2ZnSnS4 was observed at 0.16 eV, corresponding to the calculated band gap. Fe-doping and Ni-doping Cu2ZnSnS4 exhibited a slight red shift in the absorption edge, which can be attributed to the reduction in the band gap following doping. In the energy range of 0.16 eV to 6.9 eV, the absorption coefficient gradually increased with the incident light energy and reached a maximum value of 1.65 × 105 cm−1 at 6.9 eV. Beyond 6.9 eV, the absorption coefficient began to decrease and remained below 104 cm−1 after 11 eV. Notably, a significant absorption peak appearedat 1.9 eV with an absorption coefficient of 3.6 × 104 cm−1, indicating strong light absorption by Cu2ZnSnS4 in the visible light region [50]. The absorption coefficients of Fe-doped and Ni-doped Cu2ZnSnS4 in the visible light range all exceed 104 cm−1. Among the three doping conditions, (Fe,Ni)-co-doping resulted in the highest absorption coefficient, followed by Fe-single-doping, while Ni-single-doping resulted in the lowest absorption coefficient, in line with the changes in the band gap resulting from Fe-doping and Ni-doping Cu2ZnSnS4. As illustrated in Figure 6b, Cu2ZnSnS4 primarily reflected light in the energy range of 7.4 eV to 9.4 eV, with reflectivity below 30% in the range of 1.5 eV to 6.3 eV. This indicated minimal reflection loss in the visible light range, thus favoring light absorption by Cu2ZnSnS4. In the visible light range, the reflectivity of Fe-doping and Ni-doping Cu2ZnSnS4 exhibited an increasing trend. Notably, (Fe,Ni)-co-doping resulted in the highest reflectivity, followed by Fe-single-doping, while Ni-single-doping yielded the lowest reflectivity. Thus, the absorption coefficient and reflectivity of Cu2ZnSnS4 can be effectively controlled through Fe-doping, Ni-doping, or (Fe,Ni)-co-doping.

3.4.3. Complex Conductivity

Figure 7 displays the complex conductivity of Fe-doped and Ni-doped Cu2ZnSnS4. As illustrated in Figure 7a, the conductivity decreased to nearly zero beyond an energy of 11.3 eV. In the energy range of 0 eV to 6.2 eV, three prominent peaks appeared, corresponding to the positions of the light absorption peaks. The primary peak observed at 1.9 eV indicated that Cu2ZnSnS4 possesses strong photoconductivity in the visible light range. Fe-doping and Ni-doping resulted in a slight shift of the peak position toward lower energies, accompanied by an increase in the peak magnitude. Among the three doping conditions, (Fe,Ni)-co-doping resulted in the most significant increase in the peak, followed by Fe-doping, while Ni-doping resulted in the smallest increase. These observations were consistent with the band gap changes in Cu2ZnSnS4 under the three doping conditions.

4. Conclusions

In this study, the electronic structure and optical properties of Fe-doped, Ni-doped, and (Fe,Ni)-co-doped Cu2ZnSnS4 were calculated and analyzed using first-principles methods. The results indicated that Fe-doping and Ni-doping in Cu2ZnSnS4 weakened the charge transfer of adjacent S atoms, thereby enhancing the covalent bonding of Fe–S and Ni–S bonds, shortening bond lengths, and decreasing lattice constants a and c and the unit cell volume v. Fe-doping exhibited the highest formation energy, whileNi-doping had the lowest formation energy, with (Fe,Ni)-co-doping falling in the intermediaterange. Both Fe and Ni-doping introduced 3d electrons near the Fermi level, resulting in an upward shift ofthe valence band and a downward shift of the conduction band, leading to a decrease in the Cu2ZnSnS4 band gap from 0.16 eV. (Fe,Ni)-co-doping had the most pronounced effect on the band gap. Both Fe and Ni-doping, as well as (Fe,Ni)-co-doping, increased the static dielectric constant of Cu2ZnSnS4, causing the dielectric peak to shift toward lower energy levels. In the visible light range, Fe-doping, Ni-doping, and (Fe,Ni)-co-doping resulted in increased light absorption with higher incident light energies, surpassing an absorption coefficient of 104 cm−1. Notably, Cu2ZnSnS4 exhibited strong light absorption at 1.9 eV, with the highest absorption coefficient observed in the case of (Fe,Ni)-co-doping. Within the energy range of 1.5 eV to 6.3 eV, the reflectivity of Cu2ZnSnS4 doped with Fe, Ni, or both elements remained below 30%. Thus, Cu2ZnSnS4 possesses favorable photoconductivity in the visible light range. Furthermore, the introduction of Fe and Ni dopants resulted in a slight shift of the conductivity peak toward lower energy levels, accompanied by an overall increase in conductivity.

Author Contributions

Writing, X.Y.; experimental design, X.Y.; simulation calculation, X.Y.; analysis, X.Y.;writing—review and editing, X.Q.; model building, X.Q.; data analysis, W.Y.; overall planning, W.Y.; review and revision of the thesis, C.Z.; drawing, C.Z.; literature review, D.Z.; software, D.Z. All authors have read and agreed to the published version of the manuscript.

Funding

This research was funded by the Key Laboratory of Materials Simulation and Computing of Anshun University (Asxyxkpt201803) and the Youth Growth Project of Guizhou Provincial Department of Education, grant number KY (2020) 134.

Data Availability Statement

Not applicable.

Acknowledgments

This work was supported by the Youth Science and Technology Talent Growth Project of the Education Department of Guizhou Province (No.2020138), the Key Supporting Discipline of Materials and Aviation of Anshun College (2020), and the Guizhou Province JMRH Integrated Key Platform Funding Project.

Conflicts of Interest

The authors declare no conflict of interest.

References

  1. Thirunavukkarasu, M.; Sawle, Y.; Lala, H. A comprehensive review on optimization of hybrid renewable energy systems using various optimization techniques. Renew. Sustain. Energy Rev. 2023, 176, 113192. [Google Scholar] [CrossRef]
  2. Das, B.; Hossain, S.M.; Nandi, A.; Samanta, D.; Pramanick, A.K.; Chapa, S.O.M.; Ray, M. Spectral conversion by silicon nanocrystal dispersed gel glass: Efficiency enhancement of silicon solar cell. J. Phys. D Appl. Phys. 2021, 55, 025106. [Google Scholar] [CrossRef]
  3. Okil, M.; Salem, M.S.; Abdolkader, T.M.; Shaker, A. From Crystalline toLow-cost Silicon-based Solar Cells: A Review. Silicon 2021, 14, 1895–1911. [Google Scholar] [CrossRef]
  4. Koltsov, M.; Gopi, S.V.; Raadik, T.; Krustok, J.; Josepson, R.; Gržibovskis, R.; Vembris, A.; Spalatu, N. Development of Bi2S3 thin film solar cells by close-spaced sublimation and analysis of absorber bulk defects via in-depth photoluminescence analysis. Sol. Energy Mater. Sol. Cells 2023, 254, 112292. [Google Scholar] [CrossRef]
  5. Eka, C.P.; Jessie, M.; Endi, S.; Andhy, S.; Ganes, S.; Mohammad, K.A.; Brian, Y. The effect of CuZn+ZnCu defect complex on Cu2ZnSnS4 thin film solar cell:A density functional theory study. Mater. Chem. Phys. 2023, 296, 127192. [Google Scholar]
  6. Pan, B.; Wei, M.; Liu, W.; Jiang, G.; Zhu, C. Fabrication of Cu2ZnSnS4 absorber layers with adjustable Zn/Sn and Cu/Zn+Sn ratios. J. Mater. Sci. Mater. Electron. 2014, 25, 3344–3352. [Google Scholar] [CrossRef]
  7. Su, Z.H.; Liang, G.X.; Fan, P.; Luo, J.; Zheng, Z.; Xie, Z.; Wang, W.; Chen, S.; Hu, J.; Wei, Y.; et al. Device Postannealing Enabling over 12% Efficient Solution-Processed Cu2ZnSnS4 Solar Cells with Cd2+ Substitution. Adv. Mater. 2020, 32, 2000121. [Google Scholar] [CrossRef]
  8. Ki, W.; Hillhouse, H.W. Earth-Abundant Element Photovoltaics Directly from Soluble Precursors with High Yield Using a Non-Toxic Solvent. Adv. Energy Mater. 2011, 1, 732–735. [Google Scholar] [CrossRef]
  9. Crovetto, A.; Hansen, O. What is the band alignment of Cu2ZnSn(S,Se)4 solar cells? Sol. Energy Mater. Sol. Cells. 2017, 169, 177–194. [Google Scholar] [CrossRef] [Green Version]
  10. Bao, W.; Ichimura, M. Prediction of the Band Offsets at the CdS/Cu2ZnSnS4 Interface Based on the First-Principles Calculation. Jpn. J. Appl. Phys. 2012, 51, 10NC31. [Google Scholar] [CrossRef]
  11. Chen, S.; Walsh, A.; Gong, X.G.; Wei, S.H. Classification of Lattice Defects in the kesterite Cu2ZnSnS4 and Cu2ZnSnSe4 Earth-Abundant Solar Cell Absorbers. Adv. Mater. 2013, 25, 1522–1539. [Google Scholar] [CrossRef] [PubMed]
  12. Su, Z.; Tan, J.M.; Li, X.; Zeng, X.; Batabyal, S.K.; Wong, L.H. Cation Substitution of Solution-Processed Cu2ZnSnS4 Thin Film Solar Cell with over 9% Efficiency. Adv. Energy Mater. 2015, 5, 1500682. [Google Scholar] [CrossRef]
  13. Choubrac, L.; Bär, M.; Kozina, X.; Félix, R.; Wilks, R.G.; Brammertz, G.; Levcenko, S.; Arzel, L.; Barreau, N.; Harel, S.; et al. Sn Substitution by Ge: Strategies to Overcome the Open-Circuit Voltage Deficit of Kesterite Solar Cells. ACS Appl. Energy Mater. 2020, 3, 5830–5839. [Google Scholar] [CrossRef]
  14. Zhou, J.Z.; Xu, X.; Duan, B.W.; Shi, J.J.; Luo, Y.H.; Wu, H.J.; Li, D.M.; Meng, Q.B. Research Progress of Metal(I) Substitution in Cu2ZnSn(S,Se)4 Thin Film Solar Cells. Acta Chim. Sinica. 2021, 79, 303–318. [Google Scholar] [CrossRef]
  15. Neuschitzer, M.; Rodriguez, M.E.; Guc, M.; Marquez, J.A.; Giraldo, S.; Forbes, I.; Perez-Rodriguez, A.; Saucedo, E. Revealing the beneficial effects of Ge doping on Cu2ZnSnSe4 thin film solar cells. J. Mater. Chem. A 2018, 6, 11759. [Google Scholar] [CrossRef]
  16. Yuan, Z.-K.; Chen, S.; Xiang, H.; Gong, X.-G.; Walsh, A.; Park, J.-S.; Repins, I.; Wei, S.-H. Engineering Solar Cell Absorbers by Exploring the Band Alignment and Defect Disparity: The Case of Cu- and Ag-Based Kesterite Compounds. Adv. Funct. Mater. 2015, 25, 6733–6743. [Google Scholar] [CrossRef]
  17. Sravani, L.; Routray, S.; Courel, M.; Radhan, K.P. Loss mechanisms in CZTS and CZTSe kesteritethin-film solarcells: Understanding the complexity of defect density. Sol. Energy. 2021, 227, 56–66. [Google Scholar] [CrossRef]
  18. Bencherif, H. Towards a high efficient Cd-free double CZTS layers kesterite solar cell using an optimized interface band alignment. Sol. Energy 2022, 238, 114–125. [Google Scholar] [CrossRef]
  19. Kaur, K.; Nisika; Chowdhury, A.H.; Qiao, Q.; Kumar, M. Nanoscale charge transport and local surface potential distribution toprobe the defect passivation in Cr-substituted earth abundant CZTS absorber layer. J. Alloys Compd. 2021, 854, 157160. [Google Scholar] [CrossRef]
  20. Muska, K.; Timmo, K.; Pilvet, M.; Kaupmees, R.; Raadik, T.; Mikli, V.; Grossberg-Kuusk, M.; Krustok, J.; Josepson, R.; Lange, S.; et al. Impact of Li and K co-doping on the optoelectronic properties of CZTS monograin powder. Sol. Energy Mater. Sol. Cells 2023, 252, 112182. [Google Scholar] [CrossRef]
  21. Liu, B.; Guo, J.; Hao, R.; Wang, L.; Gu, K.; Sun, S.; Aierken, A. Effect of Na doping on the performance and the band alignment of CZTS/CdS thin film solar cell. Sol. Energy. 2020, 201, 219–226. [Google Scholar] [CrossRef]
  22. Heydar, H.N.; Tara, P.D. Influence of Ag-doping on the performance of Cu2ZnSnS4 solar cells. Sol. Energy. 2023, 253, 321–331. [Google Scholar]
  23. Ashfaq, A.; Jacob, J.; Amami, M.; Al-Harbi, F.; Ali, A.; Mahmood, K.; Rehman, U.; Amin, N.; Ikram, S.; Akbar, S.T.; et al. Effect of Al-doping on the thermoelectric properties of CZTS thin film grown by sol-gel method. Solid State Commun. 2022, 345, 114701. [Google Scholar] [CrossRef]
  24. Pandey, A.; Yadav, P.; Kumar, P.; Singh, M.K. Synthesis, morphological and optical properties of hydrothermally synthesized Bi and Mn co-doped Cu2ZnSnS4(CZTS). Mater. Today Proc. 2022, 11, 407. [Google Scholar] [CrossRef]
  25. Gupta, A.K.S.; Farhad, S.F.U.; Habib, S.; Hossan, M.R.; Hossain, K.; Das, N.K.; Quamruzzaman, M.; Matin, M.; Amin, N. Characterizations of extrinsically doped CZTS thin films for solar cell absorbers fabricated by sol-gel spin coating method. Appl. Surf. Sci. Adv. 2023, 13, 100352. [Google Scholar] [CrossRef]
  26. Liang, X.; Zhang, D.; Wu, Z.; Wang, D. The Fe-promoted MoP catalyst with high activity for water splitting. Appl. Catal. A Gen. 2016, 524, 134–138. [Google Scholar] [CrossRef]
  27. Hohenberg, P.; Kohn, W. Inhomogeneous Electron Gas. Phys. Rev. 1964, 136, B864–B871. [Google Scholar] [CrossRef] [Green Version]
  28. Kohn, W.; Sham, L.J. Self-consistent Equations Including Exchange and Correlation Effects. Phys. Rev. 1965, 140, A1133–A1138. [Google Scholar] [CrossRef] [Green Version]
  29. Ismael, M. One-step ultrasonic-assisted synthesis of Ni-doped g-C3N4 photocatalyst for enhanced photocatalytic hydrogen evolution. Inorg. Chem. Commun. 2023, 151, 110607. [Google Scholar] [CrossRef]
  30. Schorr, S.; Hoebler, H.-J.; Tovar, M. A neutron diffraction study of the stannite-kesterite solid solution series. Eur. J. Miner. 2007, 19, 65–73. [Google Scholar] [CrossRef]
  31. Segall, M.D.; Lindan, P.; Probert, M.J.; Pickard, C.J.; Hasnip, P.J.; Clark, S.J.; Payne, M.C. First-principles simulation: Ideas, illustrations and the CASTEP code. J. Phys. Condens. Matter 2002, 14, 2717–2744. [Google Scholar] [CrossRef]
  32. Clark, S.J.; Segall, M.D.; Pickard, C.J.; Hasnip, P.J.; Probert, M.I.J.; Refson, K.; Payne, M.C. First principles methods using CASTEP. Z. Kristallogr.Cryst. Mater. 2005, 220, 567–570. [Google Scholar] [CrossRef] [Green Version]
  33. Perdew, J.P.; Burke, K.; Ernzerhof, M. Generalized Gradient Approximation Made Simple. Phys. Rev. Lett. 1996, 77, 3865–3868. [Google Scholar] [CrossRef] [Green Version]
  34. Vanderbilt, D. Soft self-consistent pseudopotentials in a generalized eigenvalue formalism. Phys. Rev. B. 1990, 41, 7892–7895. [Google Scholar] [CrossRef] [PubMed]
  35. Li, M.; Zhang, J.; Zhang, Y. First-principles calculation of compensated (2N, W) codoping impacts on band gap engineering in anatase TiO2. Chem. Phys. Lett. 2012, 527, 63–66. [Google Scholar] [CrossRef]
  36. Long, R.; English, N.J. Synergistic Effects of Bi/S Codoping on Visible Light-Activated Anatase TiO2 Photocatalysts from First Principles. J. Phys. Chem. C 2009, 113, 8373–8377. [Google Scholar] [CrossRef]
  37. Paier, J.; Asahi, R.; Nagoya, A.; Kresse, G. Cu2ZnSnS4 as a potential photovoltaic material: A hybrid Hartree-Fockdensity functional theory study. Phys. Rev. B. 2009, 79, 115126. [Google Scholar] [CrossRef]
  38. Sun, D.; Ding, Y.; Kong, L.; Zhang, Y.; Guo, X.; Wei, L.; Zhang, L.; Zhang, L. First-principles Study on Mg Doping in Cu2ZnSnS4. J. Inorg. Mater. 2020, 35, 1290–1294. [Google Scholar] [CrossRef]
  39. Digraskar, R.V.; Mali, S.M.; Tayade, S.B.; Ghule, A.V.; Sathe, B.R. Overall noble metal free Ni and Fe doped Cu2ZnSnS4 (CZTS) bifunctional electrocatalytic systems for enhanced water splitting reactions. Int. J. Hydrogen Energy. 2019, 44, 8144–8155. [Google Scholar] [CrossRef]
  40. Liu, X.; Zhong, Q.; Guo, W.; Zhang, W.; Ya, Y.; Xia, Y. Novel Platycladus orientalis–shaped Fe-doped ZnO hierarchical nanoflowerdecorated with Ag nanoparticles for photocatalytic application. J. Alloys Compd. 2021, 880, 160501. [Google Scholar] [CrossRef]
  41. Mo, M.; Zeng, J.-S.; He, H.; Zhang, L.; Du, L.; Fang, Z.-J. The first-principle study on the formation energies of Be, Mg and Mn doped CuInO2. Acta Phys. Sin. 2019, 68, 106102. [Google Scholar] [CrossRef]
  42. Zhao, H.; Persson, C. Optical properties of Cu(In,Ga)Se2 and Cu2ZnSn(S,Se)4. Thin Solid Film. 2011, 519, 7508–7512. [Google Scholar] [CrossRef]
  43. Islam, S.; Majumdar, P.; Hossain, M.A.; Ahmed, F. Effect of Fe3+ Doping concentration in Cu2ZnSnS4 thin film: Structural and Optical Analysis. J. Mater. Sci. Eng. A. 2022, 12, 97–106. [Google Scholar]
  44. Chen, H.J.; Fu, S.W.; Wu, S.H.; Tsai, T.C.; Wu, H.T.; Shih, C.F. Structural and photoelectron spectroscopic studies of band alignment at the Cu2ZnSnS4/CdS heterojunction with slight Ni doping in Cu2ZnSnS4. J. Phys. D Appl. Phys. 2016, 49, 335102. [Google Scholar] [CrossRef]
  45. Lebègue, S.; Arnaud, B.; Alouani, M. Calculated quasiparticle and optical properties of orthorhombic and cubic Ca2Si. Phys. Rev. B. 2005, 72, 085103. [Google Scholar] [CrossRef]
  46. Borlido, P.; Schmidt, J.; Huran, A.W.; Tran, F.; Marques, M.A.L.; Botti, S. Exchange-correlation functionals for band gaps of solids: Benchmark, reparametrization and machine learning. NPJ Comput. Mater. 2020, 6, 96. [Google Scholar] [CrossRef]
  47. Xiao, C.; Li, K.; Zhang, J.; Tong, W.; Liu, Y.; Li, Z.; Huang, P.; Pan, B.; Su, H.; Xie, Y. Magnetic ions in wide band gap semiconductor nanocrystals for optimized thermoelectric properties. Mater. Horizons. 2014, 1, 81–86. [Google Scholar] [CrossRef]
  48. Prokopidis, K.; Kalialakis, C. Physical interpretation of amodified Lorentz dielectric function for metals based on the Lorentz–Diracforce. Appl. Phys. B 2014, 117, 25–32. [Google Scholar] [CrossRef]
  49. Li, C.R.; Li, Y.F.; Yao, B.; Yang, G.; Zhan, H.D.; Deng, R.; Liu, L. Electronic and optical properties of kesteriteCu2ZnSnS4 under in-plane biaxial strains: First-principles calculations. Phys. Lett. A 2013, 377, 2398–2402. [Google Scholar] [CrossRef]
  50. Behera, N.; Mohan, D.B. Investigation of broad-band optical absorption and electrical properties in vacuum annealed CZTS/Ag multi-layered stack structure for plasmonic solar cell application. Opt. Mater. 2022, 127, 112316. [Google Scholar] [CrossRef]
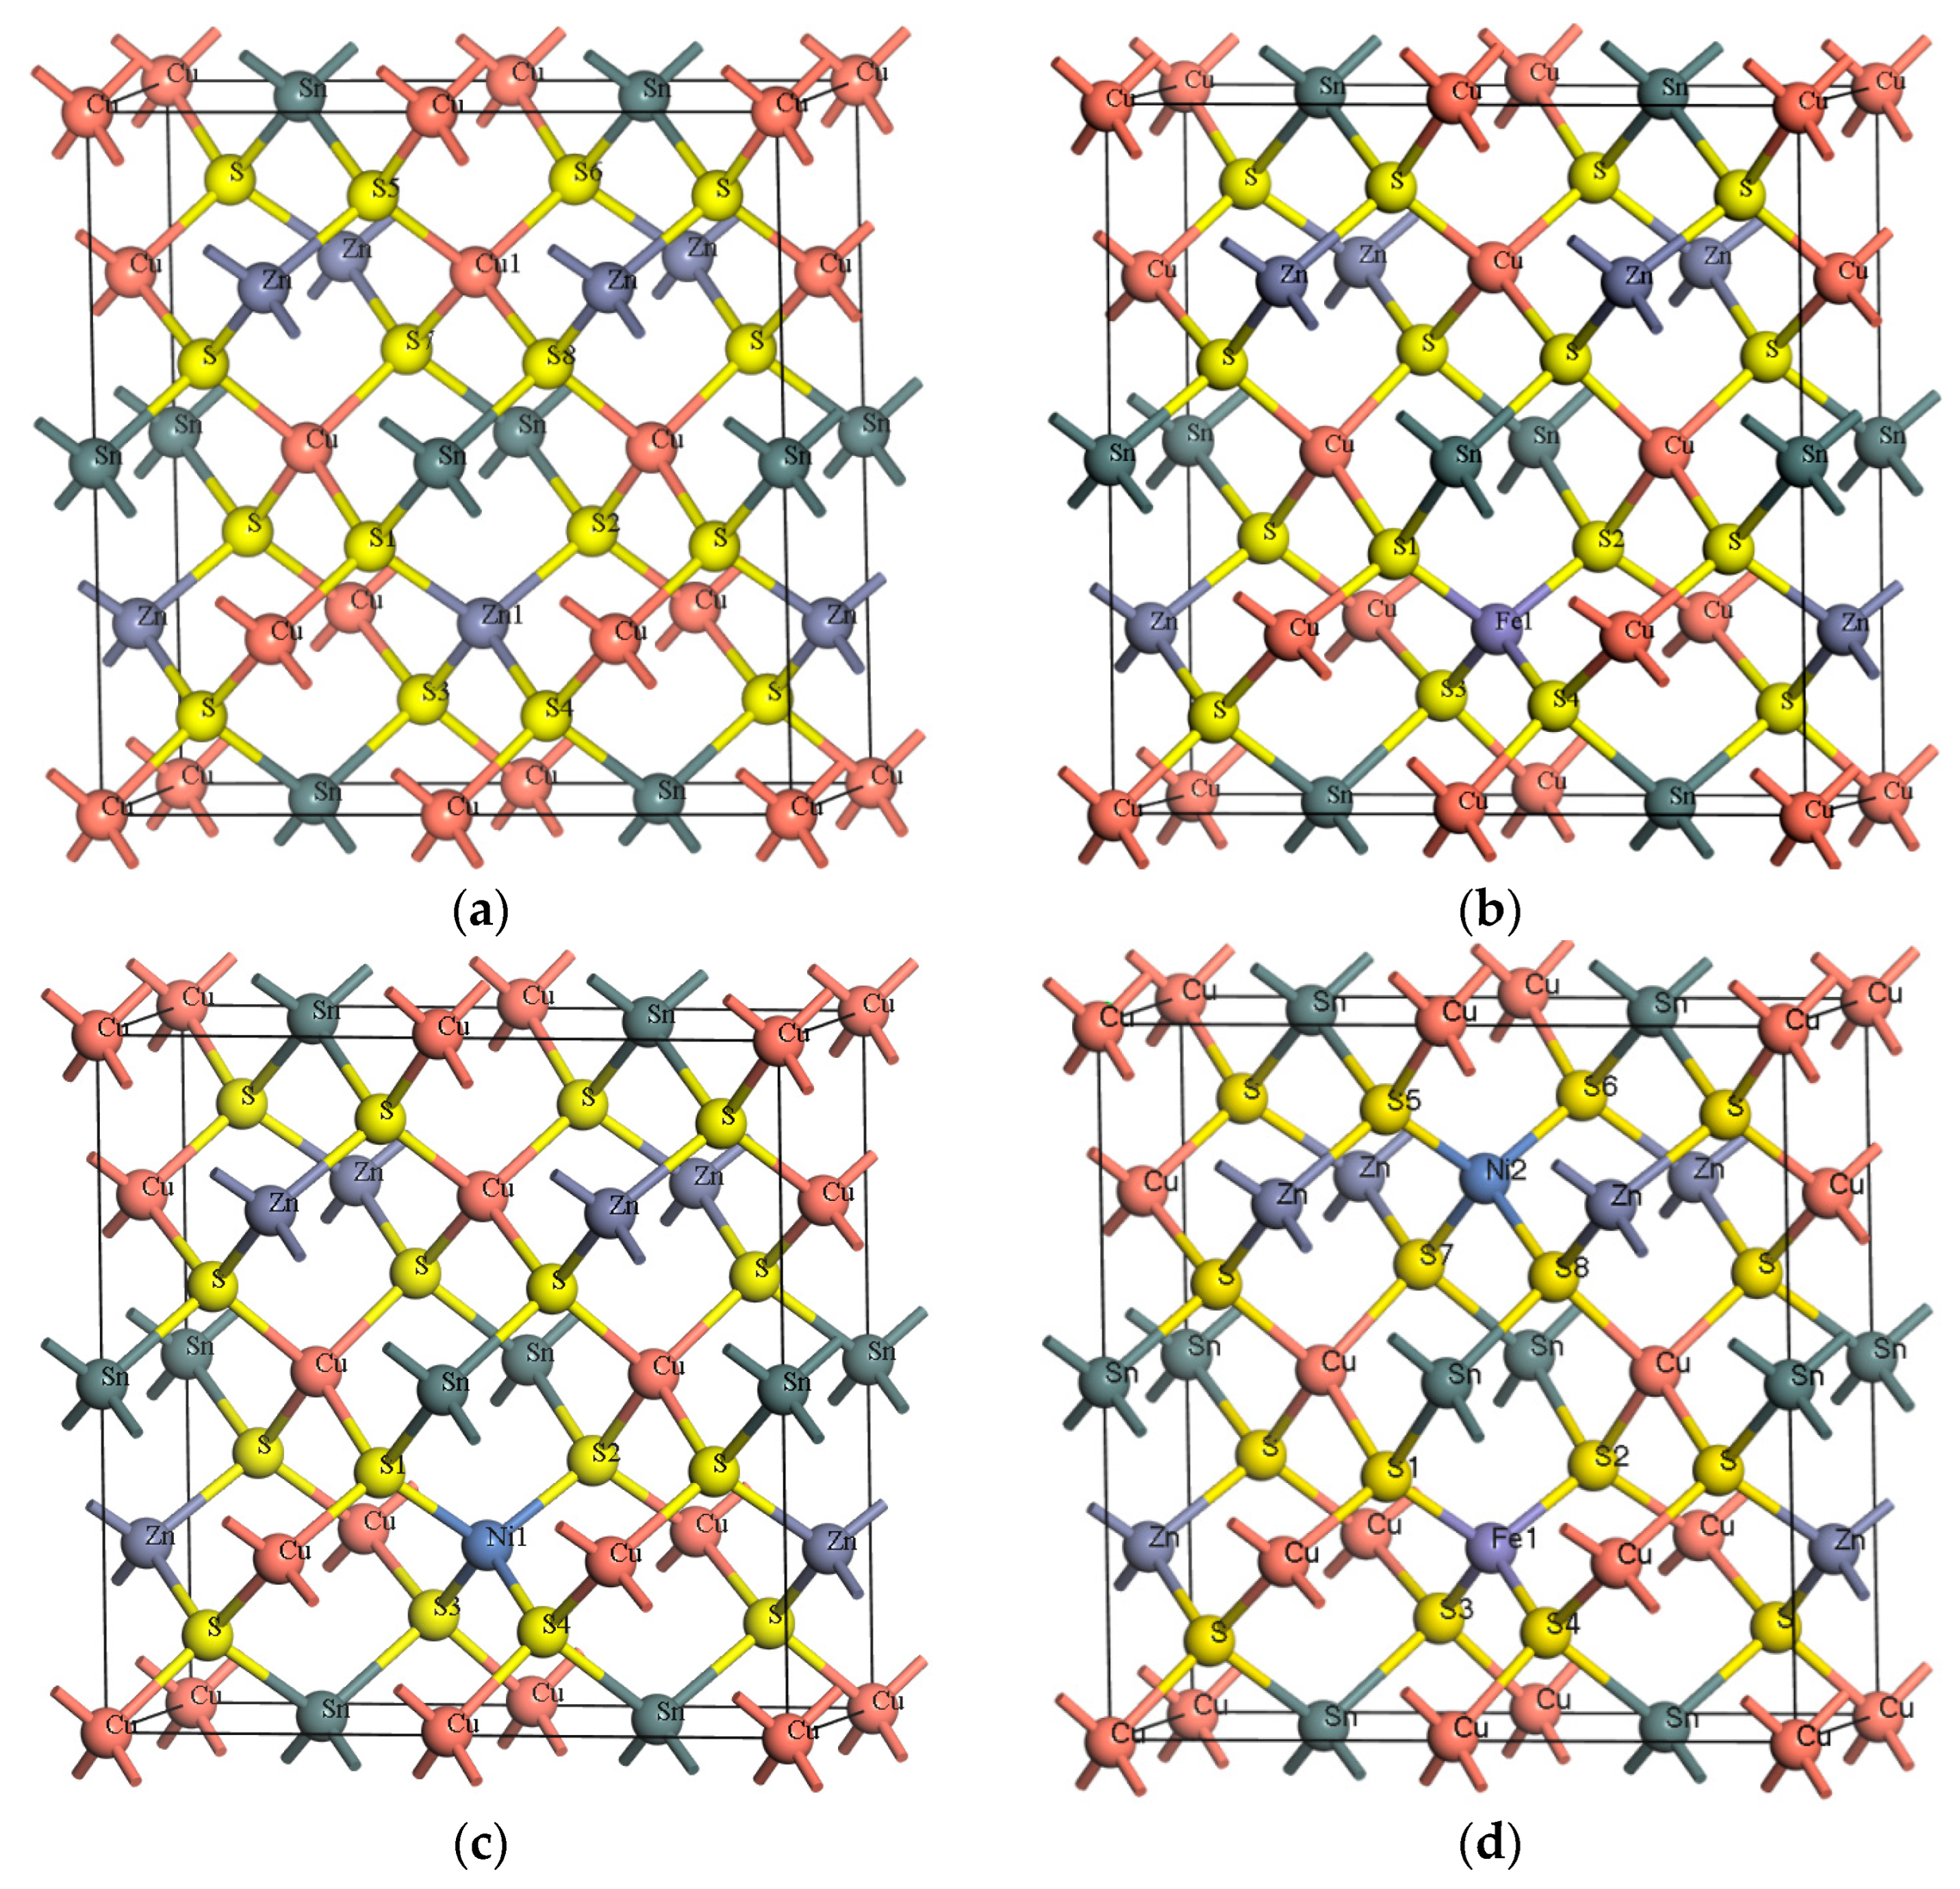
Figure 1. Structure of the single-doped and co-doped Cu2ZnSnS4 supercell: (a) Cu2ZnSnS4 supercell (2 × 1 × 1); (b) Fe-single-doping model; (c) Ni-single-doping model; (d) (Fe,Ni)-co-doping model.
Crystals 13 01082 g001
Figure 2. k-point convergence test.
Crystals 13 01082 g002
Figure 3. Band structure of Fe-doped and Ni-doped Cu2ZnSnS4: (a) undoped band structure, (b) Fe-doped band structure, (c) Ni-doped band structure, and (d) (Fe,Ni)-co-doped band structure.
Crystals 13 01082 g003
Figure 4. Electronic densities of state of Fe-doped and Ni-doped Cu2ZnSnS4.(a) Electronic density of state of undoped Cu2ZnSnS4.(b) Fe-doped Cu2ZnSnS4electronic density of state. (c) Electronic density of state of Ni-doped Cu2ZnSnS4. (d) Electronic density of state of (Fe,Ni)-co-doped Cu2ZnSnS4.
Crystals 13 01082 g004
Figure 5. Fe-doping and Ni-doping Cu2ZnSnS4 complex dielectric function (a) Real part of the complex dielectric function (b) Imaginary part of the complex dielectric function.
Crystals 13 01082 g005
Figure 6. Absorption coefficient and reflection spectrum of Fe-doped and Ni-doped Cu2ZnSnS4. (a) Absorption coefficient. (b) Reflection spectrum.
Crystals 13 01082 g006
Figure 7. Complex conductivity of Fe-doped and Ni-doped Cu2ZnSnS4. (a) Real part. (b) Imaginary part.
Crystals 13 01082 g007
Table 1. Lattice constants and doping formation energy of Fe and Ni-doping in Cu2ZnSnS4.
Samplea/Åa%c/Åc%v3Formation Energy/eV
Un-doping Cu2ZnSnS4(experiment) [33]5.427010.8710
Un-doping Cu2ZnSnS4(caculated) [34]5.471010.9440
Geometry optimization Cu2ZnSnS45.46900.77%10.94600.69%655.0330
Fe-doping Cu2ZnSnS45.44150.27%10.91940.45%647.92251.00
Ni-doping Cu2ZnSnS45.44600.35%10.90850.34%647.01020.58
(Fe,Ni)-co-doping Cu2ZnSnS45.3665−1.11%11.13632.44%652.02600.78
Table 2. Coordinates of high symmetric points.
High Symmetry Pointxyz
G0.0000.0000.000
F0.0000.5000.000
Q0.0000.5000.500
Z0.0000.0000.500
G0.0000.0000.000
Table 3. Mulliken population analysis of atoms adjacent to Fe Ni impurity atoms.
SampleAtomspdTotalCharge/e
Cu2ZnSnS4Zn 10.420.949.9811.340.66
S 1, S 2, S 3, S 41.844.5406.37−0.37
Cu 10.60.649.8111.06−0.06
S 5, S 6, S 7, S 81.844.5406.37−0.37
Fe-doping Cu2ZnSnS4Fe 10.40.626.947.960.04
S 1, S 21.834.4106.24−0.24
S 3, S 41.834.4306.26−0.26
Ni-doping Cu2ZnSnS4Ni 10.50.698.8410.03−0.03
S 1, S 21.834.4506.29−0.29
S 3, S 41.834.4506.28−0.28
(Fe,Ni)-co-doping Cu2ZnSnS4Fe 10.410.626.917.940.06
S 1, S 2, S 31.844.4206.26−0.26
S 41.814.4306.26−0.26
Ni 20.480.668.9110.05−0.05
S 5, S 61.834.4906.32−0.32
S 7, S 81.844.4906.34−0.34
Table 4. Mulliken population analysis of bonds adjacent to Fe Ni impurity atoms.
SampleBondPopulationLength (Å)
Cu2ZnSnS4S 1—Zn 1, S 2 —Zn 10.402.3659
S 3—Zn 1, S 4—Zn 10.412.3653
Fe-doping Cu2ZnSnS4S 1 Fe 10.642.1321
S 2—Fe 10.642.1322
S 3—Fe 10.602.1598
S 4—Fe 10.602.1597
Ni-doping Cu2ZnSnS4S 3—Ni 10.492.2298
S 4—Ni 10.492.2299
S 1—Ni 1, S 2—Ni 10.502.2341
(Fe,Ni)-co-doping Cu2ZnSnS4S 1—Fe 10.642.1451
S 2—Fe 10.642.1433
S 3—Fe 10.582.1666
S 4—Fe 10.582.1679
S 5—Ni 20.472.2055
S 6—Ni 20.472.2038
S 7—Ni 20.482.2778
S 8—Ni 20.482.2794
Disclaimer/Publisher’s Note: The statements, opinions and data contained in all publications are solely those of the individual author(s) and contributor(s) and not of MDPI and/or the editor(s). MDPI and/or the editor(s) disclaim responsibility for any injury to people or property resulting from any ideas, methods, instructions or products referred to in the content.