
Structural Evolution in a Series of Isomorphous Rare Earth Compounds as Response of Lanthanide Contraction


Abstract
1. Introduction
2. Materials and Methods
2.1. Preparation
2.2. Spectroscopic Measurement and Elemental Analyses
2.3. Single Crystal X-ray Structure Determinations
3. Results and Discussion
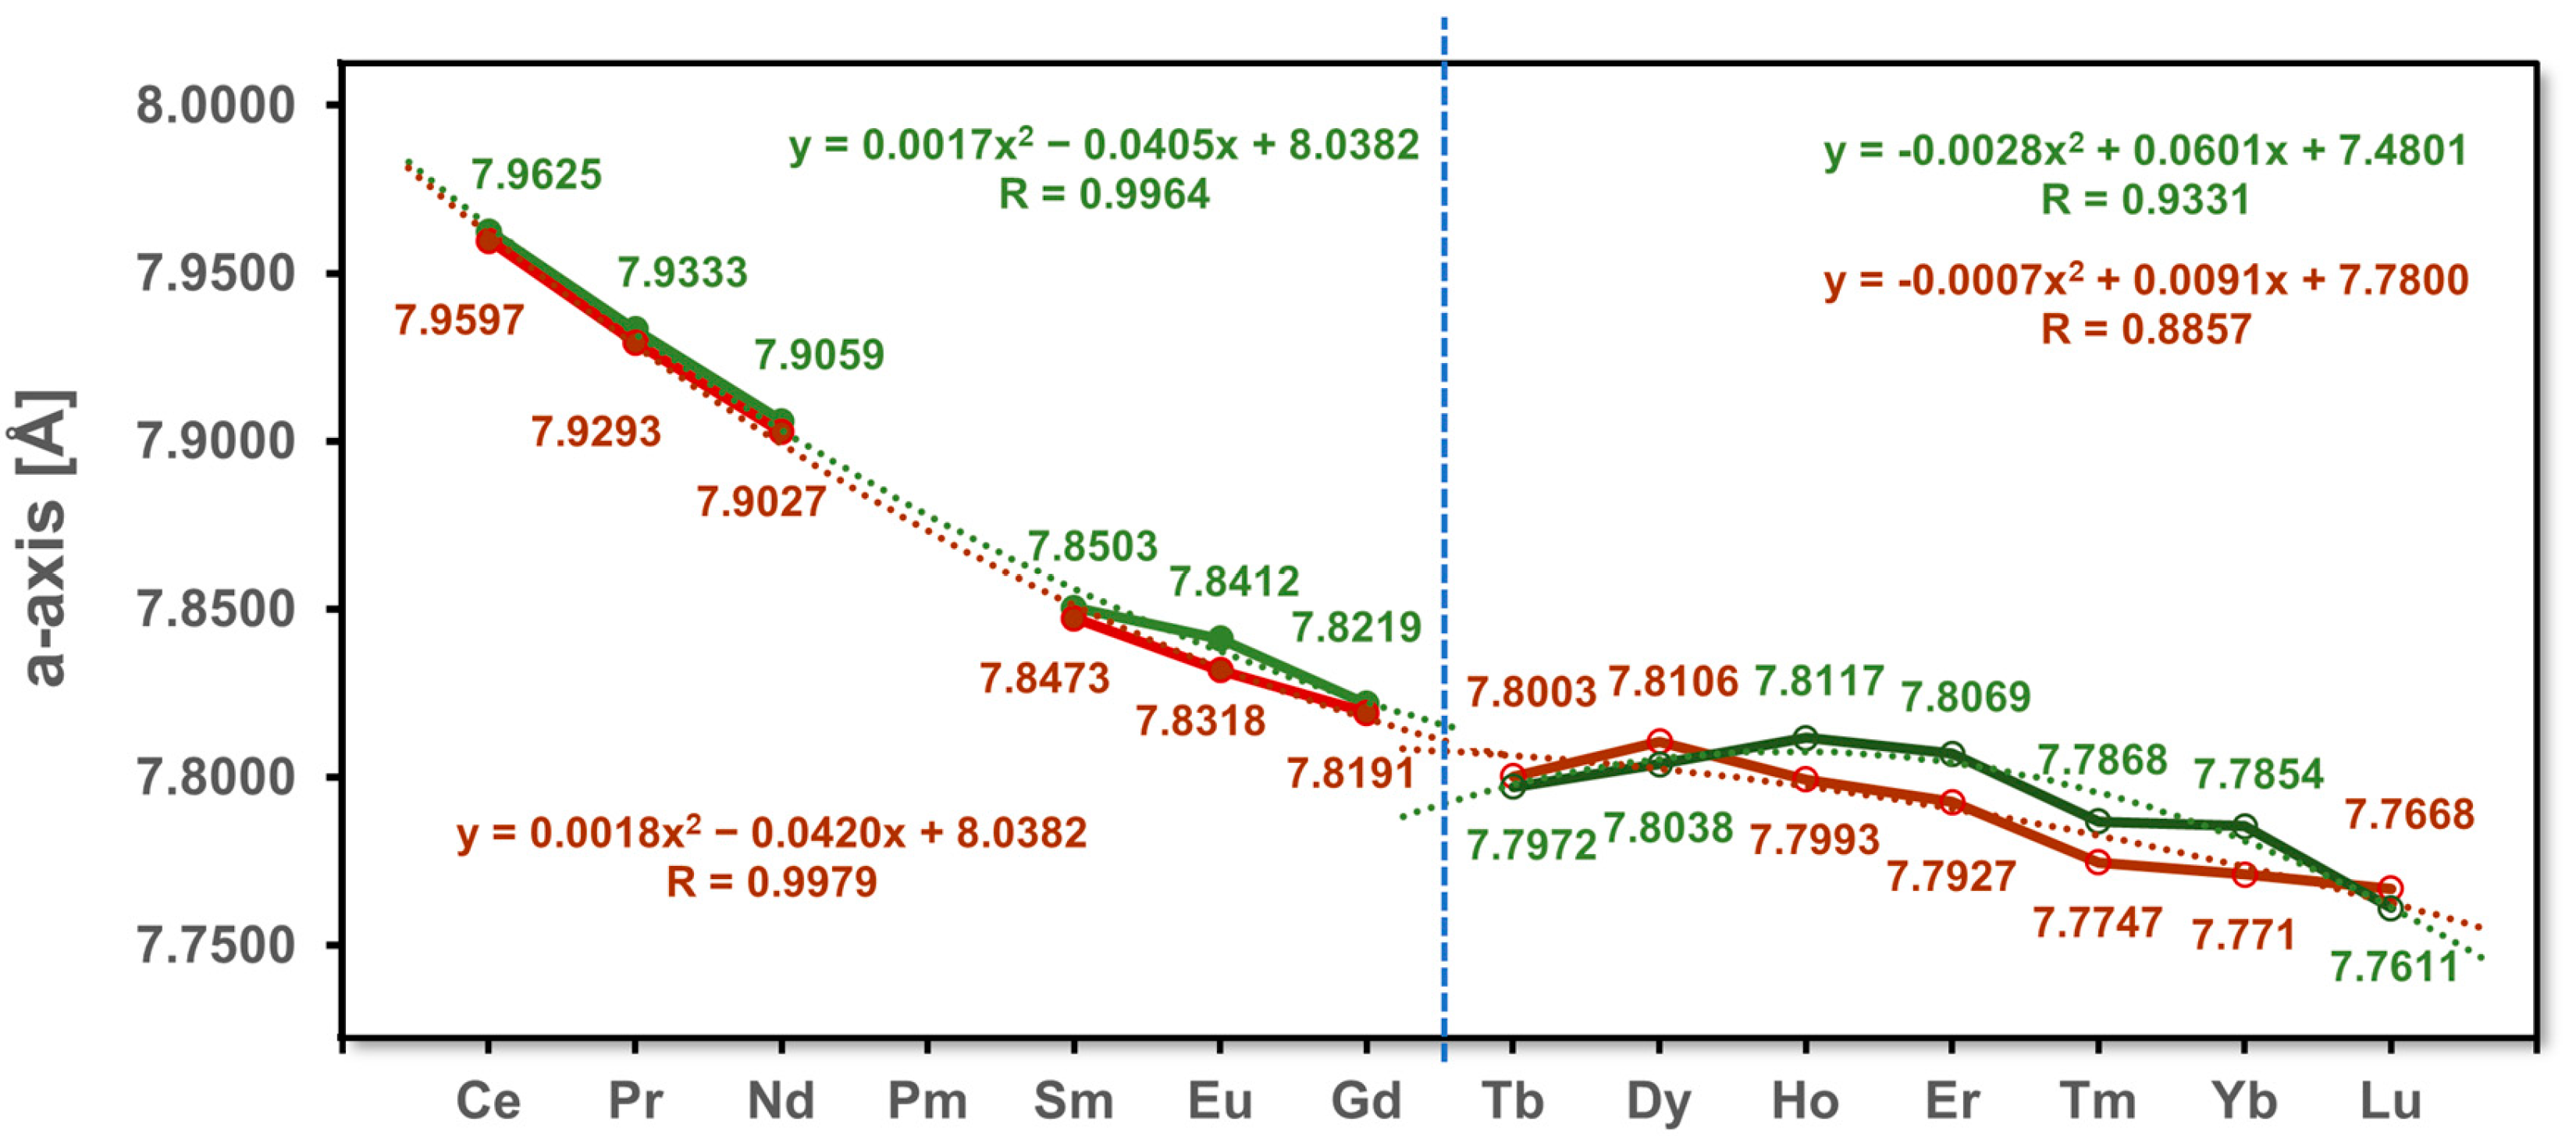
3.1. Unit Cell Volumes and Lattice Parameters
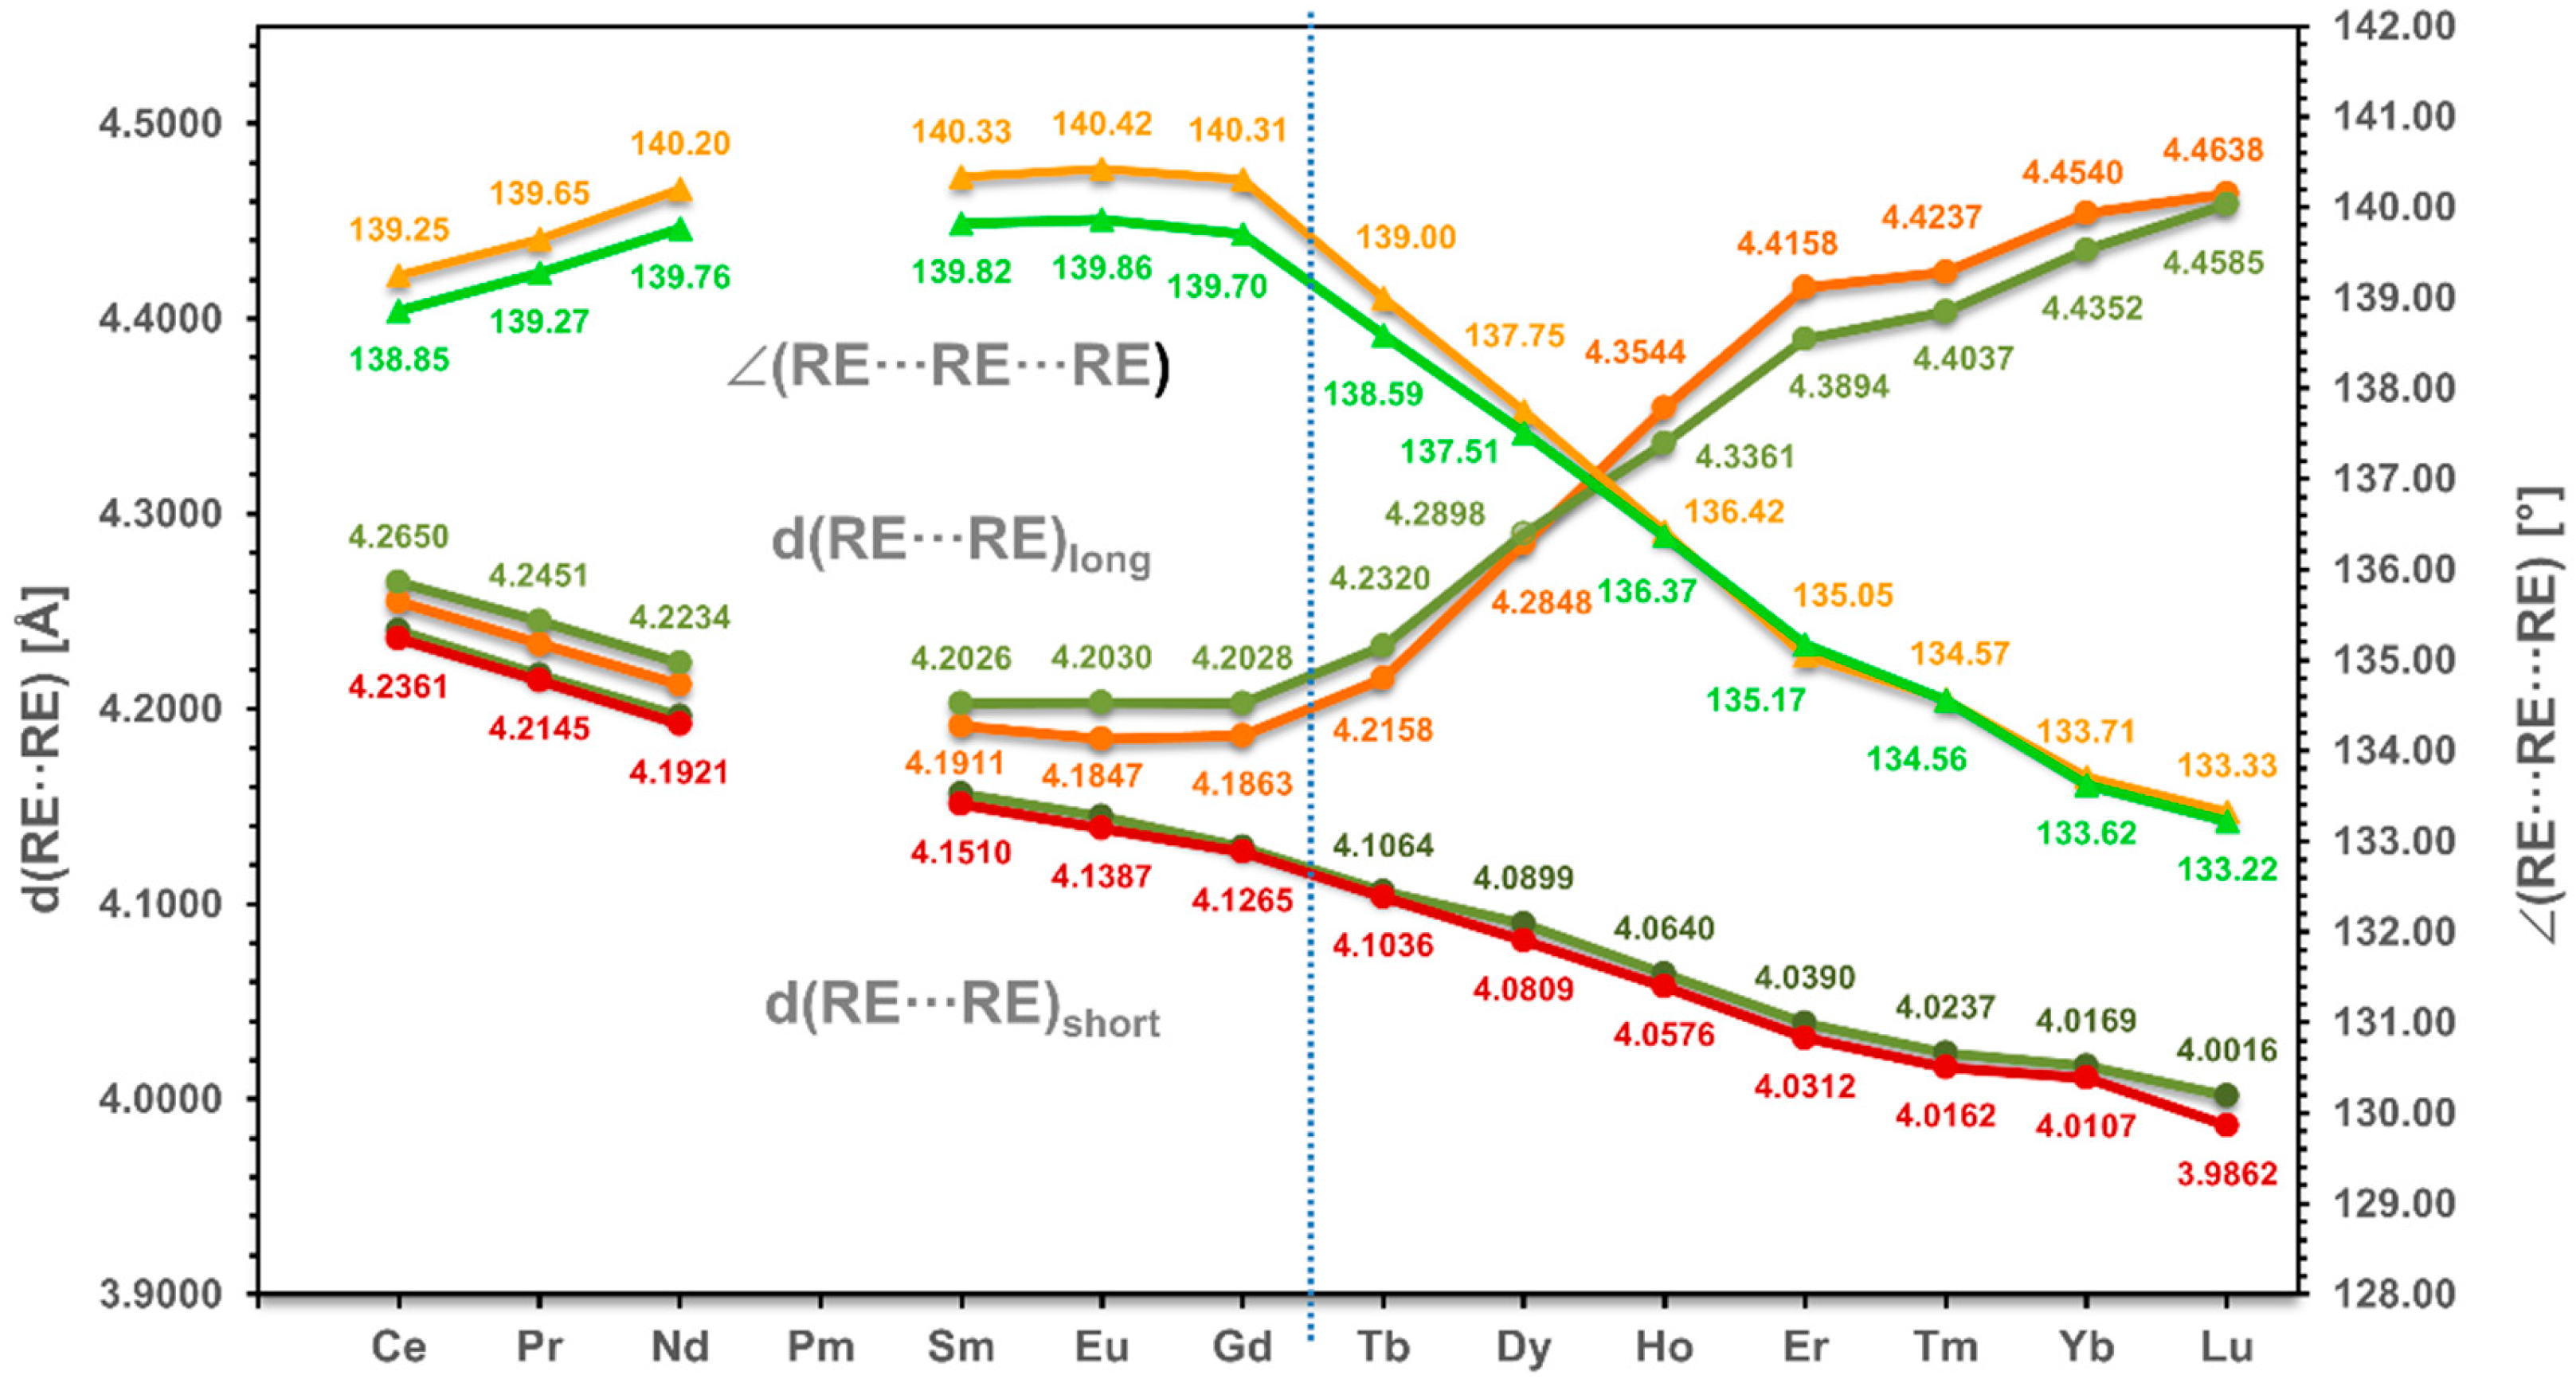
3.2. Alignment of RE in the Coordination Polymer
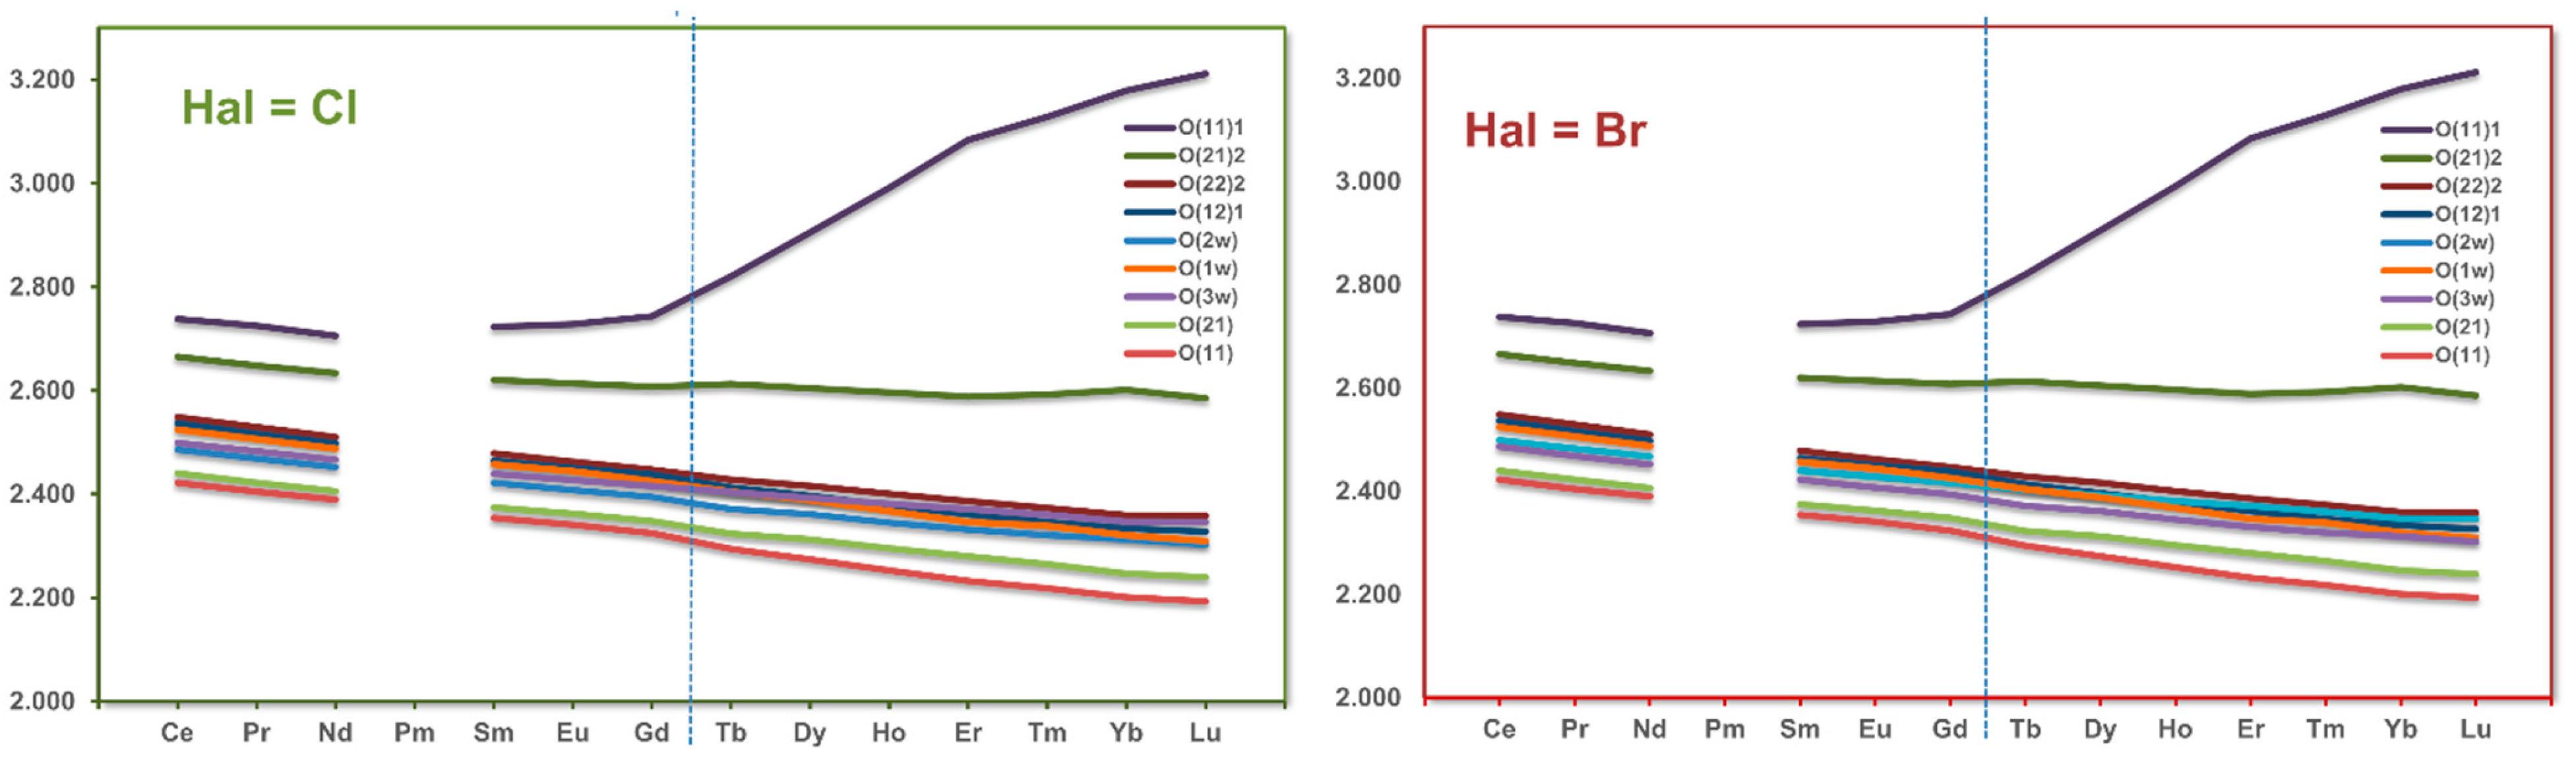
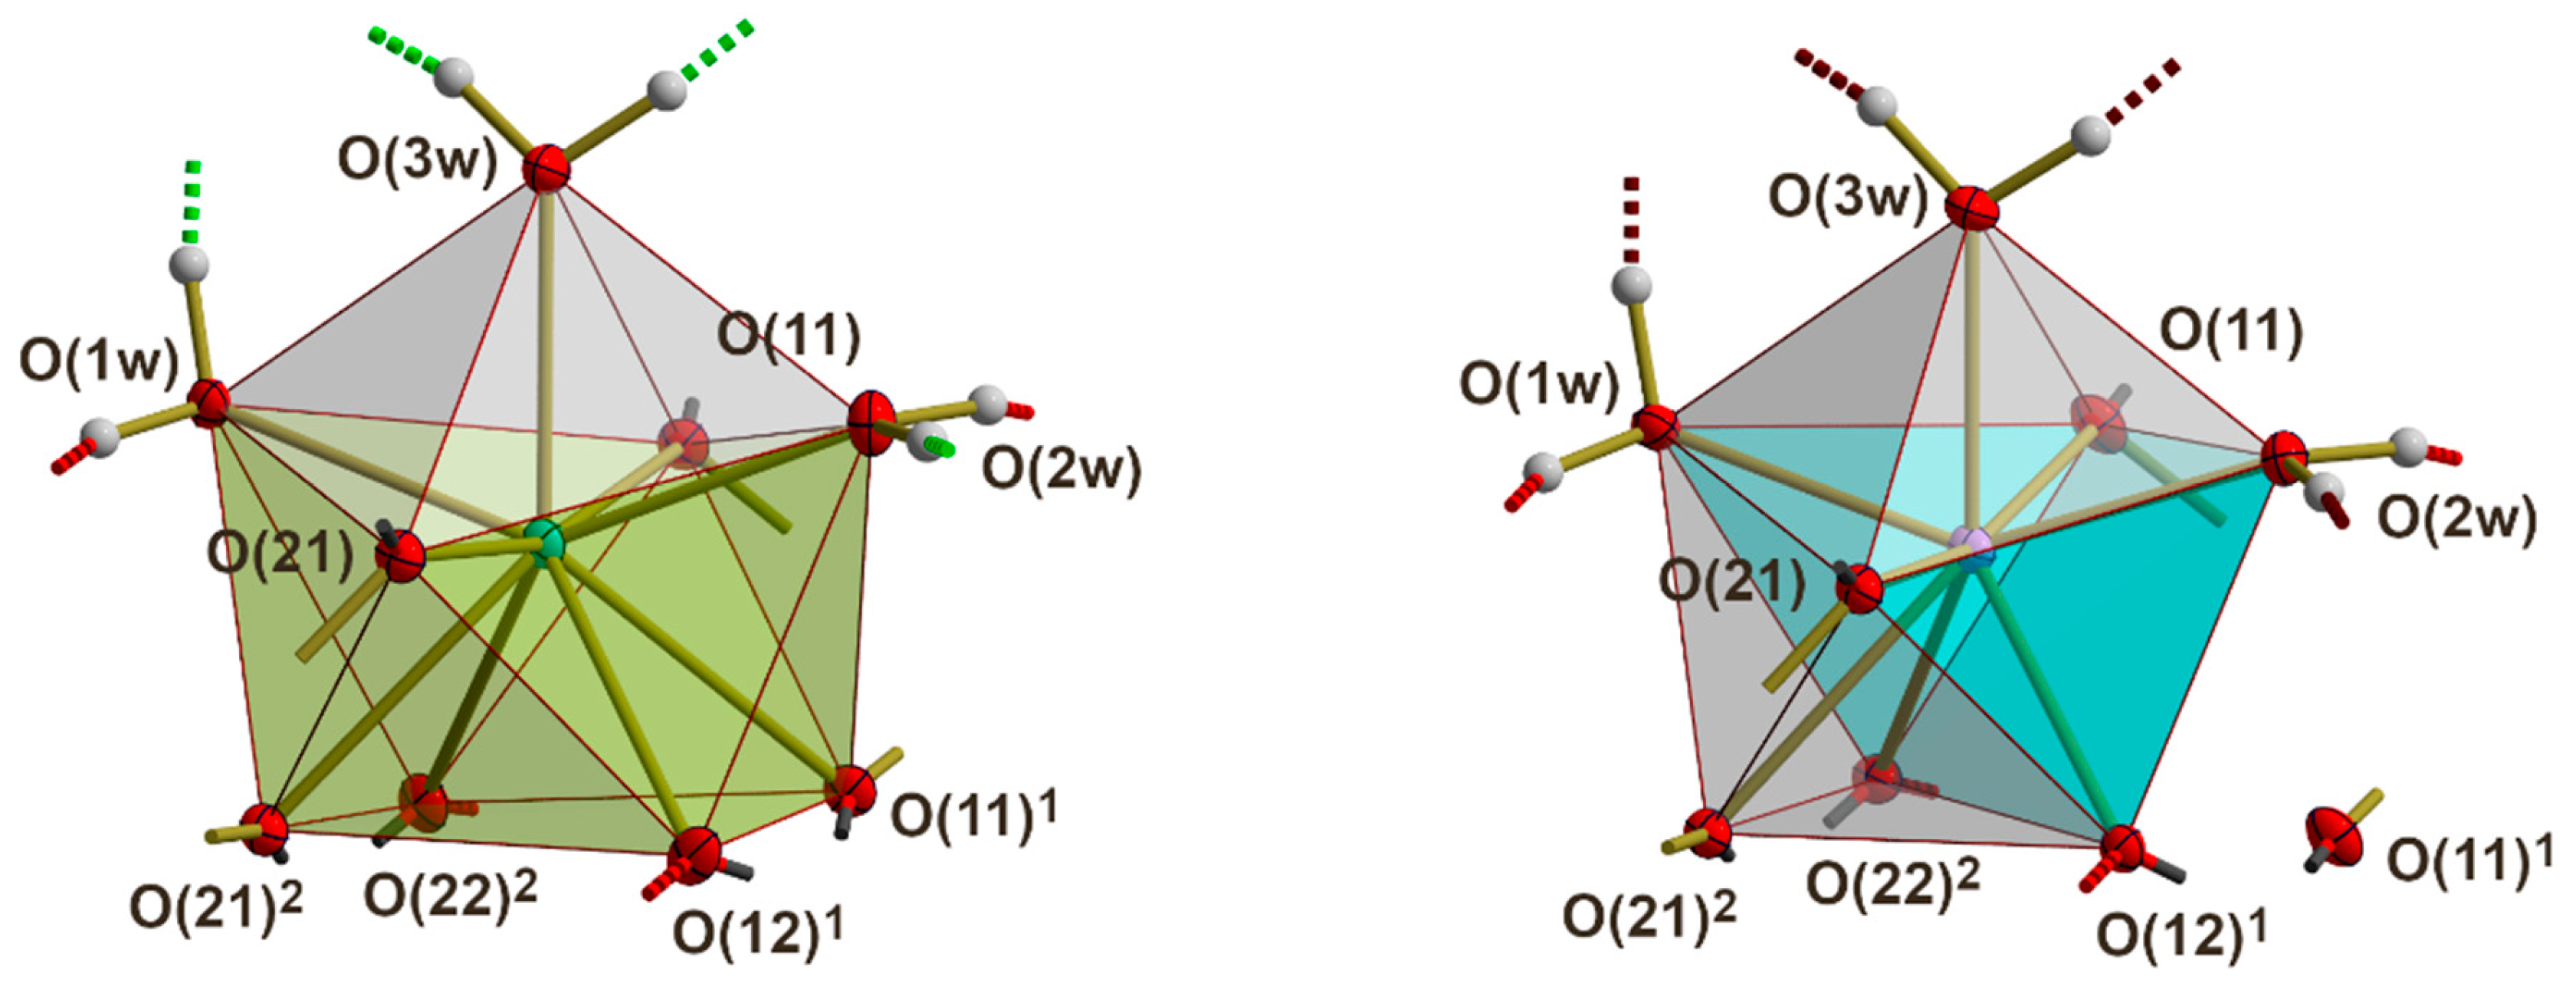
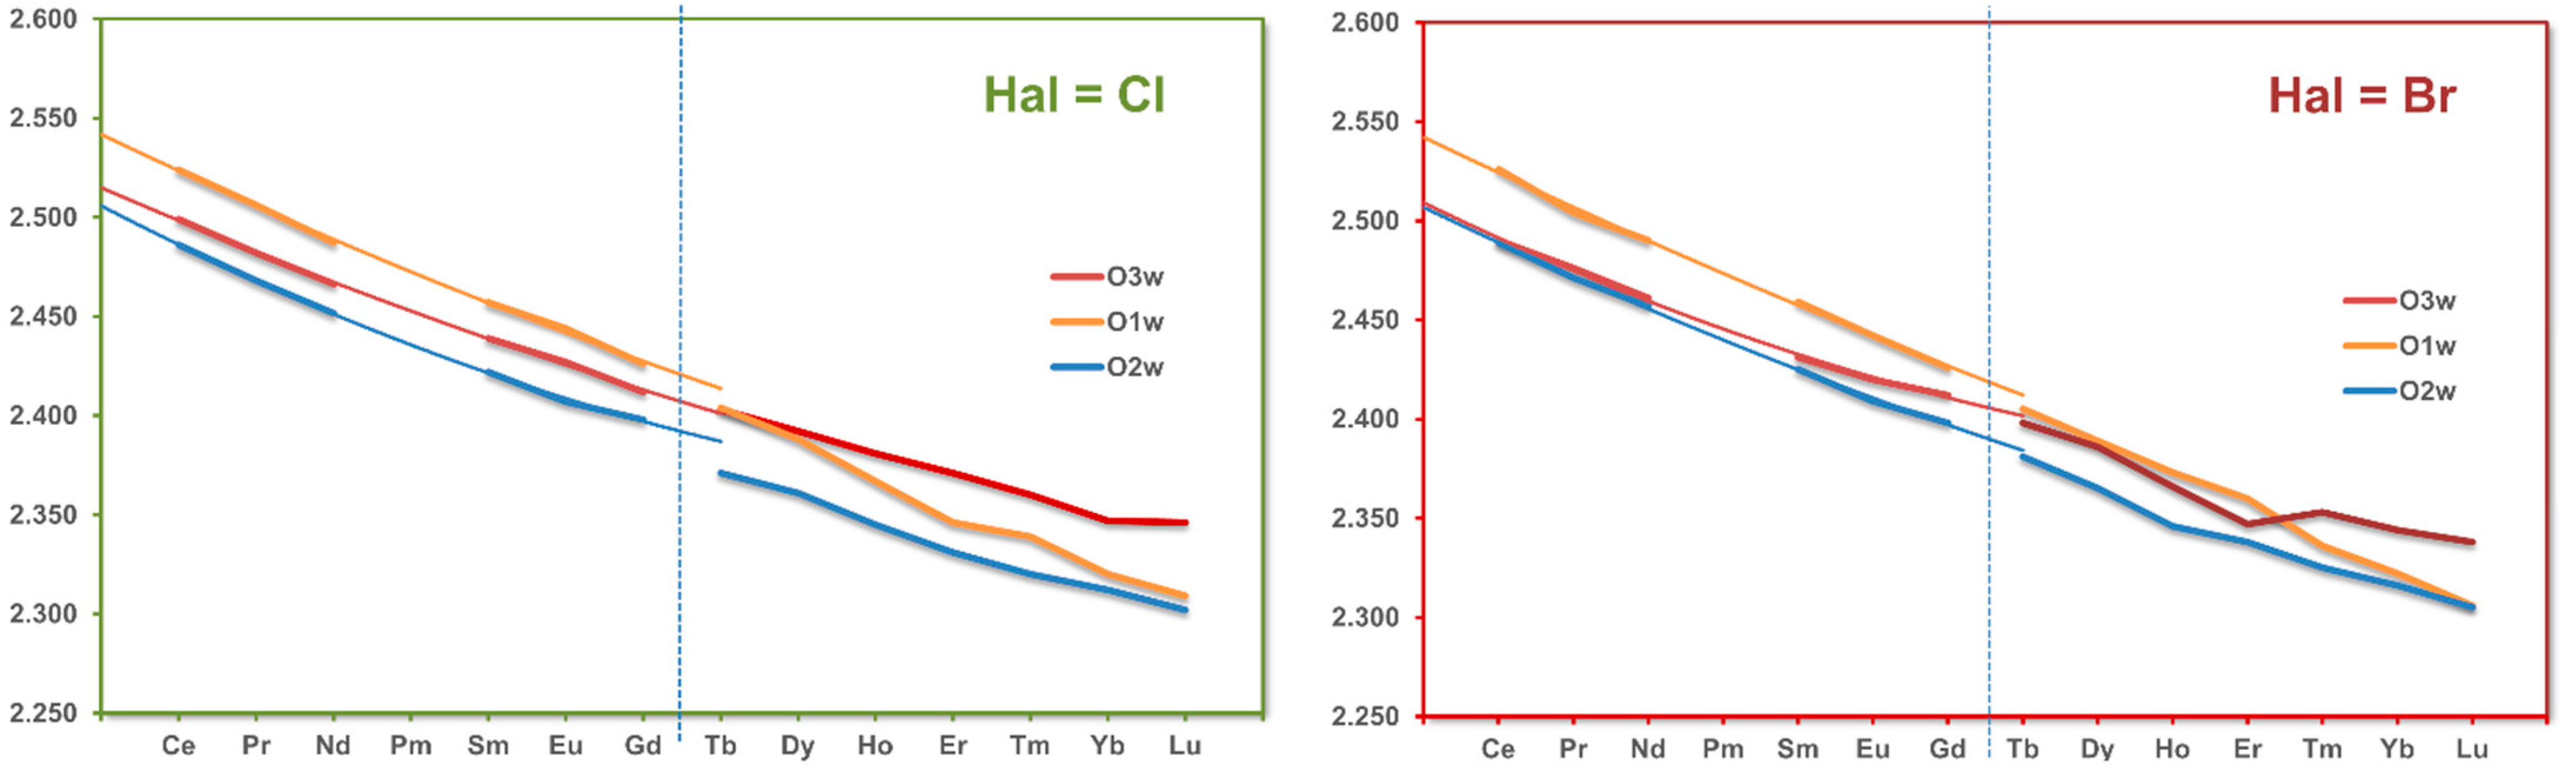
3.3. RE Coordination
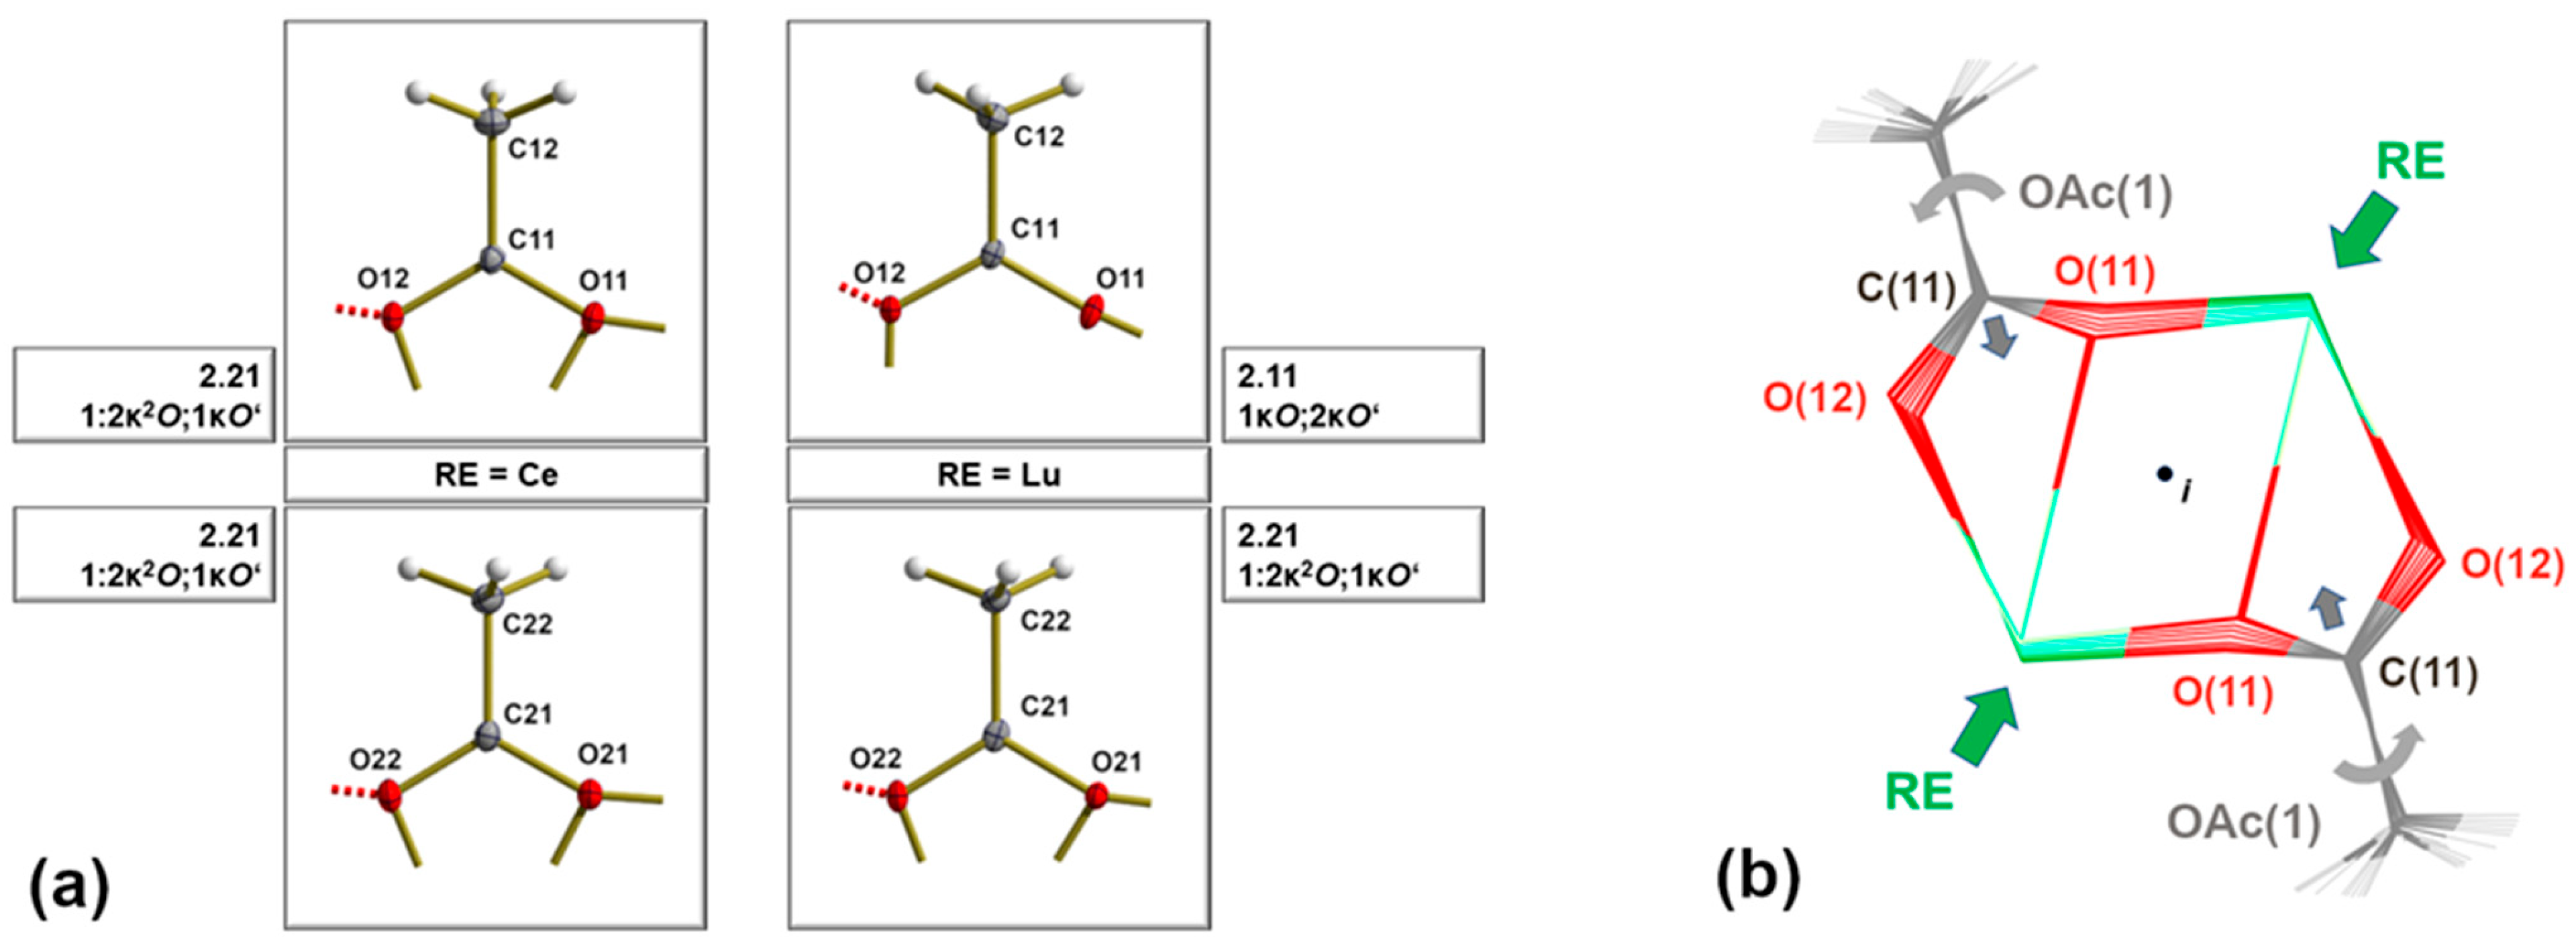
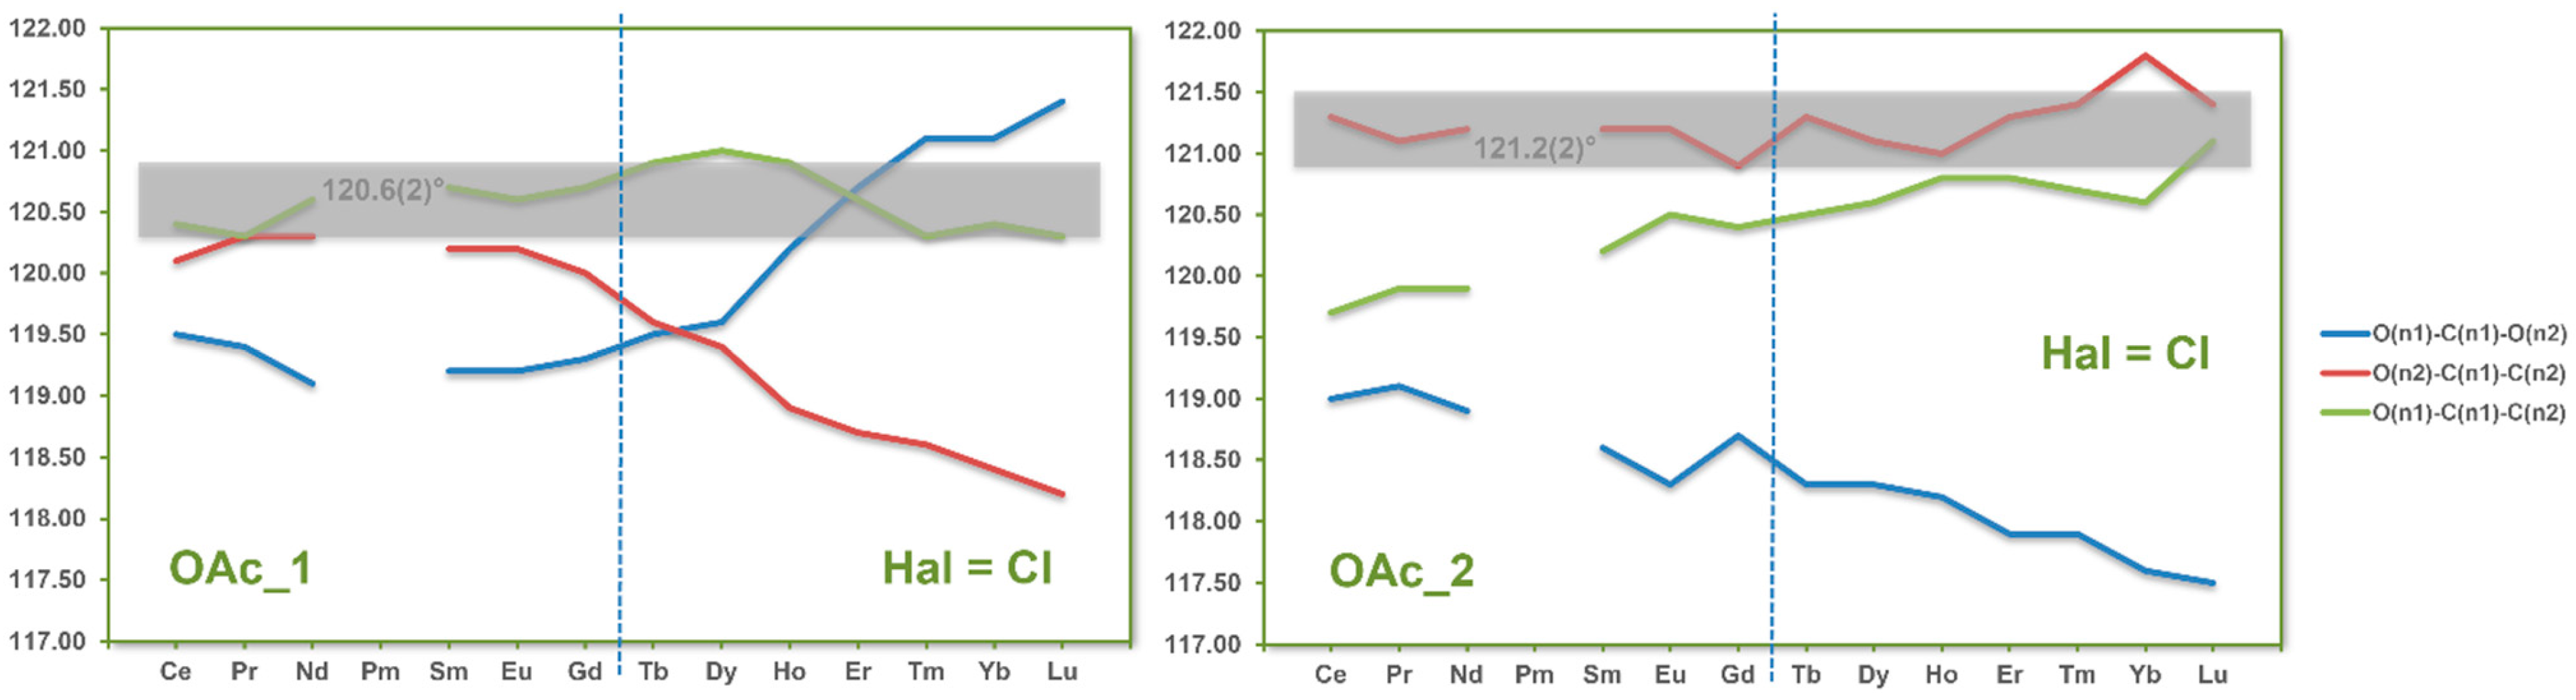
3.4. Coordination Modes of the Acetate Ligands
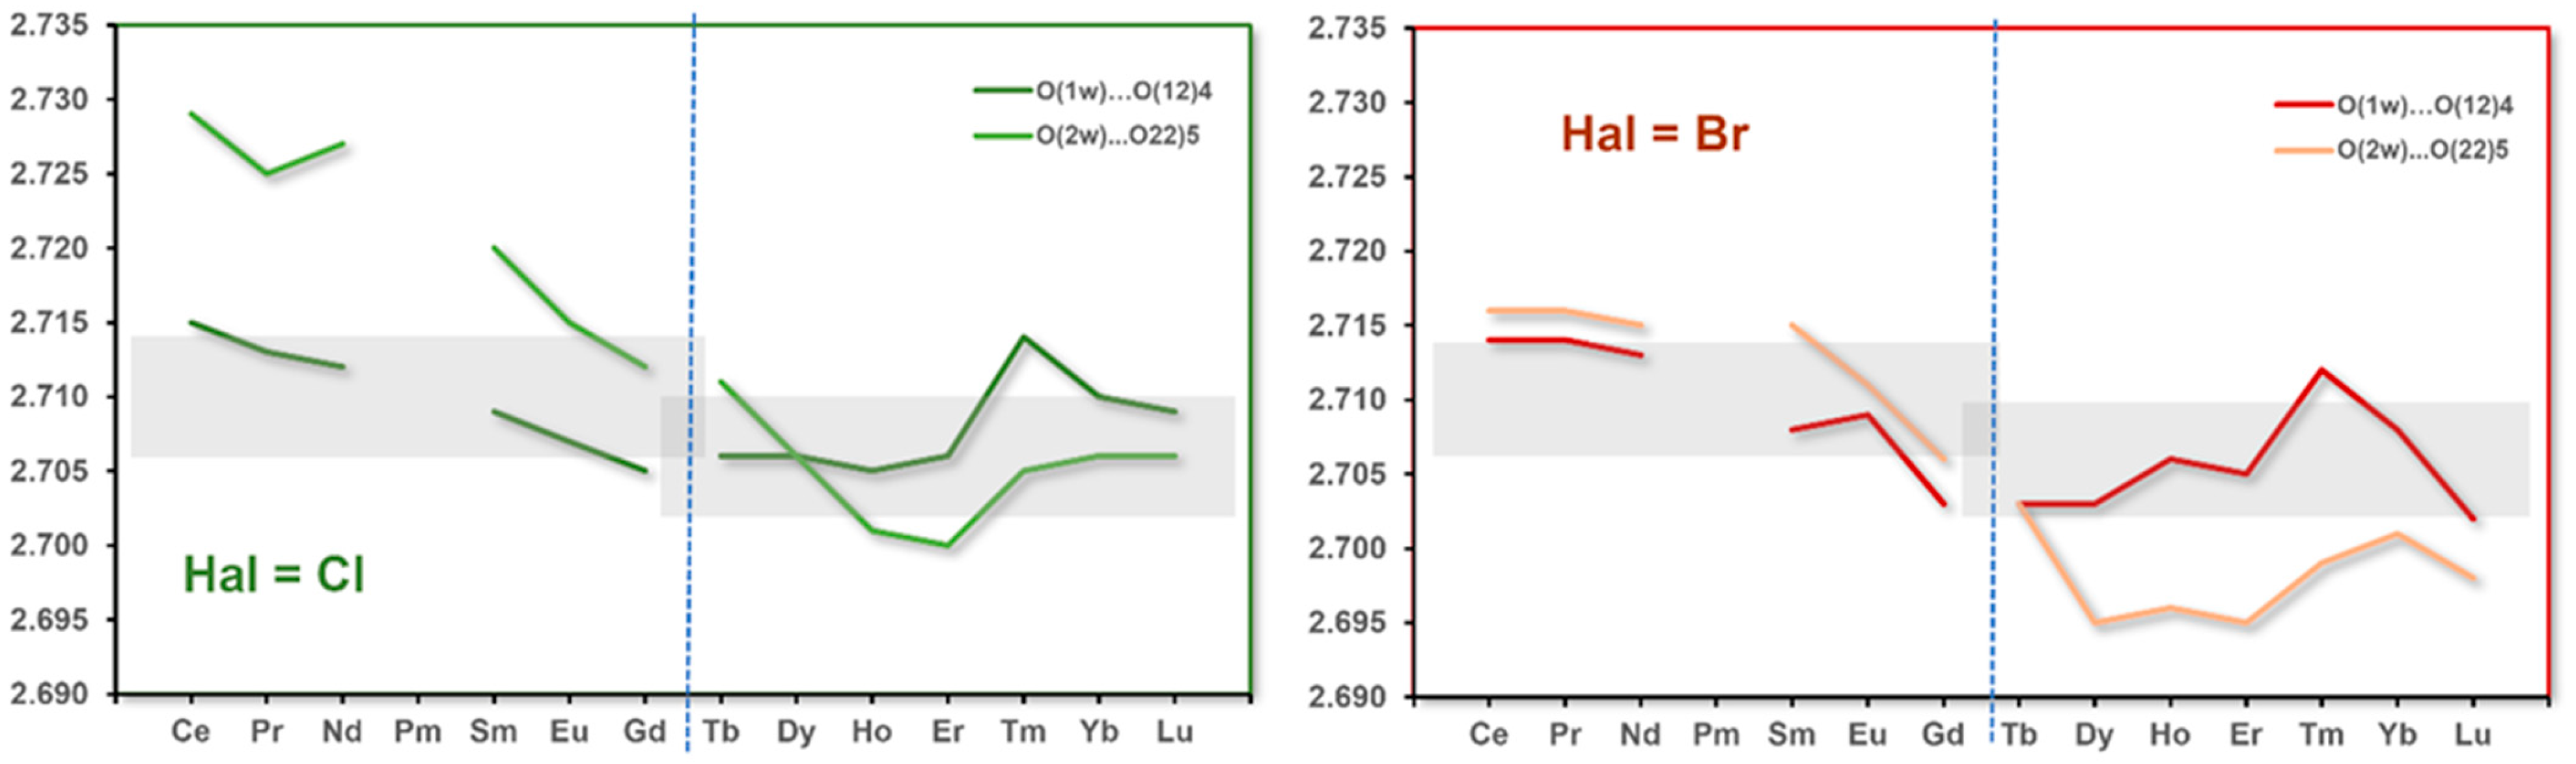
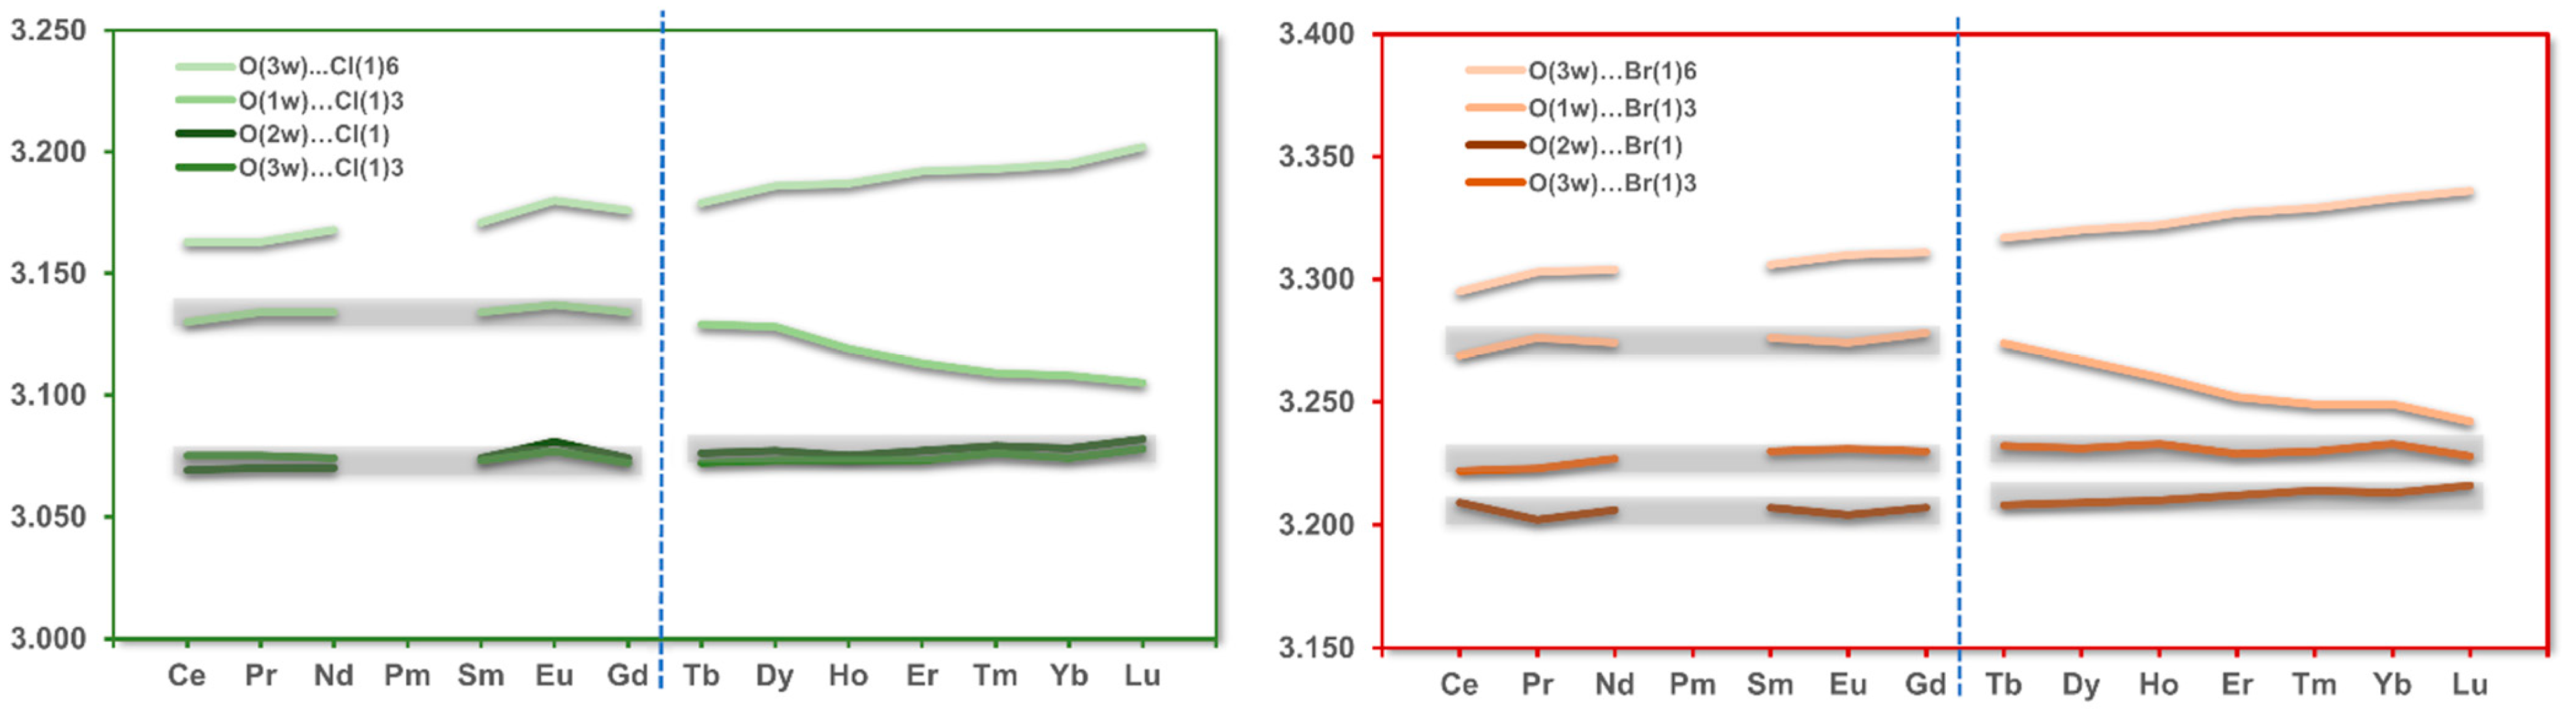
3.5. Hydrogen Bonds
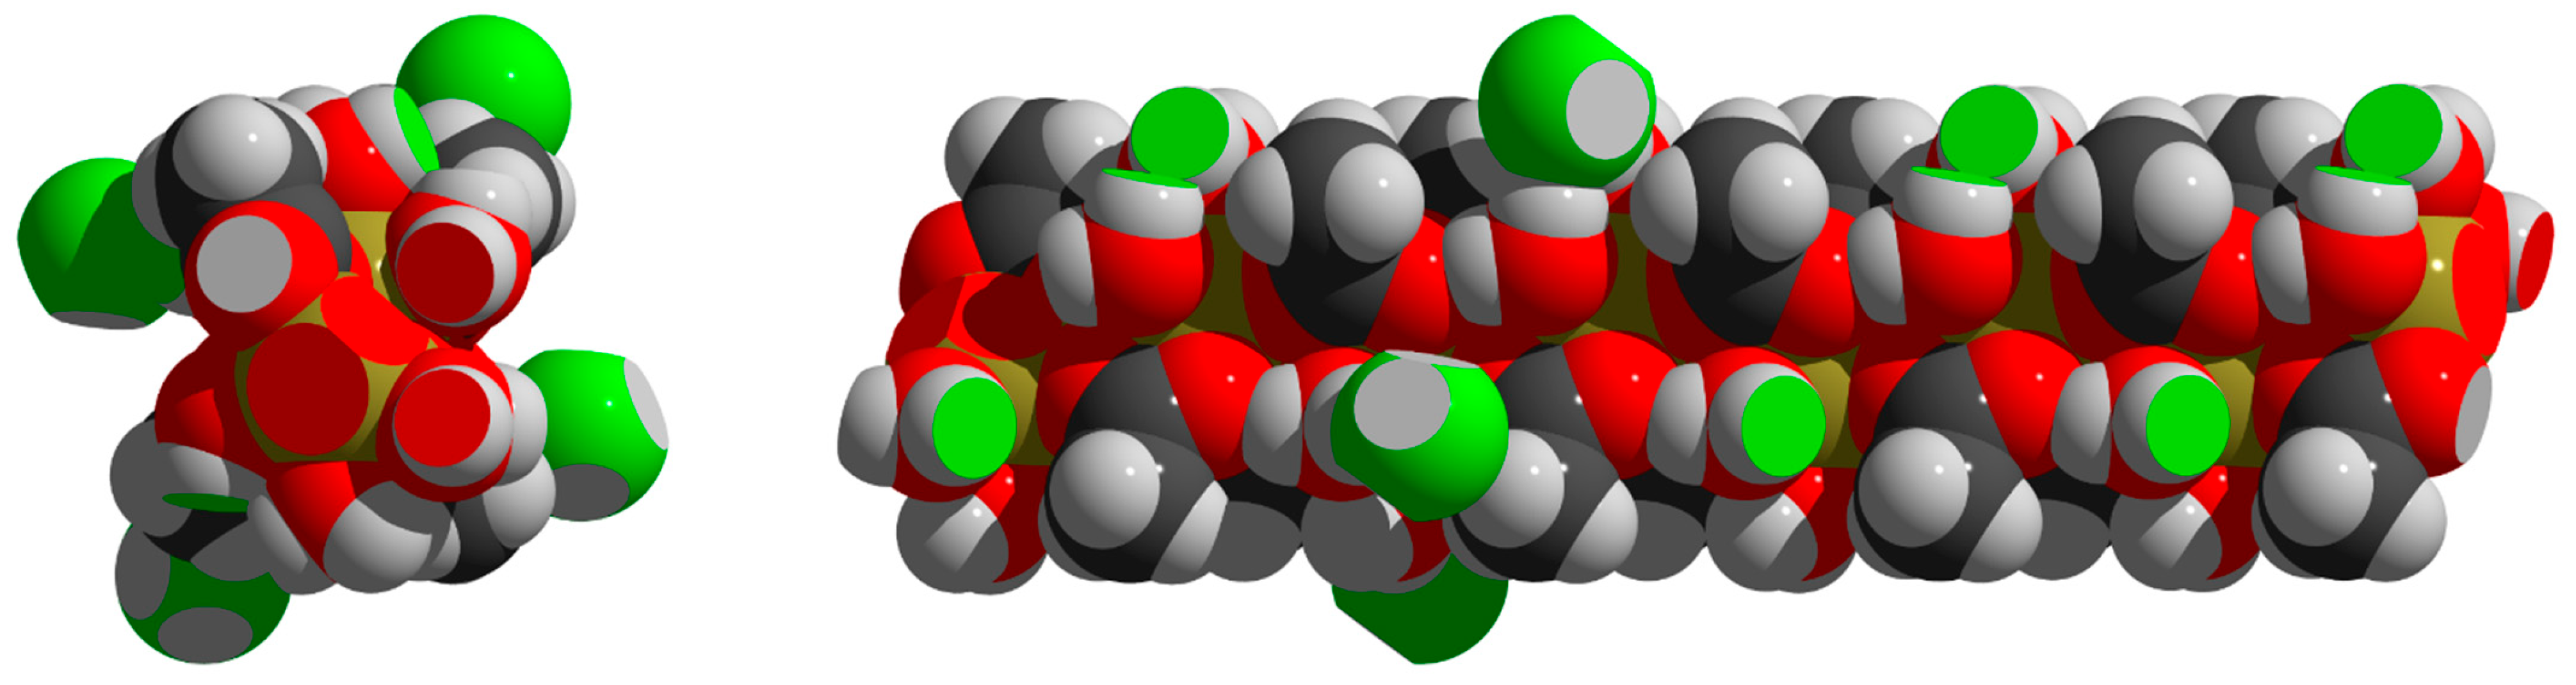
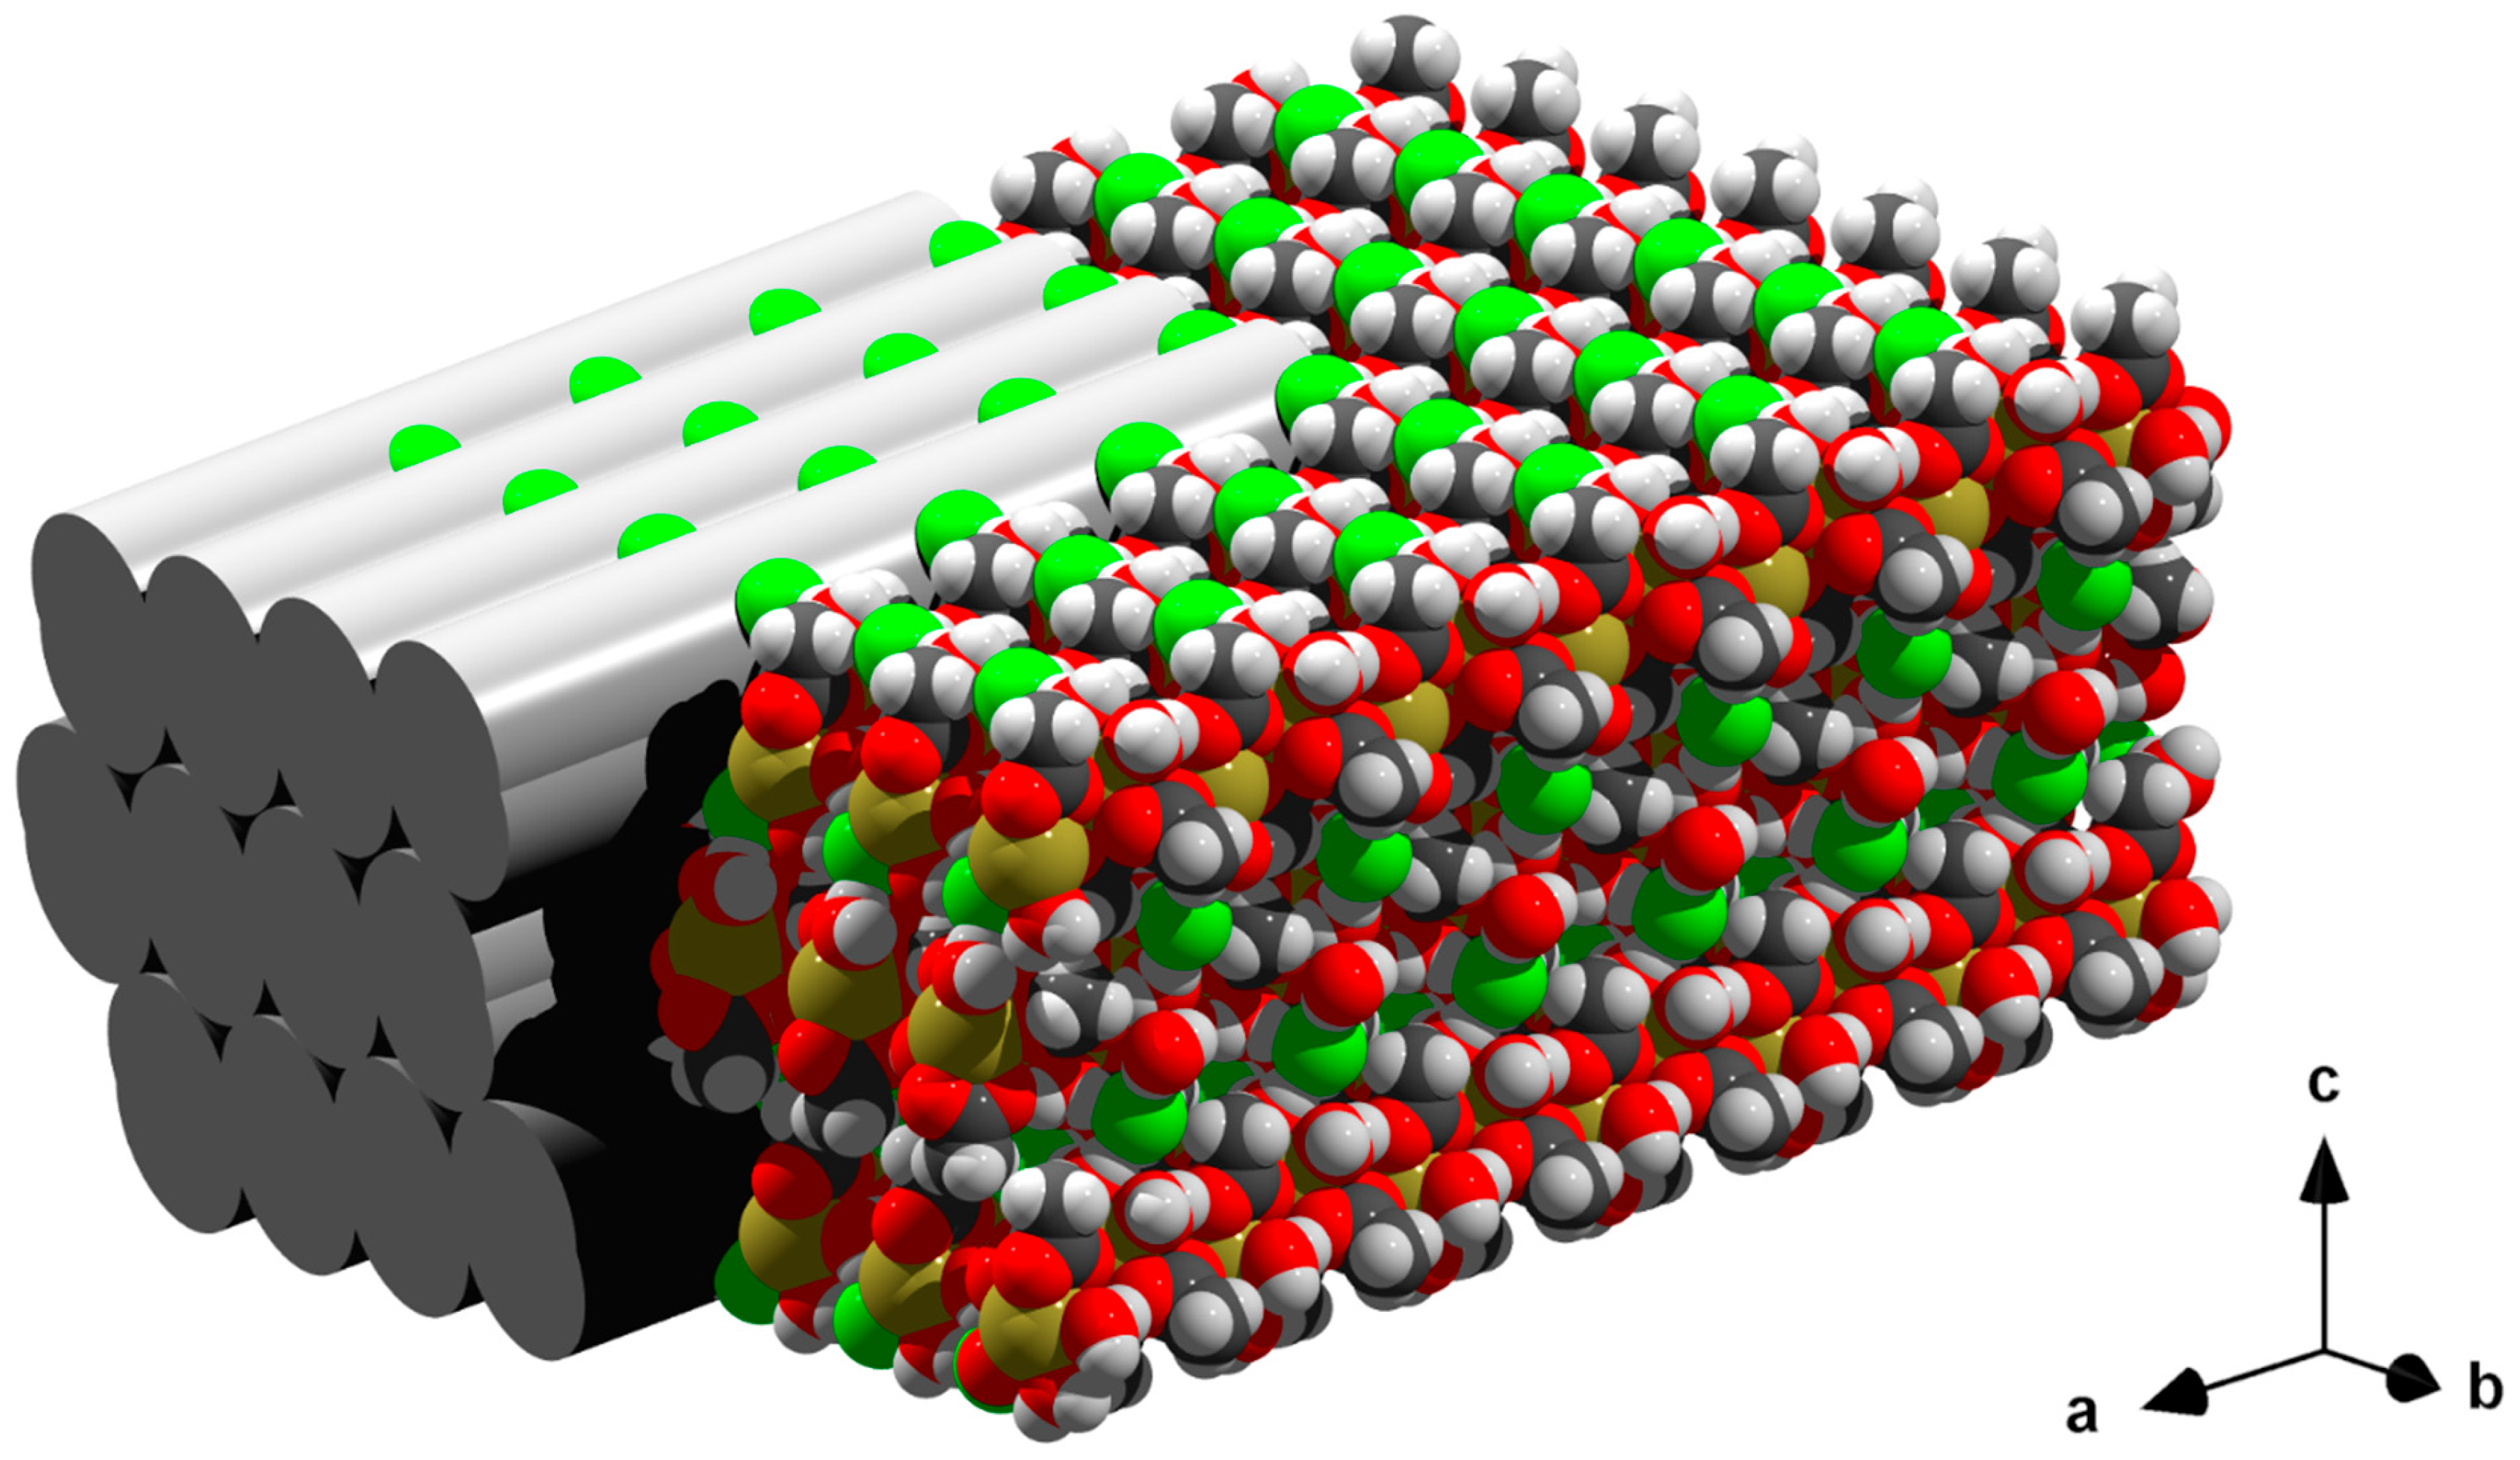
3.6. Packing
4. Conclusions
Supplementary Materials
Author Contributions
Funding
Institutional Review Board Statement
Informed Consent Statement
Data Availability Statement
Acknowledgments
Conflicts of Interest
References
- Holleman/Wiberg-Anorganische Chemie. Nebengruppenelemente, Lanthanoide, Actinoide, Transactinoide-Table V, 103rd ed.; Wiberg, N., Ed.; Walter de Gruyter: Berlin, Germany; Boston, MA, USA, 2016; Volume 2. [Google Scholar]
- Shannon, R.D. Revised Effective Ionic Radii and Systematic Studies of Interatomie Distances in Halides and Chalcogenides. Acta Cryst. 1976, A32, 751–767. [Google Scholar] [CrossRef]
- Gerkin, R.E.; Reppart, W.J. The structures of the lanthanide ethyl sulfate enneahydrates, M(C2H5SO4)3.9H2O [M = La -Lu (except Pm), at 171 K. Acta Cryst. 1984, C40, 781–786. [Google Scholar] [CrossRef]
- Chatterjee, A.; Maslen, E.N.; Watson, K.J. The Effect of Lanthanoid Contraction on the Nonaaqualanthanoid(III) Tris(trifluoromethanesulfonates). Acta Cryst. 1988, B44, 381–386. [Google Scholar] [CrossRef]
- Junk, P.C.; Kepert, C.J.; Wei-Min, L.; Skelton, B.W.; White, A.H. Structural Systematics of Rare Earth Complexes. X. (‘Maximally’) Hydrated Rare Earth Acetates. Austr. J. Chem. 1999, 52, 437–457. [Google Scholar] [CrossRef]
- Arias, J.L.; Cabrera, A.; Sharma, P.; Rosas, N.; Garcia, J.L.; Hernandez, S. Catalytic auto-condensation of 2,4-pentanedione promoted by Sm(III) acetylacetonate: The X-ray strcutre of a novel complex [Sm(CH3COO)3(H2O)2](H2O)2. Inorg. Chim. Acta 2000, 310, 261–264. [Google Scholar] [CrossRef]
- Yu, Q.; Zhou, X.; Liu, M.; Chen, J.; Zhou, Z.; Yin, X.; Cai, Y. Syntheses, characterization, and luminescence of two lanthanide complexes [Ln2(acetate)6(H2O)4]·4H2O (Ln = Tb(1), Sm(2)). J. Rare Earth 2008, 26, 178–184. [Google Scholar] [CrossRef]
- Lossin, A.; Meyer, G. Wasserfreie Selten-Erd-Acetate, M(CH3COO)3 (M = Sm-Lu, Y) mit Kettenstruktur. Kristallstrukturen von Lu(CH3COO)3 und Ho(CH3COO)3. Z. Anorg. Allg. Chem. 1993, 619, 1609–1615. [Google Scholar] [CrossRef]
- Lossin, A.; Meyer, G. Dimers and chains in lanthanide acetate-chloride hydrates [M(CH3COO)2(H2O)3]Cl (M = Ce-Lu, Y) and [M(CH3COO)(H2O)6]Cl2 H2O (M = La-Sm): A survey of their synthesis, crystal chemistry and thermal decomposition. J. Less Common Met. 1991, 175, 301–308. [Google Scholar] [CrossRef]
- Schleid, T.; Meyer, G. Synthese und Kristallstruktur von Europium(III)-diacetatotriaquo-chlorid, [Eu(CH3COO)2(H2O)3]Cl. Z. Naturforsch. 1989, 44b, 1007–1010. [Google Scholar] [CrossRef]
- Cesur, N.; Pantenburg, I.; Meyer, G. Crystal structure of catena-[triaqua-bis(acetato-O,O′)gadolinium(III)]chloride, [Gd(CH3COO)2(H2O)3Cl. Z. Kristallogr. New Cryst. Struct. 2005, 220, 631–632. [Google Scholar] [CrossRef]
- Chen, W.-T.; Luo, Z.-G.; Yao, Z.-L. Synthesis, crystal structure and fluorescense of an unusual terbium carboxylate. Acta Chim. Slov. 2012, 59, 949–953. [Google Scholar] [PubMed]
- Haase, M.; Rissiek, P.; Gather-Steckhan, M.; Henkel, F.; Reuter, H. Structural Evolution in the RE(OAc)3·2AcOH Structure Type. A Non-Linear, One-Dimensional Coordination Polymer with Unequal Interatomic Rare Earth Distances. Crystals 2021, 11, 768. [Google Scholar] [CrossRef]
- Sheldrick, G.M. A short history of SHELX. Acta Cryst. 2015, C71, 3–8. [Google Scholar] [CrossRef]
- Spek, A.L. checkCIF validation ALERTS: What they mean and how to respond. Acta Cryst. 2020, E76, 1–11. [Google Scholar] [CrossRef] [PubMed]
- Brandenburg, K. Diamond-Crystal and Molecular Visualization; Crystal Impact: Bonn, Germany, 2006. [Google Scholar]
- Macrae, C.F.; Bruno, I.J.; Chisholm, J.A.; Edgington, P.R.; McCabe, P.; Pidcock, E.; Rodriquez-Monge, L.; Taylor, R.; van de Streek, J.; Wood, P.A. Mercury CSD 2.0-new features for the visualization and investigation of crystal structures. Appl. Crystallogr. 2008, 41, 466–470. [Google Scholar] [CrossRef]
- POV-Ray: The Persistence of Vision Retracer; Pty. Ltd.: Victoria, Australia, 2004.
- Jordan, R.B. Lanthanide Contraction: What is Normal? Inorg. Chem. 2023, 62, 3715–3721. [Google Scholar] [CrossRef] [PubMed]
- Coxall, R.A.; Harris, S.G.; Hernderson, D.K.; Parsons, S.; Takser, P.A.; Winpenny, E.P. Inter-ligand reactions: In situ formation of new polydentate ligands. J. Chem. Soc. Dalton Trans. 2000, 2349–2356. [Google Scholar] [CrossRef]


| Ce | Pr | Nd | Pm | Sm | Eu | Gd | Tb | Dy | Ho | Er | Tm | Yb | Lu | |
|---|---|---|---|---|---|---|---|---|---|---|---|---|---|---|
| Empirical formula | C4H23CeClO7 | C4H12ClO7Pr | C4H12ClNdO7 | C4H12ClO7Sm | C4H12ClEuO7 | C4H12ClGdO7 | C4H12ClO7Tb | C4H12ClDyO7 | C4H12ClHoO7 | C4H12ClErO7 | C4H12ClO7Tm | C4H12ClO7Yb | C4H12ClLuO7 | |
| Formula weight [g/mol] | 347.71 | 348.50 | 351.83 | 357.94 | 359.55 | 364.84 | 366.51 | 370.09 | 372.52 | 374.85 | 376.52 | 380.63 | 382.56 | |
| Temperature [K] | 100(2) | 100(2) | ||||||||||||
| Crystal system | monoclinic | Monoclinic | ||||||||||||
| Space group | P 21/n | P 21/n | ||||||||||||
| a [Å] | 7.9625(3) | 7.9333(3) | 7.9059(3) | 7.8503(3) | 7.8412(2) | 7.8219(4) | 7.8003(2) | 7.8106(4) | 7.7993(3) | 7.7927(3) | 7.7747(2) | 7.7710(3) | 7.7668(3) | |
| b [Å] | 7.9276(3) | 7.9139(3) | 7.9008(3) | 7.8844(3) | 7.8769(2) | 7.8592(4) | 7.8539(2) | 7.8433(4) | 7.8345(3) | 7.8301(5) | 7.8392(2) | 7.8224(3) | 7.8297(3) | |
| b [Å] | 17.6973(6) | 17.6327(6) | 17.5852(7) | 17.5192(6) | 17.4901(5) | 17.4434(8) | 17.3942(5) | 17.3400(8) | 17.2564(7) | 17.1904(7) | 17.1517(5) | 17.1055(8) | 17.0618(7) | |
| β | 99.122(2)° | 98.947 | 98.856(2) | 98.483(2) | 98.354(1)° | 98.265(2) | 98.075(2)° | 97.978(2)° | 97.881(2)° | 97.695(2) | 97.552(1) | 97.422(2) | 97.336(2) | |
| Volume [Å3] | 1102.99(7) | 1093.57(7) | 1085.33(7) | 1072.49(7) | 1068.80(5) | 1061.18(9) | 1055.05(5) | 1051.98(9) | 1044.47(7) | 1039.47(7) | 1036.28(5) | 1031.09(7) | 1029.06(7) | |
| Z,Z′,dcalc [g/mol] | 4, 1, 2.094 | 4, 1, 2.117 | 4, 1, 2.153 | 4, 1, 2.217 | 4, 1, 2.234 | 4, 1, 2.284 | 4, 1, 2.307 | 4, 1, 2.337 | 4, 1, 2.369 | 4, 1, 2.395 | 4, 1, 2.413 | 4, 1, 2.452 | 4, 1, 2.469 | |
| μ [mm−1] | 4.373 | 4.703 | 5.034 | 5.728 | 6.122 | 6.509 | 6.960 | 7.361 | 7.835 | 8.335 | 8.823 | 9.333 | 9.857 | |
| F(000) | 668 | 672 | 676 | 684 | 688 | 692 | 696 | 700 | 704 | 708 | 712 | 716 | 720 | |
| 2Ѳmax | 56° | 56° | ||||||||||||
| Reflections collected | 101277 | 125986 | 122829 | 130814 | 79828 | 122742 | 126109 | 49237 | 133421 | 93.617 | 108715 | 70583 | 100183 | |
| Reflections unique, Rint | 2664, 0.0460 | 2645, 0.0398 | 2621, 0.0566 | 2595, 0.0344 | 2587, 0.0399 | 2569, 0.0358 | 2551, 0.0517 | 2547, 0.0328 | 2528, 0.0358 | 2514, 0.0305 | 2504, 0.0397 | 2491, 0.0721 | 2490, 0.0653 | |
| Data/restraints/parameters | 2664/0/125 | 2645/0/125 | 2621/0/125 | 2595/0/126 | 2587/0/125 | 2569/0/126 | 2551/0/125 | 2547/0/126 | 2528/0/126 | 2514/0/126 | 2504/0/125 | 2491/0/125 | 2490/0/125 | |
| Goodness of fito n F2 | 1.224 | 1.101 | 1.062 | 1.133 | 1.094 | 1.090 | 1.054 | 1.184 | 1.176 | 1.409 | 1.132 | 1.061 | 1.034 | |
| R1/wR2 [I > 2σ(I)] | 0.0177, 0.0355 | 0.0125, 0.0280 | 0.0122, 0.0270 | 0.0101, 0.0233 | 0.0131, 0.0327 | 0.0094, 0.0206 | 0.0108, 0.0245 | 0.0127, 0.0266 | 0.0103, 0.0234 | 0.0135, 0.0292 | 0.0108, 0.0240 | 0.0162, 0.0302 | 0.0119, 0.0264 | |
| R1/wR2 [all data] | 0.0186, 0.0358 | 0.0134, 0.0283 | 0.0142, 0.0275 | 0.0105, 0.0235 | 0.0137, 0.0330 | 0.0100, 0.0208 | 0.0131, 0.0253 | 0.0131, 0.0267 | 0.0106, 0.0235 | 0.0135, 0.0292 | 0.0113, 0.0241 | 0.0217, 0.0318 | 0.0143, 0.0269 | |
| Extinction coefficient | N/A | 0.00104(8) | N/A | 0.00122(7) | N/A | 0.0045(1) | 0.00185(8) | 0.00115(9) | N/A | |||||
| ±∆e[eÅ−3] | 0.532/−0.811 | 0.457/−0.609 | 0.387/−0.358 | 0.381/−0.528 | 0.470/−0.703 | 0.348/−0.474 | 0.486/−0.392 | 0.489/−0.652 | 0.364/−0.436 | 0.524/−0.603 | 0.386/−0.579 | 0.522/−0.480 | 0.365/−0.421 | |
| CCDC number | 2260824 | 2260831 | 2260827 | 2260830 | 2260822 | 2260828 | 2260829 | 2260820 | 2260832 | 2260823 | 2260825 | 2260821 | 2206826 | |
| Ce | Pr | Nd | Pm | Sm | Eu | Gd | Tb | Dy | Ho | Er | Tm | Yb | Lu | |
|---|---|---|---|---|---|---|---|---|---|---|---|---|---|---|
| Empirical formula | C4H23BrCeO7 | C4H12BrO7Pr | C4H12BrNdO7 | C4H12BrO7Sm | C4H12BrEuO7 | C4H12BrGdO7 | C4H12BrO7Tb | C4H12BrDyO7 | C4H12BrHoO7 | C4H12BrErO7 | C4H12BrO7Tm | C4H12BrO7Yb | C4H12BrLuO7 | |
| Formula weight [g/mol] | 392.17 | 392.96 | 396.29 | 402.40 | 404.01 | 409.30 | 410.97 | 414.55 | 416.98 | 419.31 | 420.98 | 425.09 | 427.02 | |
| Temperature [K] | 100(2) | 100(2) | ||||||||||||
| Crystal system | monoclinic | Monoclinic | ||||||||||||
| Space group | P 21/n | P 21/n | ||||||||||||
| a [Å] | 7.9597(3) | 7.9293(3) | 7.9027(3) | 7.8473(3) | 7.8318(3) | 7.8191(2) | 7.7972(3) | 7.8038(3) | 7.8117(3) | 7.8069(3) | 7.7868(5) | 7.7854(3) | 7.7611(3) | |
| b [Å] | 8.0442(3) | 8.0327(3) | 8.0349(3) | 8.0230(3) | 8.0121(3) | 8.0130(2) | 8.0263(3) | 8.0288(3) | 8.0361(4) | 8.0529(3) | 8.0675(5) | 8.0625(3) | 8.0702(3) | |
| b [Å] | 18.0642(8) | 18.0186(6) | 17.9481(6) | 17.8722(7) | 17.8214(7) | 17.7804(6) | 17.7443(8) | 17.6550(7) | 17.5440(9) | 17.4494(7) | 17.3994(7) | 17.3573(7) | 17.2952(6) | |
| β | 96.732(2)° | 96.533(2)° | 96.414(2)° | ° | 95.987(2)° | 95.972(2)° | 95.929(2)° | 95.862(2)° | 96.034(2)° | 96.096(3)° | 96.154(2)° | 96.154(2)° | 96.142(29)° | 96.098(2)° |
| Volume [Å3] | 1148.67(8) | 1140.22(7) | 1132.52(7) | 1119.08(7) | 1112.21(7) | 1108.06(5) | 1104.68(8) | 1100.05(7) | 1095.11(9) | 1090.69(7) | 1086.73(11) | 1083.26(7) | 1077.13(7) | |
| Z,Z′,dcalc [g/mol] | 4, 1, 2.268 | 4, 1, 2.289 | 4, 1, 2.324 | 4, 1, 2.388 | 4, 1, 2.413 | 4, 1, 2.453 | 4, 1, 2.471 | 4, 1, 2.503 | 4, 1, 2.529 | 4, 1, 2.544 | 4, 1, 2.573 | 4, 1, 2.606 | 4, 1, 2.633 | |
| μ [mm−1] | 7.446 | 7.781 | 8.117 | 8.822 | 9.236 | 9.595 | 10.023 | 10.429 | 10.878 | 11.362 | 11.845 | 12.326 | 12.879 | |
| F(000) | 740 | 744 | 748 | 756 | 760 | 764 | 768 | 772 | 776 | 780 | 784 | 788 | 792 | |
| 2Ѳmax | 56° | 56° | ||||||||||||
| Reflections collected | 113305 | 92529 | 132337 | 1113760 | 118192 | 132199 | 124829 | 101683 | 102663 | 121.468 | 112602 | 120213 | 103545 | |
| Reflections unique, Rint | 2770, 0.0572 | 2753, 0.0497 | 2735, 0.0553 | 2708, 0.0701 | 2696, 0.0516 | 2690, 0.0410 | 2683, 0.0459 | 2666, 0.0444 | 2655, 0.0734 | 2636, 0.0413 | 2626, 0.0488 | 2616, 0.0460 | 2596, 0.0753 | |
| Data/restraints/parameters | 2770/0/125 | 2753/0/125 | 2735/0/125 | 2708/0/125 | 2696/0/125 | 2690/0/125 | 2683/0/125 | 2666/0/126 | 2655/0/125 | 2636/0/126 | 2626/0/125 | 2616/0/125 | 2596/0/125 | |
| Goodness of fito n F2 | 1.071 | 1.078 | 1.051 | 1.084 | 1.100 | 1.134 | 1.122 | 1.118 | 1.049 | 1.182 | 1.083 | 1.073 | 1.054 | |
| R1/wR2 [I>2σ(I)] | 0.0142, 0.0310 | 0.0141, 0.0295 | 0.0129, 0.0300 | 0.0150, 0.0305 | 0.0131, 0.0300 | 0.0155, 0.0403 | 0.0133, 0.0301 | 0.0129, 0.0321 | 0.148, 0.0336 | 0.0114, 0.0253 | 0.0118, 0.0265 | 0.0121, 0.0261 | 0.0184, 0.0417 | |
| R1/wR2 [all data] | 0.0173, 0.0321 | 0.0175, 0.0305 | 0.0154, 0.0307 | 0.0201, 0.0321 | 0.0157, 0.0309 | 0.0168, 0.0410 | 0.0151, 0.0306 | 0.0140, 0.0325 | 0.196, 0.0353 | 0.0123, 0.0255 | 0.0141, 0.0272 | 0.0141, 0.0266 | 0.0233, 0.0437 | |
| Extinction coefficient | N/A | N/A | 0.00126(9) | N/A | 0.00082(5) | N/A | ||||||||
| ±∆e[eÅ−3] | 0.368/−0.374 | 0.441/−0.499 | 0.402/−0.415 | 0.442/−0.443 | 0.408/−0.408 | 0.695/−0.977 | 0.554/−0.407 | 0.779/−0.601 | 0.508/−0.579 | 0.364/−0.467 | 0.383/−0.226 | 0.4607/−0.581 | 1.131/−1.209 | |
| CCDC number | 2261207 | 2261199 | 2261203 | 2261208 | 2261206 | 2261205 | 2261209 | 2261200 | 2261198 | 2261201 | 2261202 | 2261204 | 2261210 | |
| RE | Ce | Pr | Nd | Pm | Sm | Eu | Gd | Tb | Dy | Ho | Er | Tm | Yb | Lu |
|---|---|---|---|---|---|---|---|---|---|---|---|---|---|---|
| Hal = Cl | ||||||||||||||
| RE(1)-O(11) | 2.422(2) | 2.404(1) | 2.390(1) | 2.351(1) | 2.341(1) | 2.325(1) | 2.294(1) | 2.274(1) | 2.252(1) | 2.232(2) | 2.218(1) | 2.201(2) | 2.193(1) | |
| RE(1)-O(21) | 2.440(2) | 2.422(1) | 2.406(1) | 2.373(1) | 2.362(1) | 2.346(1) | 2.323(1) | 2.312(1) | 2.295(1) | 2.280(2) | 2.265(1) | 2.246(2) | 2.239(1) | |
| RE(1)-O(2W) | 2.486(2) | 2.468(1) | 2.452(1) | 2.421(1) | 2.407(1) | 2.393(1) | 2.403(1) | 2.361(2) | 2.345(1) | 2.331(2) | 2.320(1) | 2.312(2) | 2.302(2) | |
| RE(1)-O(3W) | 2.499(2) | 2.482(1) | 2.467(1) | 2.438(1) | 2.427(1) | 2.418(1) | 2.403(1) | 2.392(1) | 2.381(1) | 2.372(2) | 2.360(1) | 2.347(2) | 2.346(2) | |
| RE(1)-O(1W) | 2.524(2) | 2.506(1) | 2.487(1) | 2.457(1) | 2.444(1) | 2.425(1) | 2.404(1) | 2.388(1) | 2.367(1) | 2.346(2) | 2.339(1) | 2.320(2) | 2.309(2) | |
| RE(1)-O(12) 1 | 2.536(2) | 2.516(1) | 2.498(1) | 2.462(1) | 2.450(1) | 2.436(1) | 2.413(1) | 2.396(2) | 2.378(1) | 2.362(2) | 2.346(1) | 2.334(2) | 2.327(2) | |
| RE(1)-O(22) 2 | 2.548(2) | 2.529(1) | 2.510(1) | 2.475(1) | 2.462(1) | 2.449(1) | 2.428(1) | 2.416(1) | 2.400(1) | 2.386(2) | 2.373(1) | 2.359(2) | 2.358(2) | |
| RE(1)-O(21) 2 | 2.665(2) | 2.648(1) | 2.633(1) | 2.620(1) | 2.613(1) | 2.607(1) | 2.612(1) | 2.604(1) | 2.596(1) | 2.588(2) | 2.592(1) | 2.601(2) | 2.585(2) | |
| RE(1)-O(11) 1 | 2.738(2) | 2.725(1) | 2.706(1) | 2.723(1) | 2.728(1) | 2.740(1) | 2.820(1) | 2.905(2) | 2.991(1) | 3.083(2) | 3.128(2) | 3.178(2) | 3.211(2) | |
| Hal = Br | ||||||||||||||
| RE(1)-O(11) | 2.417(1) | 2.401(1) | 2.388(1) | 2.349(2) | 2.338(1) | 2.324(2) | 2.294(2) | 2.269(1) | 2.248(2) | 2.229(1) | 2.216(2) | 2.201(2) | 2.188(2) | |
| RE(1)-O(21) | 2.431(1) | 2.416(1) | 2.403(1) | 2.370(2) | 2.356(1) | 2.343(2) | 2.322(1) | 2.307(1) | 2.294(2) | 2.280(1) | 2.266(1) | 2.251(1) | 2.238(2) | |
| RE(1)-O(2W) | 2.489(1) | 2.471(1) | 2.457(1) | 2.425(2) | 2.409(2) | 2.398(2) | 2.381(2) | 2.365(1) | 2.346(2) | 2.338(1) | 2.325(2) | 2.316(2) | 2.305(2) | |
| RE(1)-O(3W) | 2.490(2) | 2.476(1) | 2.461(1) | 2.431(2) | 2.420(2) | 2.412(2) | 2.398(2) | 2.386(2) | 2.366(2) | 2.347(2) | 2.353(2) | 2.344(2) | 2.338(2) | |
| RE(1)-O(1W) | 2.526(1) | 2.504(1) | 2.490(1) | 2.459(2) | 2.442(2) | 2.426(2) | 2.405(2) | 2.389(1) | 2.373(2) | 2.360(2) | 2.336(2) | 2.322(2) | 2.306(2) | |
| RE(1)-O(12) 1 | 2.536(1) | 2.516(2) | 2.499(1) | 2.466(2) | 2.450(2) | 2.439(2) | 2.417(2) | 2.395(2) | 2.376(2) | 2.365(2) | 2.342(2) | 2.333(3) | 2.323(2) | |
| RE(1)-O(22) 2 | 2.539(1) | 2.527(1) | 2.504(1) | 2.471(2) | 2.459(2) | 2.447(2) | 2.429(2) | 2.412(2) | 2.395(2) | 2.382(1) | 2.368(2) | 2.358(2) | 2.350(2) | |
| RE(1)-O(21) 2 | 2.666(1) | 2.652(1) | 2.632(1) | 2.623(2) | 2.615(1) | 2.608(2) | 2.612(2) | 2.603(1) | 2.591(2) | 2.582(1) | 2.587(2) | 2.594(2) | 2.577(2) | |
| RE(1)-O(11) 1 | 2.746(1) | 2.730(1) | 2.711(1) | 2.722(2) | 2.720(2) | 2.733(2) | 2.808(2) | 2.917(2) | 3.026(2) | 3.129(2) | 3.165(2) | 3.213(2) | 3.238(2) | |
Disclaimer/Publisher’s Note: The statements, opinions and data contained in all publications are solely those of the individual author(s) and contributor(s) and not of MDPI and/or the editor(s). MDPI and/or the editor(s) disclaim responsibility for any injury to people or property resulting from any ideas, methods, instructions or products referred to in the content. |
© 2023 by the authors. Licensee MDPI, Basel, Switzerland. This article is an open access article distributed under the terms and conditions of the Creative Commons Attribution (CC BY) license (https://creativecommons.org/licenses/by/4.0/).
Share and Cite
Reuter, H.; Böltken, M.; Horstmann, M.; Haase, M. Structural Evolution in a Series of Isomorphous Rare Earth Compounds as Response of Lanthanide Contraction. Crystals 2023, 13, 1043. https://doi.org/10.3390/cryst13071043
Reuter H, Böltken M, Horstmann M, Haase M. Structural Evolution in a Series of Isomorphous Rare Earth Compounds as Response of Lanthanide Contraction. Crystals. 2023; 13(7):1043. https://doi.org/10.3390/cryst13071043
Chicago/Turabian StyleReuter, Hans, Marcel Böltken, Maik Horstmann, and Markus Haase. 2023. "Structural Evolution in a Series of Isomorphous Rare Earth Compounds as Response of Lanthanide Contraction" Crystals 13, no. 7: 1043. https://doi.org/10.3390/cryst13071043
APA StyleReuter, H., Böltken, M., Horstmann, M., & Haase, M. (2023). Structural Evolution in a Series of Isomorphous Rare Earth Compounds as Response of Lanthanide Contraction. Crystals, 13(7), 1043. https://doi.org/10.3390/cryst13071043