Article

Kinetics and Mechanism of BaLaCuS3 Oxidation

by
Nikita O. Azarapin
1,
Nikolay A. Khritokhin
1,
Victor V. Atuchin
2,3,4,5,*,
Alexey A. Gubin
6,
Maxim S. Molokeev
7,8,9,
Shaibal Mukherjee
10,11,12 and
Oleg V. Andreev
1,13
1
Department of Inorganic and Physical Chemistry, Tyumen State University, Tyumen 625003, Russia
2
Laboratory of Optical Materials and Structures, Institute of Semiconductor Physics, Siberian Branch of the Russian Academy of Sciences, Novosibirsk 630090, Russia
3
Research and Development Department, Kemerovo State University, Kemerovo 650000, Russia
4
Department of Industrial Machinery Design, Novosibirsk State Technical University, Novosibirsk 630073, Russia
5
R&D Center “Advanced Electronic Technologies”, Tomsk State University, Tomsk 634034, Russia
6
Laboratory for Nanomaterials and Nanoelectronics, Center for Nature-Inspired Engineering, Technology Park, Tyumen State University, Tyumen 625003, Russia
7
Laboratory of Crystal Physics, Kirensky Institute of Physics, Federal Research Center KSC SB RAS, Krasnoyarsk 660036, Russia
8
Laboratory of Theory and Optimization of Chemical and Technological Processes, University of Tyumen, Tyumen 625003, Russia
9
Institute of Engineering Physics and Radioelectronics, Siberian Federal University, Krasnoyarsk 660041, Russia
10
Hybrid Nanodevice Research Group (HNRG), Department of Electrical Engineering, Indian Institute of Technology Indore, Indore 453552, India
11
Centre for Advanced Electronics (CAE), Indian Institute of Technology Indore, Indore 453552, India
12
School of Engineering, RMIT University, Melbourne, VIC 3001, Australia
13
Institute of Solid State Chemistry, UB RAS, Yekaterinburg 620990, Russia
*
Author to whom correspondence should be addressed.
Crystals 2023, 13(6), 903; https://doi.org/10.3390/cryst13060903
Submission received: 26 April 2023 / Revised: 24 May 2023 / Accepted: 26 May 2023 / Published: 1 June 2023

Abstract

:
The oxidation reactions of BaLaCuS3 in the artificial air atmosphere were studied at different heating rates in the temperature range of 50–1200 °C. The oxidation stages were determined by DSC-TG, XRD and IR–vis methods. The kinetic characteristics of the proceeding reactions were obtained with the use of the Kissinger model in a linearized form. Compound BaLaCuS3 was stable in the air up to 280 °C. Upon further heating up to 1200 °C, this complex sulfide underwent three main oxidation stages. The first stage is the formation of BaSO4 and CuLaS2. The second stage is the oxidation of CuLaS2 to La2O2SO4 and copper oxides. The third stage is the destruction of La2O2SO4. The final result of the high-temperature treatment in the artificial air atmosphere was a mixture of barium sulfate, copper (II) oxide and La2CuO4. The mechanism and stages of BaLaCuS3 oxidation and further interactions of the components were discussed.

1. Introduction

It is known that artificial non-oxide compounds produced for the use in the green energy technology, modern electronics and optics and thin chemistry technologies often contain heavy metals and chemical elements toxic to humans and the environment [1,2,3,4,5,6,7,8,9]. The products of their transformation/degradation induced by the contact with the chemically active air components and temperature variation may be dangerous. Generally, the chemical stability of such compounds in the air atmosphere is among the main factors that determine their mass production, consumption and durability. However, it is a common situation that only scarce information is available in the literature concerning the behavior of any selected crystalline material in the air environment at ambient conditions or on heating [7,10,11,12,13,14,15,16,17,18,19,20]. However, in these studies, only very initial stages of the chemical interaction of chalcogenide crystals or films with air components were considered, as it is needed for the semiconductor technology or optical surface preparation. The deep material degradation mechanisms, including thermal effects and chemical transformations, remain practically unknown. In this regard, complex chalcogenide materials are of particular interest because a continuous oxidation due to chemical interaction with oxygen can be reasonably assumed even at normal conditions, and it can be activated at higher temperatures.
Complex chalcogenide compounds typically belong to semiconductor materials and have a number of valuable properties regarding their use in optical systems and electronic technologies [3,5,6,7,12,15]. Presently, Cu-containing sulfides and selenides are considered to be promising compounds for the use in solar energy technologies, and it arouses a general interest in the crystal chemistry and properties of complex Cu chalcogenides, including the search for new materials [5,21,22,23,24,25,26,27,28]. In particular, chalcogenide compounds with generalized composition ABCX3, where A—alkaline-earth metal, B—d- or f-element, C—other d-element, X—chalcogenide, can be considered. These compounds are valuable due to their diverse optical, magnetic and semiconductor properties [24,29,30,31,32,33,34]. The oxidation of the ABCuX3 substances has not been studied. However, fragmentary information is available concerning the oxidation of related simple chalcogenides. For example, the multi-step oxidation of EuS to Eu2O2S was studied in [35]. In the works on synthesis and investigation of properties of selected Ln2O2S compounds, including those obtained from Ln2S3, a relative stability of the Ln2O2S crystals was reported [36,37,38]. Cu2S and CuS are stable, and these sulfides were found in nature in the form of minerals Chalcozine and Covelline with some variations in their composition [39,40]. As is well known, Cu2S and CuS can be converted to CuO/Cu2O oxides upon the oxidation reaction and evaporation of the gas fraction of sulfur oxides [41,42,43,44]. The oxidation of barium-containing sulfides with the formation of mineral barite (BaSO4) was earlier considered in biological and geochemical processes [45,46].
The present study is aimed at the detailed evaluation of the oxidation process of BaLaCuS3, a representative member of the ABCuX3 family, when this compound is in contact with the air at higher temperatures. The BaLaCuS3 powder is synthesized by the sulfidation reaction. Then, the thermal effects in the oxidation reactions in the artificial air are evaluated in the temperature range from 50 to 1200 °C. The phase composition of the intermediate and final products is determined by the X-ray diffraction analysis.

2. Materials and Synthesis

BaLaCuS3 was prepared in the powder form by the sulfidation of oxide mixture obtained by the thermal decomposition of metal nitrate solution. The following reagents were used as starting materials: Cu (99.9%, SZB Tsvetmet, Tobolsk, Russia), BaCO3 (99.99%, ultrapure, KAI YONG, Nanzhong, China), La2O3 (99.99%, ultrapure, TDM-96 Ltd., Yekaterinburg, Russia), concentrated nitric acid (99%, pure, Vekton Ltd., St. Petersburg, Russia) and ammonium rhodanide NH4SCN (98%, Vekton Ltd., St. Petersburg, Russia). First, Cu, BaCO3 and La2O3 were weighted according to the nominal molar ratio 1:1:1. Then, the reagents were dissolved in nitric acid. In the next step, the solution was slowly evaporated to make a solid nitrate mixture. After this, the nitrate mixture was decomposed at 900 °C to reach a stoichiometric oxide batch. A more detailed method description of the technological steps can be found elsewhere [24].
The synthesis of BaLaCuS3 was performed by the sulfidation of the oxide mixture at temperatures above 1000 °C in the atmosphere of a mixture of argon and sulfidizing gases. The vertical quartz beaker with a lateral gas venting was used as a reactor. The sulfidizing gas mixture was obtained by passing the argon flow through boiling ammonium rhodanide at 200 °C. The sulfidizing gases were fed directly into the oxide mixture through a quartz tube. A water trap was installed at the quartz reactor gas outlet to avoid the atmospheric air poisoning. The gas flow rate was fixed at the level of ~0.8 L·min−1. The synthesized oxide batch was inserted into an open graphite crucible. Then, the graphite crucible was inserted into the reactor and heated in the inductive loop of the DD-2511 high-frequency induction heater (Shenzhen Dongda Industrial Co., Shenzhen, China). The high-frequency current unit was calibrated for a graphite crucible with the height of 50 mm, outer diameter of 30 mm and wall thickness of 3 mm. The graduation was carried out by a visual detection of the transition to the melt of metals with the well-known melting point (Ag, Cu, Ni). The crucible temperature during the reaction of sulfidation was ~1150–1200 °C. At the end of the synthesis, the heating of ammonium thiocyanate was stopped and the induction heater was turned off. The sample was cooled to room temperature in an argon flow for about 20 min.
The oxidation of BaLaCuS3 was carried out in the artificial air flow in the temperature range of 50–1200 °C on a thermal analysis unit STA 449 F5 Jupiter. Five different heating rates in the range from 1 to 20 °C/min were used in the experiment. The original Netzsch corundum crucibles for DSC analysis with a volume of 85 μL and a diameter of 6.8 mm were used. The weight of the sample for oxidization averaged 60 ± 0.5 mg. To ensure repeatability, sample weights were initially taken on the Analytical Balance ME204/A (METTLER TOLEDO, Columbus, OH, USA). For accuracy, the weighing was performed directly in the crucible. After weighing, the sample was not distributed and pressed in the crucible so as not to reduce the contact area with the air and to avoid spreading the sample from the crucible during the gas escape.
Oxidation was performed in a gas flow of 20 mL/min, and the furnace was cooled down at 10 mL/min to room temperature. After cooling of the furnace, the sample was poured into an agate mortar, crushed and analyzed by XRD.

3. Characterization

The powder diffraction data of BaLaCuS3 for Rietveld analysis were collected at room temperature with a Bruker D8 ADVANCE powder diffractometer (Cu-Kα radiation) and linear VANTEC detector. In the characterization of the synthesized BaLaCuS3 phase, the 2θ step size was fixed at 0.006°. In the characterization of the intermediate products obtained by oxidation, the 2θ step size was 0.025°. The counting time was 2 s per step for all analyses.
The simultaneous thermal analysis was performed in the O2/Ar (99.999%, Russia) flow with the use of a STA 449 F5 Jupiter (Netzsch, Selb, Germany) instrument equipped with a Pt-PtRh thermocouple. Before measurements, the thermocouple was calibrated using the Netzsch standard kits, which included samples of In, Sn, Bi, Zn, Al, Ag, Au and Ni. The analyzed powder sample was (50–100) ± 0.01 mg in its weight. The results of the DSK/TG experiments were processed in the Proteus-6 software package [47]. The possible error in the phase transition enthalpy determination was ±2%. The possible error in determining the mass loss was established by the test DSC/TG measurements carried out for the compounds of precisely known composition: CuSO4 × 5H2O, ZnSO4 × 7H2O and RE2(SO4)3 × 8H2O [48]. In the mass loss determination, the possible error level was as low as 0.3%.
The IR spectra were recorded on an FSM 1201 FTIR spectrometer (Infraspek, Saint Petersburg, Russia) at the spectral resolution of 0.1 cm−1. The disk-shaped samples were fabricated by pressing a mixture of BaLaCuS3 and calcined KBr at the mass ratio of 1:100. The reflection spectra were recorded with the use of a Shimadzu UV-3600 (Shimadzu, Kyoto, Japan) spectrophotometer over the spectral range of 185–3300 nm. The particle micromorphology was observed by scanning electron microscopy (SEM) using a TESCAN MIRA3 LMU-EDS (Tescan, Brno, Czech Republic) device with an EDX device (Oxford instruments, Oxford, UK).
The specific surface area and pore space parameters of the BaLaCuS3 sample after synthesis were estimated by the N2 adsorption–desorption isotherms at 77 K on an ASAP 2020 Micrometrics equipment. Before measuring adsorption, the sample was degassed at 400 in a 1 mmHg vacuum to remove moisture. The Branauer–Emmett–Teller (BET) method was used to measure the surface area. The total pore volume was estimated from the adsorbed nitrogen volume at P/Po of about 0.99. The average pore size was determined by the Barrett–Joyner–Haland method (BJM) over a thickness range of 1.7 to 300 nm. The micropore volume was determined by the t-plot method.

4. Results and Discussion

The photo of the synthesized product is shown in Figure 1a. As a result of the sulfidation reaction, the uniform brick-color powder sample was obtained. The recorded XRD pattern is presented in Figure 1b. All peaks were successfully indexed by the orthorhombic unit cell (space group Pnma) with parameters close to those previously reported for BaLaCuS3 (Figure S1 see Supplementary Materials) [29]. Therefore, this structure was taken as a starting model for Rietveld refinement which was performed using the TOPAS 4.2 package [49]. The refinement was stable and yielded low R-factors (Table 1, Figure 1b). The atom coordinates and the main bond lengths determined for the powder BaLaCuS3 sample are given in Table S1 and Table S2, respectively.
The optical diffuse reflection spectrum recorded for the BaLaCuS3 sample is shown in Figure 2. As it is seen, the fundamental absorption is evident at the wavelengths shorter than ~500 nm. The optical bandgap determined with the use of the Kubelka–Munk algorithm [24,27,50] is equal to 2.04 eV for direct transitions, and it is close to the value of 2.00 eV earlier reported for the single-crystal BaLaCuS3 sample in [29]. In addition, the DFT calculation implemented for BaLaCuS3 in [33] also yielded the band gap width of 2.00 eV. Thus, it is verified that a single-phase BaLaCuS3 powder sample was obtained in the present work.
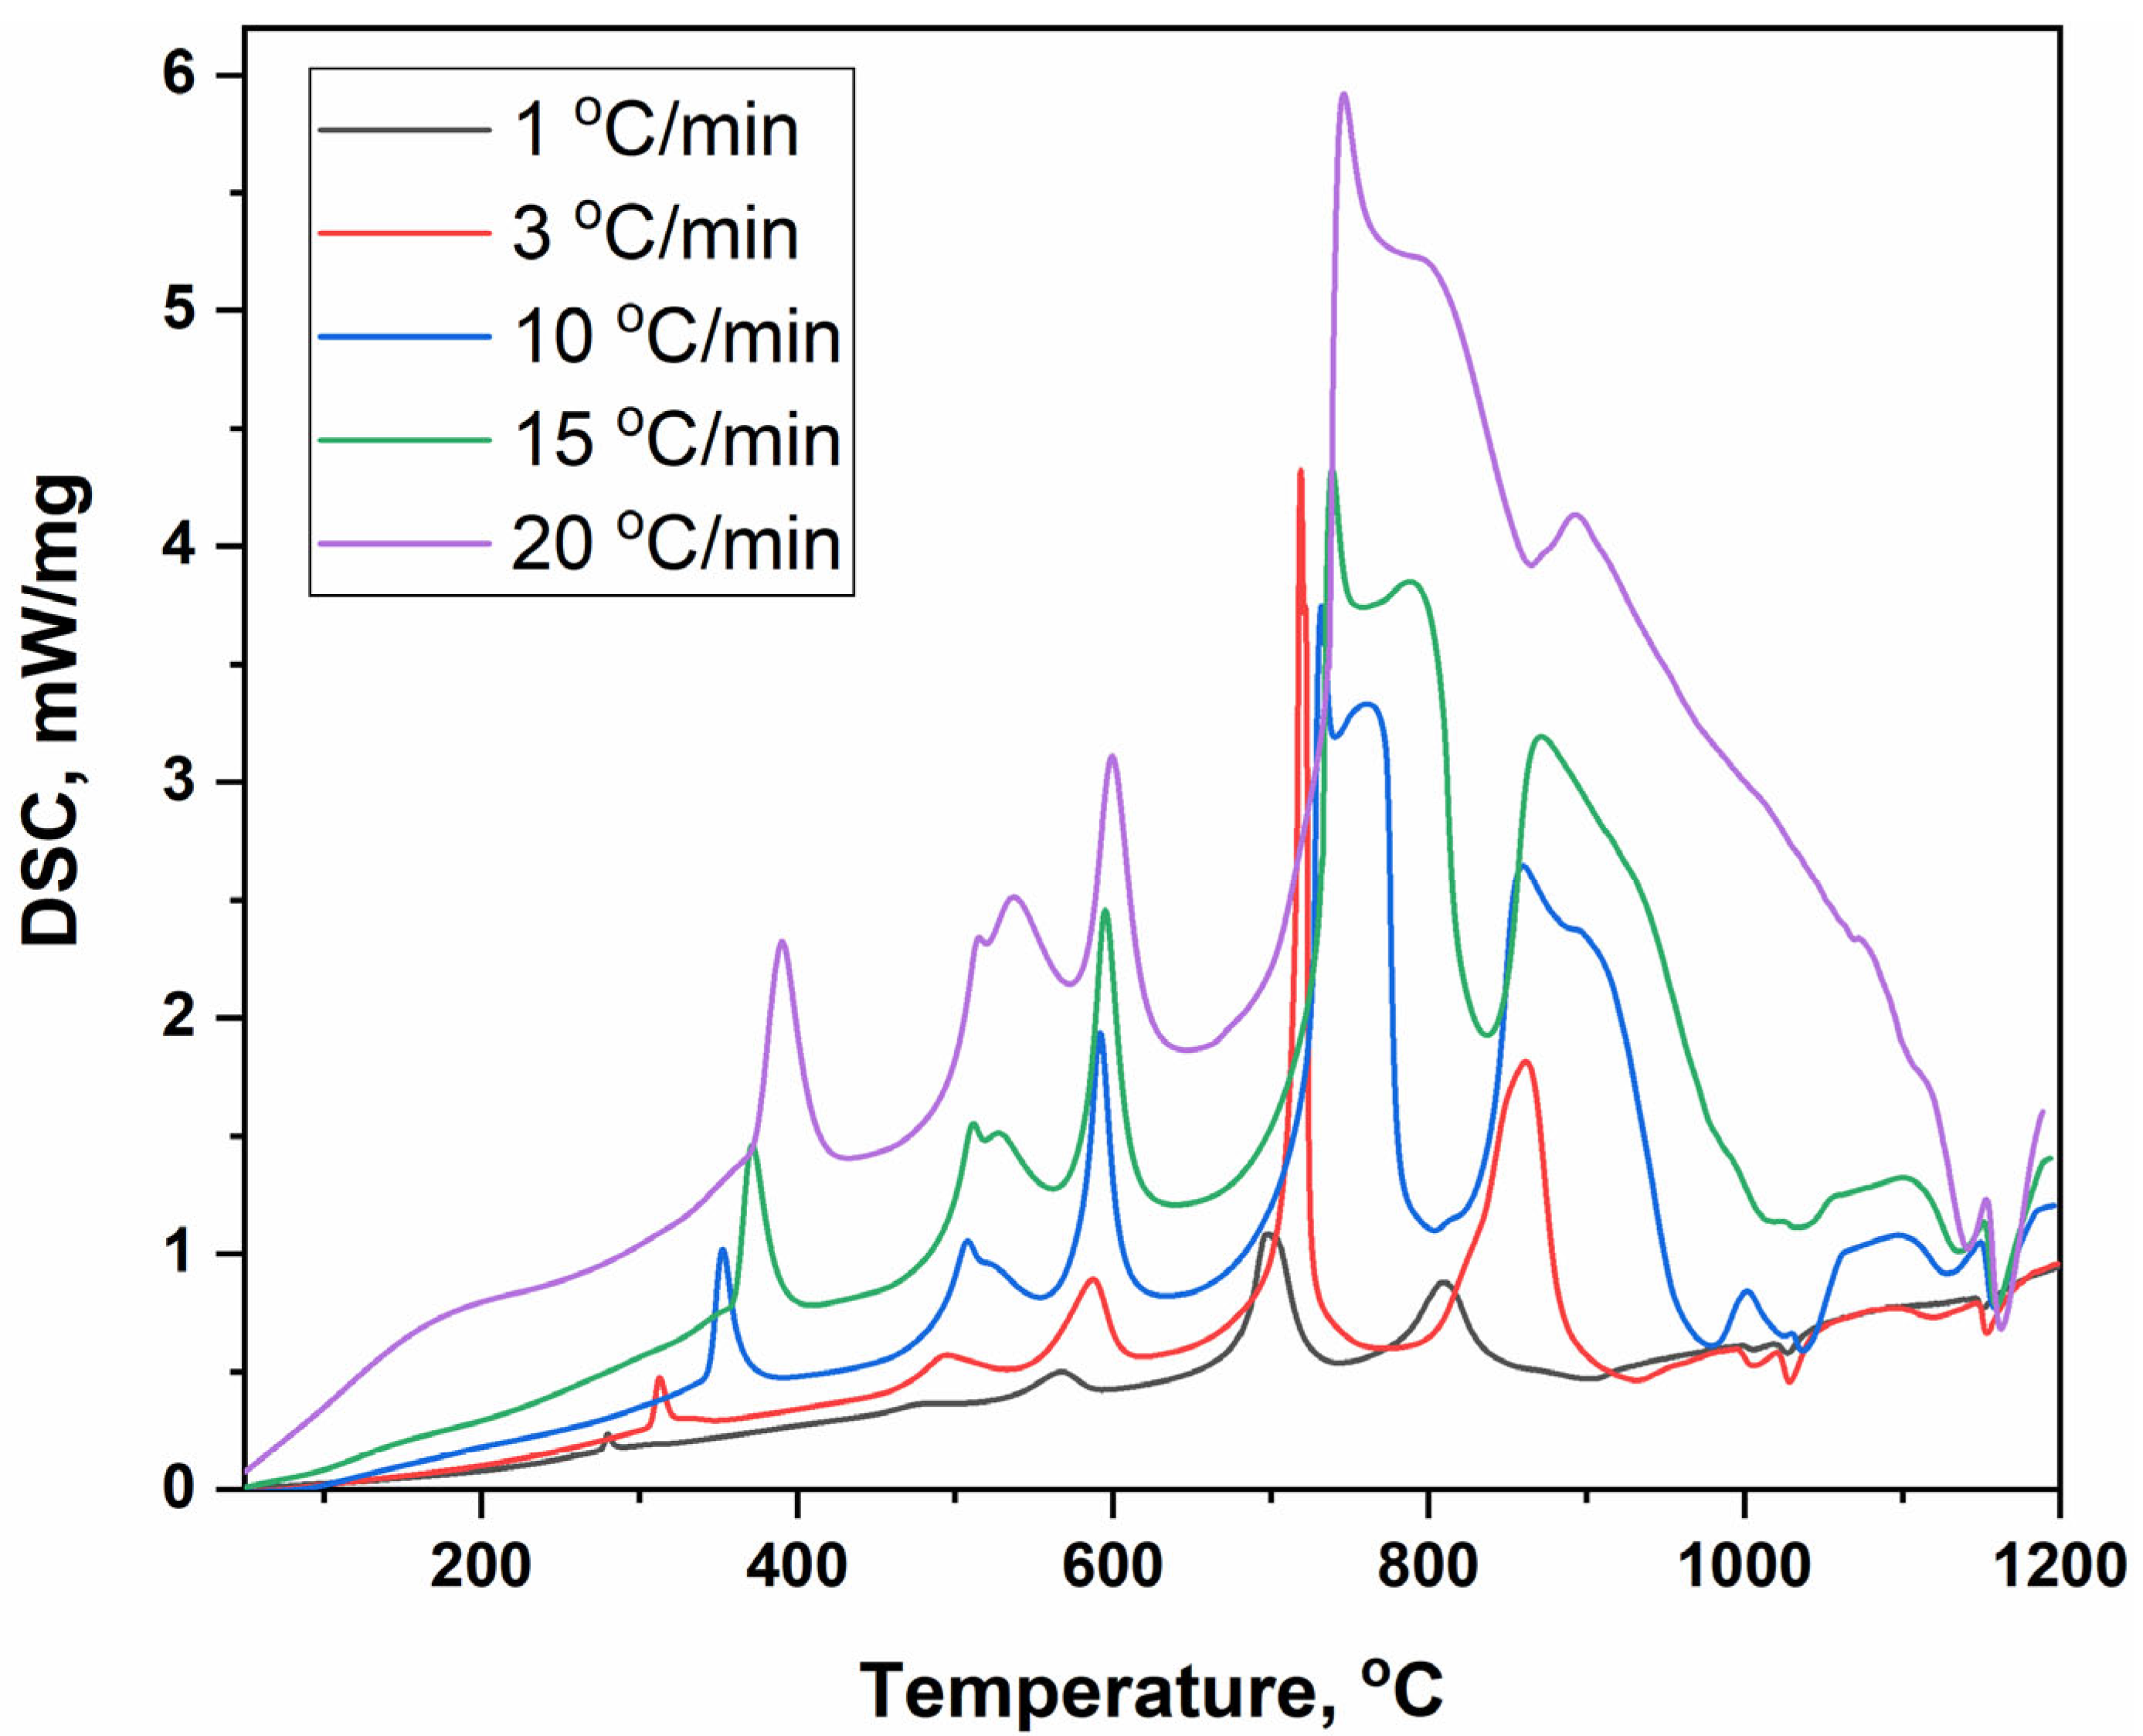
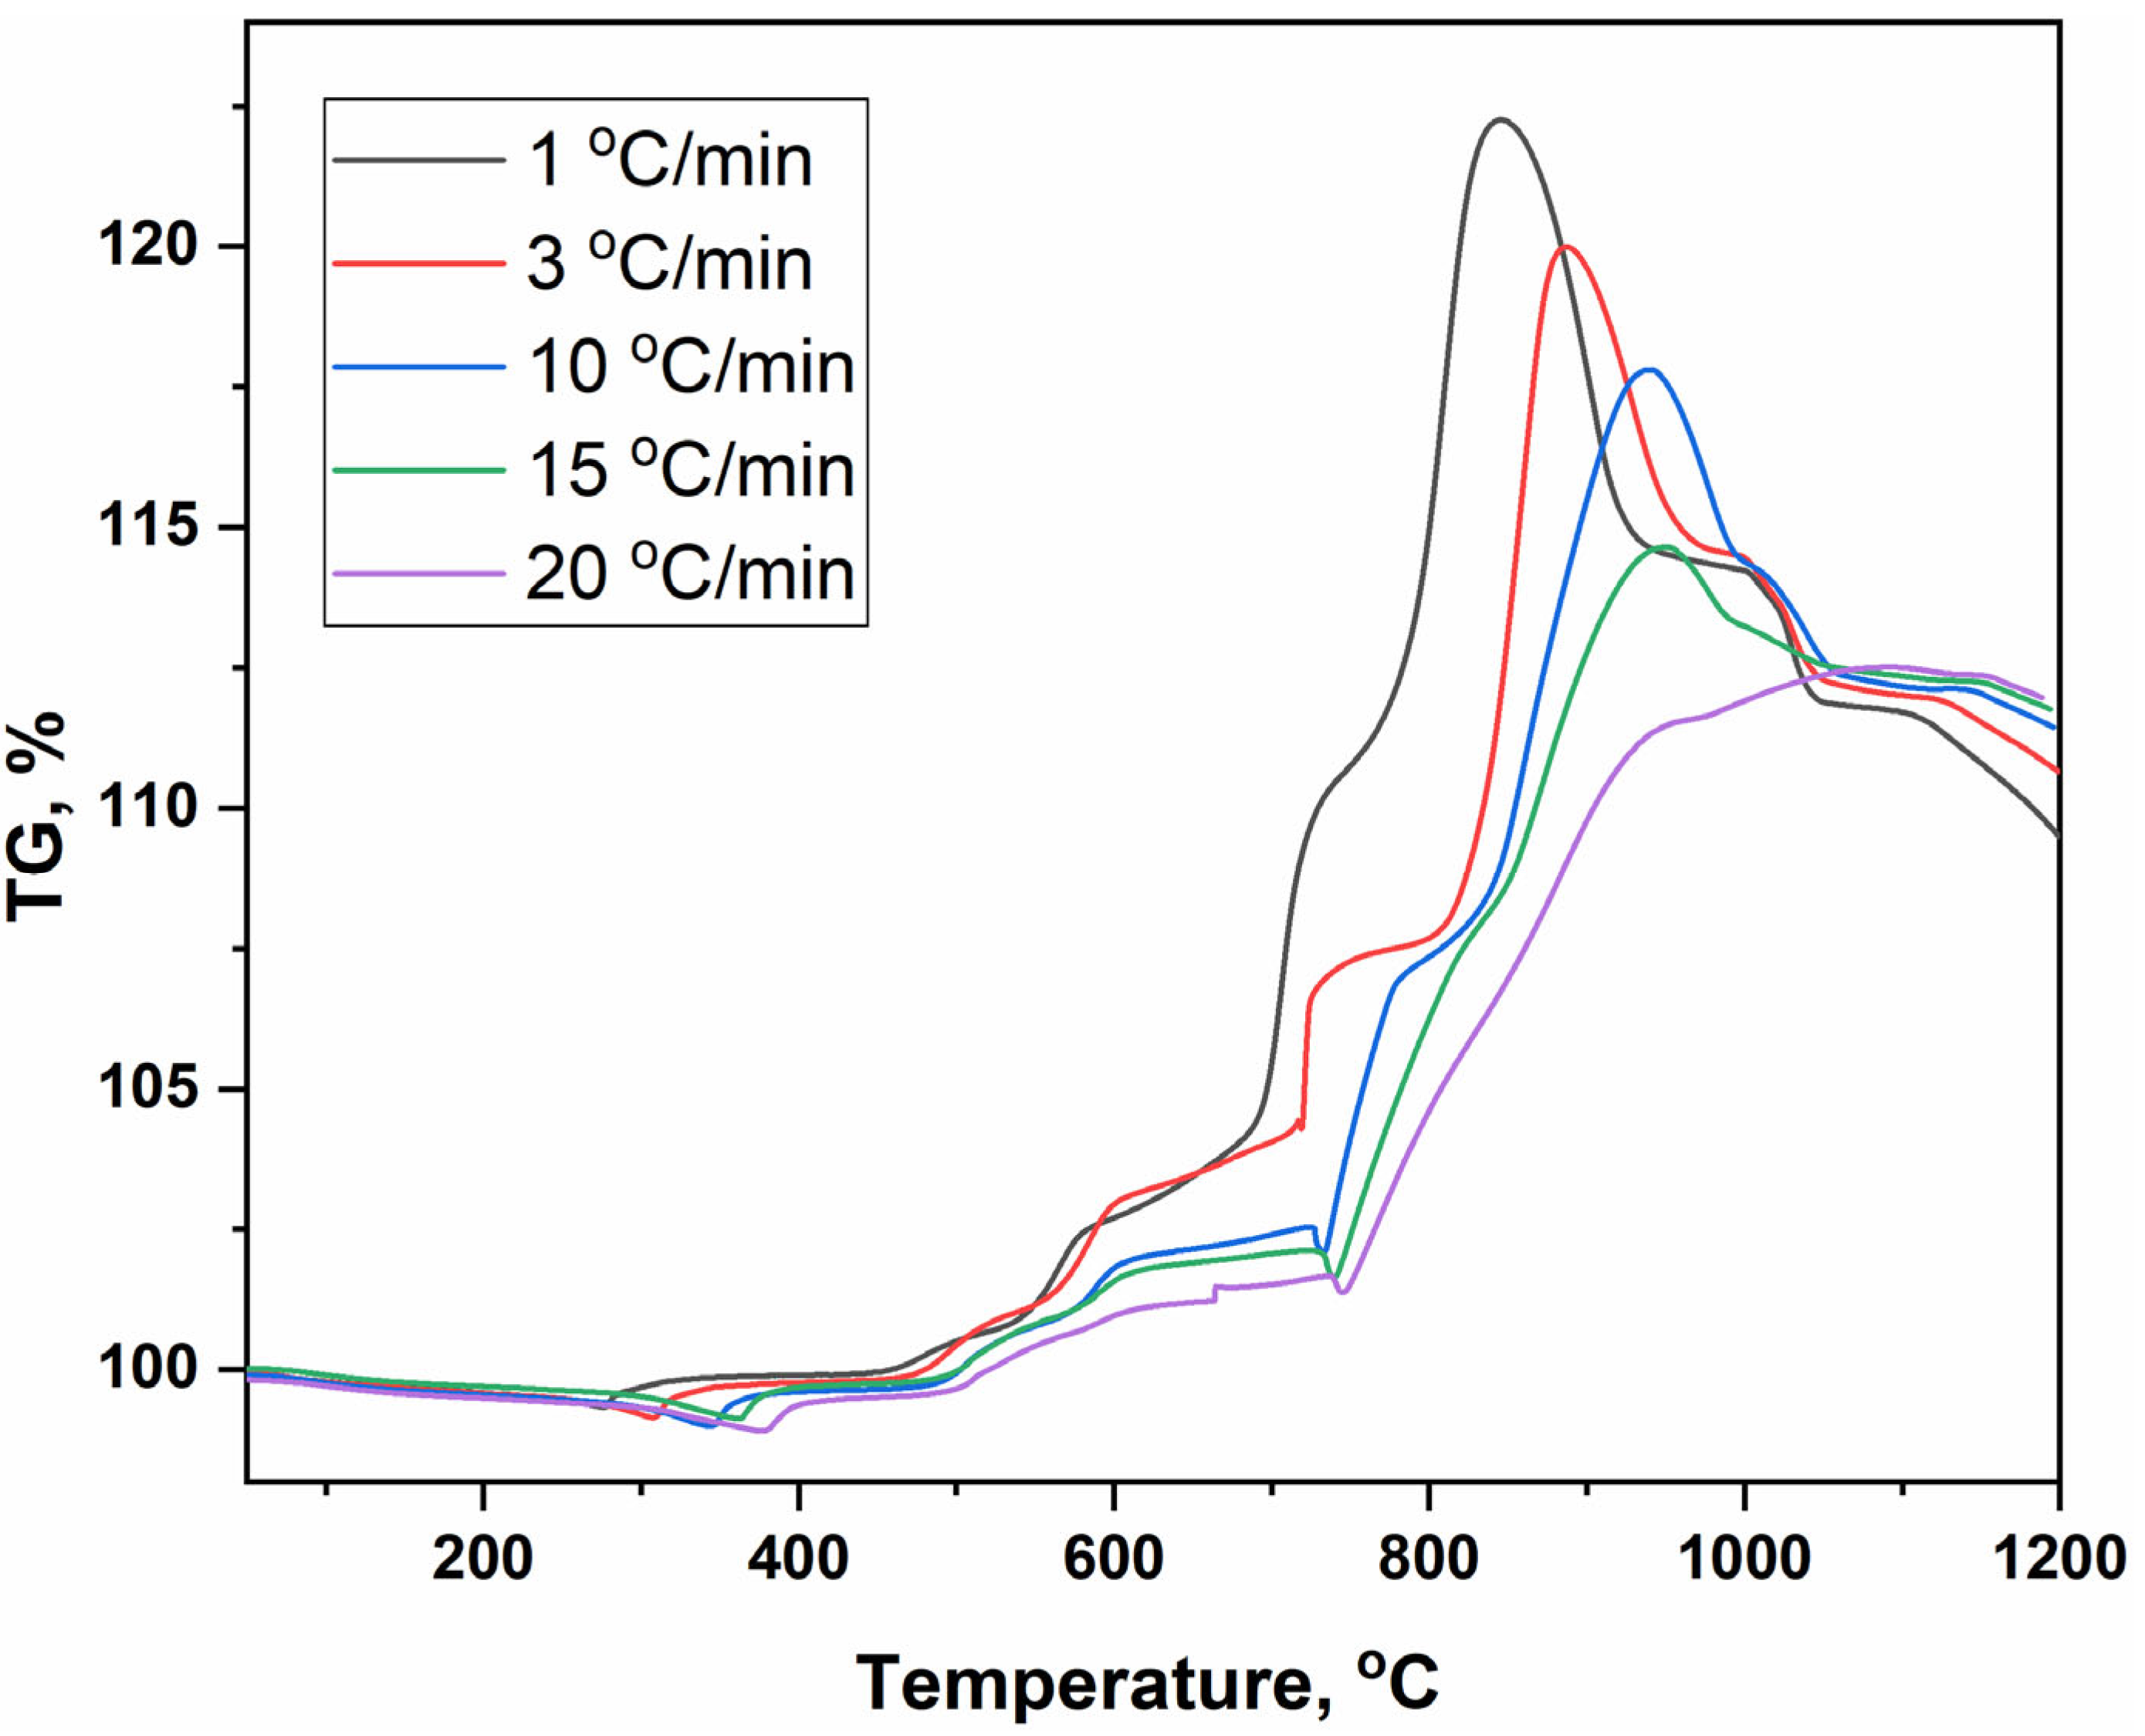
In the oxidation experiments, DSC (Figure 3) and TG (Figure 4) curves were obtained with a set of different thermal effects. As it is evident, the number and, in several cases, the temperature position of the thermal effects are significantly dependent on the heating rate. The kinetic parameters of the oxidation stages were calculated from the DSC data obtained at different heating rates (1, 3, 10, 15 and 20 °C/min). The kinetic characteristics were determined by the Kissinger model in the linearized form [51]:
1 T = 1 E · R l n b T 2 + R E l n A R E ,
where T is the temperature (K) at which the process speed is maximal, b is the heating rate (K/s), E is the activation energy and A is the pre-exponential multiplier. The results are listed in Table 2.
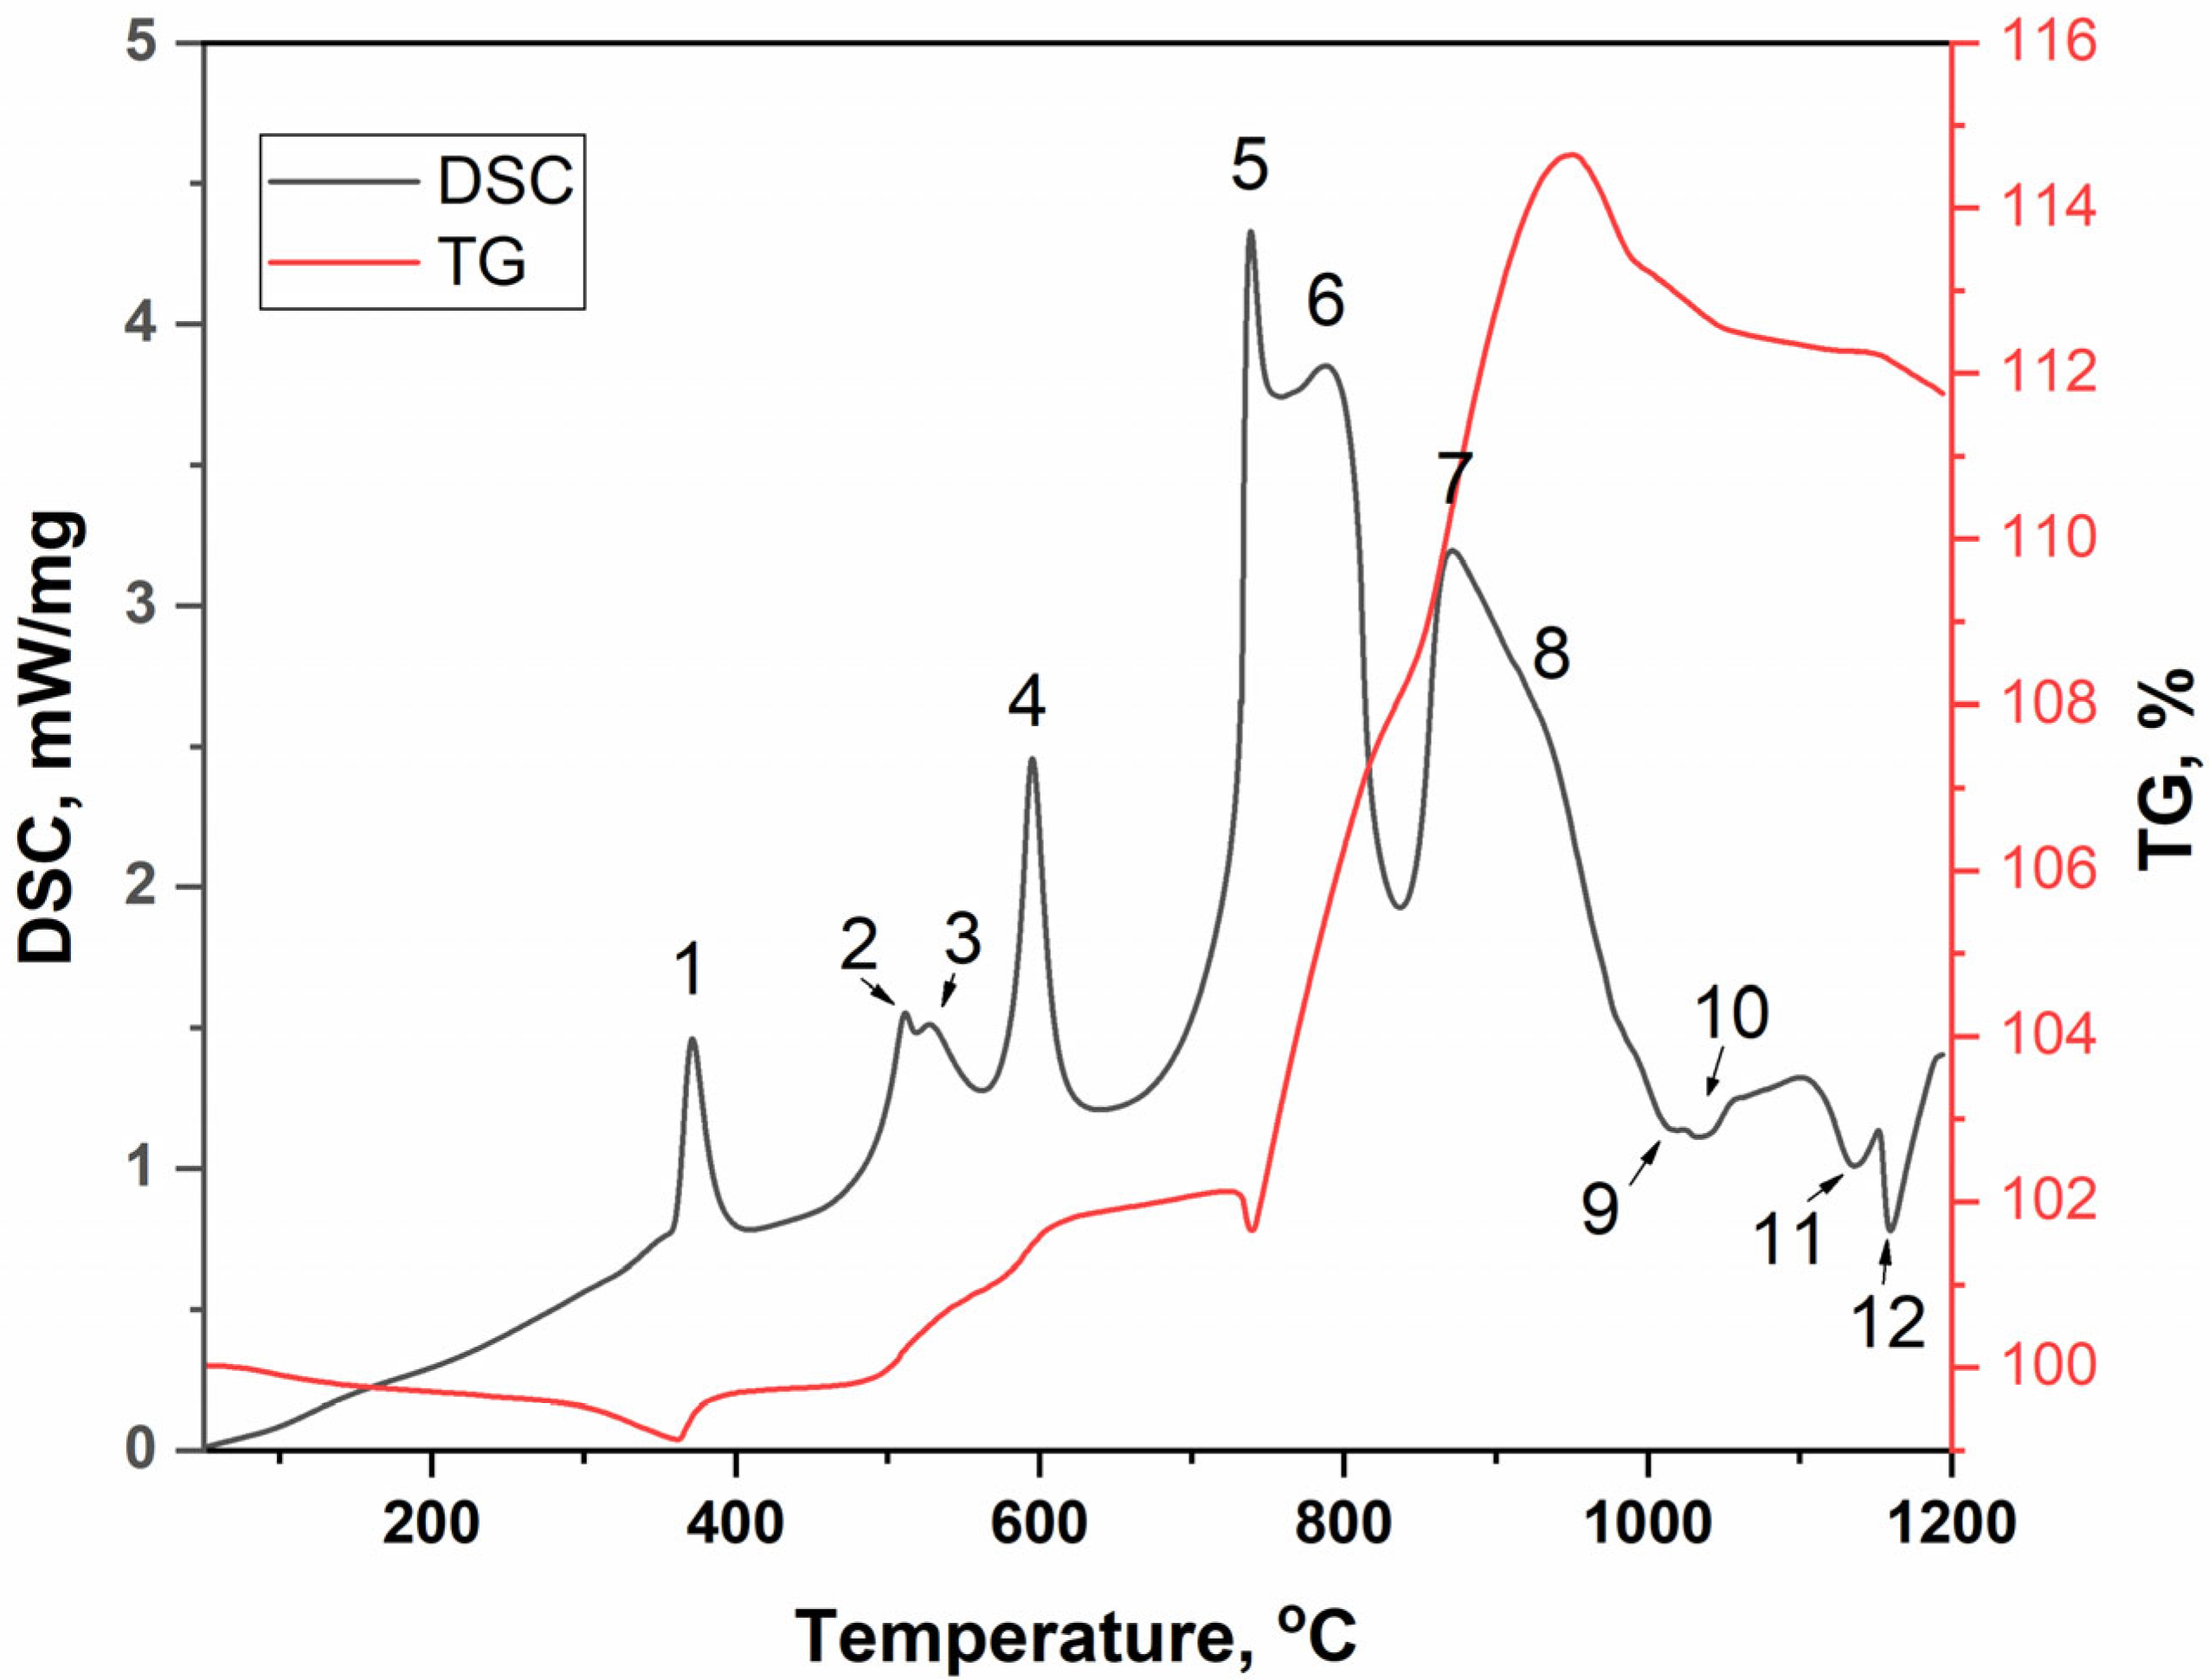
From the comparison of the DSC curves, the highest number of thermal effects is detected at the heating rate 15 °C/min, and just this heating rate was used in the experiments aimed at the determination of the phase composition of intermediate products. For clarity, the superimposed DSC and TG curves recorded at a heating rate of 15 °C/min are shown in Figure 5, where the detected thermal effects are numerated. As it is seen, exo-effects are observed at the temperatures of up to ~900 °C, and endo-effects are found at higher temperatures. For other heating rates, Thermal Effects 1–12 are slightly shifted in temperature and partly disappear. To determine the phase composition of the intermediate products, the following algorithm was used. For each thermal effect, a new portion of BaLaCuS3 was heated at heating rate of 15 °C/min up to the temperature specified for the middle of the thermal effect. Then, the heating was terminated and the sample was quenched at the cooling rate of 50 °C/min to room temperature. After the cooling and extraction from the crucible, the sample was studied by XRD and IR–vis methods. The recorded XRD patterns and difference Rietveld plots are shown in Figure S2. The results of the XRD analysis are summarized in Table S1 and Table 3, and the assumed chemical reactions are given in Table 4.
Thus, BaLaCuS3 undergoes a multistage oxidative decomposition on the heating in the air atmosphere. When the sample is heated to the onset of Thermal Effect 1 at 280–390 °C, there is a slight mass loss followed by the mass stabilization, as evident in Figure 4 and Figure 5. This mass variation likely occurs due to the burn-up of excess sulfur in the sample. The initial BaLaCuS3 oxidation stage is characterized by the release of barium from the sulfide environment of the LaCuS2 layers. It is known that barium is a lithophilic element, and therefore the general trend is its transition from a sulfide environment to a more characteristic sulfate form. This process, according to stoichiometry, corresponds to a mass gain of about 15% (at 15 °C/min) (Figure 4 and Figure 5). Such increase in mass is observed up to temperatures of 800–850 °C for all heating rates, except the case of 20 °C/min. At this stage, according to the phase composition changes (Table 3 and Table 4), the second oxidation process is started in parallel, and it is governed by the transition of the next lithophilic element (lanthanum) from the sulfide environment to the oxosulfide form.
For the heating rate of 20 °C/min, there is no clear maximum in mass on the TG curve. In this case, two superimposed competing effects result in the smoothing of the mass change, as presented in Figure 4.
Judging by the phase compositions found for Thermal Effects 1–4, the initial BaLaCuS3 oxidation stage is complicated by the formation of a glassy form represented in the XRD patterns as a halo with a maximum at 2θ~20° (d = 4.66 Å). To verify the formation of the sulfate units, the IR spectra were recorded for the samples subjected to heating up to 380 and 530 °C, as shown in Figure 6. As seen, the presence of the SO42− anions is evident [35,51,52]. At the initial stage (up to 400 °C, Effect 1), the structure is quite labile (kinetic parameters are the lowest, Table 2): the energy of oxidation activation is as low as 77 kJ/mol. Then, according to the increasing halo intensity (the glass-like content increases), the oxidation of the sulfide–barium component begins to be kinetically hindered and reaches a maximum at a temperature of ~600 °C (Table 2). This is consistent with the high kinetic inertia for this step (Effect 4), and the oxidation activation energy is as high as 625 kJ/mol (Table 2). The isotropy of the process at this stage is much higher (a preexponential multiplier 8∙1035 that is 10–30 orders of magnitude higher compared to Effects 1–3), and that is more peculiar to vitreous forms than crystalline ones.
Further, in the temperature range of 700–800 °C, the vitreous component is disappeared, and the related halo is not observed in the XRD patterns. Accordingly, the lability of the mixture increases due to the complete oxidation of BaLaCuS3, the activation energy of oxidation decreases up to 244 kJ/mol (Effect 6) and the preexponential multiplier decreases by 26 orders up to 7∙109.
In the second stage of oxidation with the transition of lanthanum from the sulfide to oxosulfide form with partial replacement of sulfide environment of lanthanum by the oxide one (Effect 7), the kinetic inertia increases slightly again and the activation energy of oxidation increases to 435 kJ/mol:
CuLaS2 + 1.5O2 = LaCuOS + SO2.
Effects 8 and 9 occur at close temperatures and the process of converting lanthanum oxosulfide to the oxosulfate form is likely to be attributed to Effect 8, and the process of burning the sulfide–copper component—to Effect 9. The related reactions can be described by equation
6LaCuOS + 11O2 = 3La2O2SO4 + 2CuO/Cu2O + 3SO2.
The correlation of the decomposition sequence of sulfide components of barium, lanthanum and copper with coordination characteristics is clearly observed. Thus, polyhedron BaS7 (one capped trigonal prism) is the least stable. The LaS6 octahedron is more stable, and the CuS4 tetrahedron is least susceptible to the oxidative attack [53,54]. The resulting oxidation products have an even higher inertia (Table 4). Further, the processes of decomposition of lanthanum oxosulfate and formation of copper oxides are proceeding in parallel (Table 4). This is consistent with the previous works [55,56]. According to the available information about the oxidation of RE2O2SO4 [55], La2O2SO4 is decomposed to La2O3 and SO2. This transformation is confirmed by the weight loss above 1135 °C. However, the La2O3 phase was not observed in the related XRD pattern. Instead, a halo with a maximum at 2θ~21° (d = 4.21 Å) was found. Most likely, the lanthanum oxosulfate decomposition product is involved in the glass phase formation with other BaLaCuS3 oxidation products. Upon further heating, the halo is eliminated, and a La2CuO4 phase is formed.
Commonly, La2CuO4 is synthesized by the low temperature methods, sol–gel methods or by the decomposition of a mixture of lanthanum oxalate and copper oxalate [57,58,59]. Thus, a novel method of high-temperature La2CuO4 synthesis can be proposed through a decomposition reaction of a mixture of lanthanum oxosulfide and copper oxide. Given that the reaction undergoes an amorphous phase, an interesting morphological property can be expected. It is also worth considering a reaction not only with CuO, but also with the use of Cu2O or metal copper in the air atmosphere. It is worth noting that La2CuO4 is one of the first superconductors [60] and it has interesting magnetic properties [61]. Today, this cuprate is investigated as a promising catalyst in the CLOU process [62] and as an activator of peroxymonosulfate for the decomposition of organic compounds [63,64].
According to the available data, the oxidation of the BaLaCuS3 substance in the artificial air atmosphere at temperatures above 1200 °C can be expressed by equation
2BaLaCuS3 + 10.5O2 = 2BaSO4 + CuO + La2CuO4 +4SO2.
The final oxidation product is a mixture of barium sulfate, copper (II) oxide and complex oxide La2CuO4. Barium and most of its compounds are toxic to humans. However, barium sulfate is insoluble and chemically stable, and that makes it safe for humans and the environment. CuO in natural conditions is highly likely to form (CuOH)2CO3 [65] with time due to the interaction with active atmosphere components. As to La2CuO4, the impact of this compound on humans and the environment remains unknown.
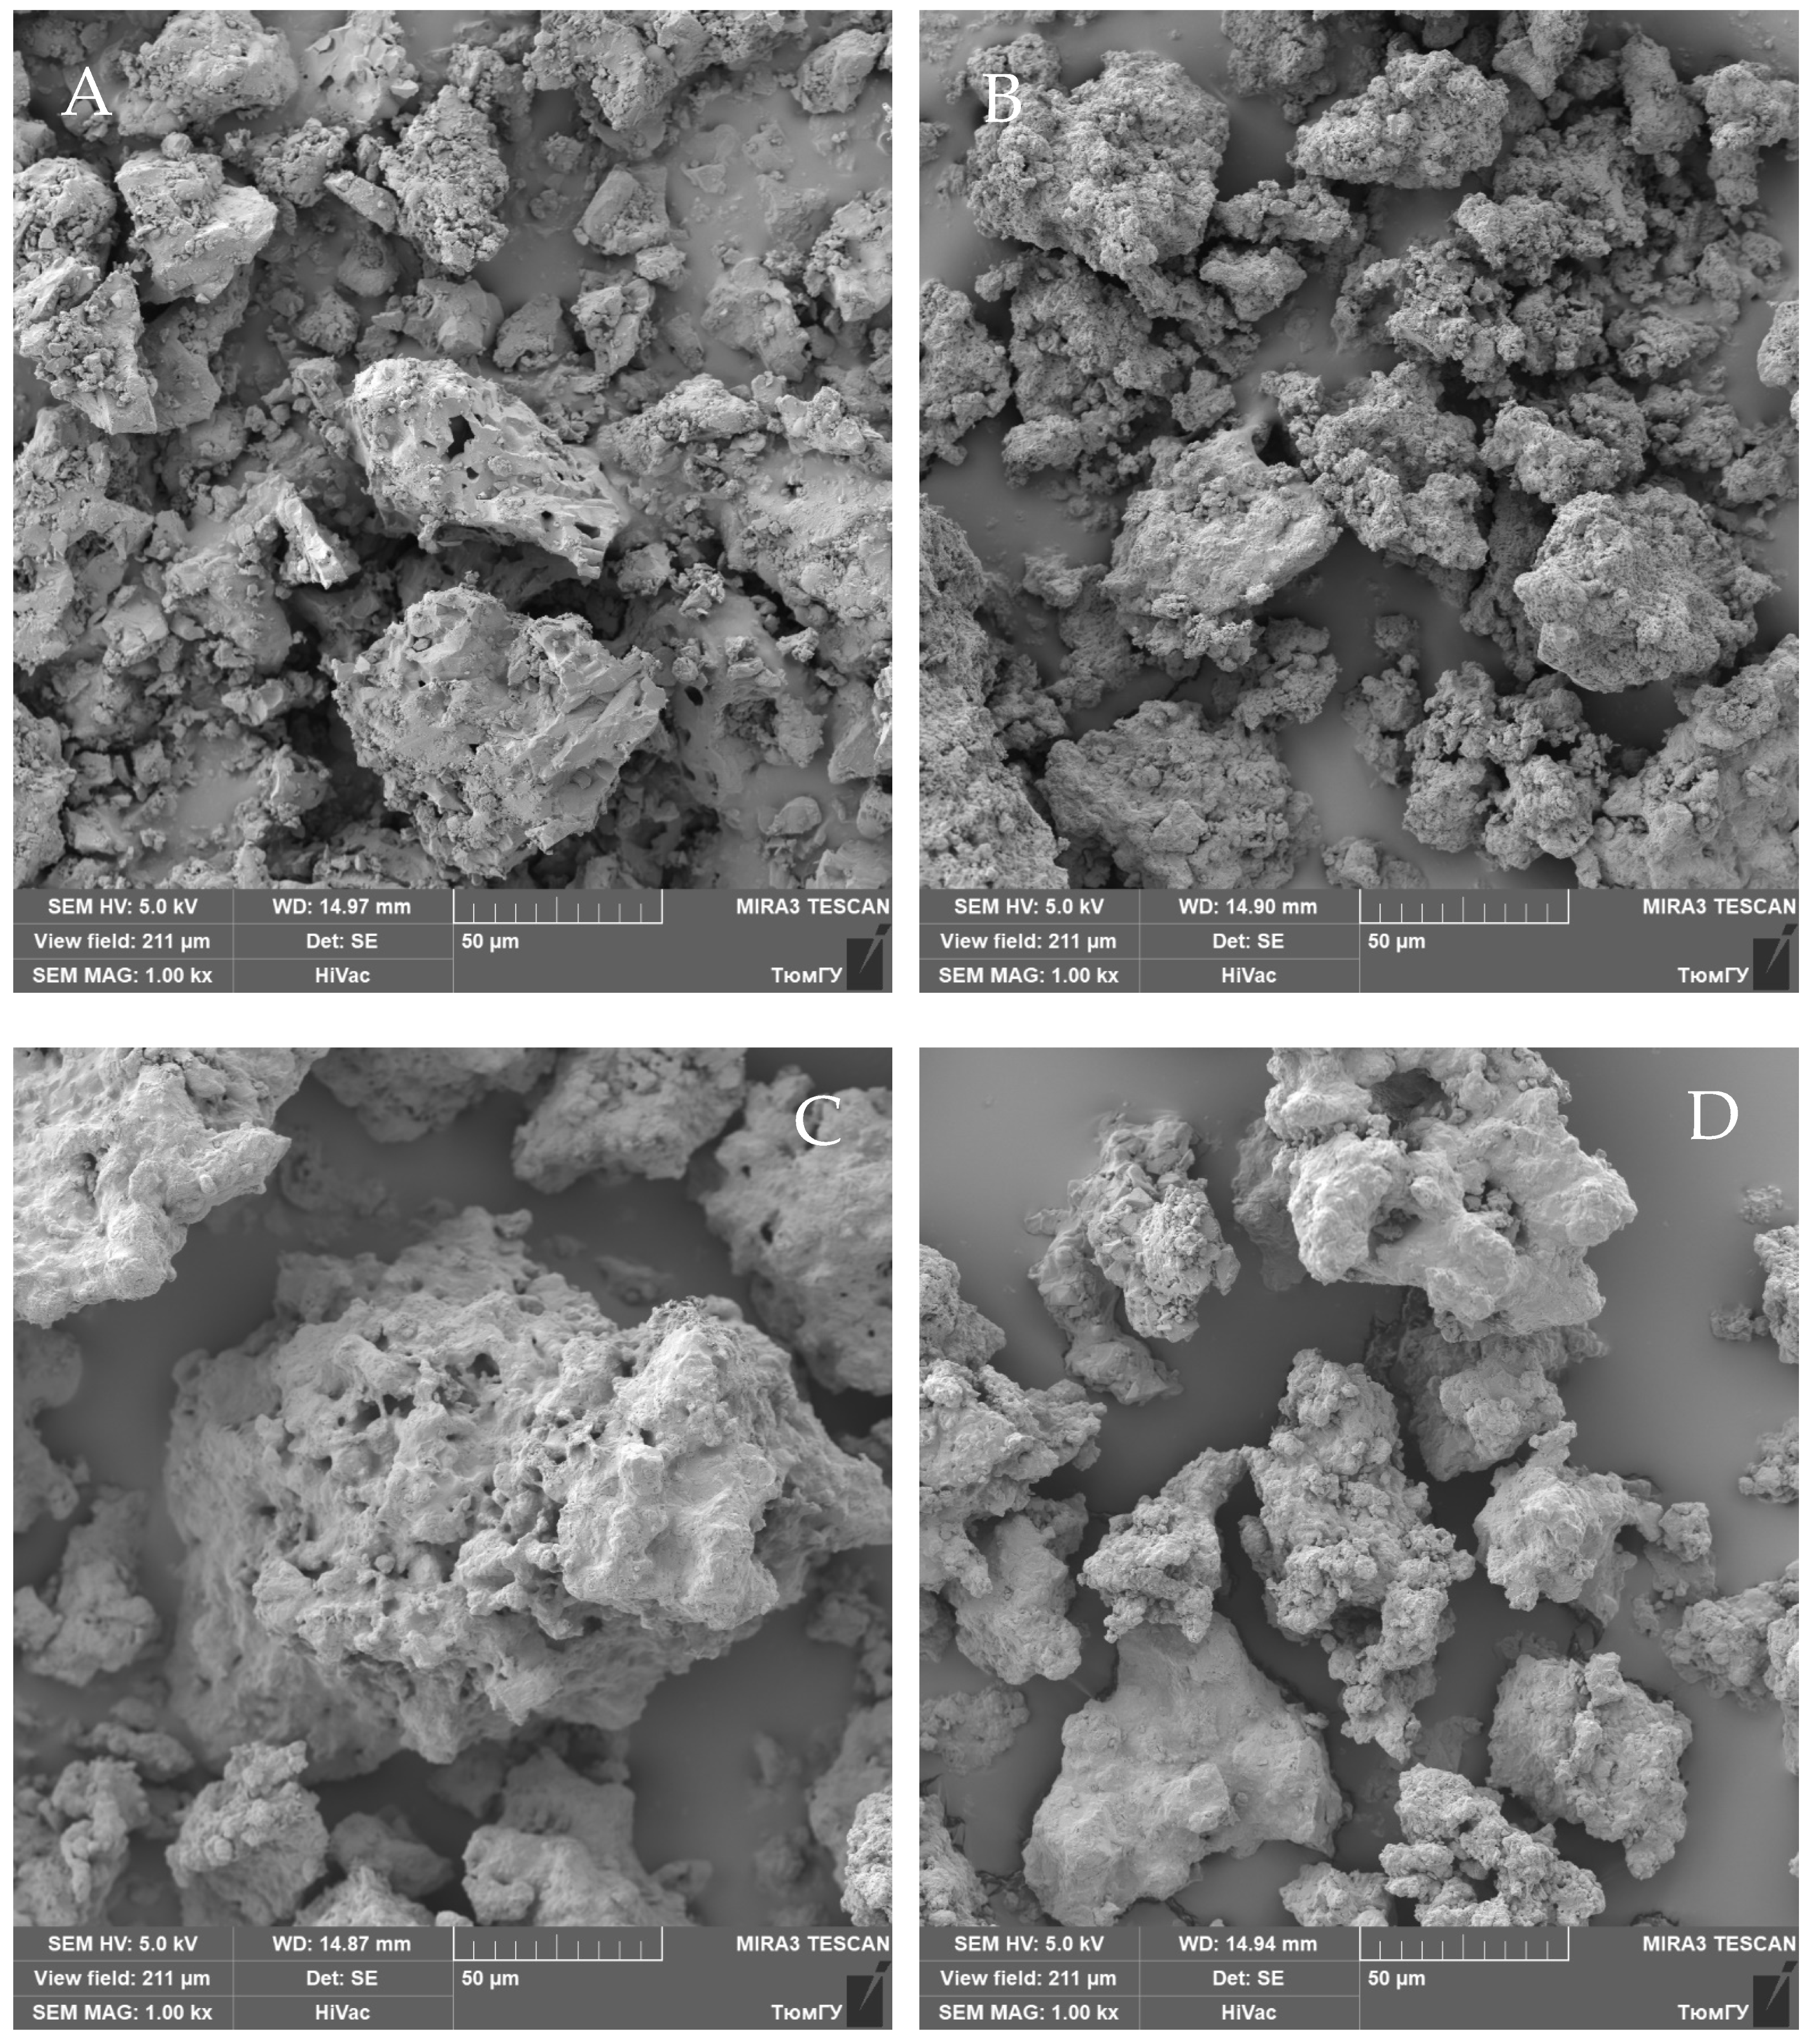
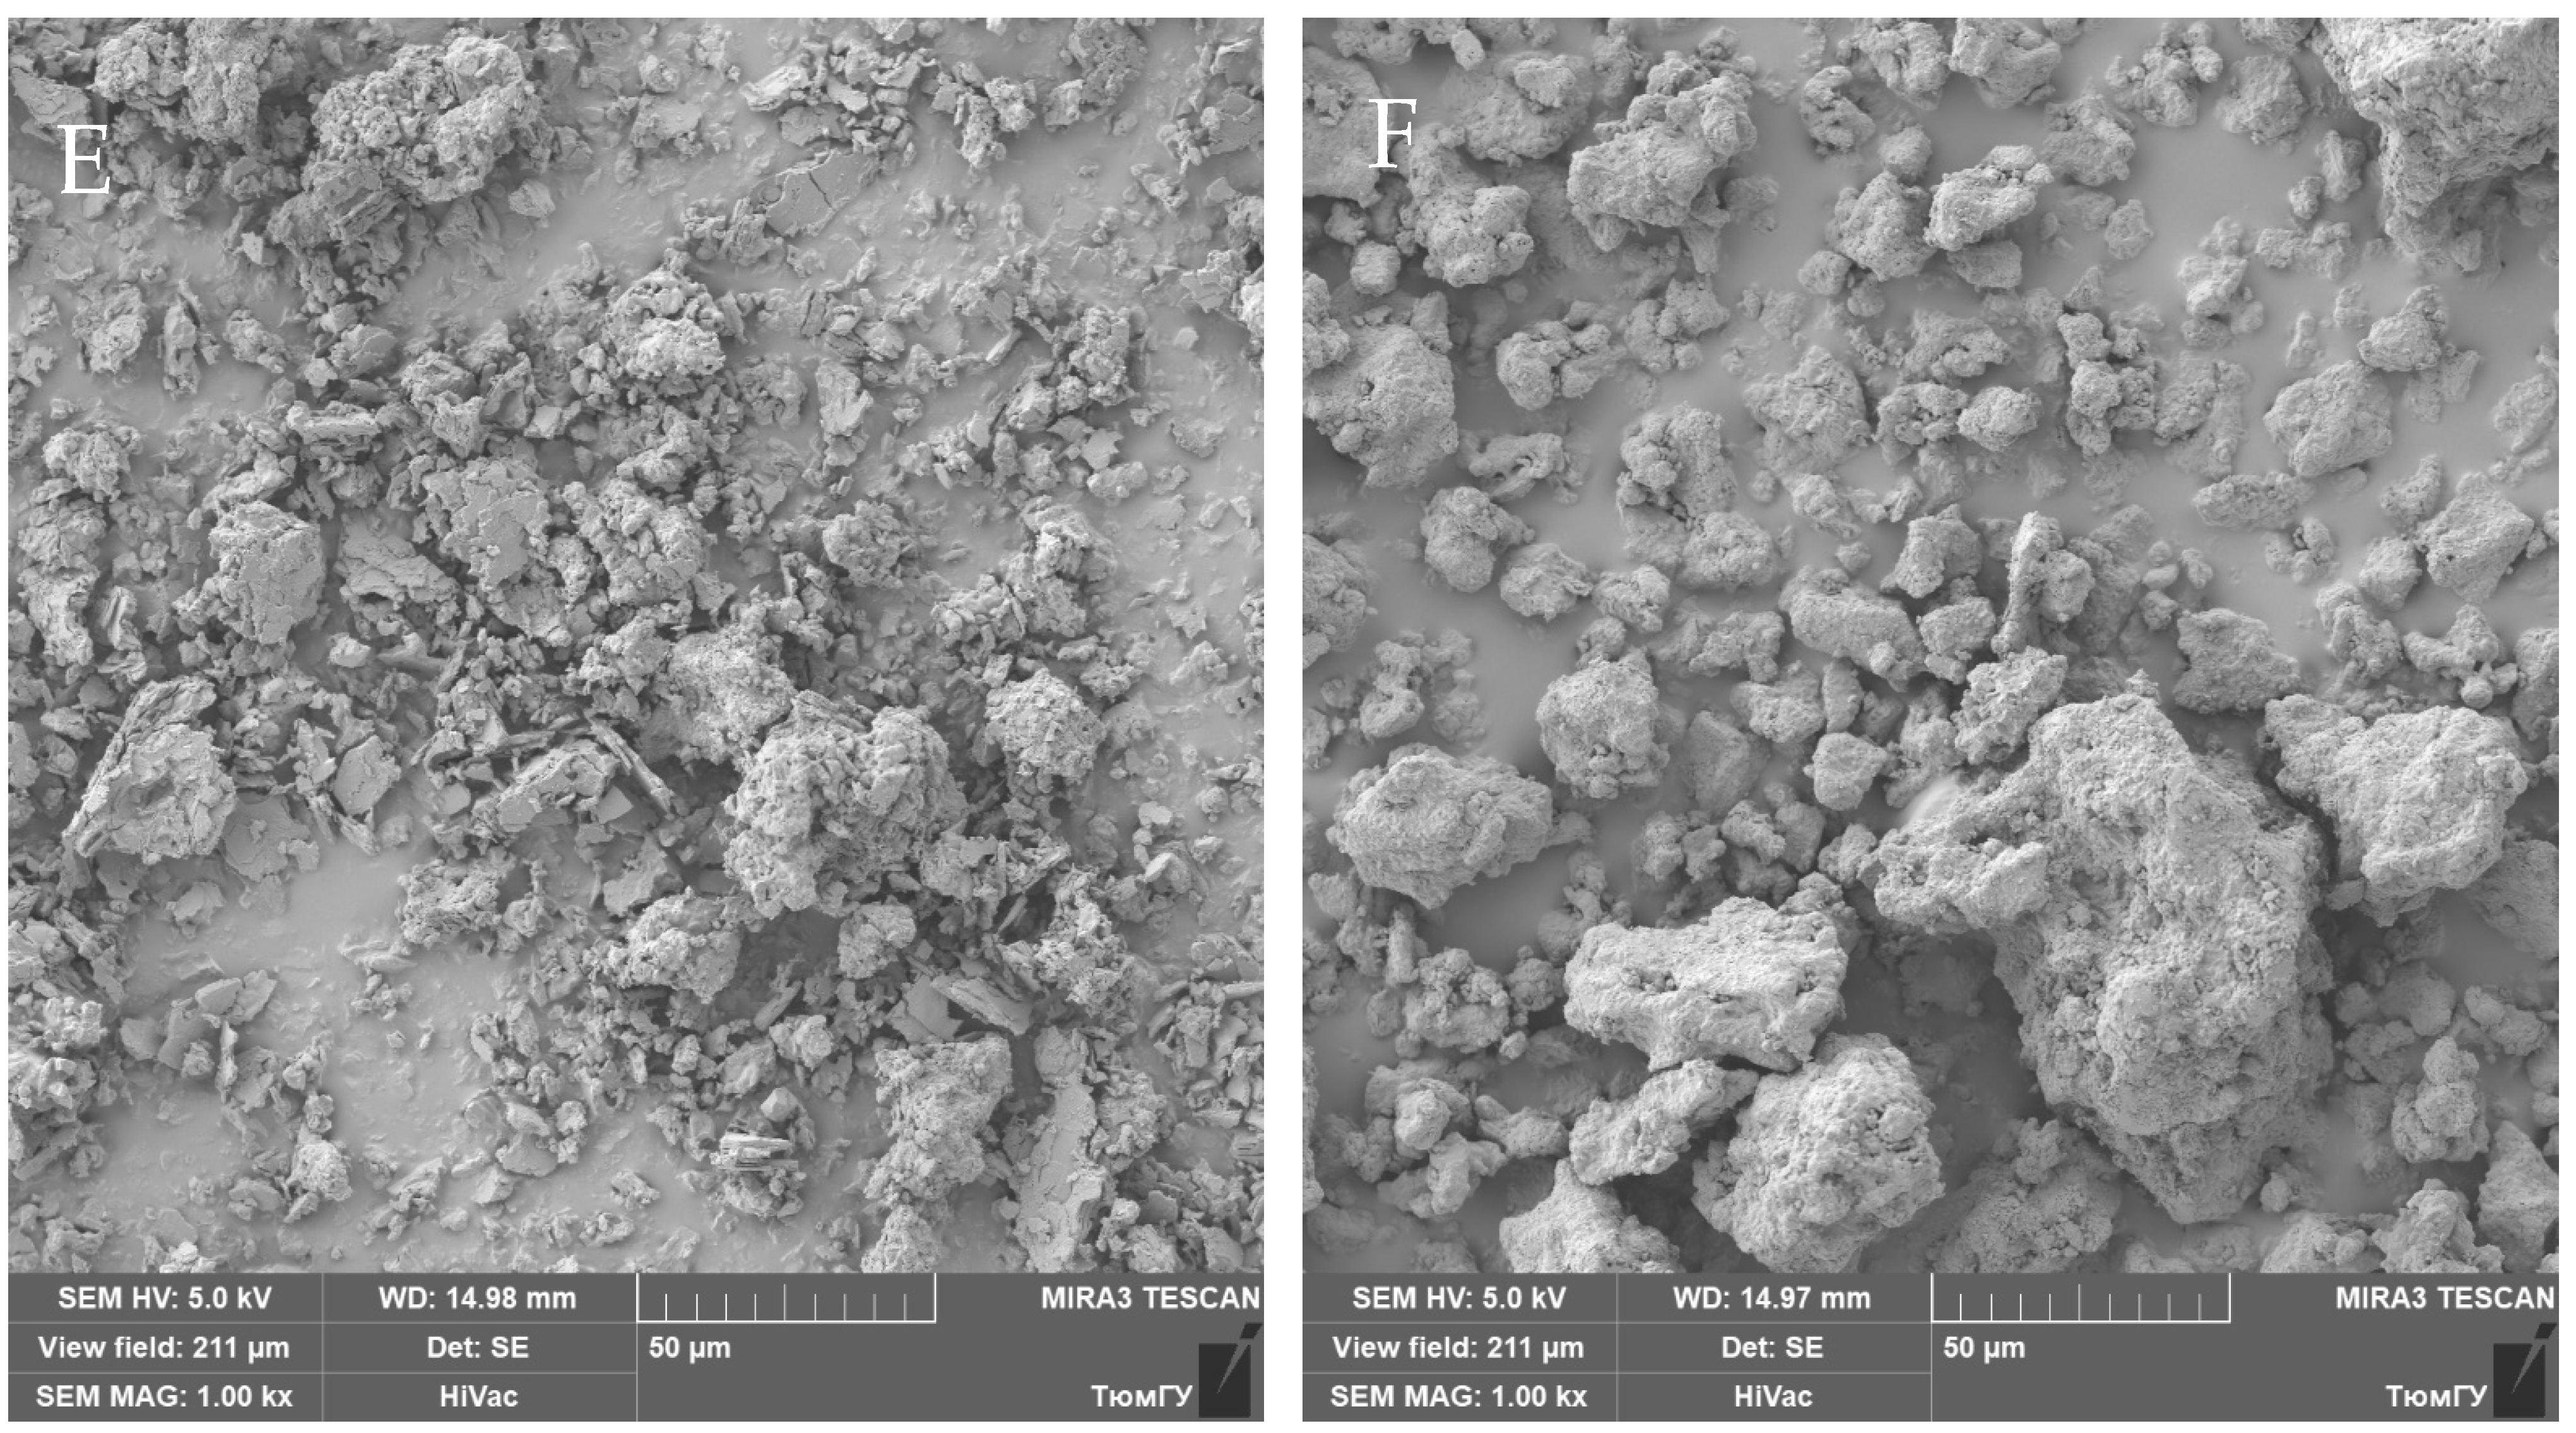
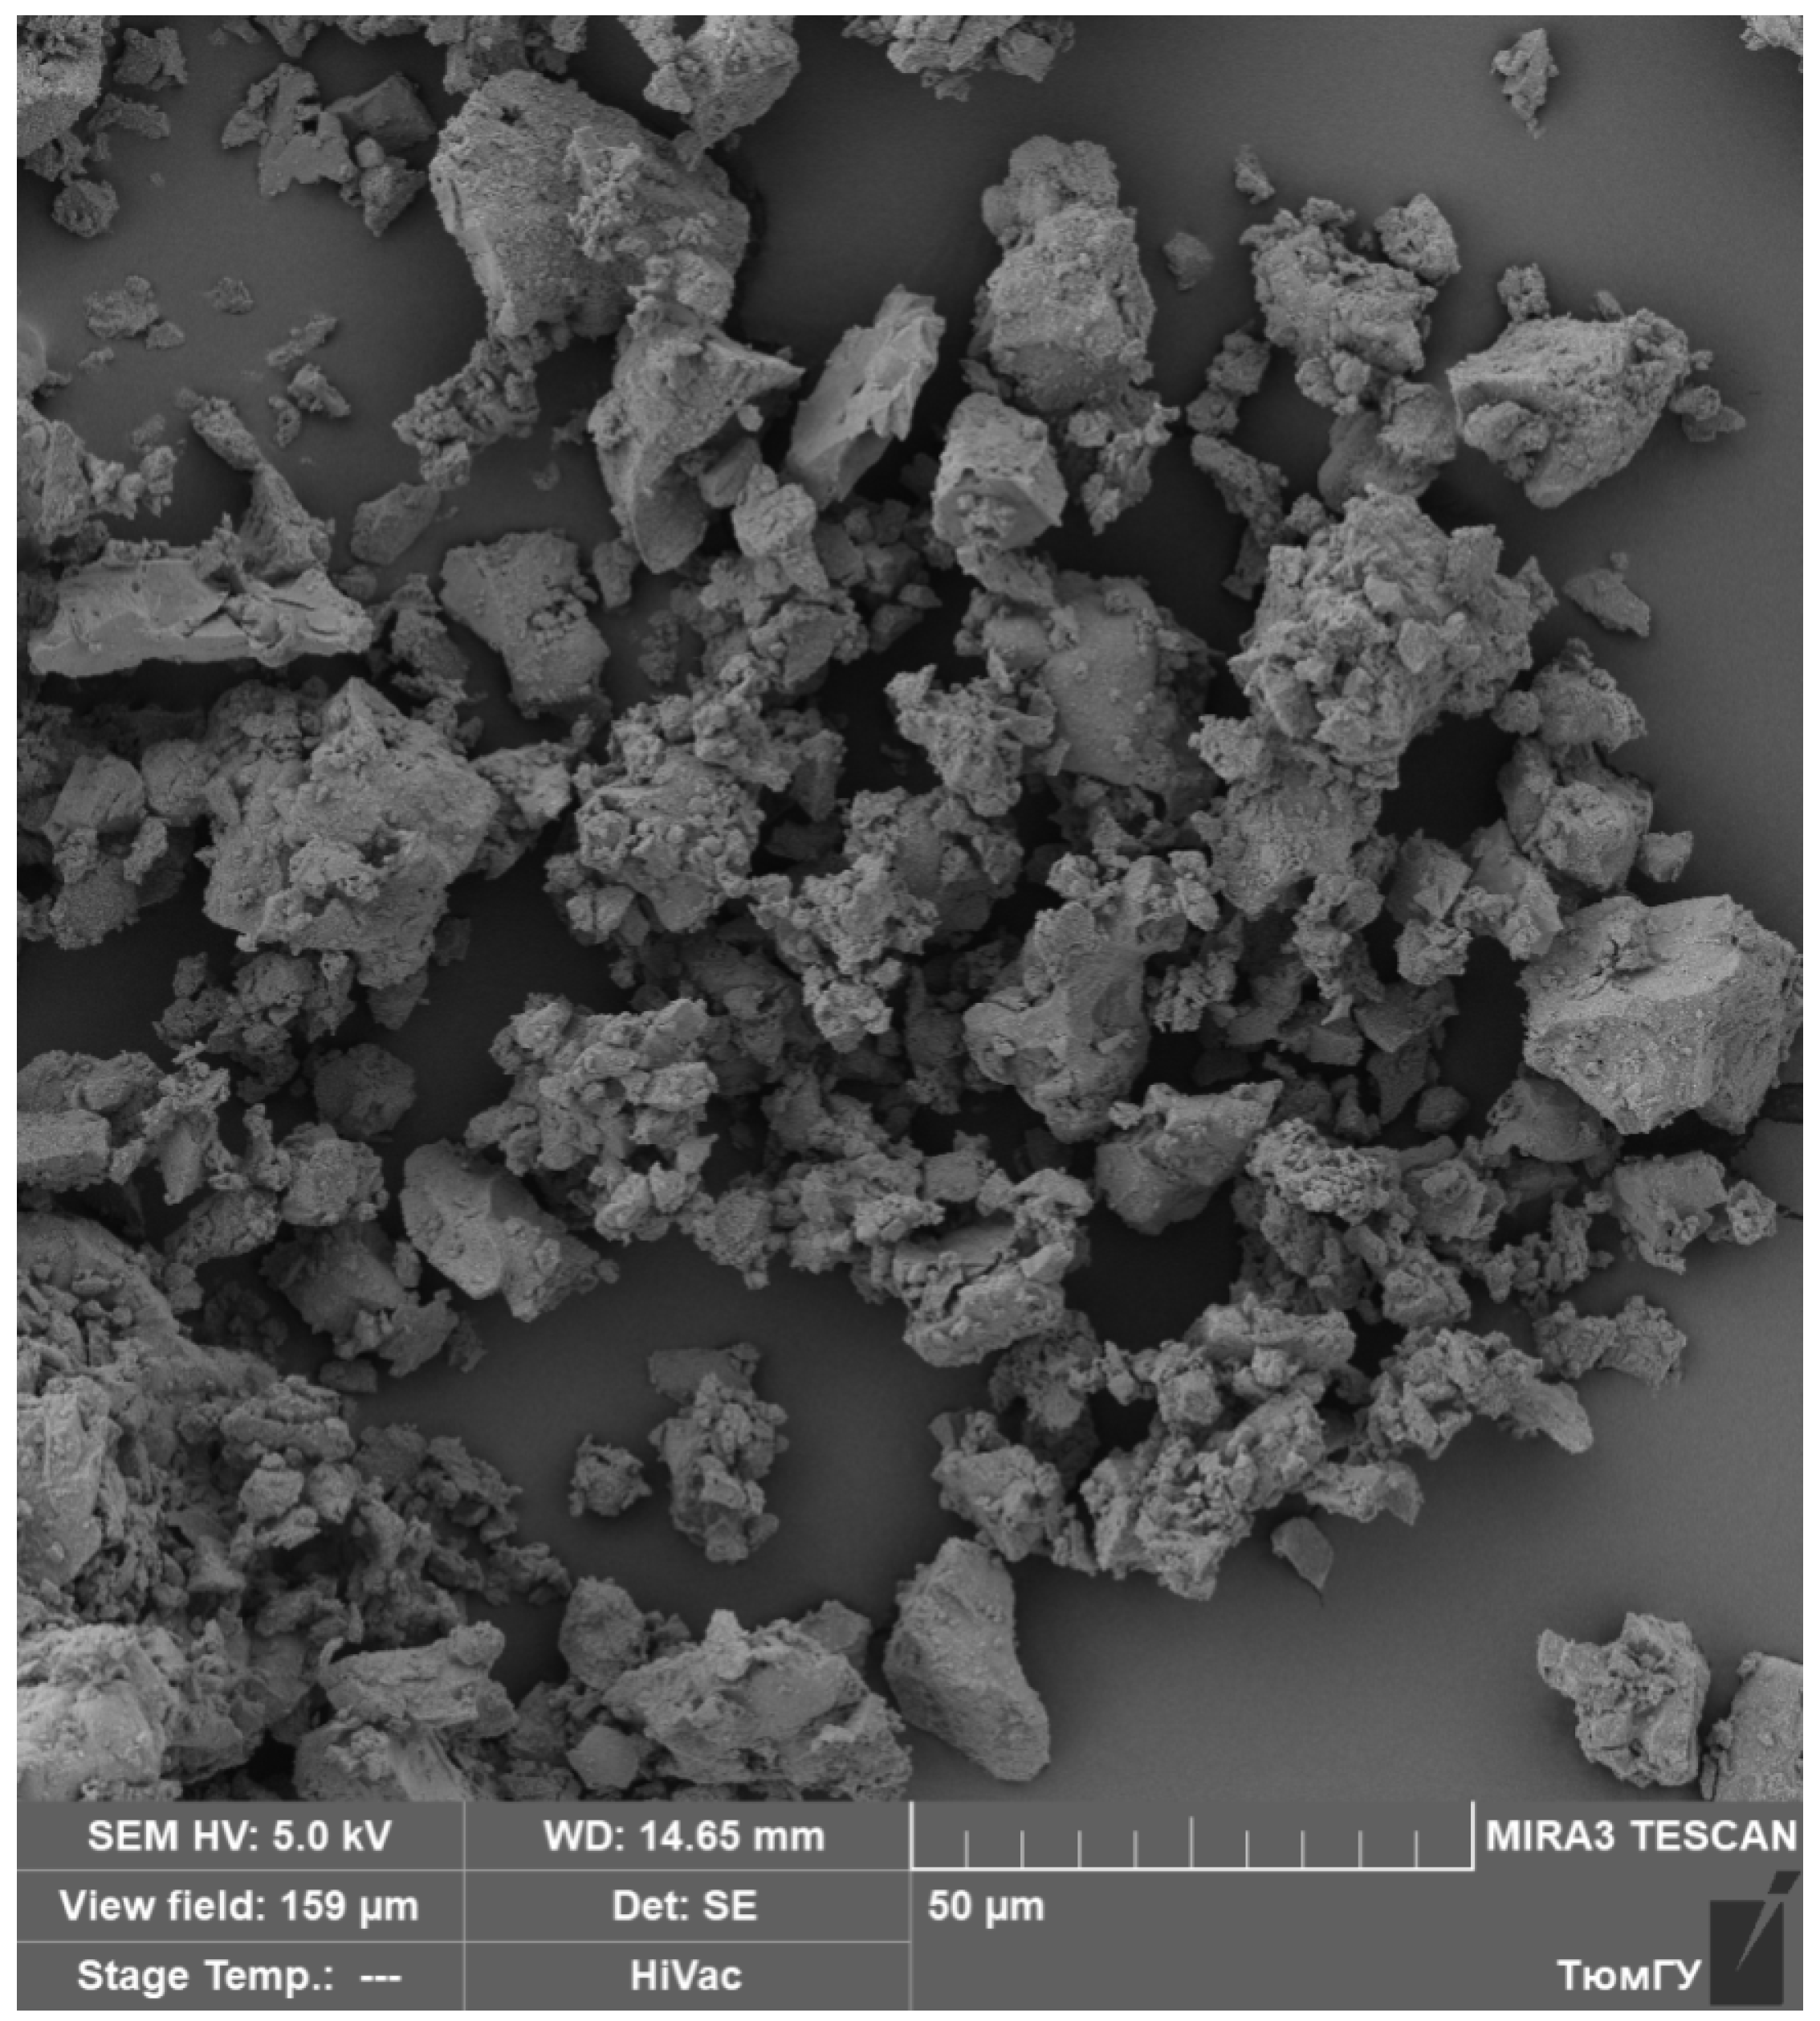
The SEM patterns recorded at different steps of oxidation of the BaLaCuS3 particles are shown in Figure 7 and Figure S3. The EDX mapping analysis is presented in Figures S4–S9. For comparison, the particle morphology, just after the synthesis of BaLaCuS3, can be observed in Figure 8. The related EDX mapping analysis can be observed in Figure S10. In the temperature range of 380–630 °C, the grains become more porous due to a loss of gaseous components. In parallel, as it is clearly seen in Figure 7B, a grid of needle-like formations appeared at the particle surface, and such shapes are characteristic for BaSO4 crystals. Such a porous framework can provide a good air access to the entire grain volume. Based on the data, it can be assumed that the effects associated with the first five oxidation effects belong to more complex processes of intermediate oxidation of BaLaCuS3. Further SEM images indicate the destruction of the barium sulfate framework into smaller crystallites. This process proceeds up to 1100 °C, where a strong loosening of the sample is observed and the crystals different in morphology are formed. In addition, a very porous structure can be noticed, which may be attributed to an amorphous halo in the XRD pattern recorded for the sample treated at 1137 °C. At the final stage, closely packed agglomerates of partly faceted crystals, apparently attributed to CuO and La2CuO4, are seen in Figure 7F.
The estimated specific surface area and pore size parameters of the BaLaCuS3 sample are listed in Table 5. The specific surface of the pure compound BaLaCuS3 is not large and also does not have a large number of pores. This suggests that the oxidation must proceed in layers, and in some cases, the oxidized layer can serve as a protective layer preventing further oxidation. Based on the XRD data, this assumption is confirmed by the multistage formation of barium sulfate.

5. Conclusions

In the present study, a complex analysis of the BaLaCuS3 oxidation stages was carried out, and the intermediate and final products were identified. Based on the phase composition analysis, the thermogravimetric and kinetic characteristics of each thermal effect were provided, and the oxidation mechanism was proposed. After the oxidation at 1137 °C, BaLaCuS3 is completely transformed into a mixture of BaSO4, CuO and La2CuO4. These oxides are stable, and further oxidation reactions are prohibited. However, hydration reactions in contact with the air can be reasonably assumed with time. Similar oxidation steps can be reasonably proposed for other BaLnCuS3 compounds, but specific behavior can be supposed for such rare-earth elements as Ce, Pr and Tb, the valence state of which can be changed in the oxidation process.

Supplementary Materials

The following supporting information can be downloaded at: https://www.mdpi.com/article/10.3390/cryst13060903/s1, Figure S1: Crystal structure of BaLaCuS3; Figure S2: Difference Rietveld plot of BaLaCuS3 at temperature: a) T = 380 °C; b) T = 518 °C; c) T = 560 °C; d) T = 630 °C; e) T = 760 °C; f) T = 790 °C; g) T = 872 °C; h) T = 940 °C; i) T = 1020 °C; j) T = 1045 °C; k) T = 1137 °C; l) T = 1165 °C; Figure S3: SEM patterns recorded for the intermediate products of the BaLaCuS3 oxidation. A—first state at 380 °C, B—at 650 °C, C—at 900 °C, D—1000 °C, E—1100 °C, F—1200 °C: Figure S4: SEM and Energy dispersive X-ray (EDX) mapping analysis of BaLaCuS3 oxidation at 380 °C; Figure S5: SEM and Energy dispersive X-ray (EDX) mapping analysis of BaLaCuS3 oxidation at 650oC; Figure S6: SEM and Energy dispersive X-ray (EDX) mapping analysis of BaLaCuS3 oxidation at 900 °C; Figure S7: SEM and Energy dispersive X-ray (EDX) mapping analysis of BaLaCuS3 oxidation at 1000 °C; Figure S8: SEM and Energy dispersive X-ray (EDX) mapping analysis of BaLaCuS3 oxidation at 1100 °C; Figure S9: SEM and Energy dispersive X-ray (EDX) mapping analysis of BaLaCuS3 oxidation at 1200 °C; Figure S10: SEM and Energy dispersive X-ray (EDX) mapping analysis of BaLaCuS3; Table S1: Fractional atomic coordinates and isotropic displacement parameters (Å2) of BaLaCuS3; Table S2: Main bond lengths (Å) of BaLaCuS3; Table S3: Main parameters of processing and refinement of the BaLaCuS3 samples after heating to specified temperature and cooling.

Author Contributions

N.O.A.: Methodology, Investigation, Formal analysis, Writing—original draft, Writing—Review and Editing. N.A.K.: Formal analysis, Writing—original draft. V.V.A.: Writing—original draft preparation, Writing—review and editing, Validation. A.A.G.: Data curation, Formal analysis. M.S.M.: Formal analysis, Data curation. S.M.: Investigation, Validation. O.V.A.: Supervision. All authors have read and agreed to the published version of the manuscript.

Funding

The work was partially carried out using the resources of the Research Resource Center “Natural Resources Management and Physico-Chemical Research” (Tyumen University) with financial support from the Ministry of Science and Higher Education of the Russian Federation (contract No. 05.594.21.0019., Unique identification number RFMEFI59420X0019). M.S. Molokeev was supported by the Tyumen Oblast Government, as part of the West-Siberian Interregional Science and Education Center’s project No. 89-DON (3).

Data Availability Statement

Data are available from the authors on request.

Acknowledgments

The authors would like to thank the staff of the Engineering Center of the Tyumen State University (special Alexej V. Matigorov) for their help in carrying out physical and chemical tests.

Conflicts of Interest

The authors declare no conflict of interest.

References

  1. Fthenakis, V.M.; Kim, H.C. CdTe photovoltaics: Life cycle environmental profile and comparisons. Thin Solid Film. 2007, 515, 5961–5963. [Google Scholar] [CrossRef]
  2. Fraboni, B.; Piana, E.; Cesca, T.; Gasparotto, A.; Longo, M.; Jakomin, R.; Tarricone, L. Deep levels controlling the electrical properties of Fe-implanted GaInP/GaAs. Appl. Phys. Lett. 2007, 90, 182106. [Google Scholar] [CrossRef]
  3. Reshak, A.H.; Atuchin, V.V.; Auluck, S.; Kityk, I.V. First and second harmonic generation of the optical susceptibilities for the non-centro-symmetric orthorhombic AgCd2GaS4. J. Phys. Condens. Matter 2008, 20, 325234. [Google Scholar] [CrossRef]
  4. Kang, Z.-H.; Guo, J.; Feng, Z.-S.; Gao, J.-Y.; Xie, J.-J.; Zhang, L.-M.; Atuchin, V.; Andreev, Y.; Lanskii, G.; Shaiduko, A. Tellurium and sulfur doped GaSe for mid-IR applications. Appl. Phys. B 2012, 108, 5251–5255. [Google Scholar]
  5. Nishinaga, J.; Nagai, T.; Sugaya, T.; Shibata, H.; Niki, S. Single-crystal Cu(In,Ga)Se2 solar cells grown on GaAs substrates. Appl. Phys. Express 2018, 11, 082302. [Google Scholar] [CrossRef]
  6. Shen, G.; Guyot-Sionnest, P. HgTe/CdTe and HgSe/CdX (X = S, Se, and Te) core/shell mid-infrared quantum dots. Chem. Mater. 2018, 31, 286–293. [Google Scholar] [CrossRef]
  7. Atuchin, V.V.; Liang, F.; Grazhdannikov, S.; Isaenko, L.I.; Krinitsin, P.G.; Molokeev, M.S.; Prosvirin, I.P.; Jiang, X.; Lin, Z. Negative thermal expansion and electronic structure variation of chalcopyrite type LiGaTe2. RSC Adv. 2018, 8, 9946–9955. [Google Scholar] [CrossRef]
  8. Suresh, R.; Pandiaraj, M.; Sankaralingam, M.; Giribabu, K. Graphene–metal chalcogenide modified electrochemical sensors. In Graphene-Based Electrochemical Sensors for Biomolecules; Elsevier: Amsterdam, The Netherlands, 2019; pp. 139–153. [Google Scholar] [CrossRef]
  9. Petrushkov, M.O.; Abramkin, D.S.; Emelyanov, E.A.; Putyato, M.A.; Komkov, O.S.; Firsov, D.D.; Vasev, A.V.; Yesin, M.Y.; Bakarov, A.K.; Loshkarev, I.D.; et al. Dislocation filter based on LT-GaAs layers for monolithic GaAs/Si integration. Nanomaterials 2022, 12, 4449. [Google Scholar] [CrossRef]
  10. Winton, G.H.; Faraone, L.; Lamb, R. Correlation of x-ray photoelectron spectroscopy and Rutherford backscattering spectroscopy depth profiles on Hg1−xCdxTe native oxides. J. Vac. Sci. Technol. A 1994, 12, 35–43. [Google Scholar] [CrossRef]
  11. Bando, H.; Koizumi, K.; Oikawa, Y.; Daikohara, K.; Kulbachinskii, V.A.; Ozaki, H. The time-dependent process of oxidation of the surface of Bi2Te3 studied by x-ray photoelectron spectroscopy. J. Phys. Condens. Matter 2000, 12, 5607–5616. [Google Scholar] [CrossRef]
  12. Vasil’ev, V.V.; Zakhar’yash, T.I.; Kesler, V.G.; Parm, I.O.; Solov’ev, A.P. Investigation of a change in the chemical composition of the surface of CdxHg1−xTe samples a result of treatment by N2O and H2 gases activated in a high-frequency discharge. Semiconductors 2001, 35, 196–198. [Google Scholar] [CrossRef]
  13. Yashina, L.V.; Tikhonov, E.V.; Neudachina, V.S.; Zyubina, T.S.; Chaika, A.N.; Shtanov, V.I.; Kobeleva, S.P.; Dobrovolsky, Y.A. The oxidation of PbTe(100) surface in dry oxygen. Surf. Interface Anal. 2004, 36, 993–996. [Google Scholar] [CrossRef]
  14. Andreev, Y.M.; Atuchin, V.V.; Lanskii, G.V.; Morozov, A.N.; Pokrovsky, L.D.; Sarkisov, S.Y.; Voevodina, O.V. Growth, real structure and applications of GaSe1−xSx crystals. Mater. Sci. Eng. B 2006, 128, 205–210. [Google Scholar] [CrossRef]
  15. Atuchin, V.V.; Kesler, V.G.; Ursaki, V.V.; Tezlevan, V.E. Electronic structure of HgGa2S4. Solid State Commun. 2006, 138, 250–254. [Google Scholar] [CrossRef]
  16. Balitskii, O.A.; Jaegermann, W. XPS study of InTe and GaTe single crystals oxidation. Mater. Chem. Phys. 2006, 97, 98–101. [Google Scholar] [CrossRef]
  17. Atuchin, V.V.; Kesler, V.G.; Parasyuk, O.V. Electronic structure of AgCd2GaS4. Surf. Rev. Lett. 2007, 14, 403–409. [Google Scholar] [CrossRef]
  18. Atuchin, V.V.; Isaenko, L.I.; Kesler, V.G.; Lobanov, S.I. Core level photoelectron spectroscopy of LiGaS2 and Ga–S bonding in complex sulfides. J. Alloys Compd. 2010, 497, 244–248. [Google Scholar] [CrossRef]
  19. Bereznaya, S.A.; Korotchenko, Z.V.; Novikov, V.A.; Redkin, R.A.; Sarkisov, S.Y.; Atuchin, V.V. Formation of native oxide crystallites on GaSe(001) surface. Inf. Phys. Technol. 2016, 76, 126–130. [Google Scholar] [CrossRef]
  20. Atuchin, V.V.; Isaenko, L.I.; Lobanov, S.I.; Goloshumova, A.A.; Molokeev, M.S.; Zhang, Z.; Zhang, X.; Jiang, X.; Lin, Z. Anisotropic thermal expansion and electronic structure of LiInSe2. Molecules 2022, 27, 5078. [Google Scholar] [CrossRef]
  21. Nguyen, M.; Ernits, K.; Tai, K.F.; Ng, C.F.; Pramana, S.S.; Sasangka, W.A.; Batabyal, S.K.; Holopainen, T.; Meissner, D.; Neisser, A.; et al. ZnS buffer layer for Cu2ZnSn(SSe)4 monograin layer solar cell. Solar Energy 2015, 111, 344–349. [Google Scholar] [CrossRef]
  22. Sengar, B.S.; Garg, V.; Awasthi, V.; Aaryashree; Kumar, S.; Mukherjee, C.; Gupta, M.; Mukherjee, S. Growth and characterization of dual ion beam sputtered Cu2ZnSn(S, Se)4 thin films for cost-effective photovoltaic application. Solar Energy 2016, 139, 1–12. [Google Scholar] [CrossRef]
  23. Sengar, B.S.; Garg, V.; Kumar, A.; Awasthi, V.; Kumar, S.; Atuchin, V.V.; Mukherjee, S. Band alignment of Cd-free (Zn, Mg)O layer with Cu2ZnSn(S,Se)4 and its effect on the photovoltaic properties. Opt. Mater. 2018, 84, 748–756. [Google Scholar] [CrossRef]
  24. Azarapin, N.O.; Aleksandrovsky, A.S.; Atuchin, V.V.; Gavrilova, T.A.; Krylov, A.S.; Molokeev, M.S.; Mukherjee, S.; Oreshonkov, A.S.; Andreev, O.V. Synthesis, structural and spectroscopic properties of orthorhombic compounds BaLnCuS3 (Ln = Pr, Sm). J. Alloys Compd. 2020, 832, 153134. [Google Scholar] [CrossRef]
  25. Garg, V.; Sengar, B.S.; Siddharth, G.; Kumar, S.; Atuchin, V.V.; Mukherjee, S. Insights into the sputter-instigated valence plasmon oscillations in CIGSe thin films. Surf. Interfaces 2021, 25, 101146. [Google Scholar] [CrossRef]
  26. Bakhadur, A.M.; Uralbekov, B.M.; Atuchin, V.V.; Mukherjee, S.; Kokh, K.A. Single-phase CZTSe via isothermal recrystallization in a KI–KCl flux. CrystEngComm 2022, 24, 2291–2296. [Google Scholar] [CrossRef]
  27. Andreev, O.V.; Atuchin, V.V.; Aleksandrovsky, A.S.; Denisenko, Y.G.; Zakharov, B.A.; Tyutyunnik, A.P.; Habibullayev, N.N.; Velikanov, D.A.; Ulybin, D.A.; Shpindyuk, D.D. Synthesis, structure, and properties of EuLnCuSe3 (Ln = Nd, Sm, Gd, Er). Crystals 2022, 12, 17. [Google Scholar] [CrossRef]
  28. Dubey, M.; Siddharth, G.; Singh, R.; Patel, C.; Kumar, S.; Htay, M.T.; Atuchin, V.V.; Mukherjee, S. Influence of substrate temperature and sulfurization on sputtered Cu2SnGe(S,Se)3 thin films for solar cell application. IEEE Trans. Elect. Devices 2022, 69, 2488–2493. [Google Scholar] [CrossRef]
  29. Christuk, A.E.; Wu, P.; Ibers, J.A. New quaternary chalcogenides BaLnMQ3 (Ln = Rare earths; M = Cu, Ag; Q = S, Se), I. Structure and grinding-induced phase transition in BaLnMQ3. J. Solid State Chem. 1994, 110, 330–336. [Google Scholar] [CrossRef]
  30. Yang, Y.; Ibers, J.A. Synthesis and characterization of a series of quaternary chalcogenides BaLnMQ3 (Ln = Rare earth, M = Coinage metal, Q = Se or Te). J. Solid State Chem. 1999, 147, 366–371. [Google Scholar] [CrossRef]
  31. Huang, F.Q.; Mitchell, K.; Ibers, J.A. New Layered Materials: Syntheses, structures, and optical and magnetic properties of CsGdZnSe3, CsZrCuSe3, CsUCuSe3, and BaGdCuSe3. Inorg. Chem. 2001, 40, 5123–5126. [Google Scholar] [CrossRef]
  32. Ruseikina, A.V.; Solov’ev, L.A.; Andreev, O.V. Crystal structures and properties of SrLnCuS3 (Ln = La, Pr). Russ. J. Inorg. Chem. 2014, 59, 196–201. [Google Scholar] [CrossRef]
  33. Oreshonkov, A.; Azarapin, N.; Shestakov, N.; Adichtchev, S. Experimental and DFT study of BaLaCuS3: Direct band gap semiconductor. J. Phys. Chem. Solids 2021, 148, 109670. [Google Scholar] [CrossRef]
  34. Shahid, O.; Yadav, S.; Maity, D.; Deepa, M.; Niranjan, M.K.; Prakash, J. Synthesis, crystal structure, DFT, and photovoltaic studies of BaCeCuS3. New J. Chem. 2023, 47, 5378–5389. [Google Scholar] [CrossRef]
  35. Denisenko, Y.G.; Molokeev, M.S.; Krylov, A.S.; Aleksandrovsky, A.S.; Oreshonkov, A.S.; Atuchin, V.V.; Azarapin, N.O.; Plyusnin, P.E.; Sal’nikova, E.I.; Andreev, O.V. High-temperature oxidation of europium (II) sulfide. J. Indust. Eng. Chem. 2019, 79, 62–70. [Google Scholar] [CrossRef]
  36. Llanos, J.; Sánchez, V.; Mujica, C.; Buljan, A. Synthesis, physical and optical properties, and electronic structure of the rare-earth oxysulfides Ln2O2S (Ln = Sm, Eu). Mater. Res. Bull. 2002, 37, 2285–2291. [Google Scholar] [CrossRef]
  37. Andreev, P.O.; Sal’nikov, E.I.; Kovenskii, I.M. Preparation of Ln2O2S (Ln = Gd, Dy, Y, Er, Lu) in flowing hydrogen and hydrogen sulfide. Inorg. Mater. 2014, 50, 1018–1023. [Google Scholar] [CrossRef]
  38. Andreev, O.V.; Denisenko, Y.G.; Osseni, S.A.; Bamburov, V.G.; Sal’nikova, E.I. Rare Earth Sulfates and Oxysulfides; Monograph; Tyumen State University: Tyumen, Russia, 2017; ISBN 978-5-400-01341-6. [Google Scholar]
  39. Mukherjee, S. The Science of Clays; Springer Science and Business Media: Dordrecht, The Netherlands, 2013; ISBN 0-471-03288-3. [Google Scholar]
  40. Evans, H.T. Djurleite (Cu1.94S) and low chalcocite (Cu2S): New crystal structure studies. Science 1979, 203, 356–358. [Google Scholar] [CrossRef] [PubMed]
  41. Ramakrishna Rao, V.V.V.N.S.; Abraham, K.P. Kinetics of oxidation of copper sulfide. Metall. Trans. 1971, 2, 2463–2470. [Google Scholar] [CrossRef]
  42. Asaki, Z.; Ueguchi, A.; Tanabe, T.; Kondo, Y. Oxidation of Cu2S pallet. Trans. Jpn. Inst. Metals 1986, 27, 361–371. [Google Scholar] [CrossRef]
  43. Asaki, Z.; Ando, S.; Kondo, Y. Oxidation of molten copper matte. Metall. Trans. 1988, 19B, 47–52. [Google Scholar] [CrossRef]
  44. Liu, J.; Xue, D. Thermal oxidation strategy towards porous metal oxide hollow architectures. Adv. Mater. 2008, 20, 2622–2627. [Google Scholar] [CrossRef]
  45. Senko, J.M.; Campbell, B.S.; Henriksen, J.; Elshahed, M.S.; Dewers, T.A.; Krumholz, L.R. Barite deposition resulting from phototrophic sulfide-oxidizing bacterial activity. Geochim. Cosmochim. Acta 2004, 68, 773–780. [Google Scholar] [CrossRef]
  46. Plummer, L.N. Barite deposition in central Kentucky. Econ. Geol. 1971, 66, 252–258. [Google Scholar] [CrossRef]
  47. NETZSCH. Proteus 6, Thermic Analyses e User’s and Software Manuals; NETZSCH: Selb, Germany, 2012. [Google Scholar]
  48. Denisenko, Y.; Khritokhin, N.; Andreev, O.; Basova, S.; Sal’nikova, E.; Polkovnikov, A. Thermal decomposition of europium sulfates Eu2(SO4)3·8H2O and EuSO4. J. Solid State Chem. 2017, 255, 219–224. [Google Scholar] [CrossRef]
  49. Bruker AXS. TOPAS V4: General Profile and Structure Analysis Software for Powder Diffraction Data—User’s Manual; Bruker, AXS: Karlsruhe, Germany, 2008. [Google Scholar]
  50. Azarapin, N.O.; Atuchin, V.V.; Maximov, N.G.; Aleksandrovsky, A.S.; Molokeev, M.S.; Oreshonkov, A.S.; Shestakov, N.P.; Krylov, A.S.; Burkhanova, T.M.; Mukherjee, S.; et al. Synthesis, structure, melting and optical properties of three complex orthorhombic sulfides BaDyCuS3, BaHoCuS3 and BaYbCuS3. Mater. Res. Bull. 2021, 140, 111314. [Google Scholar] [CrossRef]
  51. Denisenko, Y.G.; Aleksandrovsky, A.; Atuchin, V.; Krylov, A.; Molokeev, M.; Oreshonkov, A.; Shestakov, N.; Andreev, O. Exploration of structural, thermal and spectroscopic properties of self-activated sulfate Eu2(SO4)3 with isolated SO4 groups. J. Indust. Eng. Chem. 2018, 68, 109–116. [Google Scholar] [CrossRef]
  52. Denisenko, Y.G.; Atuchin, V.V.; Molokeev, M.S.; Wang, N.; Jiang, X.; Aleksandrovsky, A.S.; Krylov, A.S.; Oreshonkov, A.S.; Sedykh, A.E.; Volkova, S.S.; et al. Negative thermal expansion in one-dimension of a new double sulfate AgHo(SO4)2 with isolated SO4 tetrahedra. J. Mater. Sci. Technol. 2021, 76, 111–121. [Google Scholar] [CrossRef]
  53. Yin, Q.; Kelsall, G.H.; Vaughan, D.J.; England, K.E.R. Atmospheric and electrochemical oxidation of the surface of chalcopyrite (CuFeS2). Geochim. Cosmochim. Acta 1995, 59, 1091–1100. [Google Scholar] [CrossRef]
  54. Cai, Y.; Chen, X.; Ding, J.; Zhou, D. Leaching mechanism for chalcopyrite in hydrochloric acid. Hydrometallurgy 2012, 113, 109–118. [Google Scholar] [CrossRef]
  55. Nathans, M.; Wendlandt, W. The thermal decomposition of the rare-earth sulphates: Thermogravimetric and differential thermal analysis studies up to 1400 °C. J. Inorg. Nucl. Chem. 1962, 24, 869–879. [Google Scholar] [CrossRef]
  56. Zhu, Y.; Mimura, K.; Isshiki, M. Oxidation mechanism of Cu2O to CuO at 600–1050 °C. Oxid. Met. 2004, 62, 207–222. [Google Scholar] [CrossRef]
  57. Enhessari, M.; Shaterian, M.; Esfahani, M.J.; Motaharian, M.N. Motaharian, Synthesis, characterization and optical band gap of La2CuO4 nanoparticles. Mater. Sci. Semicond. Proc. 2013, 16, 1517–1520. [Google Scholar] [CrossRef]
  58. Imai, Y.; Kato, M.; Takarabe, Y.; Noji, T.; Koike, Y. Low-temperature synthesis of La2CuO4 with the T‘-structure from molten hydroxides. Chem. Mater. 2007, 19, 3584–3585. [Google Scholar] [CrossRef]
  59. Abboudi, M.; Messali, M.; Kadiri, N.; Ben Ali, A.; Moran, E. Synthesis of CuO, La2O3, and La2CuO4 by the thermal-decomposition of oxalates precursors using a new method. Synth. React. Inorg. Met. Organ. Nano-Met. Chem. 2011, 41, 683–688. [Google Scholar] [CrossRef]
  60. Tholence, J. Superconductivity of La2CuO4 and YBa2Cu3O7. In Proceedings of the Yamada Conference XVIII on Superconductivity in Highly Correlated Fermion Systems; Elsevier: Amsterdam, The Netherlands, 1987; pp. 353–356. [Google Scholar] [CrossRef]
  61. Cheong, S.-W.; Thompson, J.; Fisk, Z. Properties of La2CuO4 and related compounds. Phys. C Supercond. 1989, 158, 109–126. [Google Scholar] [CrossRef]
  62. Shishkin, R.A.; Suntsov, A.Y. La2CuO4 as a promising oxygen carrier for CLOU process. AIP Conf. Proc. 2020, 2313, 060024. [Google Scholar] [CrossRef]
  63. Gao, P.; He, Y.; Lu, S.; He, M.; Liu, Z.; Deng, Y.; Xu, T.; Zhang, H. Activation of peroxymonosulfate by La2CuO4 perovskite for synergistic removal of Microcystis aeruginosa and microcystin-LR in harmful algal bloom impacted water. Appl. Catal. B Environ. 2023, 328, 122511. [Google Scholar] [CrossRef]
  64. Parida, S.; Brahma, S.S.; Nanda, J.; Sethy, S.K.; Sankaran, K. Spin coated La2CuO4 thin film: An extensive study on optical dispersion parameters. Optik 2023, 278, 170728. [Google Scholar] [CrossRef]
  65. Melchiorre, E.B.; Criss, R.E.; Rose, T.P. Rose, Oxygen and carbon isotope study of natural and synthetic malachite. Econ. Geol. 1999, 94, 245–259. [Google Scholar] [CrossRef]
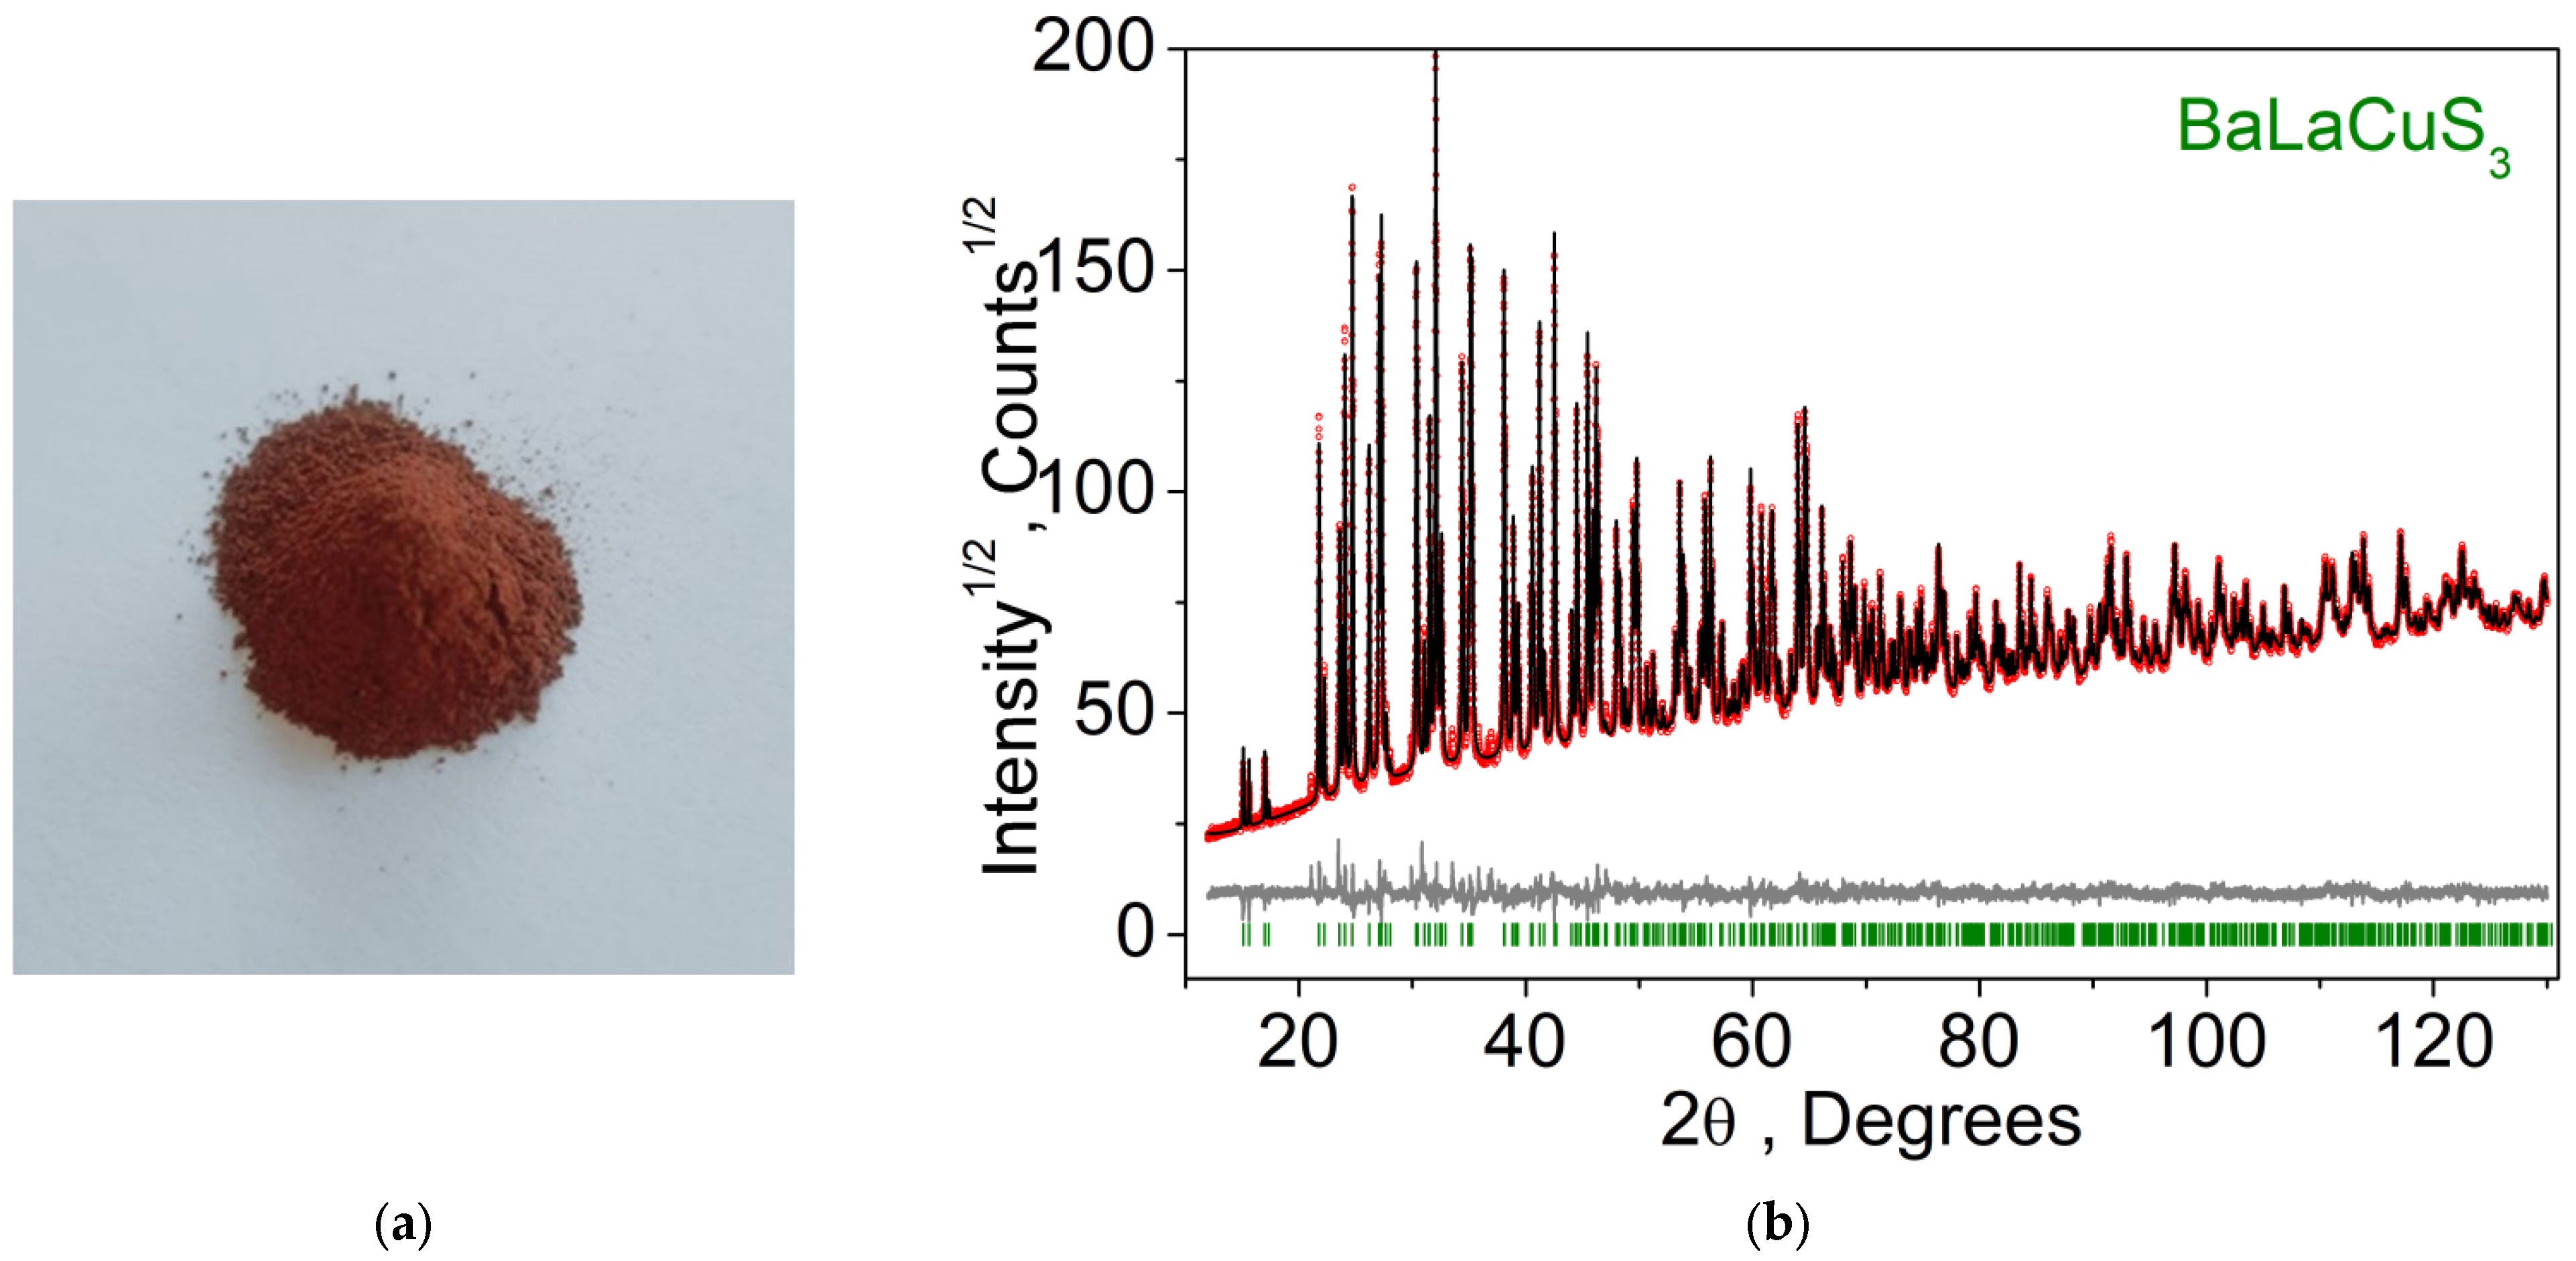
Figure 1. Photo (a) and XRD (b) pattern of powder compound BaLaCuS3 (red dots—experimental pattern Yobs, black line—calculated pattern Ycalc, grey line—difference Yobs-Ycalc, green lines—Bragg positions of reflections).
Crystals 13 00903 g001
Figure 2. Diffuse reflection UV–vis spectra of BaLaCuS3.
Crystals 13 00903 g002
Figure 3. DSC curves of BaLaCuS3 oxidation, as recorded at different heating rates.
Crystals 13 00903 g003
Figure 4. TG curves of BaLaCuS3 oxidation, as recorded at different heating rates.
Crystals 13 00903 g004
Figure 5. DSC (black) and TG (red) curves of BaLaCuS3 oxidation, as recorded at 15 °C/min.
Crystals 13 00903 g005
Figure 6. IR–vis spectra of BaLaCuS3, pure and oxidized at 380 °C (black) and 530 °C (red).
Crystals 13 00903 g006
Figure 7. SEM patterns recorded for the intermediate products of the BaLaCuS3 oxidation at 50 μm. (A) first state at 380 °C, (B) at 650 °C, (C) at 900 °C, (D) 1000 °C, (E) 1100 °C, (F) 1200 °C.
Crystals 13 00903 g007aCrystals 13 00903 g007b
Figure 8. SEM of BaLaCuS3 just after the synthesis.
Crystals 13 00903 g008
Table 1. Main processing and refinement parameters of the BaLaCuS3 sample.
CompoundBaLaCuS3BaLaCuS3 [29]
Phase typepowdersingle crystal
Space groupPnmaPnma
a (Å)11.34724(3)11.316(2)
b (Å)4.249621(12)4.236(1)
c (Å)11.73683(3)11.724(2)
V3)565.967(3)562.0(2)
Z44
2θ-interval, °12–130-
Rwp, %3.51-
Rp, %2.46-
χ22.22-
RB, %1.35.9
Table 2. Oxidation kinetic characteristics of BaLaCuS3.
EffectExoExoExoExoExoExoExoExoEndoEndoEndoEndo
Heating Rate, °C/minNumber of Peak/Temperatures, °C
123456789101112
20390.3515.1537.3599.2746.2805.1892.9-1069.71098.51141.21162.5
15371.4511.7527.4595.2738.8788.3871.3937.81012.91032.111351159.4
10352.6508.1523.5591.8732.2760.9859.7908.51024.81036.81128.31158.2
3312.9495.2-587.2718.9721.7847.9861.81004.41028.31118.81153.5
1280479.2-567.2697.4703.3810.6-1005.31027.1-1150.2
Ea, kJ/mol774172706255262444352331000102014934348
A1·1048·10255·10158·10352·10257·1094·10176·1071·10382·10385·10532·10158
Table 3. Phase composition of BaLaCuS3 oxidation products at heating rate 15 °C/min.
Heating Stop Temperature, °CPeak NumberPhase CompositionNote
3801BaSO4 + CuLaS2 + BaLaCuS3halo at 20° 2θ
5182BaSO4 + CuLaS2 + BaLaCuS3halo increase
5603BaSO4 + CuLaS2 + BaLaCuS3halo increase
6304BaSO4 + CuLaS2 + BaLaCuS3halo increase
7605BaSO4 + LaCuOS + BaLaCuS3lack of halo
7906BaSO4 + LaCuOS
8727BaSO4 + LaCuOS
9408BaSO4 + LaCuOS + La2O2SO4formation Cu2O
10209BaSO4 + La2O2SO4 + Cu2O + CuOincrease in Cu2O
104510BaSO4 + La2O2SO4 + Cu2O + CuOdecrease in Cu2O
113711BaSO4 + La2O2SO4 + CuOhalo at 20° 2θ
116512BaSO4 + La2O2SO4 + CuO + La2CuO4
Table 4. Oxidation of BaLaCuS3 at heating rate 15 °C/min.
Temperature, °CChemical Process
380–739BaLaCuS3 + 2O2 = BaSO4 + CuLaS2
788–871CuLaS2 + 1.5O2 = LaCuOS + SO2
9386LaCuOS + 11O2 = 3La2O2SO4 + 2CuO/Cu2O + 3SO2
938–1032Cu2O + 0.5O2 = 2CuO
from 1135La2O2SO4 = La2O3 + SO2 + 0.5O2
from 1159La2O3+ CuO = La2CuO4
Table 5. Textural properties of BaLaCuS3.
BET, m2·g−1Micropore Volume, cm3·g−1BJH, cm3·g−1D *, μm
0.26980.0001430.00168111
* Average grain size according to SEM.
Disclaimer/Publisher’s Note: The statements, opinions and data contained in all publications are solely those of the individual author(s) and contributor(s) and not of MDPI and/or the editor(s). MDPI and/or the editor(s) disclaim responsibility for any injury to people or property resulting from any ideas, methods, instructions or products referred to in the content.