Abstract
The multi-component solid form of febuxostat (FEB) with p-toluenesulfonic acid was synthesized by solvent-drop grinding and cooling-evaporative crystallization and characterized by powder X-ray diffraction (XRPD), thermogravimetry (TGA), differential scanning calorimetry (DSC), and infrared spectroscopy (FT-IR). The multi-component form was stable after exposure at elevated temperature and relative humidity and powder dissolution measurements revealed five-fold aqueous solubility improvement relative to FEB. Additionally, the decrease in pH after dissolution suggests a potential for enhancing the drug absorption in the lower stomach. In the context of the regulatory requirements, the salt/co-crystal nature of the form was elucidated by a combination of crystallization process development and crystal growth, followed by SC-XRD and FT-IR. Despite the very weak basicity of the drug, crystal structure determination combined with spectroscopy analysis revealed salt formation by the transfer of the acidic proton from p-toluenesulfonic acid to FEB. Our study emphasizes the importance of the crystal structure knowledge in understanding the type of interactions present in multi-component crystals as well as complying with the specific regulatory requirements.
1. Introduction
Gout is a chronic form of inflammatory joint disease caused by the formation and deposition of monosodium urate crystals in joints and surrounding tissues, due to its saturation in the blood [1,2]. This disease is commonly characterized by hyperuricemia and recurrent attacks of acute arthritis and affect 1–2% of the world’s population, with levels increasing [3,4]. Hyperuricemia may exist for several years to decades before the first symptoms of gout attacks appear, which makes the disease strongly correlated with aging. The purpose of long-term treatment of chronic gout requires reduction in serum uric acid below the saturation level. Therefore, management of hyperuricemia in patients with gout is a complex matter; it requires special consideration because of contra-indications, co-medication, and the risk of adverse drug reactions [5,6].
The current treatment options for chronic gout are drugs that either increase uric acid total body clearance (e.g., Uricase or Uricosurics) or decrease uric acid production (e.g., Xanthine oxidase inhibitors). Despite the huge prevalence of the disorder, until recently, from the class of Xanthine oxidase inhibitors, Allopurinol was the only anti-hyperuricemic drug available worldwide [7,8]. In 2008 and 2009, the European Medicines Agency (EMEA) and Food and Drug Administration (FDA) approved febuxostat [8,9,10], a nonpurine selective xanthine oxidase inhibitor, which greatly expanded the treatment options for refractory or allopurinol-intolerant gout [11].
Febuxostat (designated as FEB), chemical name: 2-[3-cyano-4-(2-methylpropoxy) phenyl]-4-methylthiazole-5-carboxylic acid, is an active pharmaceutical ingredient (API), a weak acid (pKa = 3.42—strongest acidic and predicted pKa = 0.39—strongest basic) [12], practically insoluble in water (solubility of 12.9 μg/mL), and is considered to be a Class II compound on the Biopharmaceutics Classification Scale (BCS) [1]. As for many BCS class II drugs, the very low aqueous solubility of FEB is the limiting factor for its oral bioavailability (which is <50%) [13].
The improvement of a BCS class II drug solubility, thereby enhancing its oral bioavailability, remains one of the most challenging aspects of drug development process especially for an oral formulation. Altering the pharmacokinetic parameters of a drug is possible through the modification of the solid form, but this requires systematic crystal form screening complemented with specialized characterization tools [14]. In this context, finding new FEB solid forms with higher solubility and oral bioavailability can be the basis of a better product with higher bio-performance, easier formulation, and lower production or storage requirements [15].
At the moment, febuxostat is used as second-line treatment of hyperuricemia after Allopurinol because of the toxicity emerging from administration of a high oral dose (of 120 mg, once daily; according to the FDA). Although this was the most effective strength proposed for marked approval, the United States Food and Drug Administration (USFDA) has requested the withdrawal of the 120 mg tablet and instead recommended to add the lower strength of 40 mg (according to FDA). Besides the problem of low solubility, the pharmacokinetic profile of FEB after oral administration is characterized by a rapid absorption followed by a mean terminal elimination half-life (t½) of approximately 5–8 h [16], which does not achieve the prolonged inhibition of xanthine oxidase that is desired for an effective treatment. As a consequence, the only commercially available formulations of FEB are immediate-release tablets. In this context, finding a new FEB formulation that maintains the critical drug concentration for an extended period of time (i.e., 6–24 h after dosing) is expected to result in the higher efficacy of the drug [10].
In the search for the novel FEB forms with improved solubility and bioavailability, crystal engineering strategies such as co-crystallization [17,18,19,20] and salt formation [20,21,22,23,24] have been reported.
Various salt forms of FEB with counter-ions such as choline choline [21] 2-methylimidazole, 2-pyridylamine [22], 3-aminopyridine [20], imidazolium [24], and minoxidil [23] have provided novel ways to improve the aqueous solubility of FEB. Notably, to the best of our knowledge, no acidic counter-ions or co-formers were reported in this respect.
In the pharmaceutical industry, p-toluenesulfonic acid, an aromatic organic compound, is generally used as a counter-ion for basic drugs, due to its strong hydrophilic and acidic properties (pKa = −1.34) [25].
In the case of multi-component structures, the position of the hydroxyl H atom from the carboxylic acids plays an important role in judging the crystal form nature, namely a salt or a co-crystal. For very weak bases such as febuxostat (pKa = 0.39), there is an uncertainty of salt formation even with strong acids such as p-toluenesulfonic acid (pKa = −1.34). According to the ΔpKa rule proposed by Childs et al. [26], no proton transfer would be expected to occur from the p-toluenesulfonic acid to febuxostat, given the too-small pKa difference between the two components (ΔpKa < 2). Therefore, the febuxostat–p-toluenesulfonic acid multi-component solid form is likely to be a co-crystal, while being presumed to be a salt in the literature. The tosylate salt of febuxostat was disclosed in the patent WO 2012/020272 A2 [27], but the structure has not been determined, and therefore the salt nature has not actually been confirmed. From a regulatory perspective, knowledge of the salt/co-crystal nature is of high importance, as co-crystals are clearly distinguished from salts by the USFDA [28].
The purpose of the present study was to provide the crystalline structure and to elucidate the salt or co-crystal nature of this solid form comprising febuxostat and p-toluenesulfonic acid (see Scheme 1). Furthermore, this work presents a systematic approach of crystallization process development and crystal growth, followed by characterization and aqueous solubility determination of the multi-component solid form, designated as Tos1.
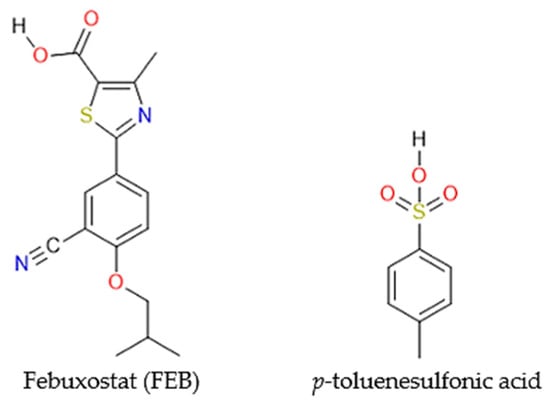
Scheme 1.
Chemical structures of the Tos1 components.
2. Materials and Methods
2.1. Materials
Febuxostat and p-toluenesulfonic acid were purchased from Tokyo Chemical Industry, Japan, and used without further purification. These compounds were initially characterized by X-ray powder diffraction (XRPD). All other reagents used in this research work were of analytical grade.
2.2. Preparation Methods of the Tos1 Form
Tos1 was obtained in a crystallization screen of febuxostat, with p-toluenesulfonic acid used as the counter-ion/co-former (see Crystallization methods). The salt/co-crystal was obtained by different crystallization methods (solvent-drop grinding, cooling-evaporation, slurry) and solvents (THF, 2-ethoxyethanol), leading to powder-like materials.
Subsequently, the Tos1 crystallization process was investigated in a controlled manner using Crystal16™. The purpose was to establish the crystallization parameters by determining the Meta-stable Zone Width (referred to as MSZW) (see MSZW determination). The next step was to use the optimal crystallization parameters to grow suitable crystals for SC-XRD (see scale-up and crystal growth).
- -
- Crystallization methods
- Solvent-drop grinding
Tos1 was also obtained with febuxostat (form A) in the solvent-drop grinding experiment in 2-ethoxyethanol mixed with p-toluenesulfonic acid as counter-ion. The required amounts of drug and counter-ion were ground together with 40 μL of 2-ethoxyethanol to produce a fine powder. The ratio of the two compounds was 1:1. Solvent-drop grinding was performed in a Retsch ball mill in a 1 h step, at 30 Hz. After grinding, the solid was air-dried for 24 h and analysed by XRPD, indicating the occurrence of the crystalline salt/co-crystal, Tos1.
- Cooling evaporation in 2-ethoxyethanol and THF
Tos1 was also obtained with febuxostat in the cooling evaporation experiment in 2-ethoxyethanol and THF, mixed with p-toluenesulfonic acid as counter-ion. Accurate amounts of febuxostat (form A) and p-toluenesulfonic acid were weighted, in order to have a 1:1 ratio. A suspension was prepared at room temperature by adding a volume of 3000 µL of 2-ethoxyethanol/THF to approximately 50 mg of starting material mixed with 30.4 mg of p-toluenesulfonic acid. The sample was vortexed for 10–20 s for homogenization, followed by heating at 60 °C for 30 min. The resulting suspension was then cooled to room temperature (for 2 h), followed by aging at 5 °C for 16 h. After completing the aging time, the vial was opened, decanted, and air-dried at room temperature for 2–7 days. The experiment led to powder, which was further analysed by XRPD, indicating the occurrence of the crystalline salt/co-crystal, Tos1.
- -
- MSZW determination
Four 1.5 mL clear glass vials were filled with febuxostat (form A) and p-toluenesulfonic acid, in a 1:1 ratio. A total of 500 µL of solvent was added to the solids mixture along with a magnetic stir bar. Initially, a wide range of concentrations (10, 15, 20, 25, 90, 120, 240, and 360 mg/mL) and two solvent systems (2-ethoxyethanol and THF) were tested. Subsequently, the MSZW was determined in 2-ethoxyethanol at low concentrations: 10, 15, 20, and 25 mg/mL. The resulting suspensions were subjected to two heating–cooling cycles as follows: 20 °C for 1 min, ramped up to 90 °C at 0.5 °C/min, held for 5 min, ramped down to 5 °C at 0.5 °C/min, held for 60 min. The two cycles were run on a Crystal16™ (Technobis Crystallization Systems BV, Alkmaar, The Netherlands), and transmission was monitored as a sign of solubilization using the instrument’s internal monitoring system. Stirring was kept constant at 600 rpm throughout the cycles. Precipitation on cooling was consistently achieved in all experiments, resulting in the MSZW determination. The wet solids were analysed by XRPD, indicating the presence of Tos1.
- -
- Scale-up and crystal growth
- Gram-scale by cooling-evaporation in THF
Tos1 was obtained on a 1.5 g scale by the cooling-evaporation experiment in THF. Accurate amounts of febuxostat (form A) and p-toluenesulfonic acid were weighted in order to have a 1:1 ratio. A suspension was prepared at room temperature (RT) by adding a volume of 100 mL of THF to approximately 1.5 g of febuxostat mixed with 0.911 g of p-toluenesulfonic acid. The sample was vortexed for 10–20 s for homogenization, followed by heating at 60 °C for 30 min. The resulting suspension was then cooled to room temperature (for 2 h), followed by aging at 5 °C for 16 h. After completing the aging time, the vial was opened, and solids were decanted and air-dried at room temperature for 4 days. The experiment led to powder, which was further analysed by XRPD, indicating the occurrence of Tos1. The crystalline salt/co-crystal formation was further confirmed by FT-IR, DSC, and TGA.
- Crystal growth
Crystals of Tos1 were obtained by designing a cooling-evaporation experiment in 2-ethoxyethanol from the determined MSZW.
Accurate amounts of febuxostat (form A) and p-toluenesulfonic acid were weighted in order to have a 1:1 ratio. A suspension was prepared at room temperature (RT) in 2-ethoxyethanol to a febuxostat concentration of 12 mg/mL. The sample was vortexed for 10–20 s for homogenization, followed by heating at 60 °C for 30 min and slow cooling to room temperature (0.1 °C/min). The cycle was repeated twice followed by aging at RT for 24 h. After completing the aging time, the vial was opened, and the solvent was slowly evaporated at RT for 7 days (open vial with perforated parafilm). The experiment led to powder with tiny, plate-like crystals.
2.3. Methods for Evaluation
2.3.1. X-ray Powder Diffraction (XRPD) Studies
X-ray powder diffraction (XRPD) measurements were performed with the X-ray powder diffractometer Bruker D8 Advance at room temperature, using a copper-filled X-ray tube (40 kV × 40 mA) as the X-ray source, CuKα (λ = 1.5418 Å), a 0.6 mm high divergence slit, a 0.0125 mm Ni filter (8.26% absorption), and 2.5° Soller slits on both the primary and secondary beams. Data were collected with a linear LynxEye detector with a 2.91593° solid angle, in the range of 3.8–33° 2θ with 0.02° increments, at a scan speed of 0.3 s/step.
2.3.2. Differential Scanning Calorimetry Study
Approximately 3–4 mg powder samples were used for differential scanning calorimetry (DSC) analysis. The DSC analysis was performed with a Mettler Toledo DSC3 calorimeter at the heating rate of 10 °C/min in a crimped aluminium sample cell with a lid and a synthetic air flow of 100 mL/min. A temperature range of 30–270 °C was scanned.
2.3.3. Thermogravimetric Analysis
Thermogravimetric analyses (TGA) were performed using a Mettler Toledo TGA 2 instrument under 100 mL/min synthetic air flow, using open alumina pans; a 10 °C/min heating rate was employed in the measurements. Approximately 4–7 mg powder samples were used for TGA analysis.
2.3.4. Fourier Transform Infrared Spectroscopy
A Thermo Scientific NicoletTM iS50 FT-IR instrument was used to record the Fourier Transform Infrared Spectra (FT-IR) in the 400–4000 cm−1 domain. An ATR multirange diamond sampling station was used to record the spectra in transmittance mode. A total of 64 scans were collected for the background, with a resolution of 4. The software used for the data analysis was OriginPro 8.5.
2.3.5. Powder Dissolution Measurement
In situ powder dissolution experiments were performed with a μDISS Profiler apparatus (pION Inc., Billerica, MA, USA). The system consisted of an integrated diode array spectrophotometer connected to a fibre optic UV probe located directly in the reaction vessel (20 mL vial) and measured the concentration as a function of time, without filtering the solution. Measurement of the dissolution kinetics was carried out over a broad spectral range (200–400 nm). The dissolution was performed in distilled water, at a concentration of 1 mg/mL. The process was closely monitored for 85 min, followed by the collection of a few data points up to 8 h to check for possible concentration changes. Dissolution of Tos1 was monitored at 260 nm (see Figure S5), while FEB was monitored at 290 nm (see Figure S3). After the dissolution experiment, XRPD was carried out on the undissolved solids (see Figure S6).
- Determination of calibration curves
10 mg/mL stock solution of febuxostat was prepared in ethanol:DMF = 95:5. The calibration curve determination was performed in 10 mL ethanol, using the stock solution of febuxostat at concentrations of 4.99, 9.99, 14.97, 29.91, 44.79, 59.64, 74.44, 89.19 and 108.80 µg/mL (see Figure S1). The absorption curve showed a characteristic absorption maxima at 315 nm for FEB, and the 290 nm wavelength was used for the calibration curve (see Figure S2). The optimum wavelength of Tos1 to assign the calibration curve was 260 nm (see Figure S4).
2.3.6. Stability Test
The crystalline form Tos1 was exposed for two weeks at 40 °C and 75% relative humidity (RH) to assess its physical stability in storage at elevated temperature and RH. After exposure, the solid was re-analysed by XRPD.
2.3.7. Single Crystal X-ray Diffraction (SC-XRD)
The crystals of Tos1 grew as agglomerations of plates (see Figure 8). One piece of a plate was broken from these agglomerations. The piece of crystal was handled at room temperature and placed in a drop of Infineum V8512, formerly known as Paratone®N oil (Sigma Aldrich, St. Louis, MO, USA). It was mounted on a MiTeGen MicromountTM (95 Brown Rd, Ithaca, NY, USA) and placed into the diffractometer. Data were collected using a Bruker D8 Venture diffractometer and processed with the APEX4 suite [29]. The structure was analysed by the intrinsic phasing method [30], which revealed the position of all non-hydrogen atoms. All atoms were refined on F2 by a full-matrix least-squares procedure using anisotropic displacement parameters [31]. All hydrogen atoms were located by difference Fourier maps, and most of them were included as fixed contributions riding on attached atoms with isotropic thermal displacement parameters 1.2 or 1.5 times those of the respective atom. Those hydrogen atoms involved in donor-acceptor H-bonding were refined freely and assigned using the HTAB instruction. Geometric calculations and molecular graphics were performed with Olex2 [32]. The crystallographic information file was deposited in the CSD database with the deposition number CCDC 2257786.
3. Results and Discussion
3.1. X-ray Powder Diffraction Analysis
XRPD is a reliable technique to characterize the nature of the new solid forms from crystallization experiments. For the multi-component forms, differences in the peaks of the new solid form compared to the peaks of the single components indicate the occurrence of a new form. As illustrated in Figure 1, the XRPD pattern of Tos1 is evidently different from that of febuxostat and p-toluenesulfonic acid. Thus, a new, multi-component form was obtained by the interaction between febuxostat and p-toluenesulfonic acid. Furthermore, Tos1 was found to be stable, showing no change of solid state after exposure at elevated temperature and relative humidity (Figure 2). For the Tos1 salt confirmation and transfer of the acidic proton, see the SC-XRD section below.
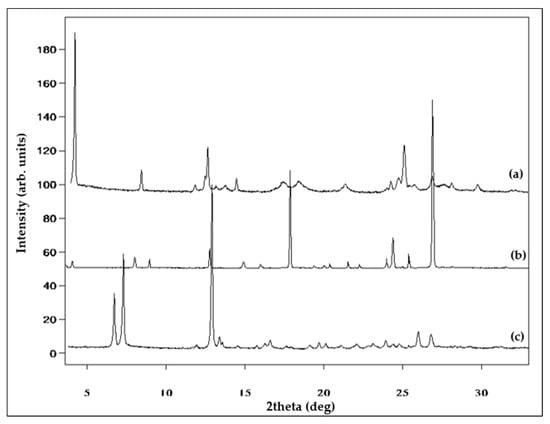
Figure 1.
Overlay of the XRPD pattern of (a) Tos1, (b) p-toluenesulfonic acid and (c) febuxostat (form A).
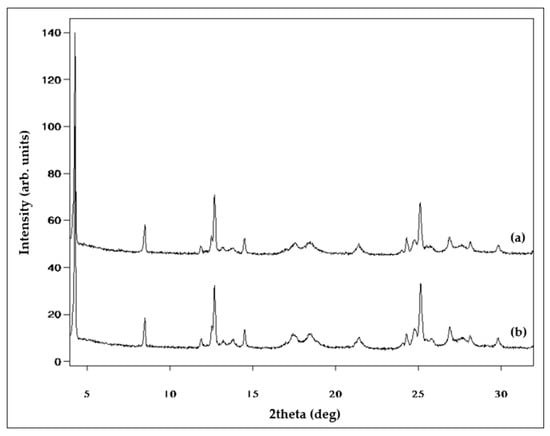
Figure 2.
Overlay of the XRPD patterns of (a) Tos1 after stability test (2 weeks at 40 °C/75% RH), (b) Tos1 before the stability test.
3.2. Thermal Analysis
The differential scanning calorimetry (DSC) and thermogravimetry (TGA) profiles of Tos1 are shown in Figure 3 and Figure 4.
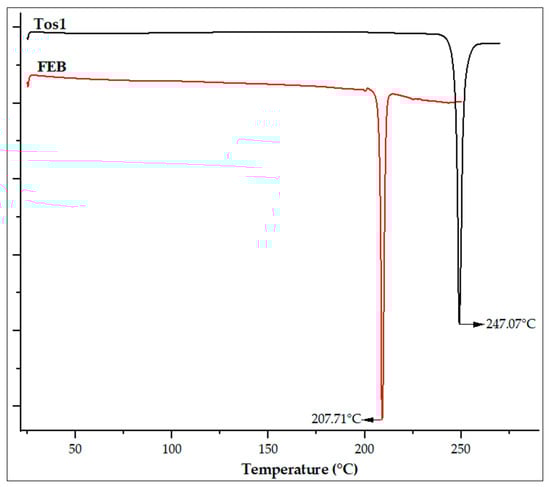
Figure 3.
DSC trace of Tos1 (black trace) in comparison with FEB (red trace).
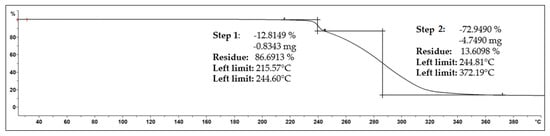
Figure 4.
TGA thermogram of Tos1.
The thermal behaviour of Tos1 was analysed by DSC and compared with the constituents. The Tos1 synthesized in this study has a melting point of 247.07 ± 0.2 °C, while the melting point of FEB form A is 207.71 ± 0.2 °C and of p-toluenesulfonic acid monohydrate form is 103–106 °C [33] (see Figure 3).
TGA analysis showed no weight loss up to the melting event at 215.5 ± 0.2 °C, indicating that Tos1 is an anhydrous form. A total weight loss taking place in two steps (step 1 → 12.81% up to 244.60 °C and step 2 → 72.94% up to 372.1 ± 0.2 °C) can be attributed to thermal degradation processes (see Figure 4).
3.3. Fourier Transform Infrared Spectroscopy
FT-IR spectra comparison of Tos1 versus FEB and p-toluenesulfonic acid is shown in Figure 5. The FT-IR spectrum of FEB showed peaks at 2962 cm−1 (O–H stretching of carboxylic acid), 2231 cm−1 (C≡N stretching of nitrile group), 1677 cm−1 (C, O stretching of carboxylic acid) and 1510 cm−1 (C=N stretch of thiazole ring). In the Tos1 multi-component crystal, the band corresponding to C=N (thiazole group of FEB) was down-shifted from 1510 cm−1 to 1476 cm−1, and the band corresponding to S=O shifted from 1166 cm−1 (SO3H sulfonic acid, in p-toluenesulfonic acid) to 1248 cm−1, suggesting the presence of the SO3− sulfonate in the Tos1 form. Furthermore, the peak from 1677 cm−1 corresponding to the C=O stretch of FEB was up-shifted to 1710 cm−1 in Tos1, due to the formation of a weak H-bond between FEB (-COOH carboxylic group) and p-toluenesulfonic acid (S=O group). This H-bond involving the COOH carboxylic group of FEB and the S=O sulfonate group is also evidenced by the appearance of a new C=O stretching peak at 1206 cm−1 (see Table S1).
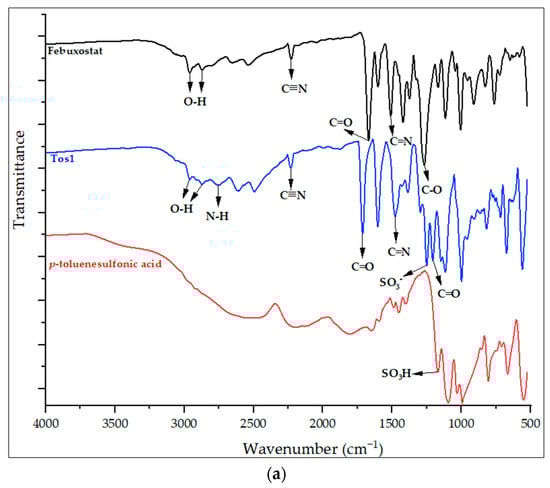
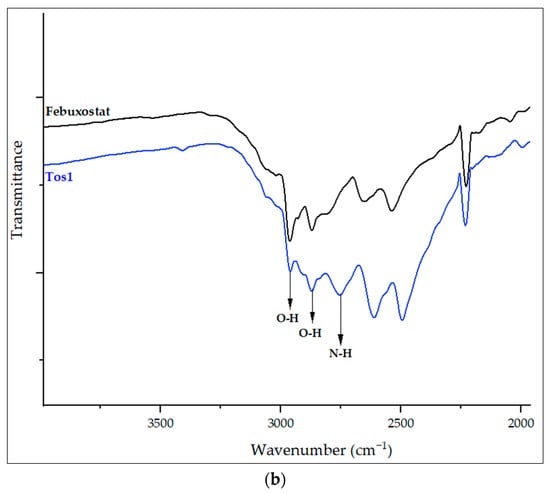
Figure 5.
The FT-IR spectra of Tos1 and FEB (a,b) zoom of FT-IR spectra at 1900–4000 cm−1.
Another relevant observation is that the FT-IR spectrum of Tos1 shows a distinctive band at 2750 cm−1, indicating the presence of an N–H stretching characteristic to an amine salt. The FT-IR comparative results show strong evidence of the salt formation by the transfer of the acidic proton from p-toluenesulfonic acid to FEB.
3.4. Powder Dissolution Study
The solubility experiments of FEB and Tos1 were performed in an aqueous medium. Tos1 displayed an increased kinetic solubility compared to febuxostat starting material (150 µg/mL—Tos1 versus 27 µg/mL—febuxostat). The saturation concentration of Tos1 seemed to be reached after the dissolution experiment, indicating at least 5× kinetic solubility increase compared to FEB (see Figure 6). In addition, the pH of the aqueous medium decreased from 7.3 (after dissolution of febuxostat) to 3.1 (after dissolution of Tos1), suggesting substantially enhanced absorption for Tos1 in the lower stomach. The undissolved solids of Tos1 after the dissolution experiment were analysed by XRPD, indicating solid form stability in aqueous suspension (see Figure S6).
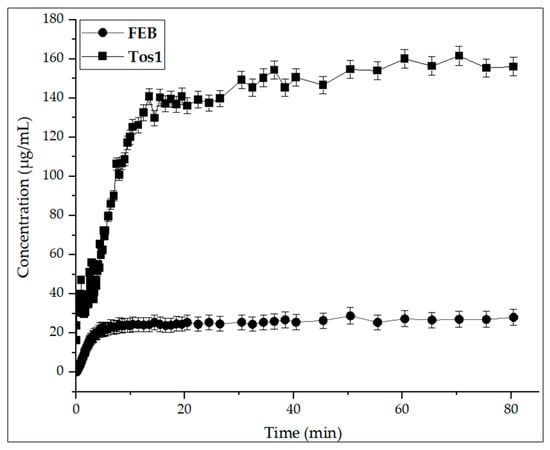
Figure 6.
The dissolution rate of Tos1 and the FEB pure drug in aqueous medium. Note that the initial dissolution rate of Tos1 is significantly faster than that of the parent FEB (±SD = 3%).
3.5. Crystal Growth and Crystal Structure Determination
3.5.1. Crystal Growth
The optimal method for controlled crystallization and crystal growth of Tos1 was established starting from the MSZW determined in 2-ethoxyethanol (see Figure 7). A cooling-evaporation crystallization was designed, considering a low initial concentration of 12 mg/mL, for which a large operation range was observed in the MSZW. In this way, full product dissolution did not require a temperature above 60 °C, while cooling at room temperature was expected to induce nucleation.
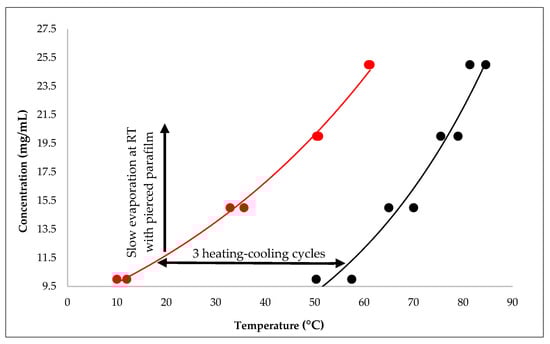
Figure 7.
The Meta-Stable Zone Width (MSZW) of Tos1. Arrows indicate the region of slow cooling and slow evaporation used for crystal growth. The black points indicate clear points (Van’t Hoff = 0.9485) and the red points indicate cloudy points (Van’t Hoff = 0.9971).
Crystal growth was achieved by applying three heating–cooling cycles in the MSZW range, followed by very slow evaporation at RT for 7 days (in open vial with perforated parafilm).
3.5.2. Crystal Structure of Tos1
The successful crystal growth experiments enabled crystal structure determination of Tos1. SC-XRD was performed on a thin, plate-like single crystal from the crystallization experiment in 2-ethoxyethanol (see Figure 8).
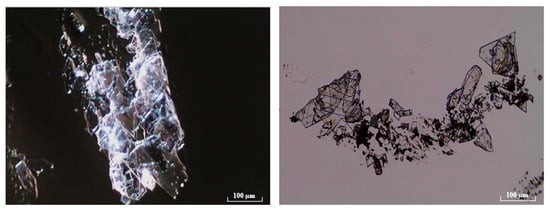
Figure 8.
Microscope images of Tos1 obtained in the crystal growth experiment.
Multiple pieces of crystals were used on the diffractometer; however, they were very thin, and the diffraction patterns were generally poor. Nevertheless, one small piece of crystal diffracted better than the others, up to a resolution of 0.98 Å, which can be considered sub-optimal in the context of determining ionization states. Low temperature (100 K) data collection was also attempted, but the crystals were too thin and became mechanically unstable, as reflections from a multi-crystalline system were observed during the data collection trials.
Consequently, we used the room temperature dataset and continued with the crystal structure determination, in the search for proof of the two chemical entities’ presence in the crystal lattice, as well as to gather information about their interaction and crystal packing.
The Tos1 (M = 488.58 g mol−1) structure was refined in the monoclinic space group P21/c (No. 14) with a = 21.057(1) Å, b = 7.5094(4) Å, c = 14.9814(8) Å, β = 91.187(1)°, V = 2368.5(2) Å3, Z = 4, T = 296.3(1) K, μ(CuKα) = 2.397 mm−1, Dcalc = 1.370 g cm−3, 13450 reflections measured (2.098° ≤ 2Θ ≤ 47.225°), with 2058 unique (Rint = 0.050, Rsigma = 0.0229), which were used in all calculations. The final R1 was 0.0734 (Fo > 4σ(Fo)), wR2 was 0.2212 (all data) and GooF = 1.232 (all data).
The crystal structure obtained suggests that the FEB molecule was protonated at the 1,3-thiazole N atom by accepting the acidic hydrogen atom from the p-toluenesulfonic acid (see Figure 9). However, the Tos1 ionization state could not be unequivocally stated considering the crystal and data set quality. Consequently, a refinement without the acidic proton was carried out (see Figure 10), revealing the position of the residual Q peak (Q1 in this case, 0.48 e− Å−3) with distances of dN1-Q1 = 1.22 Å and dQ1-O4′ = 1.48 Å (with an R1 value of 7.51 %). If the Q1 peak is assigned as a hydrogen atom and refined freely, the position refines clearly at the N1 atom, with a dN1-H1 of 1.15 Å. In the final refinement (structure uploaded), where an HTAB command was used [30], the H1 refines to a distance of dN1-H1 = 1.11(8) Å (dH1-O4′ = 1.60(8) Å).
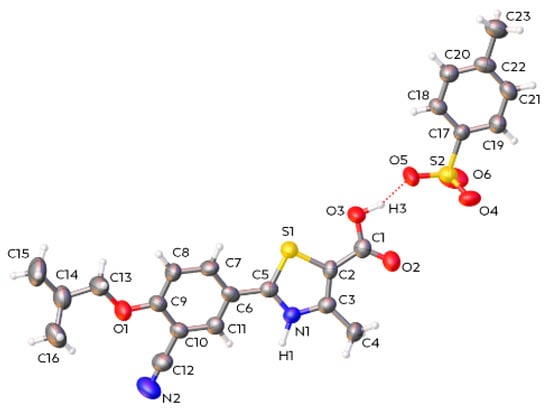
Figure 9.
Asymmetric unit found for Tos1. Thermal ellipsoids drawn at 50% probability level.
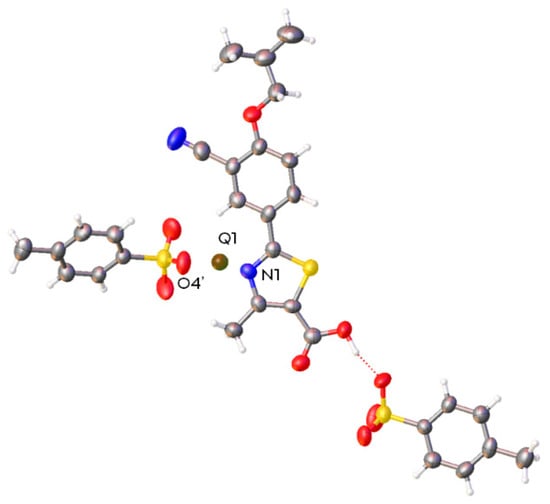
Figure 10.
Highest electron density peak Q1 found in the refinement of Tos1 when one missing hydrogen atom is not refined in the structure.
Furthermore, in order to bring additional evidence for the protonation of the febuxostat molecule in this data set, the Electron Density map produced [32] for both Fobs and Fcalc (see Figure 11) showed the high probability of finding the hydrogen atom in the proximity of the nitrogen atom.
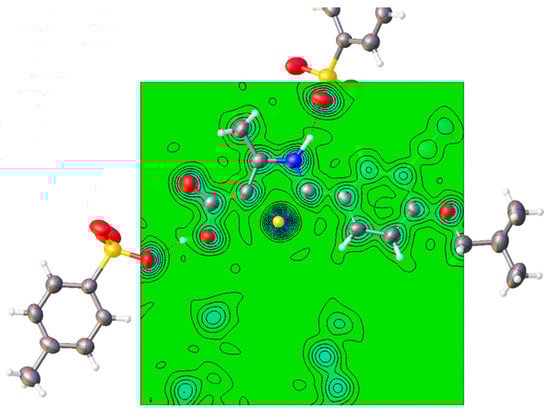
Figure 11.
Electron density map for Tos1 (Fcalc, Resolution 0.1 Å) showing that the acidic proton is most likely to be found on the nitrogen atom of febuxostat.
Therefore, considering the complementary evidence from SC-XRD and FT-IR, the salt character can be inferred for this system. In the Tos1 structure, the asymmetric unit (Z = 1) can be represented as [C16H17N2O3S]+ [C7H7O3S]− (i.e., [febuxostat]+ [tosylate]−). Figure 9 shows the molecular structure of the tosylate salt.
Each tosylate anion interacts as an acceptor with two different febuxostat cationic species (donors), giving a 2D “Zig-Zag” arrangement of the ions. Figure 12a shows this “Zig-Zag” interaction. The hydrogen bond interactions involved in the carboxylic acid group and the protonated 1–3 thiazole group are given in Table 1.
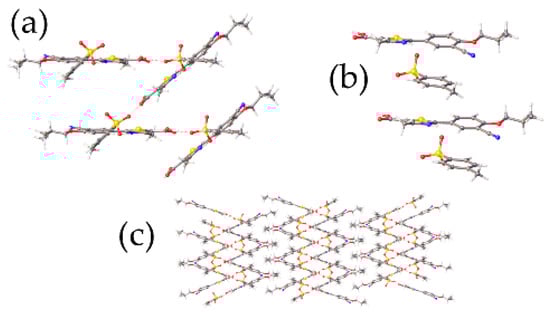
Figure 12.
(a) 2D “Zig-Zag” arrangement seen in the crystal lattice of Tos1, (b) representation of the π-π stacking seen in the unit cell of Tos1, (c) packing of the ions seen in Tos1; view along the 001 plane.

Table 1.
Hydrogen bonds for Tos1 salt (distance in Å, angles in °).
Other important interactions seen in Tos1 are the π-π stacking between the aromatic rings of the molecules. Figure 12b shows a view of this stacking between the tosylate anion and the FEB cation molecules. These interactions run almost parallel to the 0-b axis.
Despite the fact that p-toluenesulfonic acid is a strong acid, a co-crystal would be expected with FEB due to the very weak FEB basicity (ΔpKa < 2 of p-toluenesulfonic acid with respect to FEB). The crystal environment of Tos1 likely has a strong impact on the ionization state, leading to proton transfer and salt formation. A similar case, but with a favourable non-ionic interaction, was reported for the ketoconazole co-crystal with fumaric acid [34].
In order to compare the structure of Tos1 obtained from SC-XRD experiments with the bulk sample, a simulated XRPD from the SC-XRD analysis was done (Mercury 4.2.0 Build 257471, Copyright CCDC 2001–2019). Figure 13 shows the overlay of the simulated powder diffraction and the experimental XRPD of the bulk crystalline sample. Despite some preferred orientation effects induced by the plate-like morphology of the Tos1 crystallites, there is a good match of the signals, indicating that the crystal measured is representative of the bulk sample.
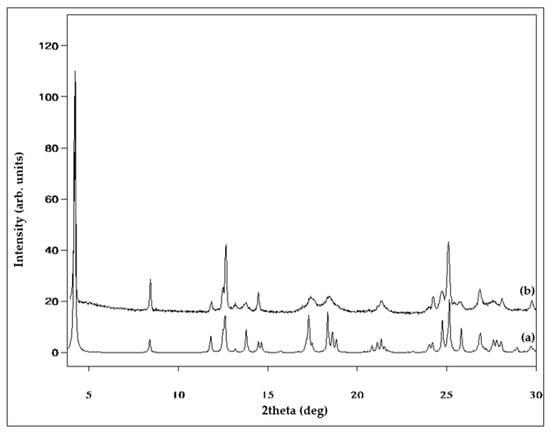
Figure 13.
Overlay of (a) the simulated powder pattern obtained from an SC-XRD experiment and (b) the XRPD pattern of the bulk material.
4. Conclusions
Febuxostat is a BCS class II drug used for gout management, for which multi-component solid forms such as salts and co-crystals may provide effective ways to improve the aqueous solubility. The solid form comprising febuxostat and p-toluenesulfonic acid was successfully synthesized and characterized, showing 500% kinetic solubility increase and a potential for improving drug absorption in the lower stomach. Crystal growth was achieved by a systematic approach to crystallization process development, which enabled crystal structure determination from single-crystal X-ray diffraction. Combined with FT-IT spectroscopic characterization, the crystal structure information resulted in the confirmation of its salt nature. Despite the very weak basicity of febuxostat, the tosylate salt was successfully formed by the transfer of the acidic proton from the p-toluenesulfonic acid to the 1,3-thiazole N atom of the drug. This work emphasizes the importance of the crystal structure knowledge in understanding the type of interactions present in multi-component crystals as well as complying with the specific regulatory requirements.
Supplementary Materials
The following supporting information can be downloaded at: https://www.mdpi.com/article/10.3390/cryst13050836/s1, Table S1: Characteristic peaks of Tos1 compared with peaks of FEB and p-toluenesulfonic acid; Figure S1: UV spectra of febuxostat standard solutions at different concentrations; Figure S2: Calibration curve of FEB using the absorbance data at 290 nm; Figure S3: Dissolution UV spectra of febuxostat at 1, 10, 30, 60, and 80 min; Figure S4: Calibration curve for Tos1 using the absorbance data at 260 nm; Figure S5: Dissolution UV spectra of Tos1 at 1, 10, 30, 60, and 80 min; Figure S6: XRPD analysis of the residual solid (a) after and (b) before the dissolution experiment.
Author Contributions
Conceptualization, D.T.U. and M.M.P.; methodology, D.T.U., G.S.-Q., T.L.T. and C.G.; validation, M.M.P. and C.A.I.; resources, G.S.-Q., C.G. and D.S.; writing—original draft preparation, D.T.U.; investigation, A.M.; writing—review and editing, G.S.-Q., M.M.P., T.L.T., C.G., D.S., A.M. and C.A.I. All authors have read and agreed to the published version of the manuscript.
Funding
This research received no external funding.
Data Availability Statement
The Crystallographic Information File and the structural data for this structure can be obtained from the CCDC, available as CCDC number 2257786.
Acknowledgments
We are thankful to Monica David and Claudia Brăilă from TeraCrystal, Cluj-Napoca, Romania for support with the powder dissolution study.
Conflicts of Interest
The authors declare no conflict of interest.
References
- Khosravan, R.; Grabowski, B.; Wu, J.T. Effect of food or antacid on pharmacokinetics and pharmacodynamics of febuxostat in healthy subjects. Br. J. Clin. Pharmacol. 2008, 65, 355–363. [Google Scholar] [CrossRef] [PubMed]
- Smith, E.U.R.; Diaz-Torne, C.; Perez-Ruiz, F.; March, L.M. Epidemiology of gout: An update. Best Pract. Res. Clin. Rheumatol. 2010, 24, 811–827. [Google Scholar] [CrossRef] [PubMed]
- Pisaniello, H.L.; Lester, S.; Gonzalez-Chica, D. Gout prevalence and predictors of urate-lowering therapy use: Results from a population-based study. Arthritis Res. Ther. 2018, 20, 143. [Google Scholar] [CrossRef] [PubMed]
- Dehlin, M.; Jacobsson, L.; Roddy, E. Global epidemiology of gout: Prevalence, incidence, treatment patterns and risk factors. Nat. Rev. Rheumatol. 2020, 16, 380–390. [Google Scholar] [CrossRef]
- Roubenoff, R. Gout and hyperuricemia. Rheum. Dis. Clin. North Am. 1990, 16, 539–550. [Google Scholar] [CrossRef] [PubMed]
- Palella, T.D.; Fox, I.H.; Scriver, C.R.; Beaudet, A.L.; Sly, W.S.; Valle, D. Hyperuricemia and gout. In The Metabolic Basis of Inherited Disease, 6th ed.; McGraw-Hill: New York, NY, USA, 2003. [Google Scholar]
- Alirezaei, A.; Argani, H.; Asgharpour, M.; Bahadorimonfared, A.; Bakhtiyari, M. An update on allopurinol and kidney failure; new trend for an old drug. J. Renal Inj. Prev. 2017, 6, 297–302. [Google Scholar] [CrossRef]
- Drugs@FDA, 021856s000_Cross. R. Available online: http://www.accessdata.fda.gov/drugsatfda_docs/nda/2009/021856s000_CrossR.pdf (accessed on 17 April 2023).
- Pascual, E.; Sivera, F.; Yasothan, U.; Kirkpatrick, P. Febuxostat. Nat. Rev. Drug Discov. 2009, 8, 191–193. [Google Scholar] [CrossRef]
- Uloric, Takeda Pharmaceuticals America, Inc. Available online: https://www.uloric.com/ (accessed on 17 April 2023).
- Burns, C.M.; Wortmann, R.L. Gout therapeutics: New drugs for an old disease. Lancet 2011, 377, 165–177. [Google Scholar] [CrossRef]
- DrugBank. Available online: https://go.drugbank.com/drugs/DB04854 (accessed on 19 April 2023).
- Tang, J.; Bao, J.; Shim, X.; Sheng, X.; Su, W. Preparation, optimisation, and in vitro–in vivo evaluation of febuxostat ternary solid dispersion. J. Microencapsul. 2018, 35, 454–466. [Google Scholar] [CrossRef]
- Newman, A.; Wenslow, R. Solid form changes during drug development: Good, bad, and ugly case studies. AAPS Open 2016, 2, 2. [Google Scholar] [CrossRef]
- Hilfiker, R.; Blatter, F.; von Raumer, M. Relevance of solid-state properties for pharmaceutical products. Polymorph. Pharm. Ind. 2006, 1, 1–19. [Google Scholar]
- Nomura, J.; Kobayashi, T.; So, A.; Busso, N. Febuxostat, a Xanthine Oxidoreductase Inhibitor, Decreases NLRP3-dependent Inflammation in Macrophages by Activating the Purine Salvage Pathway and Restoring Cellular Bioenergetics. Sci. Rep. 2019, 9, 17314. [Google Scholar] [CrossRef] [PubMed]
- Maddileti, D.; Jayabun, S.K.; Nangia, A. Soluble cocrystals of the xanthine oxidase inhibitor febuxostat. Cryst. Growth Des. 2013, 13, 3188–3196. [Google Scholar] [CrossRef]
- An, J.H.; Lim, C.; Ryu, H.C.; Kim, J.S.; Kim, H.M.; Kiyonga, A.N.; Jung, K. Structural characterization of febuxostat/l-pyroglutamic acid cocrystal using solid-state 13C-NMR and investigational study of its water solubility. Crystals 2017, 7, 365. [Google Scholar] [CrossRef]
- Kang, Y.; Gu, J.; Hu, X. Syntheses, structure characterization and dissolution of two novel cocrystals of febuxostat. J. Mol. Struct. 2017, 1130, 480–486. [Google Scholar] [CrossRef]
- Gao, L.; Zhang, X. Cocrystallization of Febuxostat with Pyridine Coformers: Crystal Structural and Physicochemical Properties Analysis. J. Chem. 2021, 2021, 3834368. [Google Scholar] [CrossRef]
- Han, X.; Qi, W.; Dong, W.; Guo, M.; Ma, P.; Wang, J. Preparation, optimization and in vitro–in vivo investigation for capsules of the choline salt of febuxostat. Asian J. Pharm. Sci. 2016, 11, 715–721. [Google Scholar] [CrossRef]
- Zhang, X.R.; Zhang, L. Simultaneous enhancements of solubility and dissolution rate of poorly water-soluble febuxostat via salts. J. Mol. Struct. 2017, 1137, 328–334. [Google Scholar] [CrossRef]
- Li, L.Y.; Du, R.K.; Du, Y.L.; Zhang, C.J.; Guan, S.; Dong, C.Z.; Zhang, L. Febuxostat-minoxidil salt solvates: Crystal structures, characterization, interconversion and solubility performance. Crystals 2018, 8, 85. [Google Scholar] [CrossRef]
- Gao, L.; Zhang, X.R.; Chen, Y.F.; Liao, Z.L.; Wang, Y.Q.; Zou, X.Y. A new febuxostat imidazolium salt hydrate: Synthesis, crystal structure, solubility, and dissolution study. J. Mol. Struct. 2019, 1176, 633–640. [Google Scholar] [CrossRef]
- Baghernejad, B. Application of p-toluenesulfonic Acid (PTSA) in Organic Synthesis. Curr. Org. Chem. 2011, 15, 3091–3097. [Google Scholar] [CrossRef]
- Childs, S.L.; Stahly, G.P.; Park, A. The salt−cocrystal continuum: The influence of crystal structure on ionization state. Mol. Pharm. 2007, 4, 323–338. [Google Scholar] [CrossRef]
- Pongo, L.; Balazs, V.; Jozsef, B.; Dancso, A.; Lukacs, G.; Tompe, P.; Szent-Kirallyi, Z. New Salts, Polymorphs and Solvates of a Pharmaceutical Active Ingredient. WO 2012/020272 A2, 16 February 2012. [Google Scholar]
- Kumar Bandaru, R.; Rout, S.R.; Kenguva, G.; Gorain, B.; Alhakamy, N.A.; Kesharwani, P.; Dandela, R. Recent advances in pharmaceutical cocrystals: From bench to market. Front. Pharmacol. 2021, 12, 2954. [Google Scholar] [CrossRef] [PubMed]
- Bruker APEX4, v2021.4-0; Bruker AXS: Billerica, MA, USA, 2021.
- Sheldrick, G.M. IUCr SHELXT–Integrated Space-Group and Crystal-Structure Determination. Acta Crystallogr. 2015, 71, 3–8. [Google Scholar]
- Sheldrick, G.M. Crystal Structure Refinement with SHELXL. Acta Crystallogr. C Struct. Chem. 2015, 71, 3–8. [Google Scholar] [CrossRef] [PubMed]
- Dolomanov, O.v.; Bourhis, L.J.; Gildea, R.J.; Howard, J.A.K.; Puschmann, H. OLEX2: A Complete Structure Solution, Refinement and Analysis Program. J. Appl. Crystallogr. 2009, 42, 339. [Google Scholar] [CrossRef]
- Sigma-Aldrich. Available online: https://www.sigmaaldrich.com/RO/en/product/sial/402885 (accessed on 21 April 2023).
- Martin, F.A.; Pop, M.M.; Borodi, G.; Filip, X.; Kacso, I. Ketoconazole salt and co-crystals with enhanced aqueous solubility. Cryst. Growth Des. 2013, 13, 4295–4304. [Google Scholar] [CrossRef]


Disclaimer/Publisher’s Note: The statements, opinions and data contained in all publications are solely those of the individual author(s) and contributor(s) and not of MDPI and/or the editor(s). MDPI and/or the editor(s) disclaim responsibility for any injury to people or property resulting from any ideas, methods, instructions or products referred to in the content. |
© 2023 by the authors. Licensee MDPI, Basel, Switzerland. This article is an open access article distributed under the terms and conditions of the Creative Commons Attribution (CC BY) license (https://creativecommons.org/licenses/by/4.0/).