Article

The Influence of Different Types of SiO2 Precursors and Ag Addition on the Structure of Selected Titania-Silica Gels

Material Science and Ceramics Department, AGH University of Science and Technology, Al. Mickiewicza 30, 30-059 Kraków, Poland
Crystals 2023, 13(5), 811; https://doi.org/10.3390/cryst13050811
Submission received: 28 February 2023 / Revised: 3 May 2023 / Accepted: 5 May 2023 / Published: 13 May 2023
(This article belongs to the Special Issue Polymorphism in Crystals)

Abstract

:
In this paper, samples of titania-silica system were obtained by the sol-gel method as bulk materials, using titanium propoxide Ti(C3H7O)4 to introduce titania and two precursors of SiO2: TEOS tetraethoxysilane Si(OC2H5)4 and DDS dimethyldiethoxysilane (CH3)2(C2H5O)2Si. To enhance antibacterial properties, Ag was added to gels of selected compositions. The main aim of the performed studies was to find the correlations between the structural changes and the applied precursor of silica. Simultaneously, the influence of different compositions of gels and the addition of Ag on the specimens’ structure was investigated. To study the structure, two complementary methods, FTIR (Fourier Transform InfraRed) spectroscopy and X-ray diffraction, were applied. The analysis of the FTIR spectra and the XRD patterns made it possible to confirm the amorphous state of all dried gels and establish the presence of TiO2 polymorphs: anatase and rutile in all annealed samples. The addition of Ag atoms into the gels caused the crystallization of cristobalite phase in addition to titania polymorphs. The presence of crystalline Ag phase in the annealed gels allowed the calculation dimensions of Ag crystallites based on the Scherrer equation. The use of DDS as a silica precursor led to easier and faster crystallization of different TiO2 phases in the annealed samples and parallel increases in the depolymerization of silica lattice.

1. Introduction

Titania-silica materials are widely applied in many fields because of their unique properties and usually simple preparation. They exhibit high self-cleaning and deodorising abilities [1,2,3,4,5], and possess good mechanical properties as well as high thermal stability [6,7]. Materials of TiO2-SiO2 systems can be applied in the form of monoliths or as coatings. As TiO2-SiO2 coatings, they can be anticorrosive and/or antibacterial layers [8]. More importantly, such thin films can be used in the field of human health protection because of their bioactivity, biocompatibility and antibacterial as well as anticorrosive behaviours [9,10,11].
Studies of the structure of TiO2-SiO2 samples have shown that they mainly consist of TiO2 molecules dispersed in a silica matrix. When titania concentration is low, one can observe TiO2 microcrystals that grow and thus cause the depolymerization of silica lattice during annealing [3,12]. These small titania crystals can act as crystallisation nuclei and decrease the temperature of crystallization in all phases of a sample.
One of the most often used methods of titania-silica material synthesis is the sol-gel method, which obtains highly homogenous samples of precisely defined compositions. Meanwhile, the structure of TiO2-SiO2 materials is very sensitive to the annealing procedure and the type of titania and silica precursors applied. In particular, the silica precursor plays an important role in porosity and influences the temperature of anatase-rutile transformation, as well as the rate of anatase crystallization [13,14]. Anatase and rutile are two of the most common titania polymorphs. They both crystallize in the tetragonal crystallographic system. There is also another form of TiO2, called brucite. Among these three polymorphs, rutile is the most thermodynamically stable. The anatase-rutile and brucite-rutile transformations are one-directional and irreversible.
Two SiO2 precursors were selected for the syntheses described in this work. TEOS (tetraethoxysilane Si(OC2H5)4) seems to be the most often applied component in the sol-gel method. The rate of hydrolysis and polycondensation of sols obtained using this silane depends on the pH of the solution and the catalysts involved. The quantity of water added during the synthesis also determines the structure of the polymer obtained [15,16,17]. DDS (dimethyldiethoxysilane (CH3)2(C2H5O)2Si) belongs to the group of siloxanes. The addition of DDS to sols containing TEOS can increase the time of gelation and the degree of hydrolysis and the polycondensation [17,18,19]. Materials containing TEOS and DDS possess hydrophobic and anti-reflective properties.
To enhance antibacterial properties of titania–silica gels, Ag was introduced into their structure. The antibacterial properties of silver have been well known for many years and have described in numerous articles [20,21,22]. Silver nanoparticles can penetrate the cell membranes of bacteria, destroying them or restricting their proliferation. Ag particles are characterised by high dispersion in the silica matrix, but can also act as the nuclei of crystallization [21].
The main aim of this work is to study the influence of different silica precursors on the structure of titania-silica gels of selected compositions. Additionally, the effect of Ag additives on the structure of selected gels is investigated.

2. Materials and Methods

As already mentioned, all materials in this study were synthesized by the sol-gel method. Gels of two compositions were planned to be obtained. In these samples, TiO2:SiO2 = 1:2 and 1:3 molar ratios were selected (Table 1). As the TiO2 precursor, commonly applied titanium propoxide Ti(C3H7O)4 (Aldrich 98%) was used, whereas, as SiO2 precursors—TEOS: tetraethoxysilane Si(OC2H5)4 (Aldrich 98%) and DDS: dimethyldiethoxysilane (CH3)2(C2H5O)2Si (Aldrich 97%) were applied. To study the influence of silver addition on the structure of the synthesized gels, Ag was introduced using silver nitrate AgNO3 (Chempur 99.9%) into the gel of TiO2:SiO2 = 1:3 ratio composition. In the samples where SiO2 was introduced simultaneously using two precursors, the constant TEOS:DDS = 1 molar ratio was maintained [18]. The content of Ag in the prepared sols corresponded to an Ag:Si = 1:24 molar ratio value.
As the first step, two one-component sols, the first containing silica and the second containing titania, were prepared. Then, they were mixed to obtain the planned TiO2:SiO2 = 1:2 and 1:3 molar ratios.
To synthesize a pure titania sol (2.5 wt. %), two separate solutions were prepared as the first step. The first contained 26.3 mL of ethanol (99.8%) and 4.4 mL of titanium propoxide. The second solution consisted of 2.9 mL of a redistilled water, 26.3 mL of ethanol (99.8%) and a low amount (0.9 mL) of an acetic acid (30% Aldrich). Each solution was homogenized and then the second solution was added dropwise to the one containing TiO2 precursor. The final solution was then homogenized for 30 min.
There were two procedures to obtain a silica sol, one only involved TEOS, and the second one used both TEOS and DDS. To obtain 5% silica sol, two separate solutions were again prepared. In the first, 48 mL of ethanol (99.8%) and 19 mL of TEOS were thoroughly homogenized. In parallel, the suspension of 6 mL of redistilled water, 48 mL of ethanol (99.8%) and 0.17 mL of HCL (30% Fluka) as a catalyst was obtained. After 10 min of homogenization, this last suspension was added dropwise to the solution of TEOS and homogenized for another 2 h.
To prepare SiO2 sol synthesised using both TEOS and DDS silica precursors, two solutions were prepared. The first solution contained 60 mL of ethanol (99.8%), 4.6 mL of TEOS and 3.5 mL of DDS, which were thoroughly homogenized for 20 min. The second prepared solution contained 33.3 mL of ethanol (99.8%) as a solvent, 0.9 mL of redistilled water and the addition of 0.3 mL of ammonia (30% Fluka) as a catalyst. After 20 min of homogenization, this last solution was very slowly added to the initial solution. The final silica sol was then stirred for another two and half of hours.
The addition of Ag atoms into the titania-silica structure was realized during the synthesis of sols. The proper amount of AgNO3 was weighed in the appropriate amount to attain the assumed Ag:Si = 1:24 ratio and the amount of silica in the prepared sol with TiO2:SiO2 = 1:3 (molar ratio) composition. This amount of AgNO3 (in the case of typical synthesis with TEOS and TEOS/DDS, 0.08409 g or 0.02242 g, respectively) was dissolved in 14 mL of ethanol (99.8%) and added dropwise to the final TiO2-SiO2 sol.
As previously mentioned, both sols, titania and silica (in two versions) were mixed at a proper molar ratio to synthesize gels of the selected compositions. After one month of drying in air, all samples were ground in an agate mortar and annealed at 1200 °C for one hour, in air.
The main goal of this work was to study the dependence of the structure of the synthesized materials on their composition and the applied SiO2 precursor. Thus, two complementary methods: IR spectroscopy and X-ray diffraction were applied. X-ray diffraction is suitable for crystalline samples, whereas FTIR (Fourier Transform InfraRed) spectroscopy allows the study of not only crystalline samples, but also amorphous or partially amorphous ones. The results obtained by both methods provide complete information on the far and near order in the crystalline lattice of materials.
FTIR spectra were collected on a Bruker 70 V IR spectrometer (Bruker, Billerica, MA, USA) at a resolution of 4 cm−1; measurements were run for the samples prepared as KBr pellets. All graphs were prepared using OPUS software bought together using the spectrometer.
All X-ray diffraction patterns were measured with an X’Pert diffractometer (Panalytical, Almelo, The Netherlands) using CuKα radiation and the standard Brag-Brentano configuration. All analyses and graphs were prepared using HighScore Plus software bought together with the equipment. The calculations of silver crystallite sizes were conducted based on the Scherrer equation and the Scherrer Calculator in HighScore Plus software:
D h k l = k λ β c o s θ
where:
β—the full width at half maximum, β = βobsβstand, [rad] or [°],
λ—the length of radiation applied (CuKα), λ = 0.15406 [nm],
θ—the peak position 2 θ [°],
k—Scherrer constant, k = 0.9,
Dhkl—the average crystallite size [nm] (the dimension perpendicular to the plane, which gave the reflection at the 2 θ position).
β in Scherrer Equation (1) means the corrected full width at half maximum (FWHM) of the selected diffraction peak and is determined by βobsβstand, where βobs is related to the sample peak and βstand is the FWHM of the standard (corundum α-Al2O3).
SEM measurements were run using the desktop scanning electron microscope Phenom XL (manufactured by Thermo Fisher Scientific, Waltham, MA, USA) and software Phenom Prosuite for collecting the EDS spectra. During SEM imaging, as well as during EDS measurements, an accelerating voltage of 15 kV was applied.

3. Results and Discussion

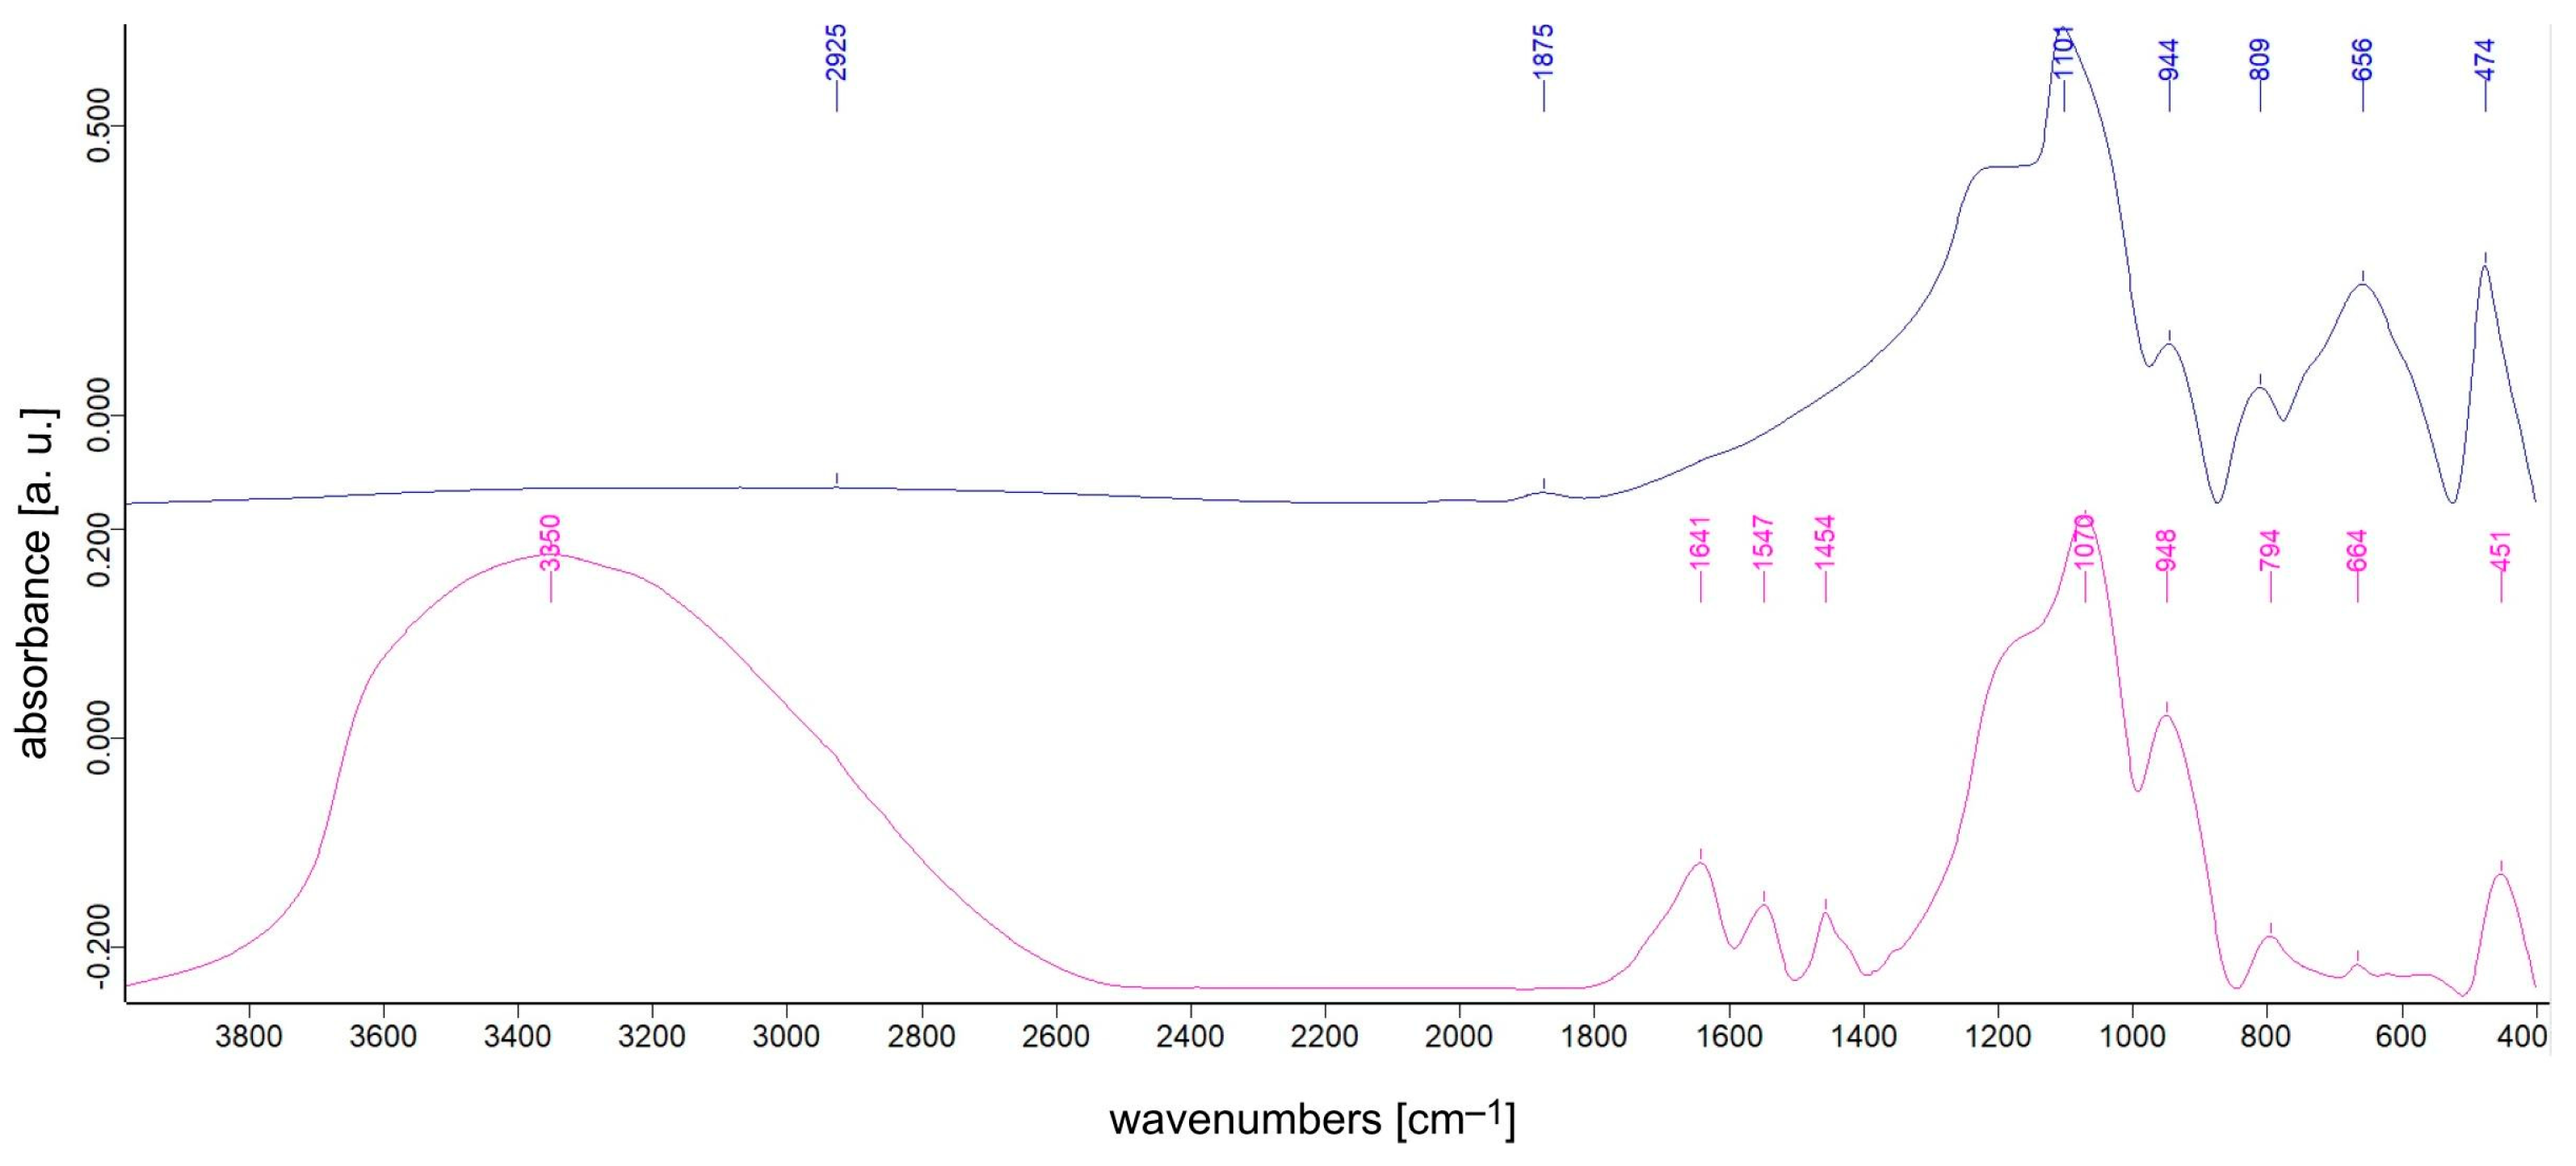
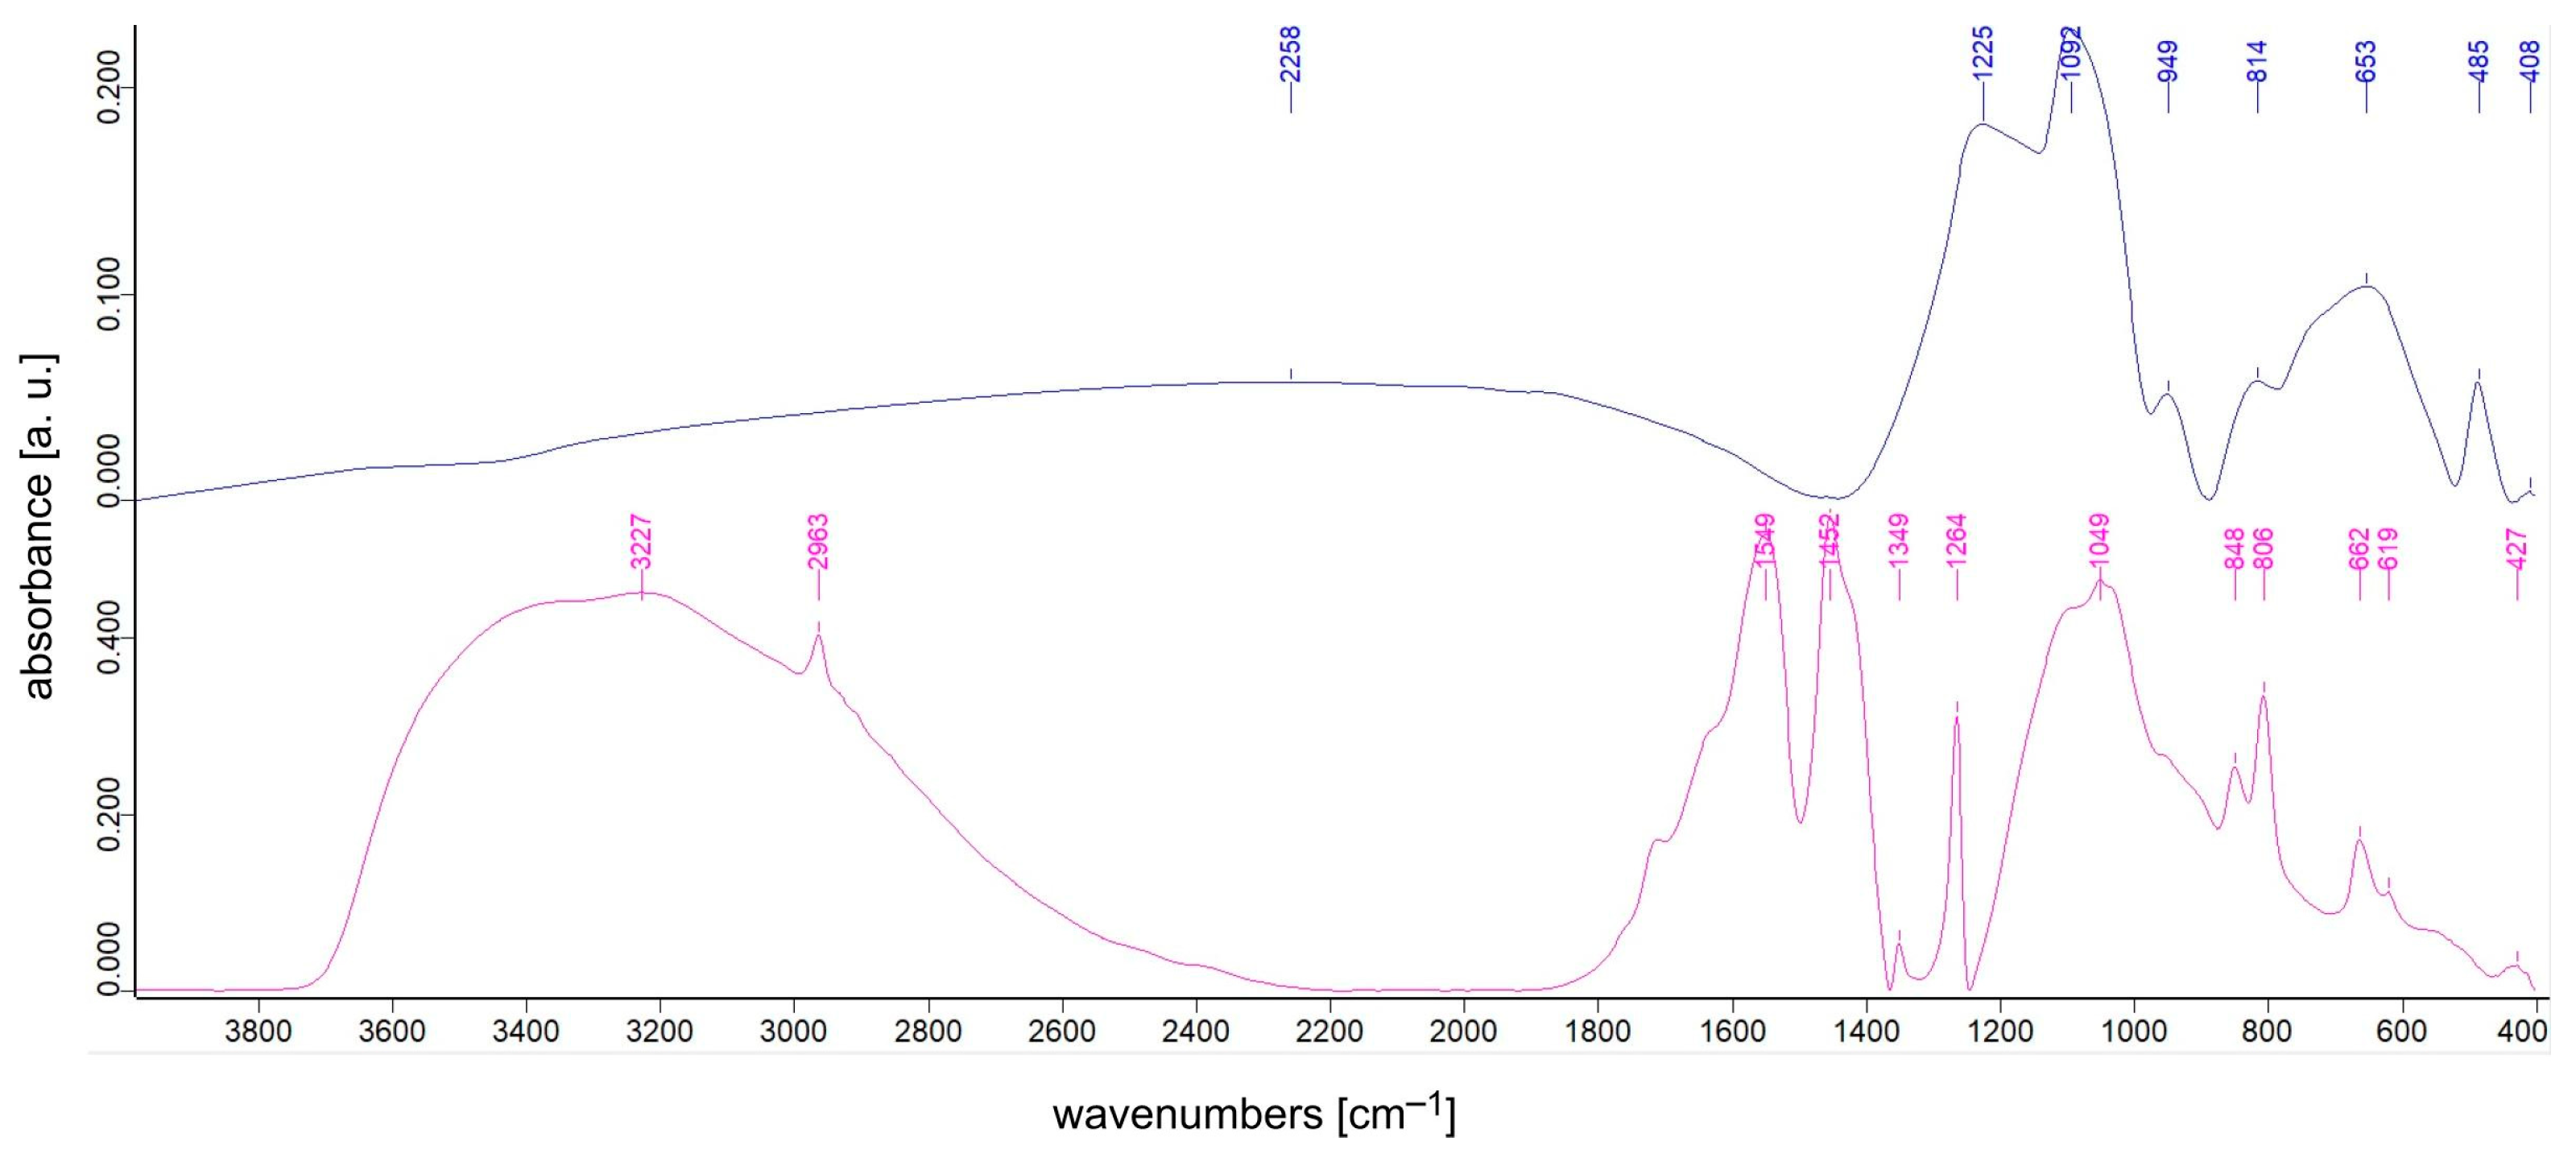
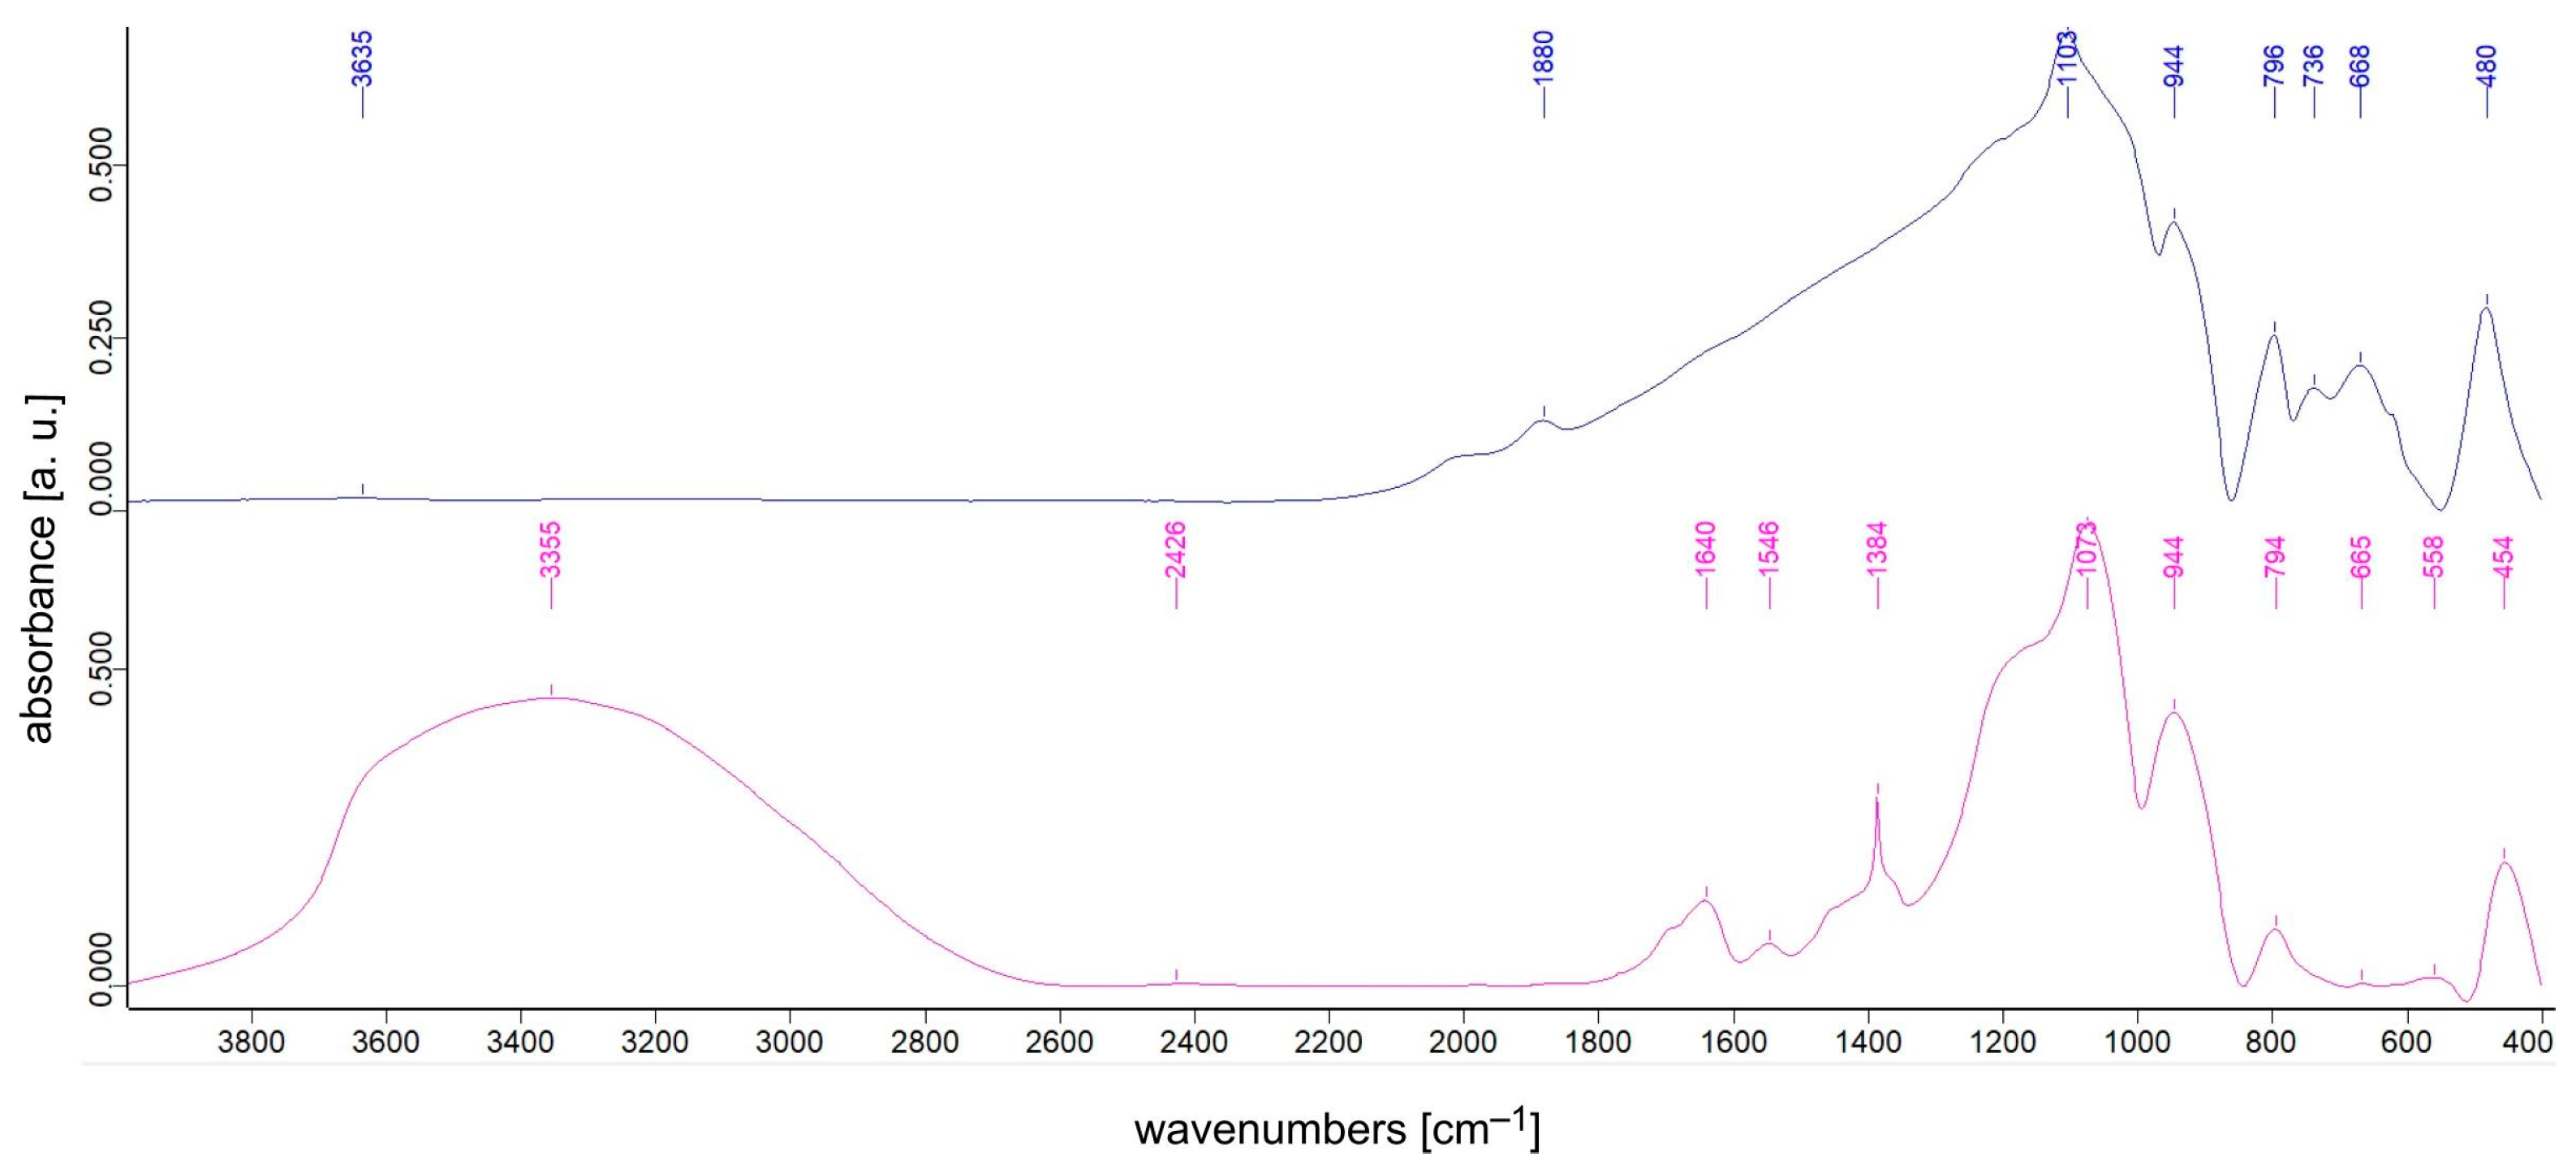
3.1. FTIR Spectroscopy Studies

The FTIR spectra of all gels are presented in Figure 1, Figure 2, Figure 3, Figure 4, Figure 5 and Figure 6. In each figure, IR spectra of a dried gel and a respective gel annealed at 1200 °C are compared.
In all IR spectra, one can distinguish three main groups of bands, located in the ranges of 940–1220 cm−1, 840–580 cm−1 and at around 470 cm−1 of what is visible, especially in the spectra of the annealed gels. In the FTIR spectra of dried gels, it is possible to distinguish additional bands at 1350–1540 cm−1, which can be assigned to the bending vibrations of C-H connections, bands assigned to the vibrations of OH groups at about 3500 cm−1 and bands at around 1650–1700 cm−1 ascribed to the vibrations in water molecules. All of these groups of bands disappeared after the annealing of gels.
The intensive band observed at around 470 cm−1 in all FTIR spectra can be assigned to bending vibrations of Si-O-Si bridges, while the bands at 790–800 cm−1 are probably due to the symmetric stretching vibrations of Si-O bonds. The most intensive band in all spectra, at around 1020–1100 cm−1, originates from the asymmetric stretching vibration of the Si-O bond [22]. There are other bands that can be assigned to the vibrations of Si-O bonds, at around 930 cm−1 and at around 1220–1260 cm−1. These bands can be connected with the vibrations of broken Si-O bridges and double Si=O bonds, respectively [23]. The band at 1260 cm−1 can be also assigned to C-H bond vibration in the Si-CH3 group.
There is one more intensive band located at around 650 cm−1m, which can only be observed in the spectra of the annealed gels, as well as of those synthesized with TEOS and with TEOS and DDS together. This band is probably due to stretching vibrations of the Ti-O bond, and its assignment is confirmed by the crystallization of TiO2 polymorphs (according the XRD results described in the next section) in the studied samples.
In the spectra of gels synthesized with the use of TEOS and DDS (Figure 3 and Figure 4), one can observe the increase in intensity of the bands at 1250 cm−1 and at 650 cm−1, even in the sample with a higher silica content. This change in the mentioned band intensity points to the depolymerization of silica lattice and the parallel increase in Ti-O bonds concentration in the structure of the annealed gels, which can be connected with the easier and faster crystallization of TiO2 phases in these samples (also confirmed by the XRD results).
The incorporation of Ag atoms into the titania-silica network does not cause distinct changes in the shapes of bands in the IR spectrum of the gel synthesized with the use of TEOS (Figure 5) and TEOS together with DDS (Figure 6), as compared to the IR spectra of samples of the same composition but without Ag addition (Figure 2 and Figure 4, respectively). There are only two small differences observed during the comparison: intensities of the bands at 1250 cm−1 and at around 650 cm−1 do not increase (Figure 5 and Figure 6), which indicates that, in these samples, the polymerization degree of the silica network does not decrease. The second difference is connected to the presence of a small band at 615 cm−1 in the spectrum of the annealed gel synthesized with TEOS (Figure 5). This band occurs in the range of pseudolattice bands in the spectrum and is not observed in the IR spectrum of the annealed gel synthesized with TEOS and DDS. The band at 615 cm−1 can be connected to the presence of Ag+ cations in the structure of the studied sample [3].

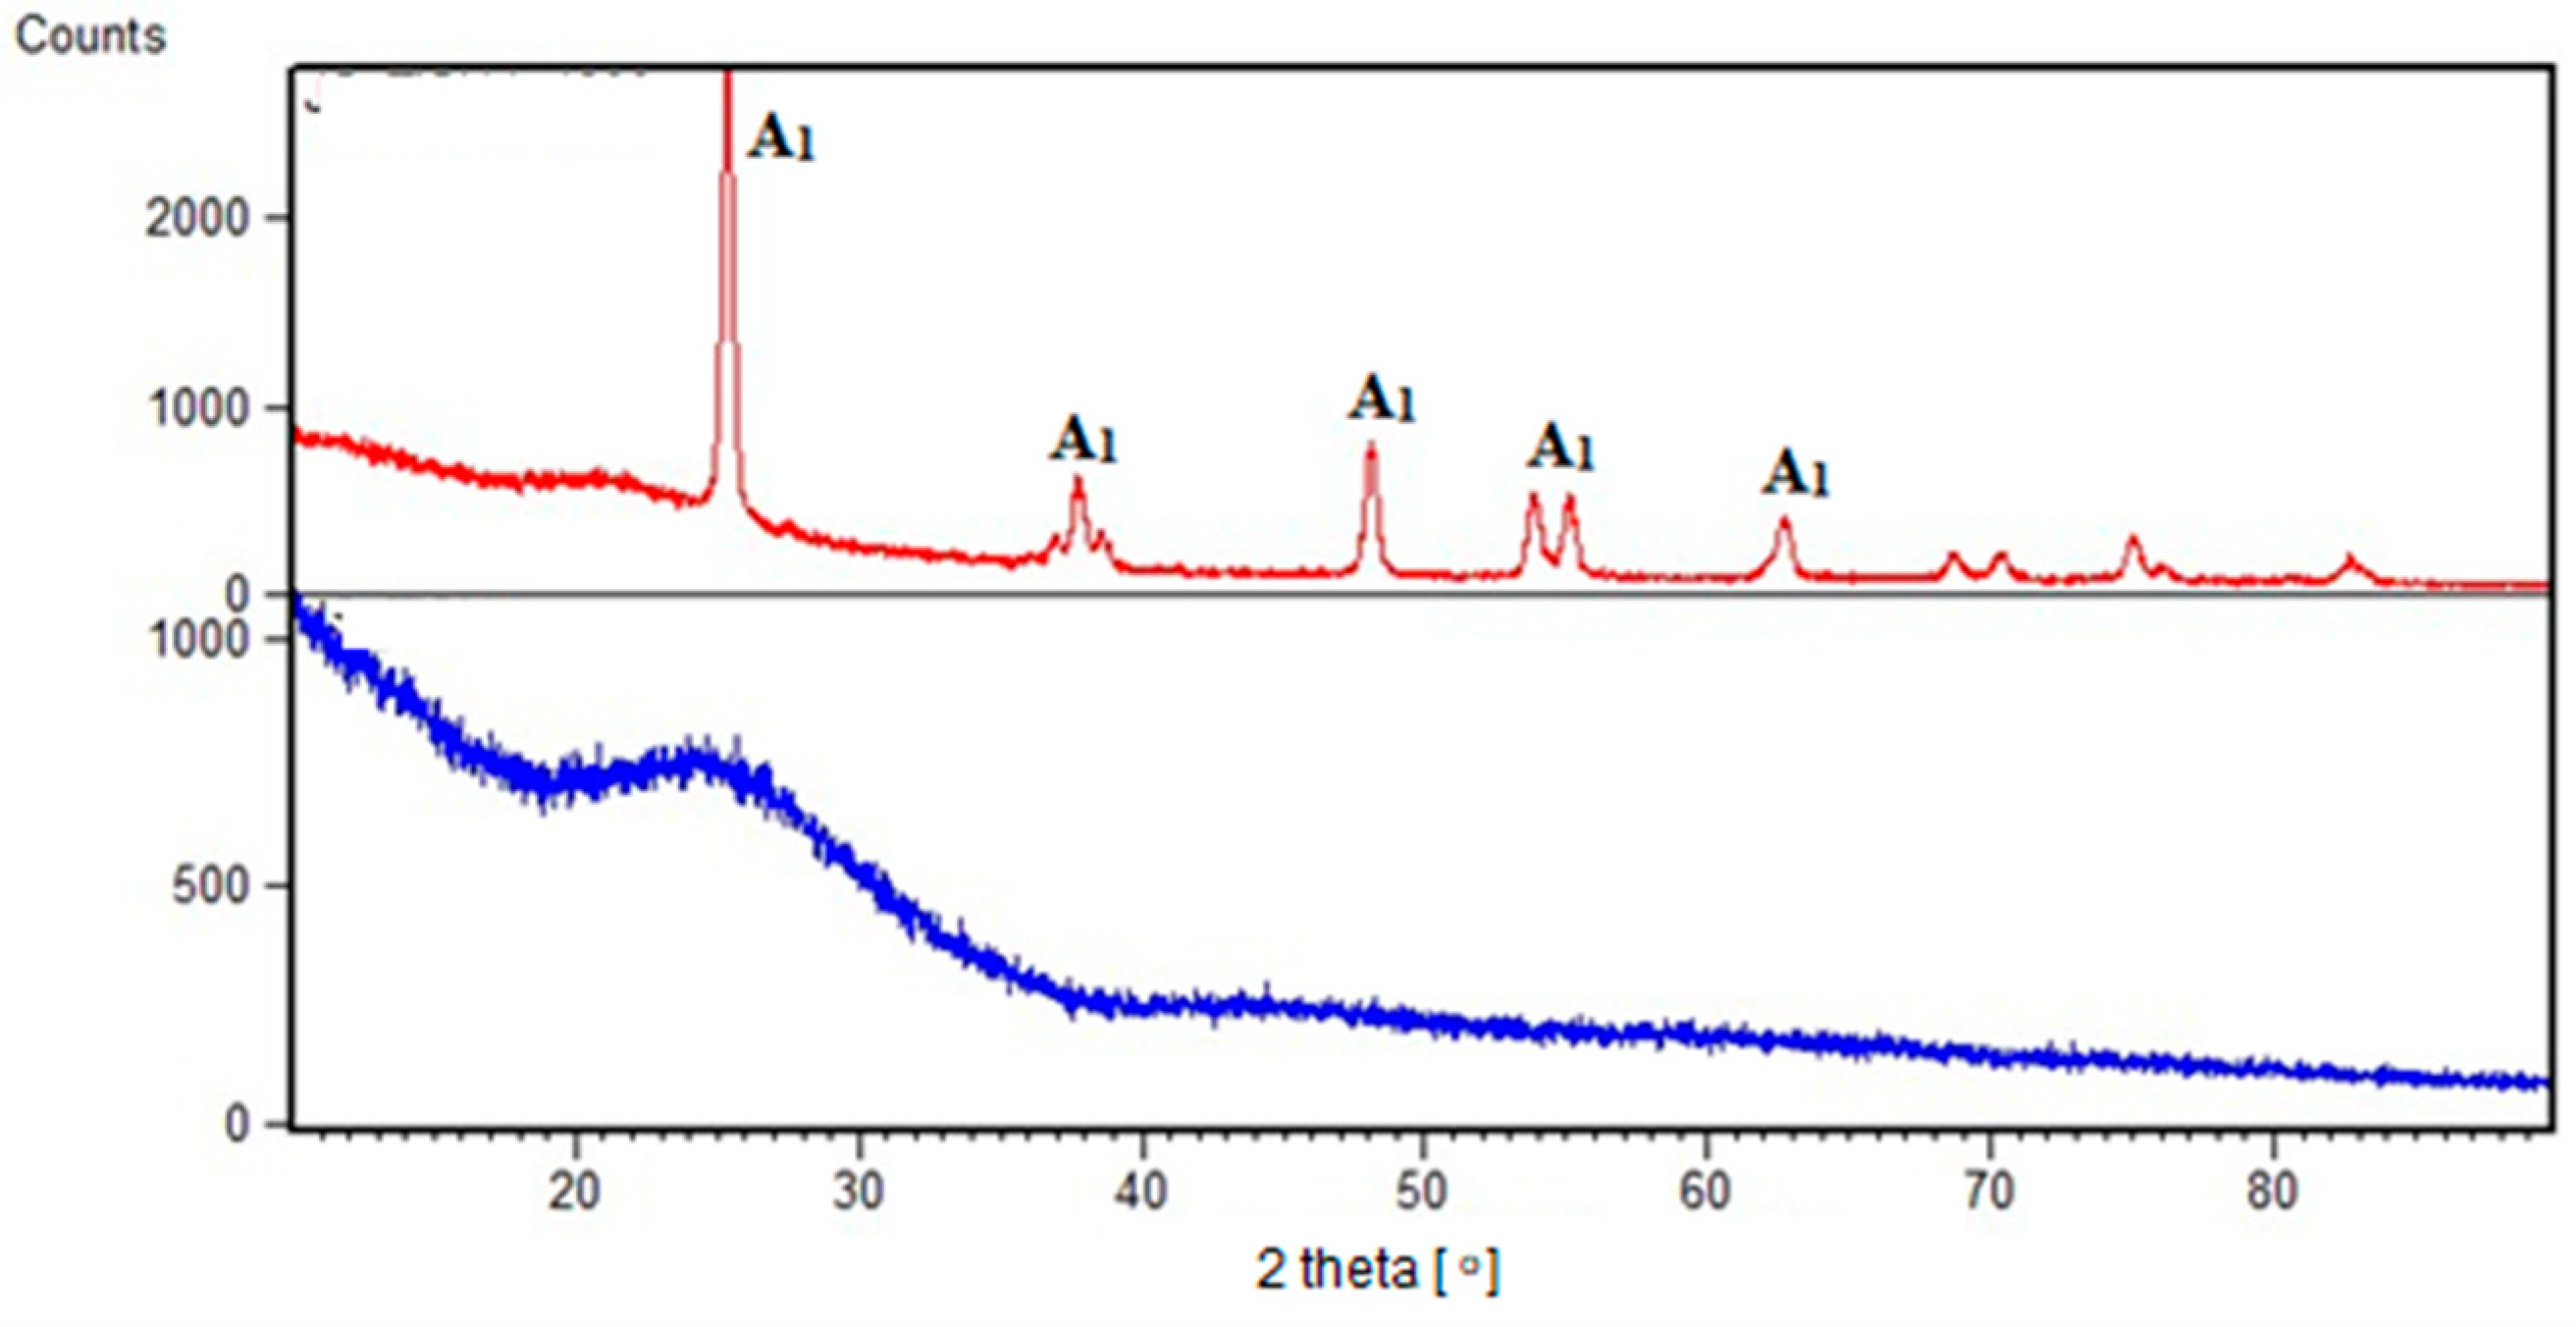
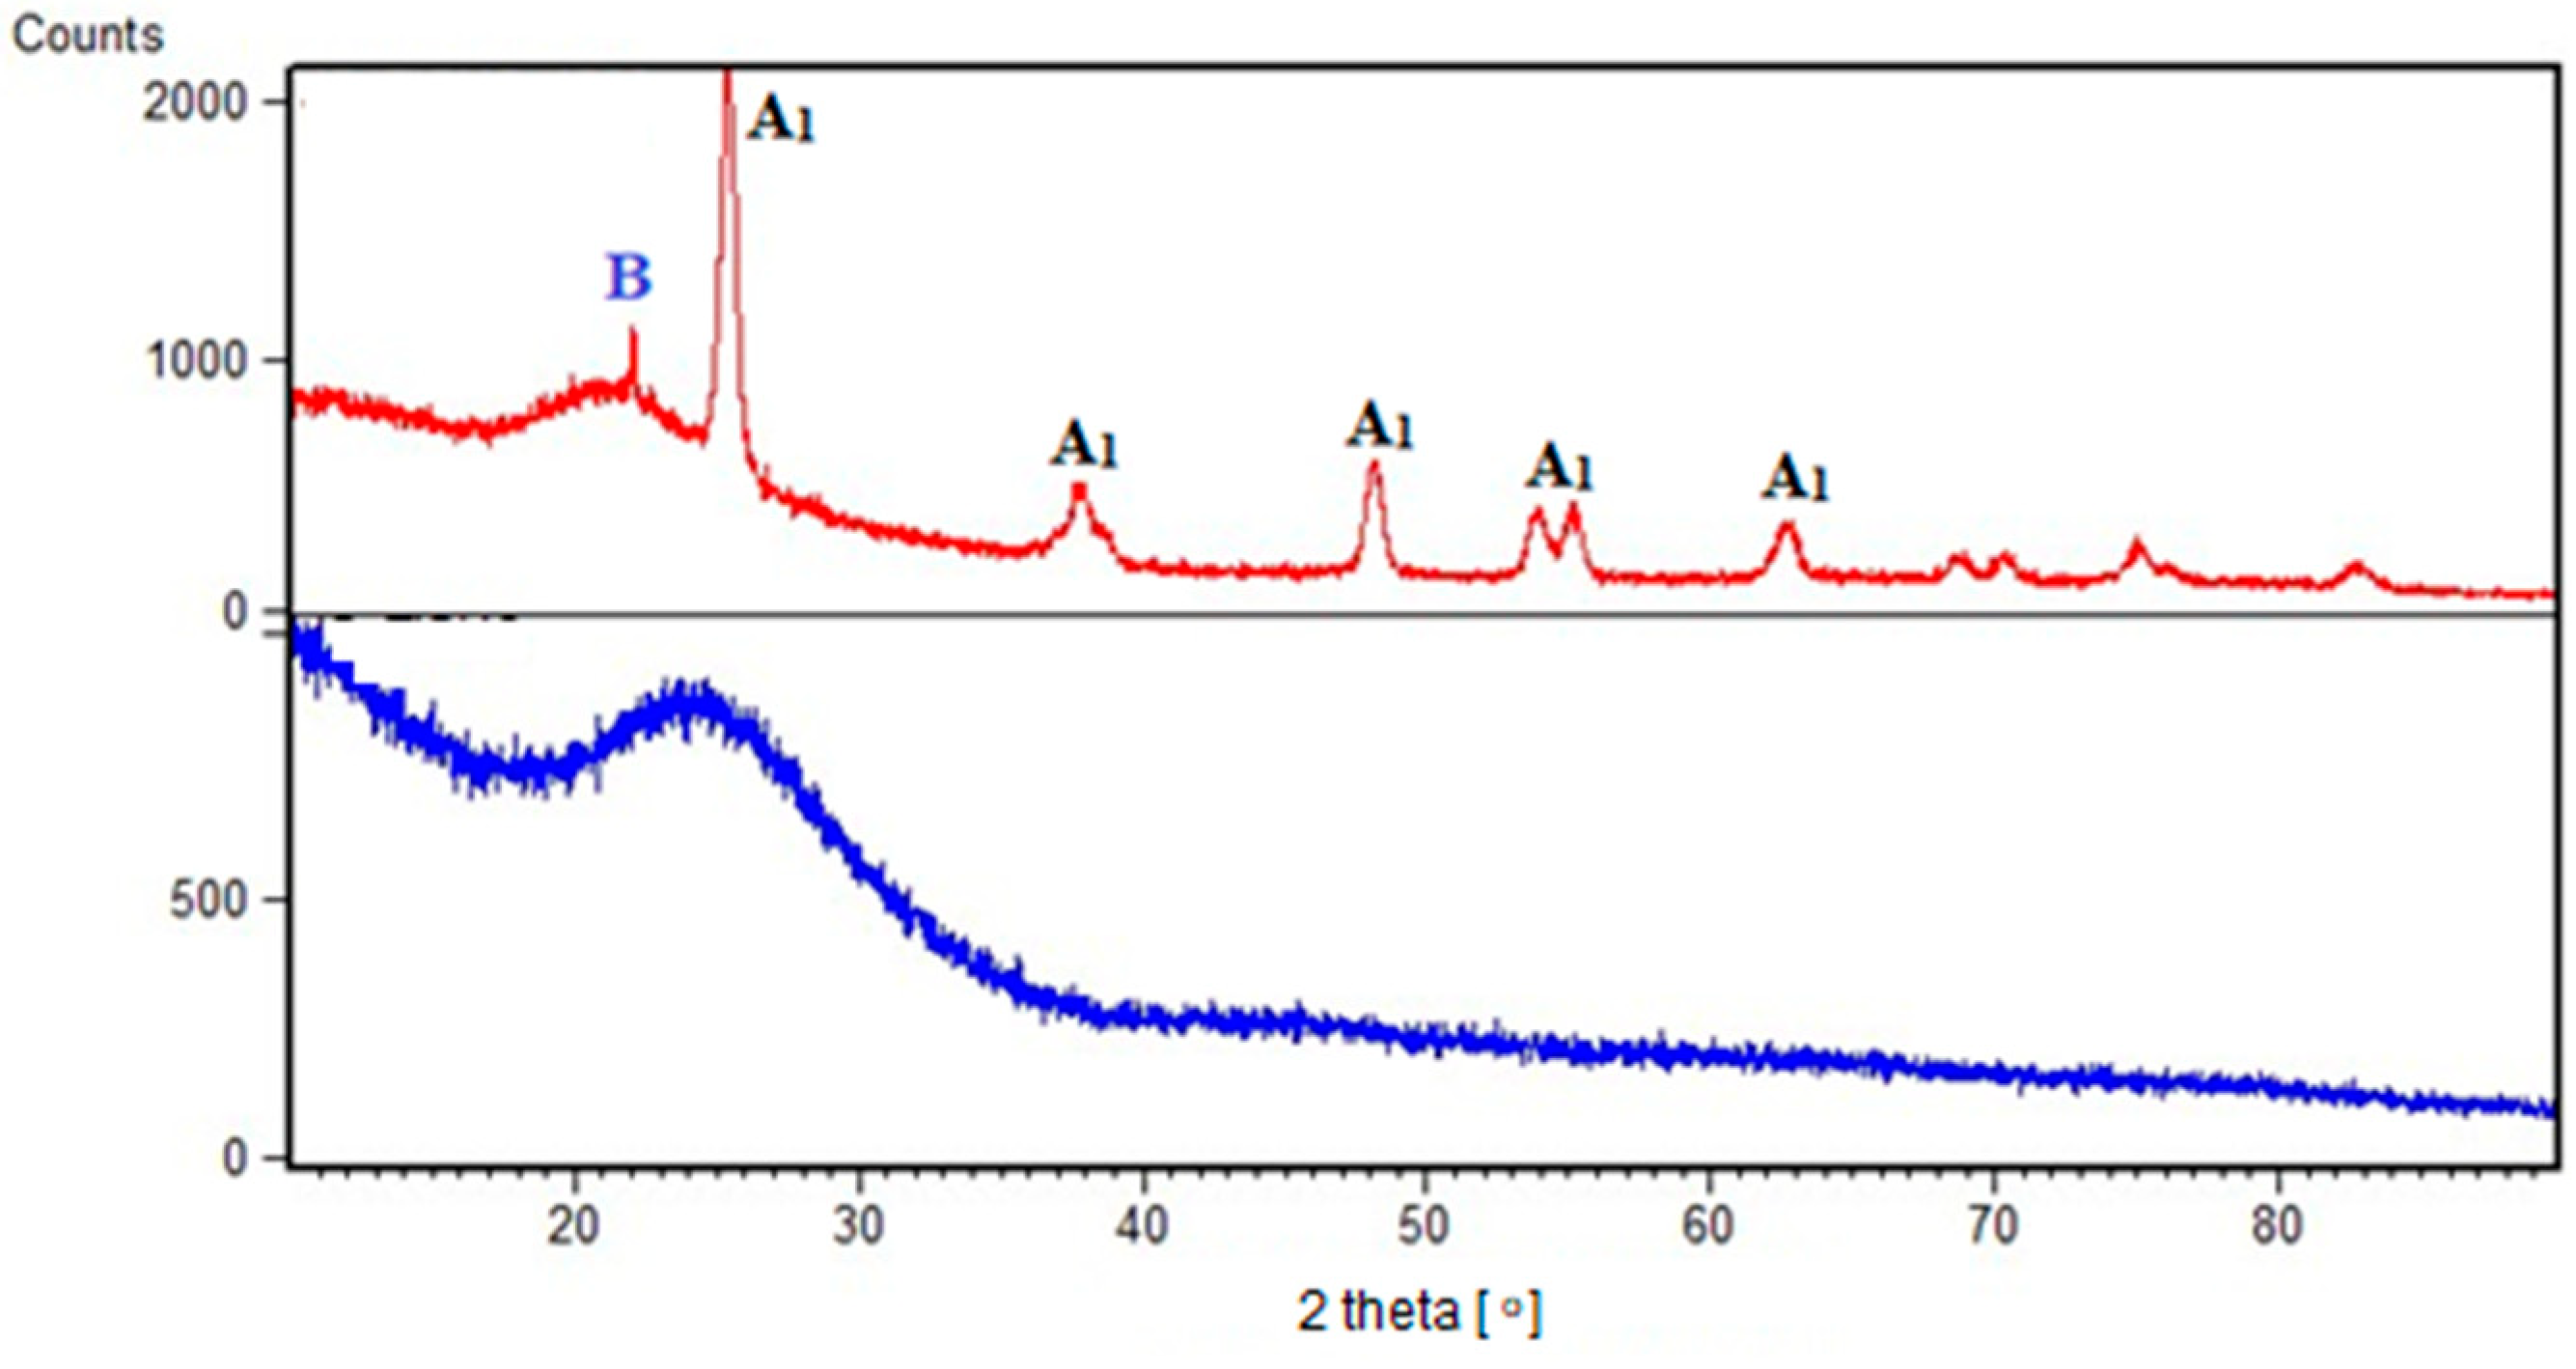
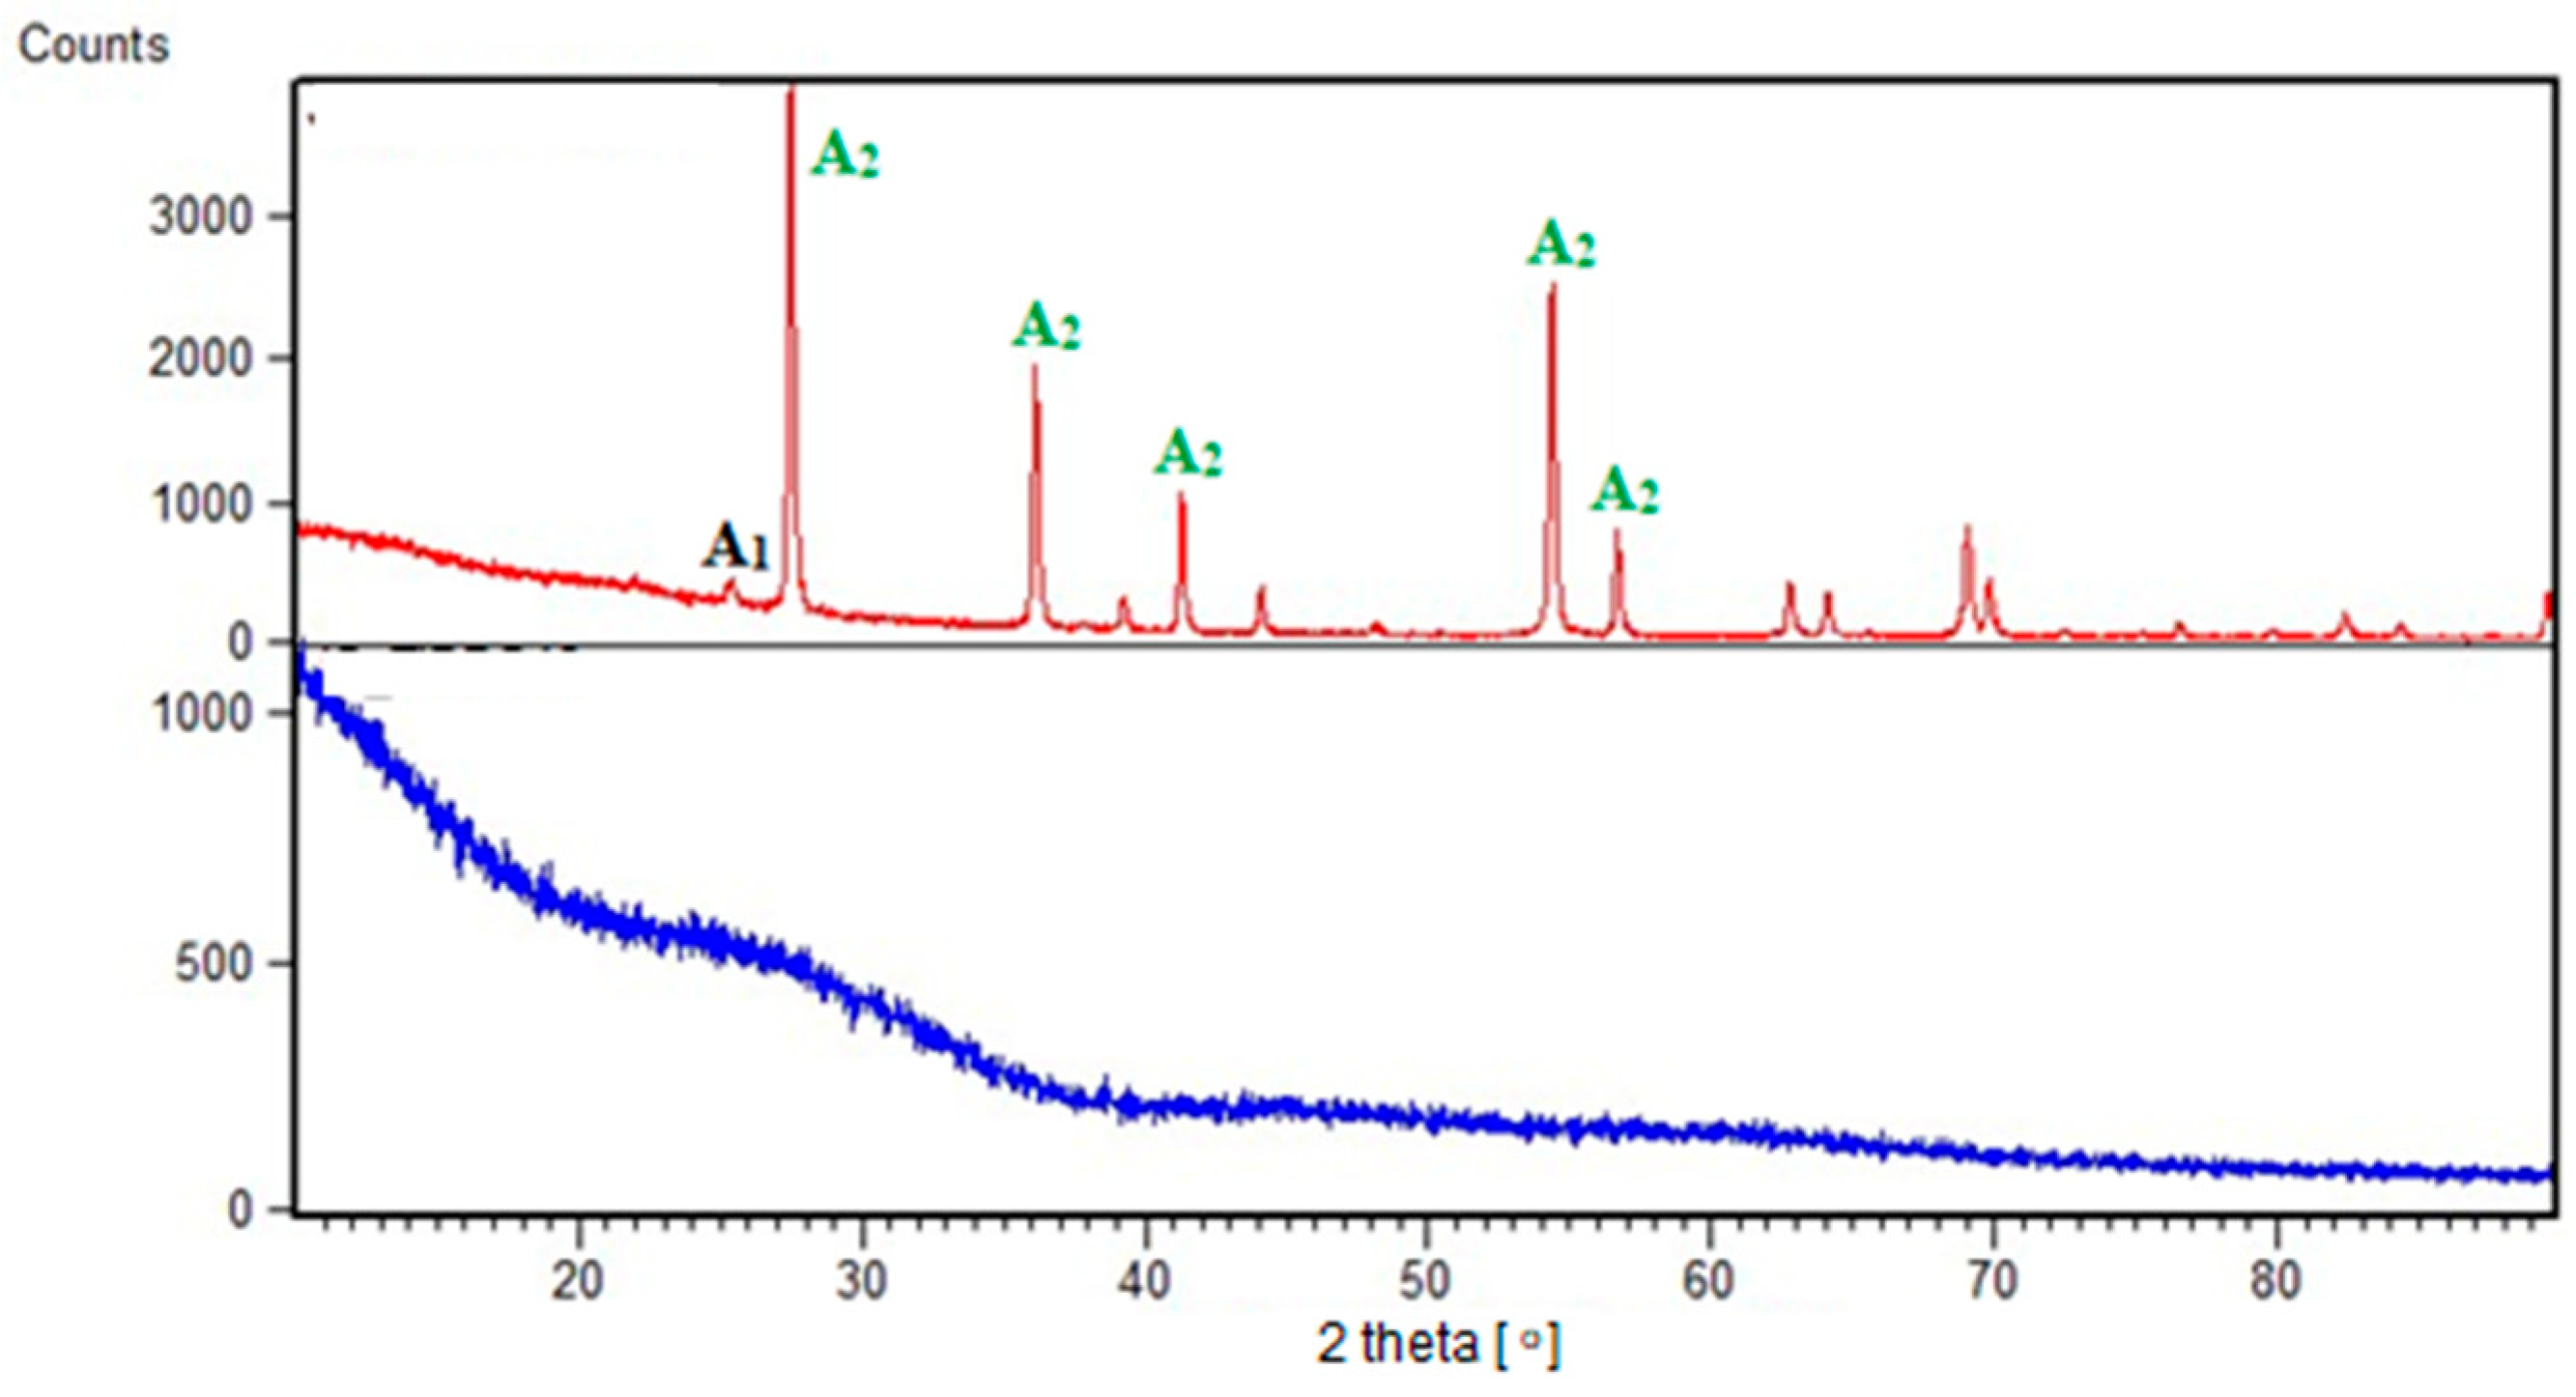
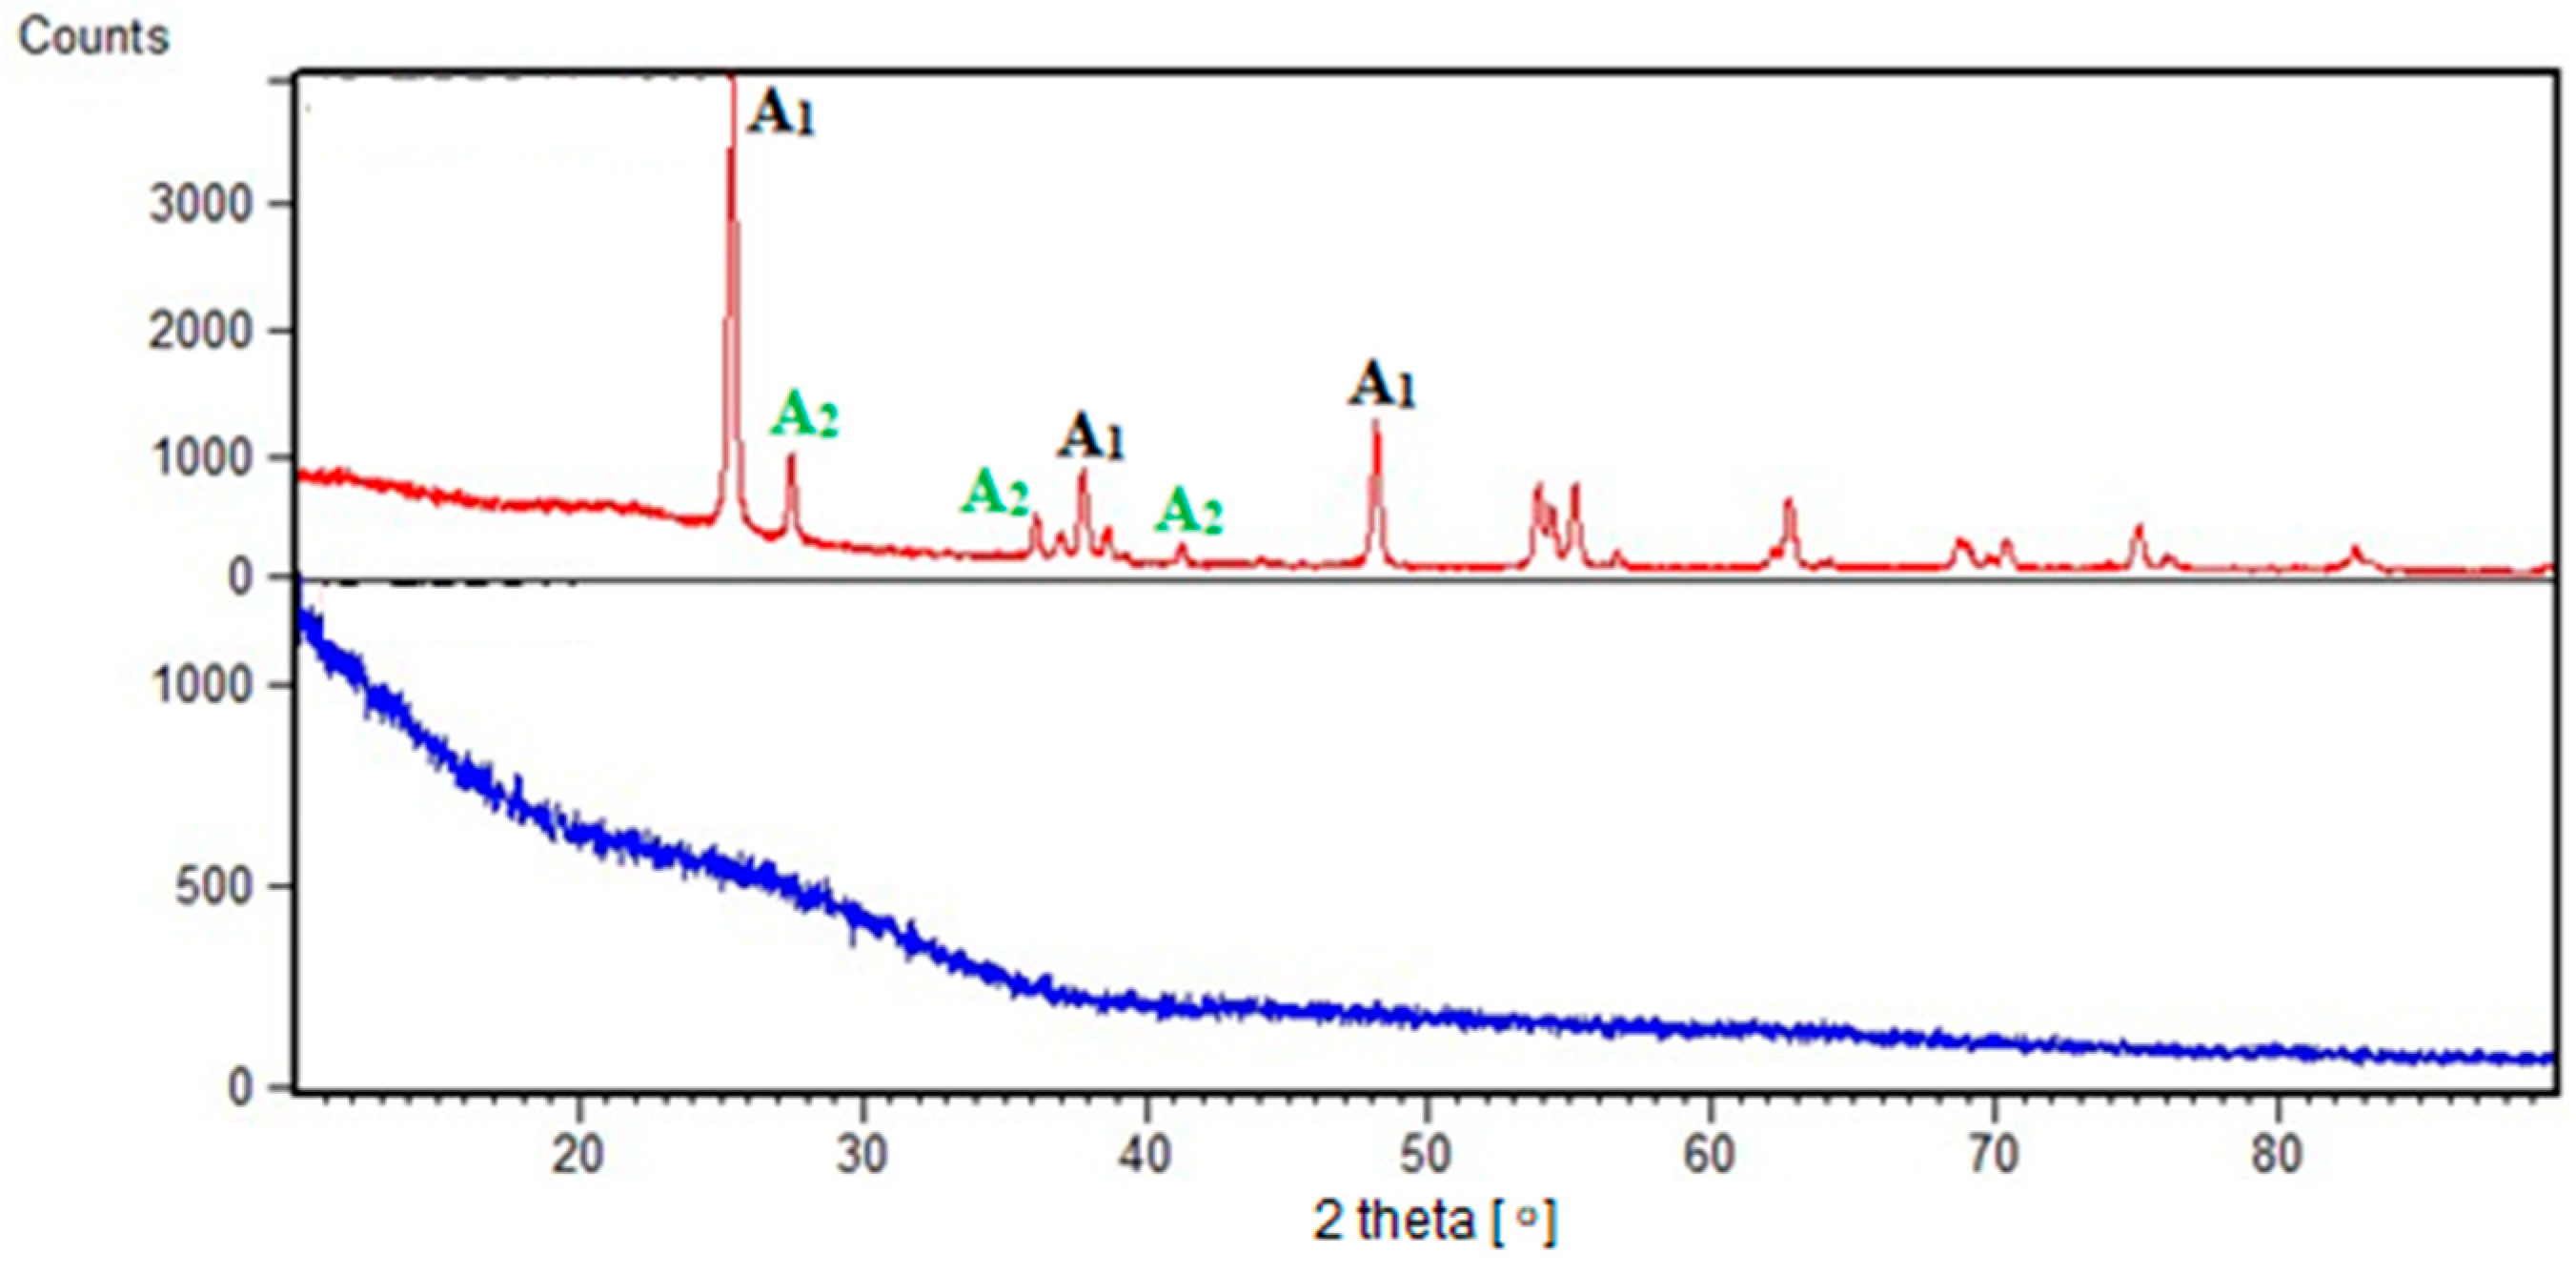
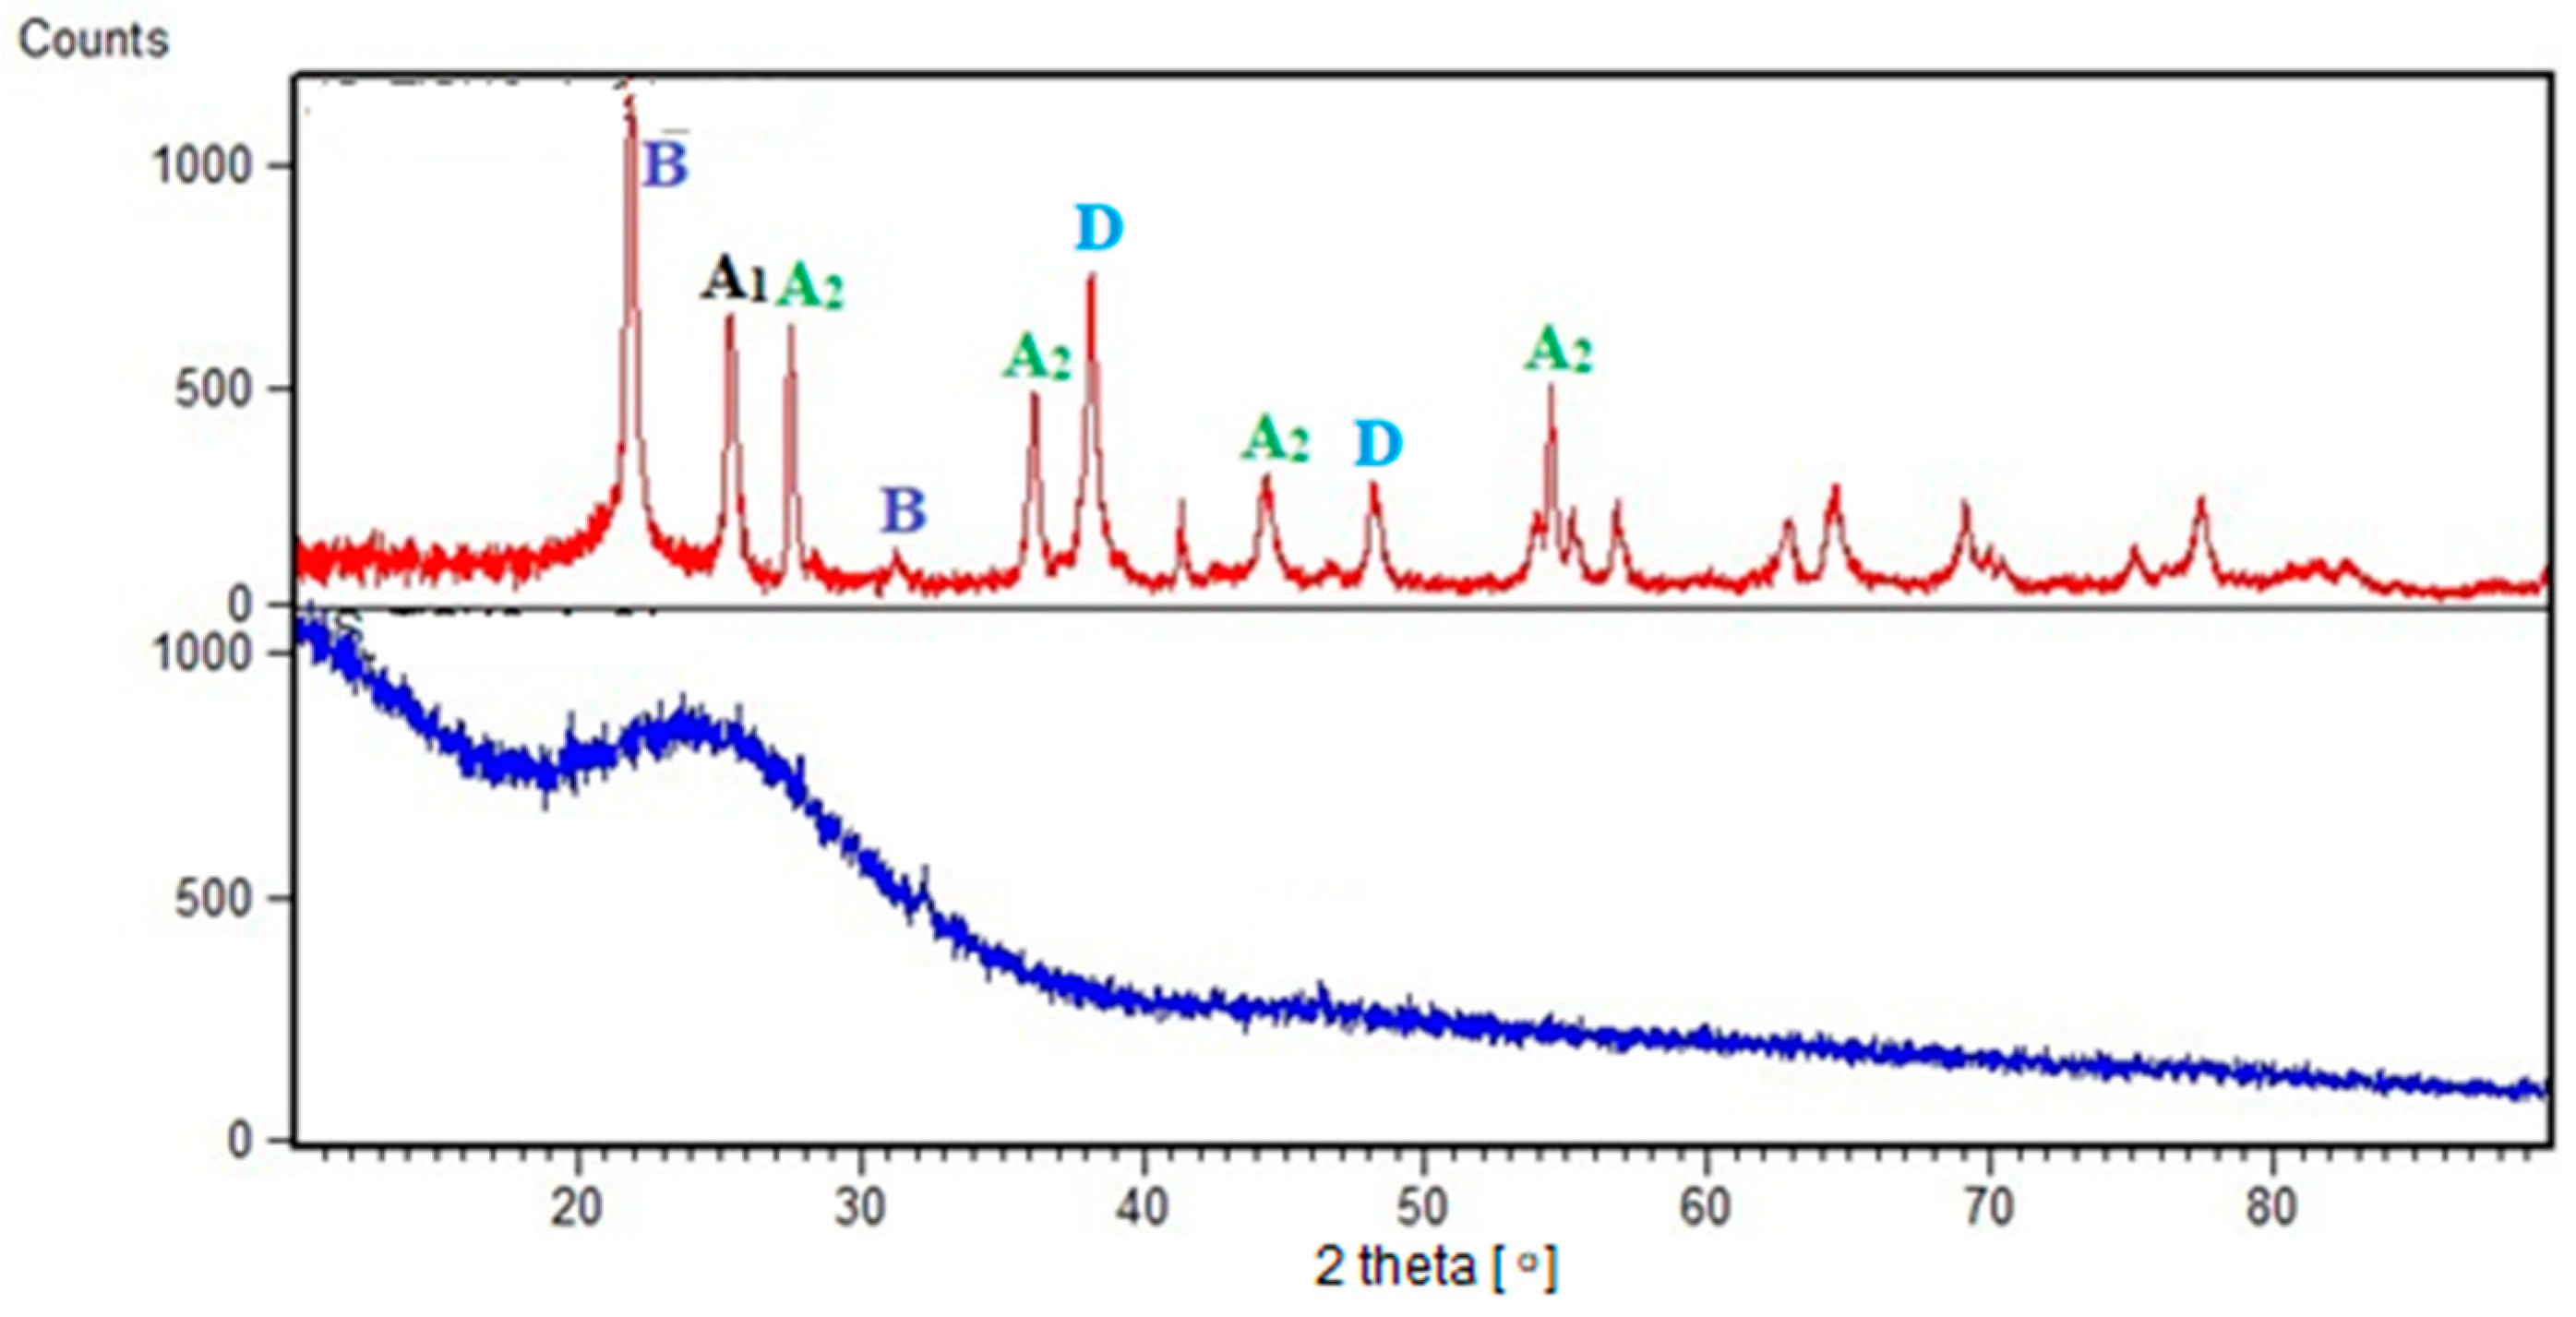
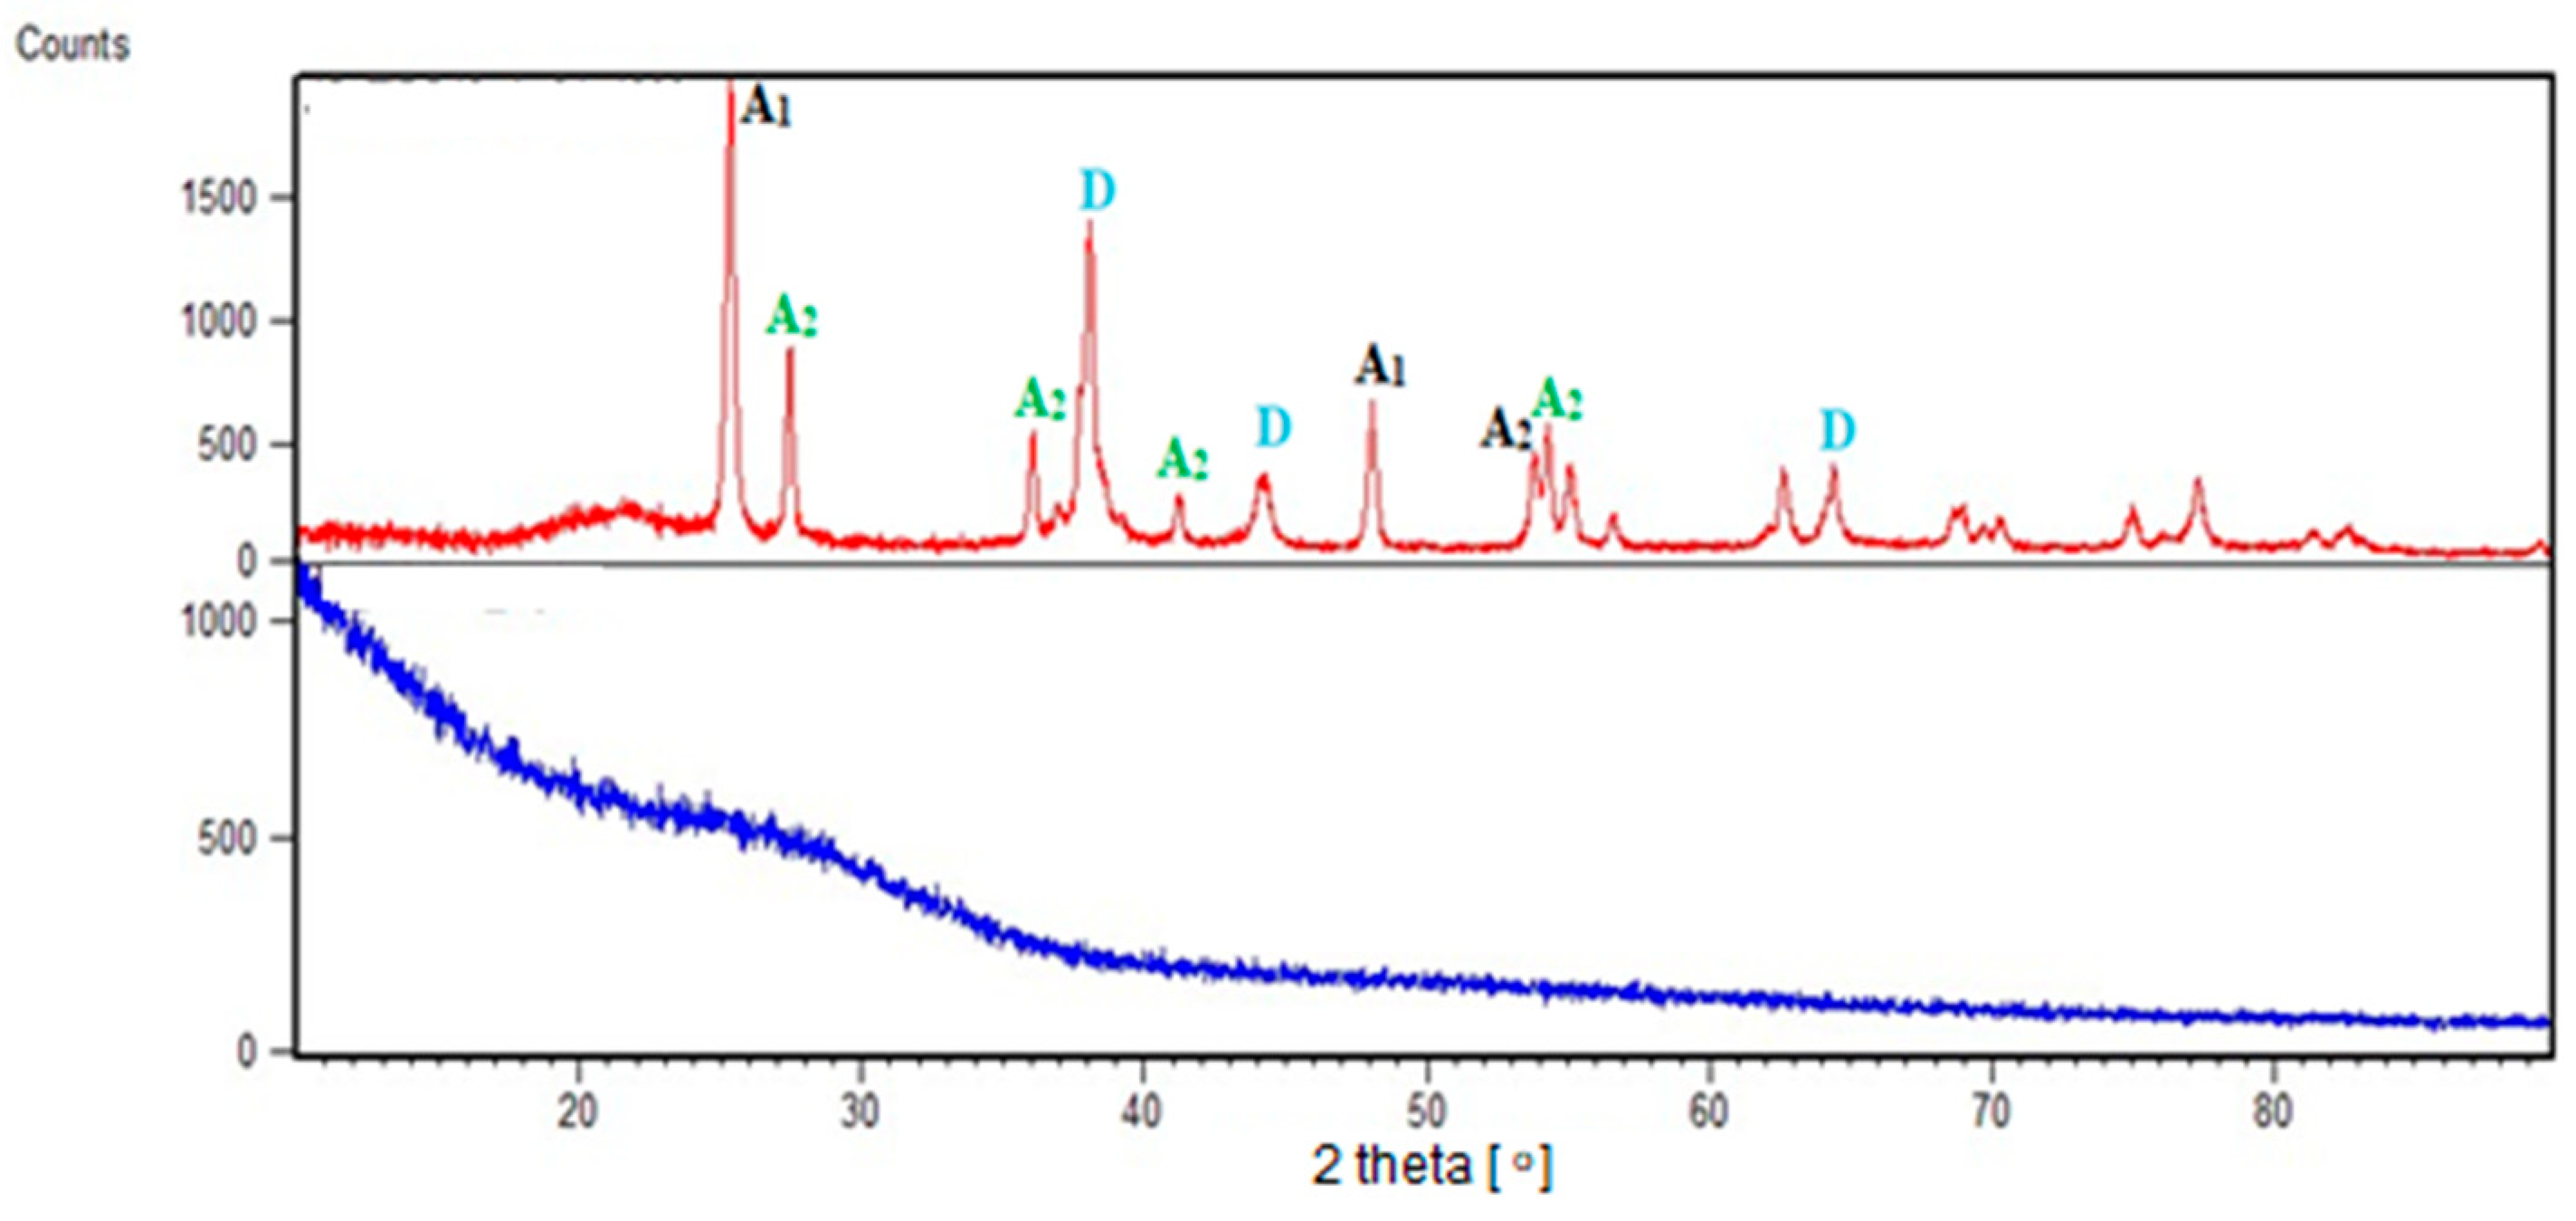
3.2. X-ray Diffraction Studies
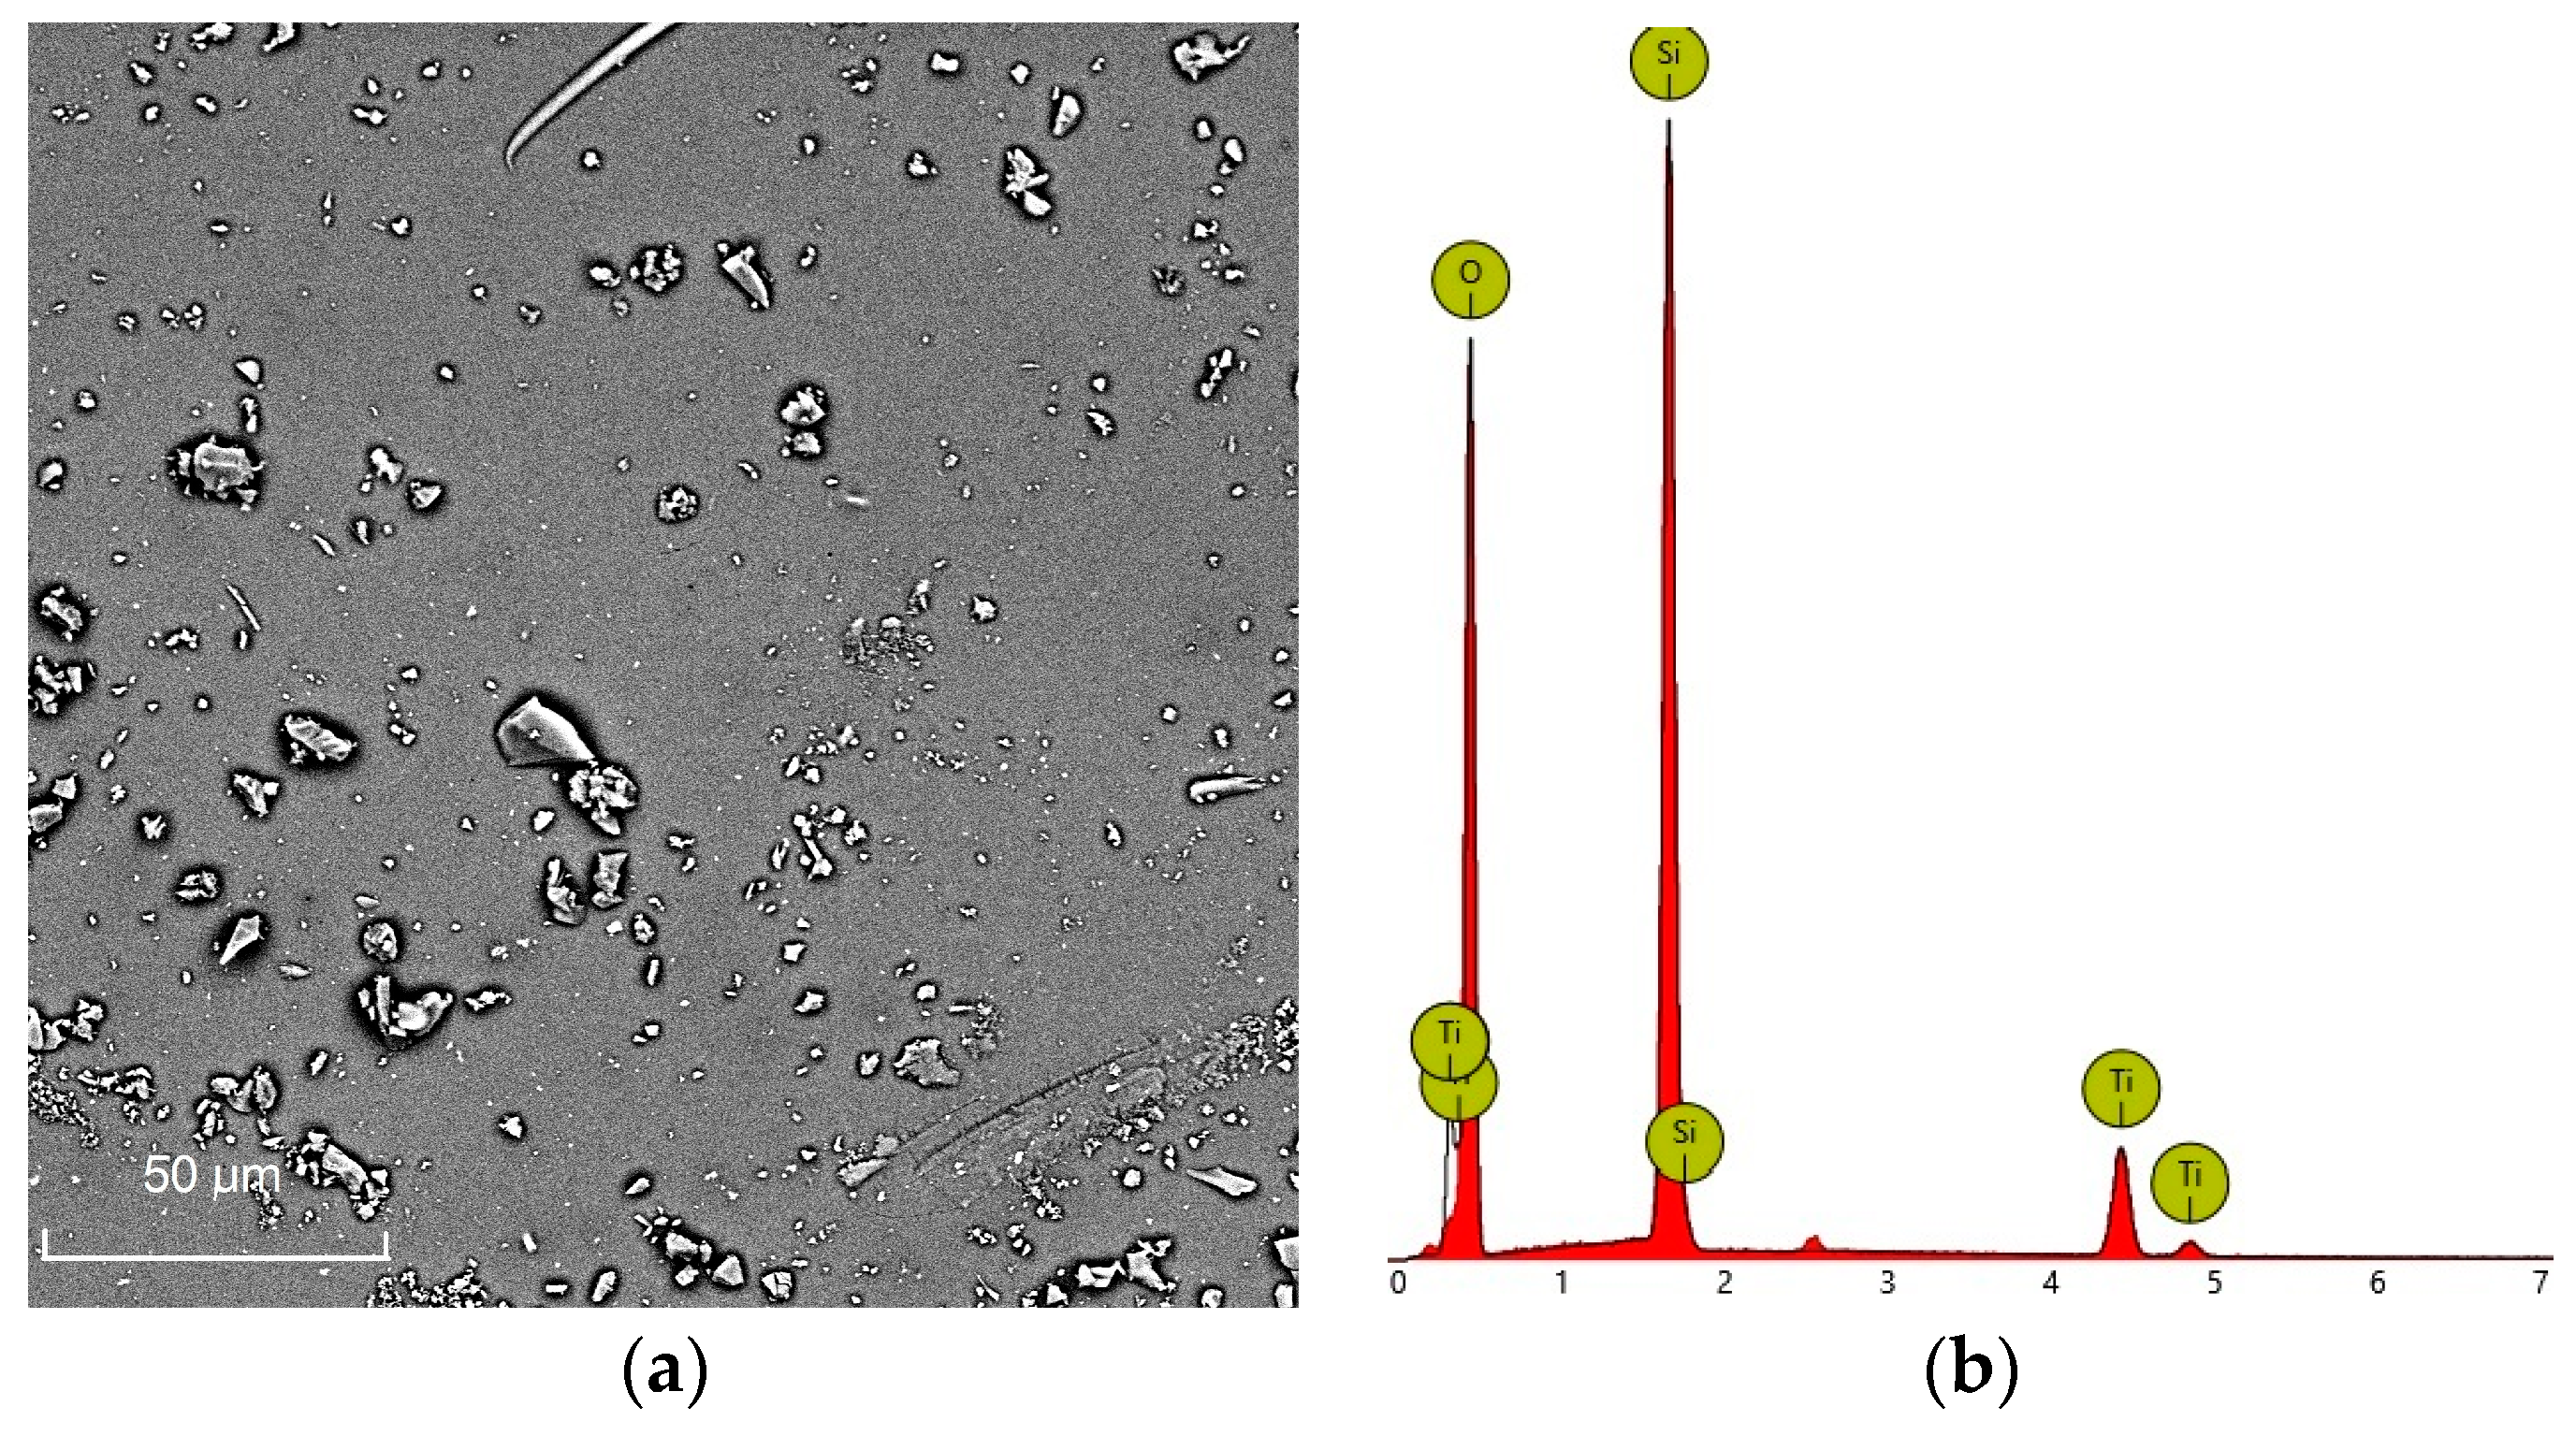
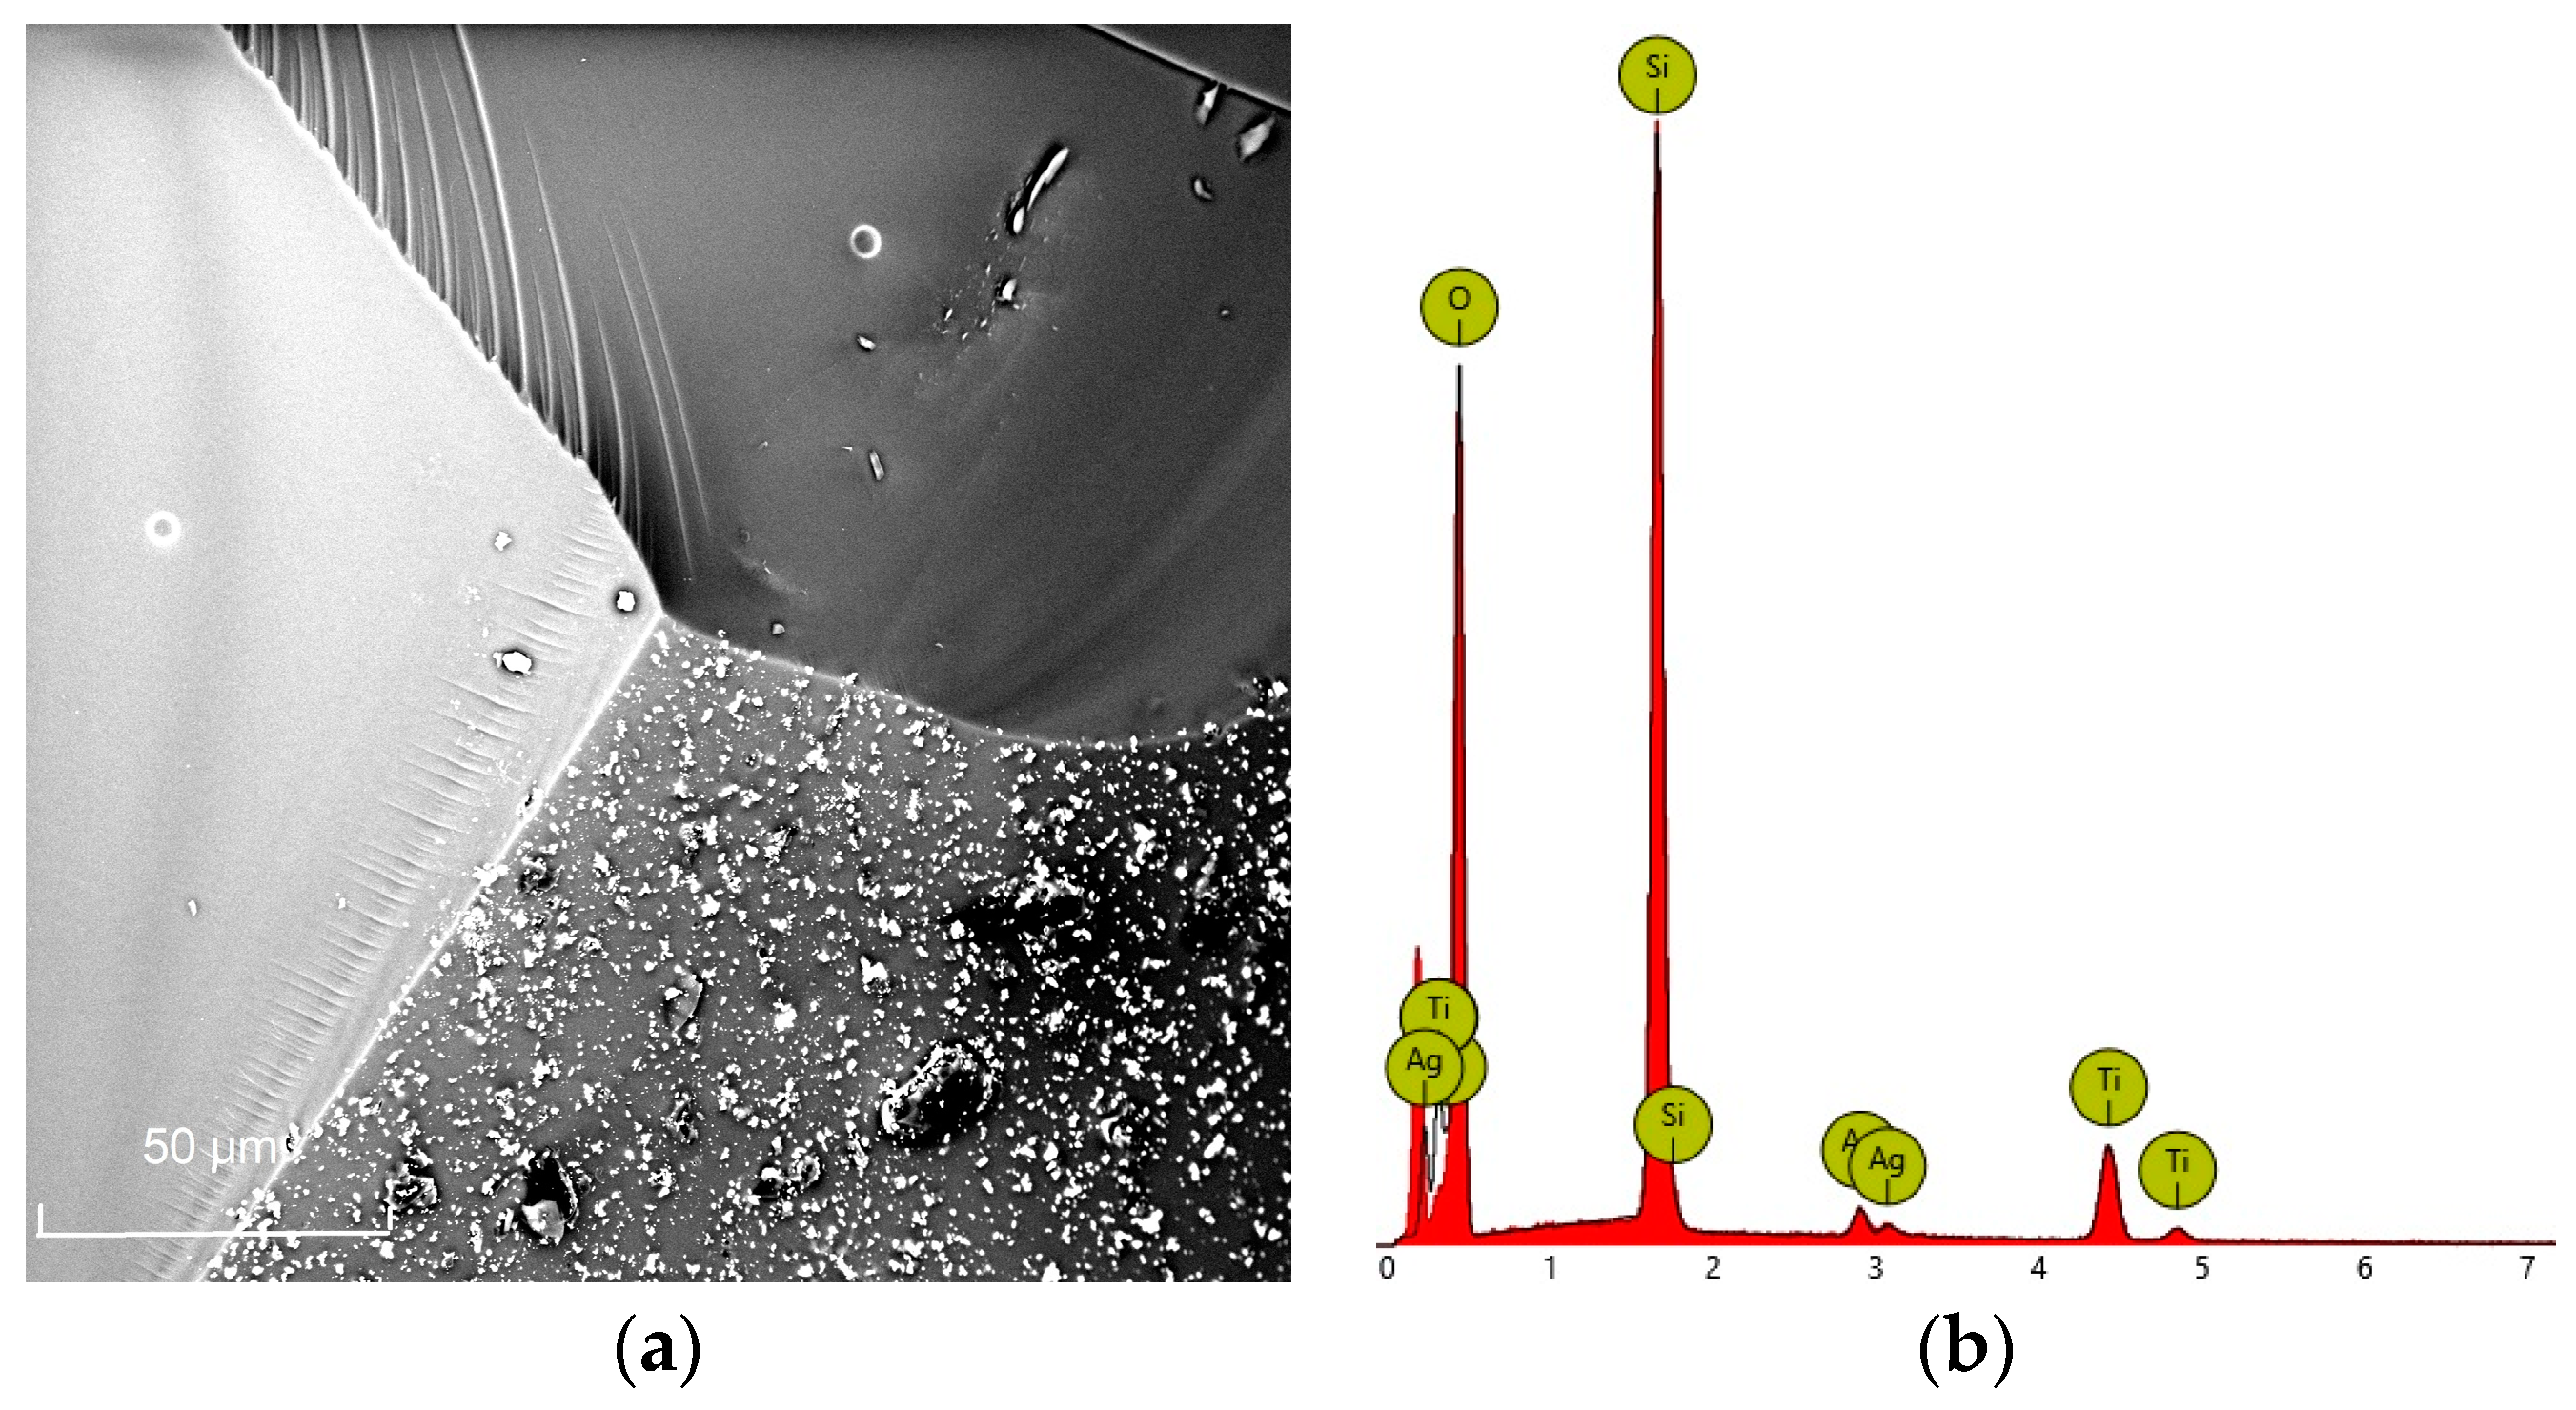
All XRD patterns were collected for the dried samples, as well as for those annealed at 1200 °C. The results are presented in a way similar to the FTIR spectra. Each figure contains two diffraction patterns of the dried and the annealed gel. Results of the XRD studies of all samples are presented in Figure 7, Figure 8, Figure 9, Figure 10, Figure 11 and Figure 12.
All diffraction patterns of the dried gels confirm the amorphous state of the obtained samples. In contrast, all gels annealed up to 1200 °C are crystalline or still contain negligible amounts of amorphous phase, such as, for example, in the case of the sample with higher silica content obtained with the use of TEOS (Figure 8). Based on the analysed diffraction patterns, one can observe that the main phases present in the annealed titania-silica gels without Ag addition are titania polymorphs: anatase and rutile. When Ag atoms were introduced into the structure of the studied materials, the analysis of the XRD patterns of the annealed gels pointed to the presence of cristobalite and the crystalline Ag phase in addition to the anatase and the rutile existing in almost all annealed samples (Figure 11 and Figure 12).
The crystallization of metallic Ag phase enabled the calculation of the dimensions of silver crystallites using Scherrer Equation (1) and the Scherrer Calculator in the HighScore Plus software. It was found that Ag crystallites in the annealed gel of TiO2:SiO2 = 1:3 composition synthesized with the use of TEOS, with the average dimensions of 9.0–12.0 nm (Table 2), and so they were within the upper limit of nanoparticle sizes (90–100 nm) [24]. When the gel was synthesized using TEOS and DDS as silica precursors, Ag crystallites were bigger than 9.0 nm and reached 13.0 nm. It is worth remembering that the sizes of crystallites are also closely related to the temperature of annealing. Therefore, annealing at a temperature lower than 1200 °C should also reduce the sizes of Ag crystallites.
To study the potential influence of Ag addition on the sizes of TiO2 and SiO2 crystallites, the dimensions of crystallites were calculated based on the FWHM of the selected, most intensive peak of anatase, rutile and cristobalite phases. Comparing the results (Table 2, Table 3 and Table 4) one can notice that there is no distinct influence of silver addition on the titania and silica crystallites sizes. More visible is the relation between the crystallite sizes and the application of DDS as the silica precursor. When DDS is applied, the crystallites of anatase crystallites, as well as rutile and silver ones, are bigger than in samples synthesized only using TEOS.

3.3. SEM Studies

SEM images and EDS spectra of the gels of TiO2:SiO2 = 1:3 composition, without and with the addition of Ag, are presented in Figure 13 and Figure 14, respectively. The EDS spectrum of the gel obtained with the addition of Ag (Figure 14b) confirms the presence of Ag atoms in its structure. Intensities of the lines characteristic of Ti and Si in the EDS spectra indicate similar Ti:Si ratios in both gels, which agrees with the planned composition of both samples. The surface morphology of both gels suggests their homogeneity and a lack of the distinguished areas of different chemical compositions. This result is also confirmed by FTIR spectra analysis, which suggests a good dispersion of Ti+4 cations and TiO2 phases in the silica matrix. Moreover, this conclusion is also confirmed by the calculated sizes of titania, silica and silver crystallites (Table 2, Table 3, Table 4 and Table 5). All phases they are similar and do not exceed 37 nm. Therefore, objects observed on the surface of the samples in SEM images (Figure 13a and Figure 14a) with sizes of a few thousand nanometres appear to be small grains of gels rather than crystallites of single TiO2, SiO2 and Ag phases.

4. Conclusions

Samples of TiO2-SiO2 system were synthesized by the sol-gel method using two different silica precursors: TEOS (tetraethoxysilane Si(OC2H5)4) and DDS (dimethyldiethoxysilane (CH3)2(C2H5O)2Si). During the synthesis of the samples, Ag was added to the sols applying AgNO3 as an Ag precursor. All samples were first dried and then annealed at 1200 °C in air. Analysis of FTIR spectra and XRD patterns confirmed the amorphous state of all dried gels and to establish the presence of different TiO2 polymorphs: anatase and rutile, in almost all of the annealed samples. Rutile was not only observed in the annealed gels synthesized using TEOS and without Ag addition. The use of DDS as the second silica precursor resulted in a faster crystallization of gels during heat treatment and caused a parallel increase in the depolymerization of silica lattice, which was confirmed by XRD studies and the increased intensity of bands at 1250 cm−1 and at 650 cm−1 in the FTIR spectra of selected gels. The incorporation of Ag atoms into the structure of gels caused the crystallization of cristobalite phase together with titania polymorphs. The presence of Ag as crystalline phase enabled the average sizes of Ag crystallites to be calculated based on the Scherrer equation. The sizes of titania and silica crystallites were also calculated. Based on the results obtained, one can draw the conclusion that there is no distinct influence of Ag addition on the sizes of anatase, rutile and crystobalite crystallites, whereas the use of DDS as the second silica precursor leads to larger crystallites of the mentioned phases. SEM studies of selected gels containing Ag, as well as the ones prepared without Ag addition, confirmed their homogeneity and the planned composition of the samples.

Funding

This work was supported by “Excellence Initiative—Research University” of AGH University of Krakow, grant IDUB no 4154.

Data Availability Statement

Data is contained within the article.

Conflicts of Interest

The author declares no conflict of interest.

References

  1. Zhang, M.E.L.; Zhang, R.; Liu, Z. The effect of SiO2 on TiO2-SiO2 composite film for self-cleaning application. Surf. Interfaces 2019, 16, 194–198. [Google Scholar] [CrossRef]
  2. Vishwas, M.; Narasimha Rao, K.; Arjuna Gowda, K.V.; Chakradhar, R.P.S. Optical, electrical and dielectric properties of TiO2–SiO2 films prepared by a cost effective sol–gel process. Spectrochim. Acta Part A Mol. Biomol. Spectrosc. 2011, 83, 614–617. [Google Scholar] [CrossRef] [PubMed]
  3. Adamczyk, A.; Rokita, M. The structural studies of Ag containing TiO2-SiO2 gels and thin films deposited on steel. J. Mol. Str. 2016, 1114, 171–180. [Google Scholar] [CrossRef]
  4. Houmard, M.; Riassetto, D.; Roussel, F.; Bourgeois, A.; Berthomé, G.; Joud, J.C.; Langlet, M. Morphology and natural wettability properties of sol-gel derived TiO2-SiO2 composite thin films. Appl. Surf. Sci. 2007, 254, 1405–1414. [Google Scholar] [CrossRef]
  5. Eldural, B.; Bolukbasi, U.; Karakas, G. Photocatalytic antibacterial activity of TiO2–SiO2 thin films. J. Photochem. Photobiol. A Chem. 2014, 283, 29–37. [Google Scholar] [CrossRef]
  6. Khosravi, H.S.; Veerapandiyan, V.K.; Vallant, R.; Reichmann, K. Effect of processing conditions on the structural properties and corrosion behavior of TiO2–SiO2 multilayer coatings derived via the sol-gel method. Ceram. Intern. 2020, 46, 17741–17751. [Google Scholar] [CrossRef]
  7. Krishna, V.; Padmapreetha, R.; Chandrasekhar, S.B.; Murugan, K.; Johnson, R. Oxidation resistant TiO2–SiO2 coatings on mild steel by sol–gel. Surf. Coat. Technol. 2019, 378, 125031. [Google Scholar] [CrossRef]
  8. Sun, B.; Sun, S.Q.; Li, T.; Zhang, W.Q. Preparation and antibacterial activities of Ag-doped SiO2–TiO2 composite films by liquid phase deposition (LPD) method. J. Mater. Sci. 2007, 42, 10085–10089. [Google Scholar] [CrossRef]
  9. Kawashita, M.; Tsuneyama, S.; Miyaji, F.; Kokubo, T.; Kozuka, H.; Yamamoto, K. Antibacterial silver-containing silica glass prepared by sol–gel method. Biomaterials 2000, 213, 93–398. [Google Scholar] [CrossRef]
  10. Schierholz, J.M.; Lucas, L.J.; Rump, A.; Pulverer, G. Efficacy of silver-coated medical devices. J. Hosp. Infect. 1998, 40, 257–262. [Google Scholar] [CrossRef]
  11. Abd Aziz, R.; Sopyan, I. Synthesis of TiO2-SiO2 powder and thin film photocatalysts by sol-gel method. Indian J. Chem. 2009, 48A, 951–957. [Google Scholar]
  12. Zhai, J.; Zhang, L.; Yao, X. Efects of composition and temperature on gel-formed TiO2/SiO2 films. J. Non-Cryst. Solids 1999, 260, 160–163. [Google Scholar] [CrossRef]
  13. Cheng, X.M.; NIE, B.M.; Kumar, S. Preparation and bioactivity of SiO2 functional films on titanium by PACVD. Trans. Nonferrous Met. Soc. China 2008, 18, 627–630. [Google Scholar] [CrossRef]
  14. Fatimah, I.; Prakoso, N.I.; Sahroni, I.; Musawwa, M.M.; Sim, Y.L.; Kooli, F.; Muraza, O. Physicochemical characteristics and photocatalytic performance of TiO2/SiO2 catalyst synthesized using biogenic silica from bamboo leaves. Heliyon 2019, 5, e02766. [Google Scholar] [CrossRef] [PubMed]
  15. Bulla, D.A.P.; Morimoto, N.I. Deposition of thick TEOS PECVD silicon oxide layers for integrated optical waveguide applications. Thin Solid Film. 1998, 334, 60–64. [Google Scholar] [CrossRef]
  16. Choi, D.G.; Yang, S.M. Effect of two-step sol-gel reaction on the mesoporous silica structure. J. Colloid. Interface Sci. 2003, 26, 127–132. [Google Scholar] [CrossRef]
  17. Wang, F.; Liu, J.; Luo, Z.; Zhang, Q.; Wang, P.; Liang, X.; Li, C.; Chen, J. Effects of dimethyldiethoxysilane addition on the sol–gel process of tetraethylorthosilicate. J. Non-Cryst. Solids 2007, 353, 321–326. [Google Scholar] [CrossRef]
  18. Zhang, Y.; Wu, D.; Sun, Y. Sol-gel of methyl modified optical silica coatings and gels from DDS and TEOS. J. Sol-Gel Sci. Technol. 2005, 33, 19–24. [Google Scholar] [CrossRef]
  19. Wang, F.; Liu, J.; Yang, H.; Luo, Z.; Lv, W.; Li, C.; Qing, S. Spherical particles from tetraorthosilicate (TEOS) sol–gel process with dimethyldiethoxysilane (DDS) and diphenyldiethoxysilane (DPDS) addition. J. Non-Cryst. Solids 2008, 354, 5047–5052. [Google Scholar] [CrossRef]
  20. Peter, A.; Mihaly-Cozmuta, L.; Mihaly-Cozmuta, A.; Nicula, C.; Cadar, C.; Jastrzębska, A.; Kurtycz, P.; Olszyna, A.; Vulpoi, A.; Danciu, V.; et al. Silver functionalized titania-silica xerogels: Preparation, morphostructural and photocatalytic properties, kinetic modeling. J. Alloys Compd. 2015, 648, 890–902. [Google Scholar] [CrossRef]
  21. Massa, M.A.; Covarrubias, C.; Bittner, M.; Fuentevilla, I.A.; Capetillo, P.; Von Marttens, A.; Carvajal, J.C. Synthesis of new antibacterial composite coating for titanium based on highly ordered nanoporous silica and silver nanoparticles. Mater. Sci. Eng. 2014, C45, 146–153. [Google Scholar] [CrossRef] [PubMed]
  22. Handke, M.; Mozgawa, W.; Nocuń, M. Specific features of the IR spectra of silicate glasses. J. Mol. Str. 1994, 325, 129–136. [Google Scholar] [CrossRef]
  23. Adamczyk, A. The influence of ZrO2 precursor type on the structure of ZrO2-TiO2-SiO2 gels and selected thin films. J. Mol. Str. 2018, 1171, 706–771. [Google Scholar] [CrossRef]
  24. Langauer-Lewowicka, H.; Pawlas, K. Nanocząstki, nanotechnologia—Potencjalne zagrożenia środowiskowe i zawodowe. Med. Sr.-Environ. Med. 2014, 17, 7–14. [Google Scholar]
Figure 1. FTIR spectra of TiO2:SiO2 = 1:2 gel synthesized using TEOS, dried (bottom) and annealed at 1200 °C (top).
Crystals 13 00811 g001
Figure 2. FTIR spectra of TiO2:SiO2 = 1:3 gel synthesized using TEOS, dried (bottom) and annealed at 1200 °C (top).
Crystals 13 00811 g002
Figure 3. FTIR spectra of TiO2:SiO2 = 1:2 gel synthesized using TEOS and DDS, dried (bottom) and annealed at 1200 °C (top).
Crystals 13 00811 g003
Figure 4. FTIR spectra of TiO2:SiO2 = 1:3 gel synthesized using TEOS and DDS, dried (bottom) and annealed at 1200 °C (top).
Crystals 13 00811 g004
Figure 5. FTIR spectra of TiO2:SiO2 = 1:3 gel synthesized using TEOS with Ag addition, dried (bottom) and annealed at 1200 °C (top).
Crystals 13 00811 g005
Figure 6. FTIR spectra of TiO2:SiO2 = 1:3 gel synthesized using TEOS and DDS with Ag addition, dried (bottom) and annealed at 1200 °C (top).
Crystals 13 00811 g006
Figure 7. XRD diffraction pattern of TiO2:SiO2 = 1:2 gel synthesized using TEOS, dried (bottom) and annealed at 1200 °C (top): A1—TiO2 anatase.
Crystals 13 00811 g007
Figure 8. XRD diffraction pattern of TiO2:SiO2 = 1:3 gel synthesized using TEOS, dried (bottom) and annealed at 1200 °C (top): A1—TiO2 anatase; B—SiO2 cristobalite.
Crystals 13 00811 g008
Figure 9. XRD diffraction pattern of TiO2:SiO2 = 1:2 gel synthesized using TEOS and DDS, dried (bottom) and annealed at 1200 °C (top): A1—TiO2 anatase; A2—TiO2 rutile.
Crystals 13 00811 g009
Figure 10. XRD diffraction pattern of TiO2:SiO2 = 1:3 gel synthesized using TEOS and DDS, dried (bottom) and annealed at 1200 °C (top): A1—TiO2 anatase; A2—TiO2 rutile.
Crystals 13 00811 g010
Figure 11. XRD diffraction pattern of TiO2:SiO2 = 1:3 gel synthesized using TEOS with Ag addition, dried (bottom) and annealed at 1200 °C (top): A1—TiO2 anatase; A2—TiO2 rutile; B—SiO2 cristobalite; D—Ag.
Crystals 13 00811 g011
Figure 12. XRD diffraction pattern of TiO2:SiO2 = 1:3 gel synthesized using TEOS and DDS with Ag addition, dried (bottom) and annealed at 1200 °C (top): A1—TiO2 anatase; A2—TiO2 rutile; D—Ag.
Crystals 13 00811 g012
Figure 13. SEM image of (a) TiO2:SiO2 = 1:3 gel (×1500), synthesized using TEOS and (b) EDS spectrum of this sample.
Crystals 13 00811 g013
Figure 14. SEM image of (a) TiO2:SiO2 = 1:3 gel with Ag addition (×1500), synthesized using TEOS and (b) EDS spectrum of this sample.
Crystals 13 00811 g014
Table 1. Compositions of gels obtained with and without Ag addition.
SampleTiO2 Content [% mol]SiO2 Content
[% mol]
TEOS:DDS Ratio
[mol]
Ag Addition
Ag:Si Ratio [mol]
TiO2:SiO2 = 1:233.366.7--
TiO2:SiO2 = 1:32575--
TiO2:SiO2 = 1:233.366.71:1-
TiO2:SiO2 = 1:325751:1-
TiO2:SiO2 = 1:3 + Ag2575-1:24
TiO2:SiO2 = 1:3 + Ag25751:11:24
Table 2. Sizes of silver crystallites in the gels containing Ag.
SamplePeak Position
2 θ [°]
βobs (FWHM)
[°]
βstand
[°]
Dhkl
[nm]
TiO2:SiO2 = 1:3 + Ag
synthesized with TEOS
38.1690.7400.05712.3
44.3580.9250.0619.9
64.4890.8550.07812.1
TiO2:SiO2 = 1:3 + Ag
synthesized with TEOS:DDS = 1
38.0760.7250.05712.6
44.2150.8440.06111.0
64.3950.8030.07812.9
Table 3. Sizes of TiO2 (anatase) crystallites in the gels annealed at 1200 °C.
SamplePeak Position
2 θ [°]
βobs (FWHM)
[°]
βstand
[°]
Dhkl
[nm]
TiO2:SiO2 = 1:3
synthesized with TEOS
25.4010.8010.05410.9
TiO2:SiO2 = 1:3 + Ag
synthesized with TEOS
25.4250.5250.05417.3
TiO2:SiO2 = 1:3
synthesized with TEOS:DDS = 1
25.3830.3780.05425.1
TiO2:SiO2 = 1:3 + Ag
synthesized with TEOS:DDS = 1
25.3500.4560.05420.3
Table 4. Sizes of TiO2 (rutile) crystallites in the gels annealed at 1200 oC.
SamplePeak Position
2 θ [°]
βobs (FWHM)
[°]
βstand
[°]
Dhkl
[nm]
TiO2:SiO2 = 1:3
synthesized with TEOS
----
TiO2:SiO2 = 1:3 + Ag
synthesized with TEOS
27.5540.2930.05834.4
TiO2:SiO2 = 1:3
synthesized with TEOS:DDS = 1
27.5040.2760.05837.0
TiO2:SiO2 = 1:3 + Ag
synthesized with TEOS:DDS = 1
27.4630.3390.06628.8
Table 5. Sizes of SiO2 (crystobalite) crystallites in the gels annealed at 1200 °C.
SamplePeak Position
2 θ [°]
βobs (FWHM)
[°]
βstand
[°]
Dhkl
[nm]
TiO2:SiO2 = 1:3
synthesized with TEOS
22.0590.3280.05429.5
TiO2:SiO2 = 1:3 + Ag
synthesized with TEOS
21.8770.6550.05413.5
TiO2:SiO2 = 1:3
synthesized with TEOS:DDS = 1
----
TiO2:SiO2 = 1:3 + Ag
synthesized with TEOS:DDS = 1
----
Disclaimer/Publisher’s Note: The statements, opinions and data contained in all publications are solely those of the individual author(s) and contributor(s) and not of MDPI and/or the editor(s). MDPI and/or the editor(s) disclaim responsibility for any injury to people or property resulting from any ideas, methods, instructions or products referred to in the content.

