Article

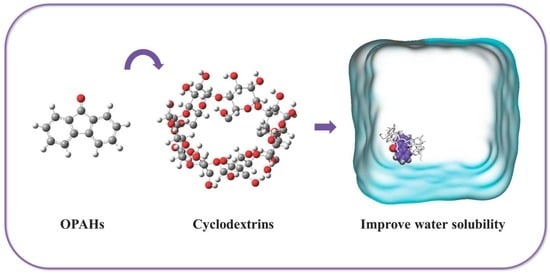
Enhancing the Water Solubility of 9-Fluorenone Using Cyclodextrin Inclusions: A Green Approach for the Environmental Remediation of OPAHs

1
School of Chemical Engineering and Technology, State Key Laboratory of Chemical Engineering, Tianjin University, Tianjin 300072, China
2
Haihe Laboratory of Sustainable Chemical Transformations, Tianjin 300072, China
*
Authors to whom correspondence should be addressed.
Crystals 2023, 13(5), 775; https://doi.org/10.3390/cryst13050775
Submission received: 17 April 2023 / Revised: 28 April 2023 / Accepted: 4 May 2023 / Published: 6 May 2023
(This article belongs to the Special Issue Polymorphism in Crystals)

Abstract

:
Oxygenated polycyclic aromatic hydrocarbons (OPAHs) are toxic and carcinogenic compounds widely present in the natural environment, posing a serious threat to the environment and human health. However, the removal of OPAHs is mainly hindered by their low water solubility. Cyclodextrins (CDs) are frequently used to form inclusion complexes (ICs) with hydrophobic molecules to improve their solubility. In this study, we investigated the solubility enhancement ability of different CDs on 9-fluorenone, a common OPAH, through phase solubility experiments. We successfully prepared three solid ICs of 9-fluorenone with β-, hydroxypropyl-β-(HP-β-) and sulfobutylether-β-CD (SBE-β-CD) using the cooling crystallization method for the first time and characterized them via powder X-ray diffraction, Fourier transform infrared spectroscopy, scanning electron microscopy, etc. Molecular dynamics simulations were employed to investigate the binding modes and stable configurations of the ICs in the liquid phase and to explore the factors affecting their solubility enhancement ability. The results showed that all the CDs had a solubility enhancement effect on 9-fluorenone, with SBE-β-CD displaying the strongest effect, increasing the solubility of 9-fluorenone by 146 times. HP-β-CD, β-CD, α-CD, and γ-CD followed in decreasing order. Moreover, 9-fluorenone formed a ratio of 1:1 ICs to CDs. In addition, the interaction energy between SBE-β-CD and 9-fluorenone was the lowest among the CDs, which further validated the results of the phase solubility experiments from a theoretical perspective. Overall, this study provides a green method for the removal of 9-fluorenone pollutants in the environment and is expected to be applied to the removal and environmental remediation of other OPAHs.

Graphical Abstract

1. Introduction

Polycyclic aromatic hydrocarbons (PAHs) are a class of persistent and toxic organic pollutants that are commonly present in the environment [1]. Oxygenated polycyclic aromatic hydrocarbons (OPAHs) are derivatives of PAHs that contain at least one carbonyl oxygen on the aromatic ring and frequently coexist with PAHs in soils, air, and surface water [2]. OPAHs are primarily released into the environment through the incomplete combustion of solid fuels and the transformation of PAHs [3,4,5]. OPAHs are known for their high stability and resistance to degradation, and studies have found that OPAHs may exhibit stronger cytotoxicity and developmental toxicity than their parent PAHs [6,7]. OPAHs in the soil can accumulate in agricultural plants and be consumed by humans, while OPAHs in the atmosphere can be adsorbed onto particles and inhaled by humans [8,9]. These pollutants can cause allergies and even lead to cancer [10,11]. Therefore, the efficient removal of PAHs and OPAHs from soil and air is an important environmental issue and a necessary step for sustainable development.
Although OPAHs have better water solubility compared to their parent PAHs, their low water solubility is still a major challenge in removing them from contaminated soils [12,13]. However, recent studies have suggested that cyclodextrins (CDs) and their derivatives hold great promise as agents for improving the solubility of these persistent organic pollutants [14,15,16]. CDs are cyclic molecules with a hydrophobic interior cavity and a hydrophilic exterior, which allows them to form inclusion complexes (ICs) with hydrophobic molecules, thus enhancing their solubility [17]. Natural CDs such as α-, β-, and γ-CD have been shown to form such complexes with organic molecules, as have modified CD derivatives such as hydroxypropyl-β-(HP-β-) and sulfobutylether-β-CD(SBE-β-CD) [18,19]. These modified derivatives exhibit significantly improved water solubility compared to natural CDs, thus providing a more effective means of increasing the solubility of insoluble molecules [20].
In recent years, numerous studies have demonstrated that the preparation of CD ICs can lead to the effective removal of PAHs from the environment. T. Badr and K. Hanna et al. [14] studied the solubilization and extraction effects of CDs on the organic pollutants naphthalene and phenanthrene in soil and confirmed the formation of PAH ICs. Inga Tijunelyte et al. [16] investigated the ability to encapsulate two PAHs, naphthalene and fluoranthene, in CDs’ cavities. Fuat Topuz et al. [21] described a novel concept of PAH removal from aqueous solutions using CD-functionalized mesostructured silica nanoparticles and pristine mesostructured silica nanoparticles. However, there is currently a dearth of research on the use of CD ICs to remove OPAHs from the environment. Meanwhile, the solubilization mechanism of cyclodextrins for pollutants has received relatively little attention in research. Therefore, further investigation is highly necessary. Molecular dynamics (MD) simulations have emerged as a powerful tool for investigating the mechanism of CD ICs’ formation, which allows for more intuitive information on how the ICs are bound at the molecular level [22]. Various methods have been employed for the preparation of ICs, including mechanochemical methods, cooling crystallization, ultrasonication, and freeze drying. Cooling crystallization has gained considerable attention due to its low energy consumption and the high purity of the resulting ICs. Recent advances in the field have led to the development of novel techniques such as supercritical anti-solvent and supercritical assisted atomization, which have also been explored for the preparation of ICs [23,24].
9-Fluorenone (Figure 1A), also known as diphenylene ketone, is a common small-molecule OPAH and a frequently used fine chemical raw material [7]. 9-Fluorenone in the environment is usually derived from the combustion of solid fuels or from the oxidation of its parent compound, fluorene [25,26]. Found in the environment, it typically exhibits direct mutagenicity and stronger toxicity and persistence, often being widely detected in soils, groundwater, and the atmosphere [27,28,29]. Due to its poor solubility and limited bioavailability, it appears to be difficult to effectively remove from the environment [30]. Therefore, the preparation of ICs of 9-fluorenone with CDs can significantly enhance its solubility in water, thereby effectively removing the pollutants from the soil. Additionally, for 9-fluorenone that is already present in the effluent, it can be precipitated out through the formation of solid ICs, which leads to environmental restoration.
The purpose of this study was to investigate the solubilization effects of different CDs on 9-fluorenone. We prepared and characterized 9-fluorenone/CD ICs and elucidated the structural details of the complexes in aqueous solution through molecular dynamics simulations, identifying the optimal host molecule for improving the water solubility of 9-fluorenone. This information provides valuable support for the removal of 9-fluorenone from the environment and also offers a green method for the removal of other OPAHs.

2. Materials and Methods

2.1. Materials

9-Fluorenone was purchased from Tianjin Heowns Biochem LLC (purity 99%, Tianjin, China). α-CD (purity 99%, average MW 973 g/mol), β-CD (purity > 98%, average MW 1135 g/mol), γ-CD (purity > 98%, average MW 1297 g/mol), (2-hydroxypropyl)-β-CD (purity > 98%, average MW 1542 g/mol), and sulfobutylether-β-CD (purity > 98%, average MW 1451 g/mol) were purchased from Tianjin Hiensi Biochemical Technology Co. (Tianjin, China). Distilled–deionized water was formed in the laboratory using a NANOPURE system from BARNSTEAD (Thermo Scientific Co., Tianjin, China). All chemicals were used as received. Ethanol of analytical grade was from Tianjin Kewei Chemical Technique Co., Ltd. (Tianjin, China).

2.2. Phase Solubility Experiments

2.2.1. Standard Curve Construction

9-Fluorenone was accurately weighed (5 mg) and dissolved in anhydrous ethanol to prepare a 0.1 mg/mL stock solution. Aliquots of the stock solution (2.0, 4.0, 6.0, 8.0, and 10.0 mL) were transferred into 25 mL volumetric flasks and diluted with anhydrous ethanol to the mark, with anhydrous ethanol as the reference blank. The solutions were shaken well and subjected to full-spectrum scanning analysis using a UV–visible spectrophotometer (UV-3600, Shimadzu, Kyoto, Japan). The absorption peak of 9-fluorenone appeared at 298 nm, while β-CD did not show any absorption peak at this wavelength. A standard curve was constructed by plotting the absorbance as the ordinate against the mass concentration (ρ) as the abscissa.

2.2.2. Solubility Curve Construction

Solutions of various CDs with concentrations ranging from 0 to 10 mM (10 mL) were prepared. Excess 9-fluorenone was added to the CD solutions, and the resulting solutions were stirred at 300 rpm and 25 °C for 48 h. After reaching the solid–liquid equilibrium, the supernatants were filtered using a 0.45 μm aqueous syringe filter, diluted to a certain degree, and the absorbance values of the samples at 298 nm were measured using a UV–visible spectrophotometer. The solubility of 9-fluorenone in the different CD concentrations was calculated from the corresponding standard curve, and the solubility of fluorenone was plotted as the ordinate against the CD concentration as the abscissa to construct the solubility curve.

2.2.3. Calculation of Apparent Stability Constants

The binding constants for each CD were calculated using the Higuchi–Connor method [31,32]. According to the Higuchi–Connor formula for the binding constant K:
K = S l o p e S 0 × ( 1 S l o p e )
where S l o p e represents the slope of the phase solubility curve and S 0 represents the solubility of the guest molecule in water.
Meanwhile, the solubilization efficiency (Se) is calculated using the following equation:
S e = S C D S 0
where S C D   is the apparent solubility of 9-fluorenone at a fixed concentration of 100 mM CD.

2.3. Preparation of 9-Fluorenone/CD ICs

2.3.1. Solid Samples

For the different CDs, saturated solutions (200mL) were prepared at 50 °C. 9-Fluorenone (1:1 molar ratio of host to guest) was dissolved in 5 mL of ethanol (as a co-solvent) and added to the prepared aqueous solution of CDs. The mixed solution was mechanically stirred at 300 rpm for 6 h while avoiding exposure to light. Afterward, the solution was cooled down to 5 °C at a rate of 8 °C/h, resulting in a pale-yellow precipitate. The precipitate was washed with a small amount of ethanol, filtered, and dried for 12 h in a vacuum-drying oven at 40 °C.

2.3.2. Physical Mixture

CDs and 9-fluorenone (at a ratio of 1:1) were lightly ground manually using a mortar and pestle for 10 min to obtain a homogeneous mixture.

2.4. Characterization

Crystal shapes were observed using an Olympus BX51 polarized light microscope (PLM, Olympus, Tokyo, Japan). Powder X-ray diffraction (PXRD) was performed with a D/MAX-2500 (Rigaku, Tokyo, Japan) using Cu-Kα radiation (0.15405 nm) in the 2θ between 2° and 40° with a scanning rate of 8°/min. The applied voltage and current were 40 kV and 100 mA, respectively. Differential scanning calorimetry (DSC) curves were measured with a DSC 1/500 (Mettler Toledo, Co., Zurich, Switzerland) under the protection of nitrogen, and the temperature range was from 25 to 300 °C at a heating rate of 10 °C/min. Fourier transform infrared spectroscopy (FTIR) spectra were collected via the KBr tablet method using a Nexus Fourier transform infrared spectrometer (FTIR, Thermo Fisher, Waltham, MA, USA), focusing on the wavelength range of 4000 to 400 cm−1 at a resolution of 4 cm−1 under ambient conditions. The crystal morphology of the raw materials, physical mixture, and ICs were observed using scanning electron microscopy (SEM, TM3000, Hitachi, Tokyo, Japan).

2.5. Molecular Dynamics (MD) Simulation

MD simulations were carried out using GROMACS [33] to investigate the IC conformations in the solution. All molecular topology and structure files were obtained using Automated Topology Builder (ATB) [34]. The structural modifications of HP-β-CD and SBE-β-CD were obtained based on the β-CD framework acquired from ATB and further refined using Guessview6.0. The resulting structures were submitted to ATB for topology and molecular structure file generation via computation. Molecular modeling was performed using the open-source software Packmol [35]. The GROMOS96 force field was employed. The default steps and protocols of the MD were selected to optimize the system with an equilibrium of 100ps, and the production run was carried out for 10ns (NPT ensemble) in triplicate with a step of 2 fs at constant temperature (323K). The energies and guest dispositions were registered every 1000 steps. VMD [36] software was utilized to visualize the simulation results, ensuring that the outcomes were easily interpretable.

3. Results and Discussion

3.1. Phase Solubility Study

A standard curve equation was obtained by fitting the absorbance values of 9-fluorenone with the mass concentration, which is depicted in Figure 2A. The equation was A = 13.6875 m + 0.015, with a high fitting accuracy of R2 = 0.99986. The solubility curves of the various CDs at 25 °C are presented in Figure 2B, and the fitting curves and apparent stability constants K of the ICs were calculated and are listed in Table 1 and Table S1. The results indicated that increasing the concentration of CDs could linearly enhance the solubility of 9-fluorenone, and the enhancing capacity order was SBE-β- > HP-β- > β- > α- > γ-CD. Based on the Higuchi–Connors classification [37], the solubility curves belong to the AL type, which indicates that the stoichiometric ratio of 9-fluorenone and CDs in the liquid state was 1:1. The highest K value was detected for 9-fluorenone/SBE-β-CD (1528 M−1), followed by 9-fluorenone/HP-β-CD (799 M−1) and 9-fluorenone/β-CD (346 M−1). Notably, γ-CD showed almost no significant solubility-enhancing effect on 9-fluorenone, possibly due to insufficient intermolecular interaction forces between the γ-CD and 9-fluorenone molecules, resulting in weak inclusion effects. The solubility of 9-fluorenone was significantly increased by approximately 17-fold, 37-fold, 82-fold, 146-fold, and 2-fold, respectively, after forming complexes with α-, β-, HP-β-, SBE-β-, and γ-CD, as shown in Table 1. These findings suggest that natural CDs and their derivatives can significantly enhance the solubility of hydrophobic guest molecules, especially SBE-β-CD, which exhibits a more significant improvement in the stability and solubility of 9-fluorenone than natural CDs.

3.2. Characterization of 9-Fluorenone/CD ICs

Solid ICs of 9-fluorenone with β-CD, HP-β-CD, and SBE-β-CD were prepared using the cooling crystallization method. However, the solids of 9-fluorenone with α-CD and γ-CD obtained using the same method were determined to be physical mixtures after analysis, which may be due to their weaker binding ability in the liquid state. Figure S1 shows photographs of all the prepared ICs. As 9-fluorenone has a yellow crystalline form, the liquid ICs exhibit varying degrees of yellow coloration depending on their solubility. The solid ICs obtained are also pale-yellow powders.

3.2.1. Powder X-ray Diffraction

The PXRD patterns of 9-fluorenone, the CDs, physical mixtures, and ICs are presented in Figure 3. The diffraction peaks observed in the physical mixtures of all three CDs represent an overlay of the 9-fluorenone and CD spectra. The XRD pattern of the 9-fluorenone/β-CD IC shows new distinct diffraction peaks at 2θ = 4.9°, 7.1°, 7.5°, 10.0°, 14.0°, and 21.5°, which indicate that a new crystalline structure was formed. The disappearance of some of the characteristic peaks of β-CD and 9-fluorenone in the IC pattern suggests that the two compounds underwent a molecular rearrangement. The XRD pattern of 9-fluorenone/HP-β-CD IC shows two broad peaks at 2θ = 9.5° and 18.1°, which differ from those observed in HP-β-CD and the physical mixtures. The disappearance of the crystalline peak corresponding to 9-fluorenone in the X-ray diffraction pattern indicates the formation of an inclusion complex between 9-fluorenone and HP-β-CD. The complexation process leads to the amorphization of the guest molecule upon encapsulation within the CD cavity [38]. The amorphous state observed in the XRD pattern of 9-fluorenone/SBE-β-CD IC may indicate that 9-fluorenone is either present on the surface of SBE-β-CD or is present in a disordered state within the cavity of SBE-β-CD. Overall, the XRD results confirm the formation of solid ICs and provide evidence of the structural changes that occurred during complexation.

3.2.2. Fourier Transform Infrared Spectroscopy

Figure 4 shows the FTIR spectra of 9-fluorenone, the CDs, their physical mixtures, and the ICs. The FTIR spectrum of 9-fluorenone displays characteristic peaks at 667 cm−1, 725 cm−1, 758 cm−1, 915 cm−1, 1086 cm−1, 1297 cm−1, 1450 cm−1, 1592 cm−1, and 1710 cm−1. The peaks observed at 1450 cm−1 and 1592 cm−1 correspond to the stretching and bending vibrations of the benzene ring skeleton, respectively. The peak observed at 1710 cm−1 is attributed to the stretching vibration of the C=O bond [39]. The peaks observed at 667 cm−1 and 725 cm−1 are attributed to the bending vibrations of the =C-H bond [40]. A significant and broad absorption band is observed at 3280 cm−1 in the spectrum of β-CD, which is attributed to the stretching vibration of the O-H bond of the hydroxyl group. A small characteristic peak is observed at 2925 cm−1, which is attributed to the asymmetric stretching vibration of -CH2. The spectrum of HP- exhibits a characteristic peak of -CH3 stretching vibration at 2930 and 2837 cm−1. In the spectrum of SBE-CD, the peak observed at 1153 cm−1 is attributed to the stretching vibration of the S=O bond [41]. Distinct differences in characteristic peaks were observed upon comparing the spectra of the ICs and physical mixtures composed of compounds with the same dose ratio, indicating the successful preparation of ICs. In the spectrum of β-IC, the presence of C=O (1710 cm−1) and C=C (1592 cm−1) indicates that the basic skeleton of the 9-fluorenone structure has not changed. A comparison of the infrared spectra of the IC and prednisolone did not reveal any new peaks, indicating the absence of new chemical bonds. The presence of an -OH peak in the region of 3600 to 3100 cm−1 in the IC spectrum is due to the abundance of hydroxyl groups in β-CD. Many typical, characteristic peaks of 9-fluorenone are masked by the characteristic peaks of β-CD, indicating that 9-fluorenone is encapsulated within the cavity of β-CD. The -OH absorption band is observed to shift from 3290 to 3261 cm−1, a redshift phenomenon, indicating the formation of new hydrogen bonds between 9-fluorenone and β-CD [42].
Similarly, the -OH absorption band of HP-β-IC shifted from 3347 to 3310 cm−1, and that of SBE-β-IC shifted from 3372 to 3353 cm−1. This also indicates the formation of hydrogen bonds between 9-fluorenone and CDs. The intensity of the peak at 1710 cm−1 in the IC spectrum is also weak compared to that in the spectrum of 9-fluorenone alone, suggesting that the C=O bond in 9-fluorenone is involved in the inclusion complexation with CDs. The formation of hydrogen bonds between CDs and 9-fluorenone molecules can improve the solubility and stability of 9-fluorenone in aqueous solution by reducing the intermolecular attractive forces between 9-fluorenone molecules and enhancing the intermolecular interaction forces between 9-fluorenone and water molecules. Overall, the FTIR spectra provide strong evidence for the successful formation of ICs and the involvement of hydrogen bonding in the inclusion process, confirming the results of the solubility studies.

3.2.3. Differential Scanning Calorimetry

The DSC thermal spectra of 9-fluorenone, CDs, physical mixtures, and ICs are presented in Figure 5 (For detailed thermal analysis data see Table S2). The DSC curve of 9-fluorenone exhibits an endothermic peak at approximately 86 °C due to its melting. The endothermic peak of β-CD corresponds to the release of water from its cavity at approximately 65 °C. In the DSC curve of the β-CD IC sample, the melting peak of 9-fluorenone vanishes due to the formation of the IC, and the endothermic peak represents the evaporation of water in the IC, resulting in an increase in the dehydration temperature to approximately 75 °C [43]. In the DSC curve of HP-β-CD, two endothermic peaks emerge, corresponding to the evaporation of water and the melting temperature of the CD, respectively. In HP-β-CD IC, the dehydration temperature increases to approximately 70 °C, while the melting peak of HP-β-CD disappears, which might indicate that the melting point of the IC rose to above 300 °C. A similar situation occurs in SBE-β-CD IC, except that the dehydration temperature is lower than that of SBE-β-CD. The DSC spectra do not reveal the presence of 9-fluorenone, providing additional evidence that 9-fluorenone was fully incorporated into the IC. These findings demonstrate that the thermodynamic behavior of 9-fluorenone can be altered by combining it with different types of CDs.

3.2.4. Scanning Electron Microscopy and Polarized Light Microscopy

The SEM images provide valuable information about the morphology and particle size of the materials. Figure 6A demonstrates that pure 9-fluorenone exists as block-shaped crystals, whereas the morphology of the CDs varies depending on the type of CD. Specifically, β-CD appears as a particulate structure with a relatively small particle size, while HP-β-CD and SBE-β-CD exhibit spherical particulate structures. Both 9-fluorenone and CDs are present alone in the physical mixtures, according to Figure 6B, and they do not combine to produce a new solid form. The SEM images of β-CD IC show that its crystal morphology is one of massive, aggregated particles with a more uniform particle size distribution. The SEM images of HP-β-IC and SBE-β-IC show that they are both massive structures with a large particle size. Additionally, their morphology is completely different from the original, spherical, amorphous structure of CDs. Overall, these SEM images demonstrate the differences in morphology and structure between the ICs and their corresponding raw materials.

3.2.5. Polarized Light Microscopy

The crystal morphology of 9-fluorenone/β-CD IC in the liquid and solid states was observed using optical microscopy (Figure 7). It can clearly be seen that the IC is a rectangular, sheet-like crystal in the liquid state. When solid inclusion occurs, the flake crystals agglomerate together to form a granular product due to the small particle size, which is consistent with the SEM observation.

3.3. Molecular Dynamics Simulations

To investigate the binding mode of 9-fluorenone with the CDs in solution, MD simulations were performed. A water box of 4 × 4 nanometers was established, and the 9-fluorenone and CD molecules were placed inside it. Two initial position settings were chosen for each CD system to study the binding mode of the guest and host molecules (Figure 8). The final structures of different CD systems are presented in Figure 9. During the simulation process, the 9-fluorenone molecule could easily enter the CD cavity of α-, β-, and SBE-β-CD, regardless of the initial position settings. However, for HP-β-CD and γ-CD, 9-fluorenone could only enter the CD cavity from a specific direction. In the case of HP-β-CD, the substitution of the hydroxyl group at the CD’s primary hydroxyl end affects the entry of the guest molecule; hence, it can only enter the CD molecule through the secondary hydroxyl end. Meanwhile, γ-CD’s cavity size is significantly larger than that of the 9-fluorenone molecule, which prevents it from stably encapsulating the guest molecule (Figure S2). This explains the poorer solubilization effect of γ-CD. These findings provide insights into the binding mechanisms of CDs with guest molecules in solution.
Through MD simulations, we determined the stable configuration of the 9-fluorenone/CD ICs by comparing the binding energies between the host and guest molecules (Figure 10). The 9-fluorenone molecule was found to be upright inside the cavity of α-, β-, and SBE-β-CD, whereas it was tilted in HP-β-CD. The ICs were stabilized by hydrogen bonds formed between the 9-fluorenone molecule and the O or H atoms inside the CD cavity. Figure 11 illustrates the simulation results of the lower interaction energy for each CD at different initial positions. The root-mean-square deviation (RMSD) of the system was calculated to estimate the equilibration of the system (Figure 11A), and it was observed that each system reached equilibrium before 500 ps of the MD simulation, indicating that the simulation time was sufficient for each system. The number of hydrogen bonds formed between the 9-fluorenone molecule and the CD molecule is illustrated in Figure 11B. During the binding process with α-, β-, and SBE-β-CDs, the 9-fluorenone molecule formed one or two hydrogen bonds, whereas with HP-β-CD, it formed three hydrogen bonds at certain times, which may be attributed to the orientation of the 9-fluorenone molecule inside the cavity. This is consistent with the red shift of the hydroxyl peaks in the FTIR spectrum. It was found that hydrogen bonds were not the absolute factor affecting the water solubility of the ICs but were important for the stable existence of the structure of the ICs. The interaction energy between the host and guest molecules at different initial positions is shown in Figure S3. Van der Waals interactions contribute far more to the total interaction of the IC system than electrostatic interactions [44]. The collective interaction energies between the host and guest molecules is presented in Figure 11C. Among the four CDs, the interaction energy between SBE-β-CD and the 9-fluorenone molecule is the lowest, with an average value of approximately 120 kJ/mol. This indicates that the complex structure of SBE-β-CD and 9-fluorenone is the most stable among the four CDs, which also explains why it has the strongest solubilization ability. Finally, the solvent-accessible surface area (SASA) of the 9-fluorenone molecule was analyzed during the simulation. The SASA of 9-fluorenone could be seen to decrease and then remain stable, indicating that the guest molecule was encapsulated, thereby reducing its area of contact with the solvent. After reaching the equilibrium state, the SASA of 9-fluorenone was almost identical after its inclusion in the different CDs, indicating that each type of CD can stably contain 9-fluorenone molecules within its cavity to an almost equal extent. In the MD experiments, we did not search for signs of the unstable formation of α-CD with 9-fluorenone in the liquid state; hence, the reason for its inability to form a solid IC may be related to the mechanism of supramolecular self-assembly during crystallization, and further studies are needed.

4. Conclusions

In this study, we utilized phase solubility analysis to investigate the solubilization effects of different CDs on 9-fluorenone. Our results revealed significant differences in the solubilization efficiency of the different CDs towards 9-fluorenone. Specifically, SBE-β-CD exhibited the highest solubilization ability, with an apparent stability constant of 1527 M−1, followed by HP-β-CD, β-CD, and α-CD, while γ-CD showed the weakest solubilization efficacy. Additionally, it was confirmed that ICs were formed between 9-fluorenone and the CDs in a 1:1 ratio in the liquid phase. We successfully prepared three solid ICs of 9-fluorenone using the cooling crystallization method and characterized them using various techniques, including PXRD, FTIR, DSC, and SEM. MD simulation was employed to investigate the binding modes between 9-fluorenone and the CDs in the liquid phase. Our results revealed that the binding between SBE-β-CD and 9-fluorenone was the most stable, which was consistent with the findings of the phase solubility experiments. Hydrogen bonding and van der Waals interactions were found to play crucial roles in stabilizing the ICs. Overall, our study provides theoretical and experimental support for the design and preparation of ICs of OPAHs in the environment and offers a green and environmentally friendly method for their removal from soil. Furthermore, the successful production of solid ICs provides guidance for the removal of these pollutants from water.

Supplementary Materials

The following are available online at https://www.mdpi.com/article/10.3390/cryst13050775/s1, Figure S1: Photographs of the prepared 9-fluorenone/CD ICs in (A) the liquid state and (B) the solid state; Figure S2: Binding process of 9-fluorenone with γ-CD; Figure S3: The interaction energy of host and guest molecules of different conformations; Table S1: Data and fitted equations for 9-fluorenone at different CD concentrations; Table S2: Thermal analysis data.

Author Contributions

Conceptualization, Y.N.; methodology, Y.N.; validation, L.Z., H.W. and J.D.; formal analysis, Y.N.; data curation, H.W. and L.Z.; writing—original draft preparation, Y.N.; writing—review and editing, Y.N., L.Z. and Q.Y. visualization, B.H. and Y.B. All authors have read and agreed to the published version of the manuscript.

Funding

The authors are grateful for the financial support of the Tianjin Municipal Natural Science Foundation (No. 21JCYBJC00600).

Data Availability Statement

Not applicable.

Conflicts of Interest

The authors declare no conflict of interest.

References

  1. Zhang, X.Y.; Yu, T.; Li, X.; Yao, J.Q.; Liu, W.G.; Chang, S.L.; Chen, Y.G. The fate and enhanced removal of polycyclic aromatic hydrocarbons in wastewater and sludge treatment system: A review. Crit. Rev. Environ. Sci. Technol. 2019, 49, 1425–1475. [Google Scholar] [CrossRef]
  2. Qiao, M.; Qi, W.; Liu, H.; Qu, J. Oxygenated polycyclic aromatic hydrocarbons in the surface water environment: Occurrence, ecotoxicity, and sources. Environ. Int. 2022, 163, 107232. [Google Scholar] [CrossRef]
  3. Pulleyblank, C.; Cipullo, S.; Campo, P.; Kelleher, B.; Coulon, F. Analytical progress and challenges for the detection of oxygenated polycyclic aromatic hydrocarbon transformation products in aqueous and soil environmental matrices: A review. Crit. Rev. Environ. Sci. Technol. 2019, 49, 357–409. [Google Scholar] [CrossRef]
  4. Krzyszczak, A.; Czech, B. Occurrence and toxicity of polycyclic aromatic hydrocarbons derivatives in environmental matrices. Sci. Total Environ. 2021, 788, 147738. [Google Scholar] [CrossRef]
  5. Yu, H.T. Environmental carcinogenic polycyclic aromatic hydrocarbons: Photochemistry and phototoxicity. J. Environ. Sci. Health Part C-Environ. Carcinog. Ecotoxicol. Rev. 2002, 20, 149–183. [Google Scholar] [CrossRef]
  6. Clerge, A.; Le Goff, J.; Lopez, C.; Ledauphin, J.; Delepee, R. Oxy-PAHs: Occurrence in the environment and potential genotoxic/mutagenic risk assessment for human health. Crit. Rev. Toxicol. 2019, 49, 302–328. [Google Scholar] [CrossRef]
  7. Ma, X.; Wu, S. Oxygenated polycyclic aromatic hydrocarbons in food: Toxicity, occurrence and potential sources. Crit. Rev. Food Sci. Nutr. 2022, 1–22. [Google Scholar] [CrossRef] [PubMed]
  8. Cao, W.; Yuan, J.; Geng, S.; Zou, J.; Dou, J.; Fan, F. Oxygenated and Nitrated Polycyclic Aromatic Hydrocarbons: Sources, Quantification, Incidence, Toxicity, and Fate in Soil—A Review Study. Processes 2022, 11, 52. [Google Scholar] [CrossRef]
  9. Bandowe, B.A.M.; Lueso, M.G.; Wilcke, W. Oxygenated polycyclic aromatic hydrocarbons and azaarenes in urban soils: A comparison of a tropical city (Bangkok) with two temperate cities (Bratislava and Gothenburg). Chemosphere 2014, 107, 407–414. [Google Scholar] [CrossRef] [PubMed]
  10. Fu, P.P.; Xia, Q.; Sun, X.; Yu, H. Phototoxicity and environmental transformation of polycyclic aromatic hydrocarbons (PAHs)-light-induced reactive oxygen species, lipid peroxidation, and DNA damage. J. Environ. Sci. Health C Environ. Carcinog. Ecotoxicol. Rev. 2012, 30, 1–41. [Google Scholar] [CrossRef] [PubMed]
  11. Albinet, A.; Leoz-Garziandia, E.; Budzinski, H.; ViIlenave, E. Polycyclic aromatic hydrocarbons (PAHs), nitrated PAHs and oxygenated PAHs in ambient air of the Marseilles area (South of France): Concentrations and sources. Sci. Total Environ. 2007, 384, 280–292. [Google Scholar] [CrossRef]
  12. Lammel, G.; Kitanovski, Z.; Kukucka, P.; Novak, J.; Arangio, A.M.; Codling, G.P.; Filippi, A.; Hovorka, J.; Kuta, J.; Leoni, C.; et al. Oxygenated and Nitrated Polycyclic Aromatic Hydrocarbons in Ambient Air-Levels, Phase Partitioning, Mass Size Distributions, and Inhalation Bioaccessibility. Environ. Sci. Technol. 2020, 54, 2615–2625. [Google Scholar] [CrossRef] [PubMed]
  13. Ji, B.; Liu, Y.; Wu, Y.; Gao, S.; Zeng, X.; Yu, Z. Occurrence, Source and Potential Ecological Risk of Parent and Oxygenated Polycyclic Aromatic Hydrocarbons in Sediments of Yangtze River Estuary and Adjacent East China Sea. Ecol. Environ. Sci. 2022, 31, 1400–1408. [Google Scholar]
  14. Badr, T.; Hanna, K.; de Brauer, C. Enhanced solubilization and removal of naphthalene and phenanthrene by cyclodextrins from two contaminated soils. J. Hazard. Mater. 2004, 112, 215–223. [Google Scholar] [CrossRef]
  15. Fai, P.B.; Grant, A.; Reid, B.J. Compatibility of hydroxypropyl-beta-cyclodextrin with algal toxicity bioassays. Environ. Pollut. 2009, 157, 135–140. [Google Scholar] [CrossRef]
  16. Tijunelyte, I.; Dupont, N.; Milosevic, I.; Barbey, C.; Rinnert, E.; Lidgi-Guigui, N.; Guenin, E.; de la Chapelle, M.L. Investigation of aromatic hydrocarbon inclusion into cyclodextrins by Raman spectroscopy and thermal analysis. Environ. Sci. Pollut. Res. Int. 2017, 24, 27077–27089. [Google Scholar] [CrossRef]
  17. Crini, G. Review: A history of cyclodextrins. Chem. Rev. 2014, 114, 10940–10975. [Google Scholar] [CrossRef]
  18. Harada, A.; Takashima, Y.; Yamaguchi, H. Cyclodextrin-based supramolecular polymers. Chem. Soc. Rev. 2009, 38, 875–882. [Google Scholar] [CrossRef] [PubMed]
  19. Cid-Samamed, A.; Rakmai, J.; Mejuto, J.C.; Simal-Gandara, J.; Astray, G. Cyclodextrins inclusion complex: Preparation methods, analytical techniques and food industry applications. Food Chem. 2022, 384, 132467. [Google Scholar] [CrossRef]
  20. Ferreira, L.; Campos, J.; Veiga, F.; Cardoso, C.; Paiva-Santos, A.C. Cyclodextrin-based delivery systems in parenteral formulations: A critical update review. Eur. J. Pharm. Biopharm. 2022, 178, 35–52. [Google Scholar] [CrossRef]
  21. Topuz, F.; Uyar, T. Cyclodextrin-functionalized mesostructured silica nanoparticles for removal of polycyclic aromatic hydrocarbons. J. Colloid Interface Sci. 2017, 497, 233–241. [Google Scholar] [CrossRef]
  22. Mazurek, A.H.; Szeleszczuk, L.; Gubica, T. Application of Molecular Dynamics Simulations in the Analysis of Cyclodextrin Complexes. Int. J. Mol. Sci. 2021, 22, 9422. [Google Scholar] [CrossRef] [PubMed]
  23. Wu, H.T.; Chuang, Y.H.; Lin, H.C.; Hu, T.C.; Tu, Y.J.; Chien, L.J. Immediate Release Formulation of Inhaled Beclomethasone Dipropionate-Hydroxypropyl-Beta-Cyclodextrin Composite Particles Produced Using Supercritical Assisted Atomization. Polymers 2022, 14, 2114. [Google Scholar] [CrossRef] [PubMed]
  24. Franco, P.; De Marco, I. Preparation of non-steroidal anti-inflammatory drug/β-cyclodextrin inclusion complexes by supercritical antisolvent process. J. CO2 Util. 2021, 44, 101397. [Google Scholar] [CrossRef]
  25. Gbeddy, G.; Goonetilleke, A.; Ayoko, G.A.; Egodawatta, P. Transformation and degradation of polycyclic aromatic hydrocarbons (PAHs) in urban road surfaces: Influential factors, implications and recommendations. Environ. Pollut. 2020, 257, 113510. [Google Scholar] [CrossRef] [PubMed]
  26. Ding, Z.Z.; Yi, Y.Y.; Zhang, Q.Z.; Zhuang, T. Theoretical investigation on atmospheric oxidation of fluorene initiated by OH radical. Sci. Total Environ. 2019, 669, 920–929. [Google Scholar] [CrossRef]
  27. Bandowe, B.A.M.; Sobocka, J.; Wilcke, W. Oxygen-containing polycyclic aromatic hydrocarbons (OPAHs) in urban soils of Bratislava, Slovakia: Patterns, relation to PAHs and vertical distribution. Environ. Pollut. 2011, 159, 539–549. [Google Scholar] [CrossRef]
  28. Yadav, I.C.; Devi, N.L.; Singhd, V.K.; Li, J.; Zhang, G. Concentrations, sources and health risk of nitrated- and oxygenated-polycyclic aromatic hydrocarbon in urban indoor air and dust from four cities of Nepal. Sci. Total Environ. 2018, 643, 1013–1023. [Google Scholar] [CrossRef]
  29. Shen, G.F.; Tao, S.; Wang, W.; Yang, Y.F.; Ding, J.N.; Xue, M.A.; Min, Y.J.; Zhu, C.; Shen, H.Z.; Li, W.; et al. Emission of Oxygenated Polycyclic Aromatic Hydrocarbons from Indoor Solid Fuel Combustion. Environ. Sci. Technol. 2011, 45, 3459–3465. [Google Scholar] [CrossRef]
  30. Qiao, M.; Qi, W.X.; Liu, H.J.; Qu, J.H. Occurrence, behavior and removal of typical substituted and parent polycyclic aromatic hydrocarbons in a biological wastewater treatment plant. Water Res. 2014, 52, 11–19. [Google Scholar] [CrossRef]
  31. Connors, K.A. Population Characteristics of Cyclodextrin Complex Stabilities in Aqueous Solution. J. Pharm. Sci. 1995, 84, 843. [Google Scholar] [CrossRef] [PubMed]
  32. Connors, K.A. The Stability of Cyclodextrin Complexes in Solution. Chem. Rev. 1997, 97, 1325–1357. [Google Scholar] [CrossRef] [PubMed]
  33. Van der Spoel, D.; Lindahl, E.; Hess, B.; Groenhof, G.; Mark, A.E.; Berendsen, H.J.C. GROMACS: Fast, flexible, and free. J. Comput. Chem. 2005, 26, 1701–1718. [Google Scholar] [CrossRef]
  34. Stroet, M.; Caron, B.; Visscher, K.M.; Geerke, D.P.; Malde, A.K.; Mark, A.E. Automated Topology Builder Version 3.0: Prediction of Solvation Free Enthalpies in Water and Hexane. J. Chem. Theory Comput. 2018, 14, 5834–5845. [Google Scholar] [CrossRef] [PubMed]
  35. Martinez, L.; Andrade, R.; Birgin, E.G.; Martinez, J.M. PACKMOL: A Package for Building Initial Configurations for Molecular Dynamics Simulations. J. Comput. Chem. 2009, 30, 2157–2164. [Google Scholar] [CrossRef] [PubMed]
  36. Humphrey, W.; Dalke, A.; Schulten, K. VMD: Visual molecular dynamics. J. Mol. Graph. 1996, 14, 33–38. [Google Scholar] [CrossRef]
  37. Connors, K.; Higuchi, T. Phase solubility techniques. Adv. Anal. Chem. Instrum. 1965, 4, 117–212. [Google Scholar]
  38. Narayanan, G.; Boy, R.; Gupta, B.S.; Tonelli, A.E. Analytical techniques for characterizing cyclodextrins and their inclusion complexes with large and small molecular weight guest molecules. Polym. Test. 2017, 62, 402–439. [Google Scholar] [CrossRef]
  39. Celebioglu, A.; Wang, N.; Kilic, M.E.; Durgun, E.; Uyar, T. Orally Fast Disintegrating Cyclodextrin/Prednisolone Inclusion-Complex Nanofibrous Webs for Potential Steroid Medications. Mol. Pharm. 2021, 18, 4486–4500. [Google Scholar] [CrossRef]
  40. Park, K.H.; Choi, J.M.; Cho, E.; Jung, S. Enhanced Solubilization of Fluoranthene by Hydroxypropyl beta-Cyclodextrin Oligomer for Bioremediation. Polymers 2018, 10, 111. [Google Scholar] [CrossRef]
  41. Huang, T.; Zhao, Q.; Su, Y.; Ouyang, D. Investigation of molecular aggregation mechanism of glipizide/cyclodextrin complexation by combined experimental and molecular modeling approaches. Asian J. Pharm. Sci. 2019, 14, 609–620. [Google Scholar] [CrossRef] [PubMed]
  42. Ma, Y.; Niu, Y.; Yang, H.; Dai, J.; Lin, J.; Wang, H.; Wu, S.; Yin, Q.; Zhou, L.; Gong, J. Prediction and design of cyclodextrin inclusion complexes formation via machine learning-based strategies. Chem. Eng. Sci. 2022, 261, 117946. [Google Scholar] [CrossRef]
  43. Roik, N.; Belyakova, L. IR Spectroscopy, X-ray diffraction and thermal analysis studies of solid ‘b-cyclodextrin-para-aminobenzoic acid’ inclusion complex. Phys. Chem. Solid State 2011, 12, 168–173. [Google Scholar]
  44. Mahalapbutr, P.; Wonganan, P.; Charoenwongpaiboon, T.; Prousoontorn, M.; Chavasiri, W.; Rungrotmongkol, T. Enhanced Solubility and Anticancer Potential of Mansonone G By beta-Cyclodextrin-Based Host-Guest Complexation: A Computational and Experimental Study. Biomolecules 2019, 9, 545. [Google Scholar] [CrossRef] [PubMed]
Figure 1. Molecular structure of (A) 9-fluorenone, (B) α-CD, (C) β-CD, (D) γ-CD, (E) (2-hydroxypropyl)-β-CD, (F) sulfobutylether-β-CD.
Crystals 13 00775 g001
Figure 2. (A) Standard UV curve of 9-fluorenone. (B) The phase solubility curve of 9-fluorenone/CDs.
Crystals 13 00775 g002
Figure 3. Powder X-ray diffraction pattern of 9-fluorenone, CDs, physical mixtures, and ICs.
Crystals 13 00775 g003
Figure 4. FTIR spectra of 9-fluorenone, CDs, physical mixtures, and ICs.
Crystals 13 00775 g004
Figure 5. DSC thermogram of 9-fluorenone, CDs, physical mixtures, and ICs.
Crystals 13 00775 g005
Figure 6. SEM images of (A) raw materials, (B) physical mixtures, and (C) ICs.
Crystals 13 00775 g006
Figure 7. Light micrographs of 9-fluorenone/β-CD IC: (A) in the liquid state and (B) in the solid state (a drop of cedar oil for better observation).
Crystals 13 00775 g007
Figure 8. Two conformations of the initial position setting of 9-fluorenone toward the head (H) or tail (T) of different CDs.
Crystals 13 00775 g008
Figure 9. The final structure of 9-fluorenone/CDs based on simulations at two initial positions. (For clearer viewing, the C, O, and H atoms of 9-fluorenone are shown in purple, red, and silver, respectively. The C and H atoms of the CDs are shown in white, the S atom in yellow, and the Na+ in blue).
Crystals 13 00775 g009
Figure 10. Stable conformation and hydrogen bonding (blue dotted line) of 9-fluorenone with CDs.
Crystals 13 00775 g010
Figure 11. MD results: (A) RMSD of the system with the simulation time (ps); (B) the number of hydrogen bonds during the simulation; (C) total interaction energy between 9--fluorenone and CDs; (D) solvent-accessible and surface area (SASA) values of 9-fluorenone with the simulation time (ps).
Crystals 13 00775 g011
Table 1. Apparent stability constants (K, M−1) and solubilization efficiency (Se) for the 9-fluorenone/CD ICs.
CD TypesSlopeR2K(M−1)Se
α-CD0.01300.9935144.217
β-CD0.030840.9911345.937
HP-β-CD0.06840.9989798.682
SBE-β-CD0.123240.99911527.9146
γ-CD0.0007030.90187.62
Disclaimer/Publisher’s Note: The statements, opinions and data contained in all publications are solely those of the individual author(s) and contributor(s) and not of MDPI and/or the editor(s). MDPI and/or the editor(s) disclaim responsibility for any injury to people or property resulting from any ideas, methods, instructions or products referred to in the content.

