Abstract
In this study, the formation and evolution mechanism of residual stress in the process of solution heat treatment of a 316L/Q235B composite plate and the influence law of different factors on residual stress were analyzed by combining experiments and simulation. The results showed that the bending stress caused by interlayer thermal stress was the main factor that formed residual stress in the process of solution heat treatment of a 316L/Q235B composite plate. Tensile load was helpful to reduce the bending deformation of the composite plate during heat treatment, and ultimately improve the uniformity of residual stress distribution in the composite plate. With the increase in the total thickness, the interlayer thermal stress and bending stress between layers increased, and the primary and secondary relationship between them and residual stress was related to the specific thickness. The composite ratio had a great influence on the distribution of residual stress. When the composite ratio increased, the interlayer thermal stress between layers of the base layer increased, while that of the cladding layer decreased. At the same time, the bending stress increased with the increase in the composite ratio, and then affected the residual stress distribution.
1. Introduction
There are many kinds of high performance steels, each with their own performance advantages. The special alloy composition and relatively complicated production process bring high production costs to this kind of steel strip, which limits its application in engineering [1,2]. Given this background, a new metal composite plate can not only keep the performance advantages of each material layer, but it can also significantly reduce the consumption and production cost of precious metals, which affords high social and economic benefits [3]. The 316L/Q235B composite plate is composed of a base layer (Q235B low carbon steel) and a cladding layer (316L stainless steel) by hot rolling [4,5], explosion [6], casting [7] and other methods. It combines the good corrosion resistance of 316L stainless steel and the structural strength of Q235B low carbon steel, which can effectively reduce the material cost. It has been widely used in the aerospace [8], petrochemical [9], and shipbuilding industries [10].
In order to ensure and improve the thermophysical and mechanical properties of each material layer, it is necessary to heat treat the prepared composite plate. Wachowski et al. [11] carried out the heat treatment of a titanium/steel composite plate at 600 °C for 90 min, cooled it to 300 °C with the furnace, and air-cooled it to room temperature. The research showed that the common heat treatment process of titanium/steel composite plates has a significant negative impact on the microstructure and mechanical properties of the composite plates because of the formation of brittle intermetallic compounds. Prasanthi et al. [12] optimized the temperature window and time of heat treatment for 304 l stainless steel and a Ti-5Ta-2Nb alloy to avoid the formation of brittle interface Fe-Ti intermetallic compounds. Because of the different material properties and functional requirements of stainless steel and low carbon steel, the different characteristics of heterogeneous metals must be considered at the same time when formulating the heat treatment process of the 316L/Q235B composite plate, so as to obtain the best comprehensive properties [13,14]. The influence of heat treatment on the microstructure and mechanical properties of a stainless steel composite plate has been widely considered by scholars at home and abroad. Shen Chunyu et al. [15] studied the effect of different heat treatment temperatures on the microstructure and properties of a 316L/Q235B explosive welded composite plate. It was found that, with the increase in heat treatment temperature, the tensile strength, shear strength, and interface hardness of the composite plate decreased, and the elongation after fracture increased. Jin Herong et al. [16] put forward the heat treatment process of a vacuum hot-rolled 316L/Q345R composite plate with rapid cooling at high temperatures and slow cooling at low temperatures, which realized the synergistic effect of the multiphase structure of the alloy elements and interfacial diffusion. Lei Dong et al. [17] verified that the heat treatment system was also suitable for a 316L/Q235 hot-rolled composite plate, which could improve the corrosion resistance of the cladding and the mechanical properties of the base layer at the same time.
At present, the research method of establishing a material constitutive model by combining simulation with experimentation and then conducting finite element simulation of the material processing has been widely used [18]. Chen Junjie [19] used the thermal-mechanical coupling constitutive model and the thermal microstructure mechanical coupling constitutive model to predict the residual stress evolution of GH4169 alloy samples during quenching and quenching plus aging. Ding Wenhong [20] used an ABAQUS secondary development system to analyze the evolution process of residual stress during continuous cooling and annealing of a high strength steel, and verified the practicability of a finite element simulation in residual stress prediction. As a widely used structural material, the evolution and distribution of residual stress during heat treatment are important factors affecting its service life. At present, there is little relevant research at home and abroad.
In this paper, the stress–strain curves of 316L and Q235B at different deformation temperatures were obtained by thermal simulation tests, and the parameters of a thermoplastic constitutive model were respectively fitted. The constitutive relation was written into ABAQUS software as a UMAT subroutine, and the tensile test was simulated to verify the accuracy of the constitutive model. Based on boundary conditions such as temperature and external load, a numerical simulation model of solution heat treatment of a 316L/Q235B composite plate was established. The formation and evolution mechanism of residual stress in the process of solution heat treatment of the composite plate were analyzed, and the influence of different factors on residual stress was discussed.
2. Experimental Modeling of Thermoplastic Constitutive Model
2.1. Study on Thermal Tensile Test
The yield strength, tensile strength, and other performance parameters of metal materials are closely related to conditions such as temperature and strain rate. Therefore, it is necessary to test the mechanical properties of materials at different temperatures and relevant strain rates [21]. In this study, the Gleeble thermal simulation testing machine was used to conduct the thermal tensile test of the material. The sample size is shown in Figure 1. The tensile strain rate was 0.001/s, and the temperatures were 25, 200, 400, 600, 800, 1000 °C, respectively. The real flow stress–strain data of the material was obtained, and the thermoplastic constitutive model of the material was established based on the experimental results, which provided the basis for the numerical simulation of the heat treatment process of the 316L/Q235B composite plate. The materials of the hot tensile test were 316L and Q235B, whose thicknesses were 3 mm and 3.75 mm, respectively. Their chemical compositions are shown in Table 1.

Figure 1.
Tensile test sample.

Table 1.
Chemical constituents of 316L and Q235B (mass fraction, %).
The materials were cut into the tensile test samples as shown in Figure 2 by wire electrode cutting according to the size shown in Figure 1, and they were numbered according to the tensile temperature: I was 25 °C, II was 200 °C, III was 400 °C, IV was 600 °C, V was 800 °C, and VI was 1000 °C.
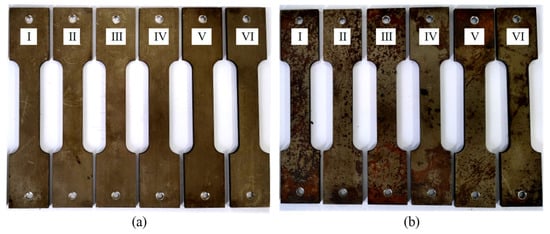
Figure 2.
Tensile test sample. (a) 316L; (b) Q235B.
Figure 3a,b show the real flow stress–strain curves of the 316L and Q235B obtained by Gleeble high temperature tensile tests at different temperatures. As can be seen from Figure 3, the flow stress of the 316L and Q235B increased with the increase in flow strain and decreased with the increase in temperature.
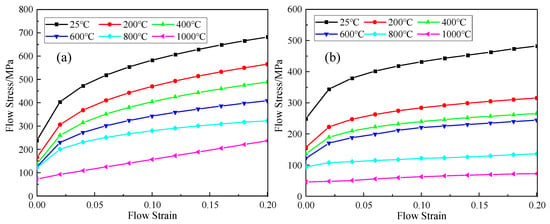
Figure 3.
Real flow stress-strain curve. (a) 316L; (b) Q235B.
2.2. Establishment of Thermoplastic Constitutive Model
The traditional Johnson–Cook constitutive model has been widely used to study the dynamic mechanical properties of metal materials under large strain, high temperature, and high strain rate [15]. Equation (1) is the basic form of the Johnson–Cook constitutive model. The three factors of the model represent the strain hardening effect, the strain rate strengthening effect, and the temperature softening effect, respectively [22].
where is the equivalent stress (flow stress), and A is the yield limit of the material under and . B is the strain hardening rate. is the equivalent plastic strain. n is the strain hardening index. C is the strain rate sensitivity. is the equivalent plastic strain rate. is the reference plastic strain rate. is the melting temperature of the material. is the room temperature; m is the temperature softening coefficient. Among them, A, B, n, C, and m are physical properties of the material parameters to be determined.
In the JC constitutive equation, the strain hardening effect, strain rate strengthening effect, and temperature softening effect are independent of each other, and the overall effect is the multiplication of the three, regardless of the coupling effect among them [23]. Under the conditions of low strain rate, small deformation, and high temperature, it is impossible to accurately describe the constitutive state of the materials. In order to improve the calculation accuracy of the model, scholars usually make some improvements to the traditional JC constitutive equation to adapt to the performance prediction of the different materials under specific working conditions. Zhang et al. [22] chose the one-dimensional form of the Gaussian function to fit the strain hardening coefficient and constructed the relationship between the strain hardening rate and temperature for the numerical simulation analysis. Ye et al. [24] used a quadratic polynomial function to describe the strain hardening and coupled effects of the strain rate and temperature to describe the high temperature flow behavior of a TA12 titanium alloy.
On the basis of not considering the strain rate effect, this paper simplified the traditional JC constitutive equation and added several different temperature influence functions to the strain hardening term, which strengthened the influence of temperature on the model.
First, let . The term considering the strain rate effect is simplified to 1; then, considering the coupling relationship between the temperature softening effect and strain hardening effect, the temperature softening effect is converted into several different temperature influence functions, which are added to the strain hardening term. The thermoplastic constitutive model of the material shown in Equation (2) is obtained:
where is the equivalent stress (flow stress) in the original JC constitutive equation, A is the yield strength of the material under conditions of quasi-static deformation and . In the Equation (2), it is multiplied by the coefficient term to describe the change law of the initial flow stress of the material with temperature, and m and p are temperature softening coefficients. The strain hardening rate coefficient B of the original JC constitutive equation is transformed into as a function of , which, together with n, constitute the strain hardening rate parameter coupled with the temperature softening effect. is the equivalent plastic strain; is the melting temperature of the material; is the room temperature. A, p, , n, and m are quantities to be determined.
2.3. Determination of the Parameters of the Thermoplastic Constitutive Model of Each Material Layer
According to the real flow stress–strain curves of the 316L and Q235B obtained by Gleeble high temperature tensile test at different temperatures, the parameters of the thermoplastic constitutive model were determined: A, m, p, , n. The solid–liquid phase transition points of the 316L and Q235B are taken as the melting temperatures which were 1410.52 °C and 1471.4 °C, respectively, with a . When , , and . The yield strength of material is only related to temperature, as shown in Equation (3):
where A is the yield strength of the material when . After taking the natural logarithm of both sides of Equation (3), we obtain:
Equation (4) is a linear equation with as the dependent variable and as the independent variable. The m and are the slope and intercept of the linear equation respectively, which can be obtained from the straight line fitted by the high temperature strength data of the materials. As shown in Figure 4.
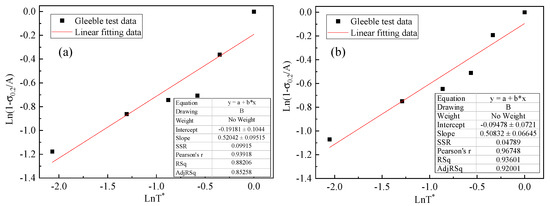
Figure 4.
Parameter fitting of m and p of 316L and Q235B material constitutive models. (a) 316L; (b) Q235B.
After calculation, the constitutive model parameters of the 316L were m = 0.524, and p = 0.825; the constitutive model parameters of the Q235B were m = 0.5083, and p = 0.9096. For the strain hardening rate parameters and n of the thermoplastic constitutive model coupled with the temperature softening effect, it is necessary to use the real stress–strain curve data of the material at a high temperature to determine their values [25]. For specific temperature conditions, the relationship between flow stress and equivalent plastic strain is as follows:
where is the equivalent plastic strain, is the equivalent stress (flow stress), and is the initial yield strength at a specific temperature. Organizing the above formula and taking the logarithm on both sides yields:
Equation (6) is a linear equation with as the dependent variable and as the independent variable; n and are the slope and intercept of the linear equation. According to the true stress–strain curves of the 316L and Q235B, the and n at different temperatures were calculated. The results are as follows.
From Figure 5, it can be seen that, with the increase in temperature, the strain hardening rate parameter changed greatly, and the n value changed relatively little. Therefore, when establishing the constitutive model of material, was used as a dependent variable and was used as an independent variable. The polynomial function was fitted, as is shown in Equation (7), and the n value was averaged for further calculation.
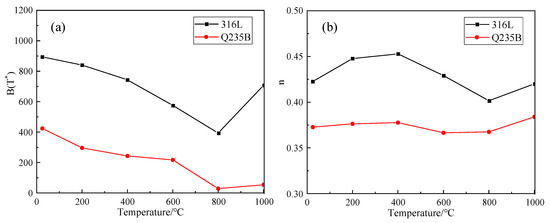
Figure 5.
Fitting values of B and n parameters of 316L and Q235B. (a) Change of B parameter with temperature. (b) Change of n parameter with temperature.
Where is a constant, and the number of polynomial fitting k depends on the fitting accuracy. Generally, the value of k should ensure that the correlation coefficient between the experimental value and the predicted value is 0.8~1. The fitting results of each layer of the composite plate are shown in Figure 6.
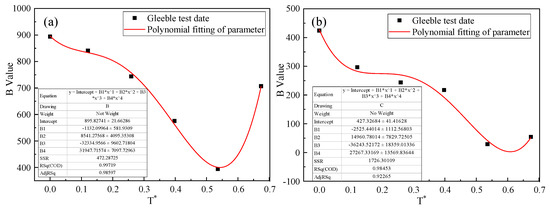
Figure 6.
Fitting value of parameter B of 316L and Q235B. (a) 316L parameter B fitting value. (b) Q235B parameter B fitting value.
After fitting, the strain hardening rate parameter of 316L and Q235B between 25 °C~1200 °C is shown in Equation (8), and the n value was averaged [26], 0.44,
0.40.
So far, at different temperatures (25 °C~1200 °C), the physical parameters A, m, p, , of the improved JC constitutive equation of the 316L and Q235B have been obtained. Next, the established constitutive model was compiled into UMAT subroutine, which was written into ABAQUS software to simulate the process, and the influence of different factors on the residual stress of the 316L/Q235B composite plate during solution heat treatment will be discussed.
3. Study on Numerical Simulation Model of Heat Treatment
3.1. Numerical Realization of Constitutive Model of Thermoplastic
In the ABAQUS finite element software, UMAT is a FORTRAN program interface for user-defined material properties, which can better implement material models that are not available in the ABAQUS material library [23,27]. In UMAT programming, a fully implicit stress updating algorithm [27] is used to calculate the increment of plastic strain and internal variables at the end of each time increment step. Considering the flow deformation behavior of the materials (316L and Q235B) and the established thermoplastic constitutive model, the calculation was performed according to the J2 flow theory and the isotropic hardening rule [23]. The Mises yield criterion expression is shown in Equation (10):
where is the initial yield state at time t, is the subsequent yield state at time ; are the stress states of the material in the three directions of x, y, and z, respectively; and and are initial and subsequent yield strength, respectively. When the material enters the subsequent yield state, the elastoplastic linear strengthening constitutive relation is:
where H is the plastic modulus (hardening coefficient) of the material. In the established thermoplastic constitutive model of the material, is the strain hardening rate effect term coupled with the temperature softening factor. is the equivalent plastic strain at the time . By combining the J2 flow theory, the isotropic hardening rule, the Mises subsequent yield criterion, and the basic calculation principle of finite element [22,23,27,28,29,30], the nonlinear stress–strain increment Equation (12) is derived:
where is the subsequent yield stress of the material, which is calculated by the established thermoplastic constitutive equation, where . The value of the equivalent plastic strain increment can be obtained by solving the nonlinear Equation (12) in ABAQUS software using a Newton iterative numerical solution method [22,23,30]. The UMAT subroutine incremental step calculation process is shown in Figure 7.
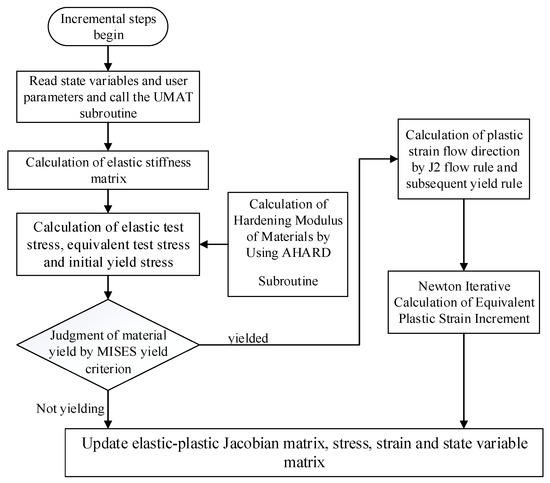
Figure 7.
UMAT subroutine incremental step calculation flow chart.
3.2. Experimental Verification of Thermoplastic Constitutive Model
The UMAT subroutine and the constitutive model parameters of the thermoplastic material were connected to the ABAQUS/Standard. The tensile test of 316L and Q235B at high temperature was simulated using the finite element method. The simulation results were compared with the Gleeble tensile test results. The accuracy of the established thermoplastic constitutive model and UMAT subroutine was verified. The 3D finite element simulation model of tensile sample is shown in the Figure 8. The size and shape of the model are the same as the samples in Figure 1. The tensile sample was stretched by a displacement load. A fully fixed constraint was applied to one end of the sample, the displacement constraints were imposed in the width and thickness directions at the other end, and a displacement load was applied in the length direction to simulate the stretching process of the sample.

Figure 8.
3D finite element model of tensile sample.
In the simulation process, the sequential coupling method was used to realize the coupling of the temperature field and the stress–strain field [31,32]. First, the temperature field was calculated, and, then, the temperature field was applied as a predefined field condition to the stress–strain calculation model to further calculate the stress–strain under displacement load. The properties of the 316L and Q235B-dependent temperature were set during calculation. The material performance parameters were calculated by JmatPro [14,16,33], as is shown in Figure 9.
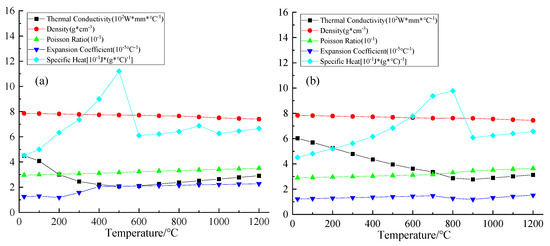
Figure 9.
High temperature performance parameters of materials. (a) 316L; (b) Q235B.
Figure 10 and Figure 11 are the simulated cloud pictures of the tensile test of the 316L and Q235B at different temperatures. The real flow stress and strain results obtained by ABAQUS simulation were output and compared with the Gleeble tensile test results, as are shown in Figure 12. It can be seen from Figure 12 that the simulation results of the thermoplastic constitutive model of the materials were in good agreement with the tensile test results at the corresponding temperature. Within the range of test conditions, the simulation values of the flow stress were almost in agreement with the experimental values.
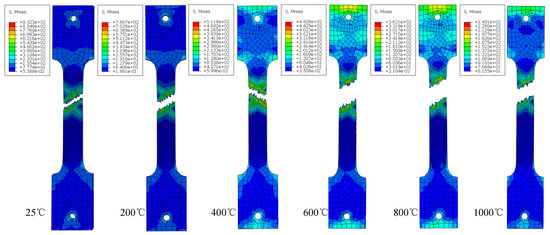
Figure 10.
316L high temperature tensile test simulation cloud diagram.
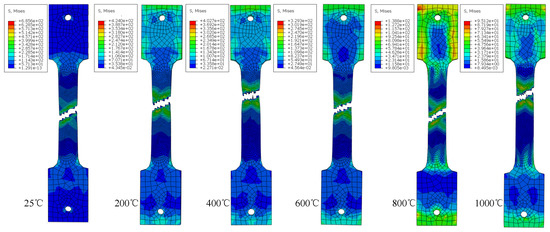
Figure 11.
Q235B high temperature tensile test simulation cloud diagram.
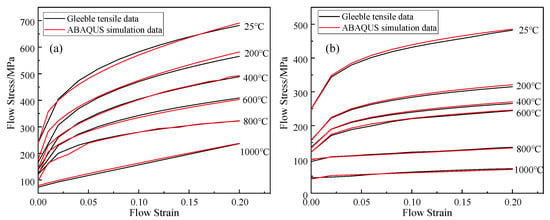
Figure 12.
Comparison of high temperature tensile test and simulation results of materials. (a) 316L; (b) Q235B.
In order to describe the accuracy of the established thermoplastic constitutive model more accurately, the correlation coefficient R and the average relative error AARE are introduced [23].
where E is the experimental result; P is the simulation result; and are the average values of E and P, respectively; and N is the number of data points analyzed. The correlation coefficient R is usually used to analyze the linear relationship between the experimental results and simulation results, and the average relative error AARE is used to evaluate the overall deviation between experimental results and simulation results.
Table 2 and Table 3 show the correlation coefficient and the average relative error between the simulation results of the real flow stress of the materials (316L and Q235B) and the experimental results. It can be seen from the table that the average relative error between the flow stress results of the finite element simulation of the established thermoplastic constitutive model and the experimental results was small, all within 5%, and the correlation coefficient was close to 1. It shows that the thermoplastic constitutive model established in this study can well reflect the plastic deformation behavior of 316L and Q235B at different temperatures, and is applicable to the heat treatment process. At the same time, the heat treatment model of the 316L/Q235B composite plate established on this basis is also reliable and can be further studied.

Table 2.
Comparison of high temperature tensile finite element simulation and experimental results of 316L material.

Table 3.
Comparison of high temperature tensile finite element simulation and experimental results of Q235B material.
3.3. Heat Treatment Simulation Geometric Model and Boundary Conditions of 316L/Q235B Composite Plate
The 3D finite element simulation model was established by ABAQUS software, as is shown in Figure 13. The center point of the lower surface of the 316L/Q235B composite plate (Q235B base surface) was selected as the coordinate origin. Considering the symmetry of the structure, the constraint of length direction was applied at y = 0, and the constraint of width direction was applied at x = 0. At the same time, a completely fixed constraint was applied at the coordinate origin, while a tensile boundary condition was applied on one side of the composite plate.

Figure 13.
Finite element simulation model of 316L/Q235B composite plate.
Heat treatment process: In order to ensure the mechanical properties and corrosion resistance of the 316L/Q235B composite plate and to prevent the temperature of the 316L stainless steel from staying in the sensitization interval for a long time (450~850 °C). The heat treatment process of rapid cooling in the high temperature process and slow cooling in the low temperature process was selected for simulation [5,11,34], as is shown in Figure 14.
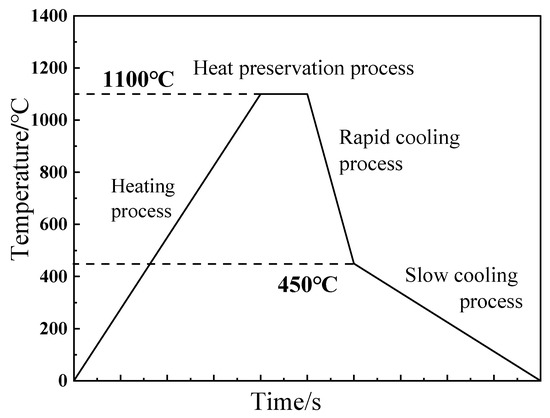
Figure 14.
Heat treatment process.
4. Formation and Evolution Mechanism of Residual Stress
In the process of the heat treatment, due to the difference in thermophysical properties (thermal expansion coefficient, thermal conductivity coefficient, etc.) and mechanical properties (yield strength, elastic modulus, etc.) of each material layer of the composite plate, different degrees of strain will occur in the heterogeneous metal layer, and the uncoordinated deformation between the layers will produce interlaminar thermal stress, which will affect the stress–strain state of each material layer. If the stress of each material layer is lower than its yield point in all technological processes, plastic deformation will not occur. Conversely, if the stress of a material layer reaches or exceeds its yield strength point, plastic deformation occurs and is inherited from the next process, thus ultimately affecting the stress and strain distribution after heat treatment.
As is shown in Figure 15, the 316L/Q235B composite plate was divided into 6 regions: I was the cladding layer near the surface region; II was the center region of the cladding layer; III was the cladding layer near the interface region; IV was the base layer near the interface region; V was the center region of base layer; VI was the base near the surface region. The stress and strain states of the 316L/Q235B composite plate were analyzed respectively, and the change rule of the stress and strain state during the solution heat treatment was discussed. According to the basic theory of material mechanics [35], the bending deformation of the composite plate to the direction of the 316L cladding layer was positive bending, and vice versa. The bending moment that caused the composite plate to have a positive bending trend was specified as positive, and vice versa. The 1/4 finite element simulation model of the solid solution heat treatment for the 316L/Q235B composite plate was established, and the length was 500 mm, the width was 200 mm, the 316L cladding was 4 mm, and the thickness of the Q235B base layer was 6 mm.
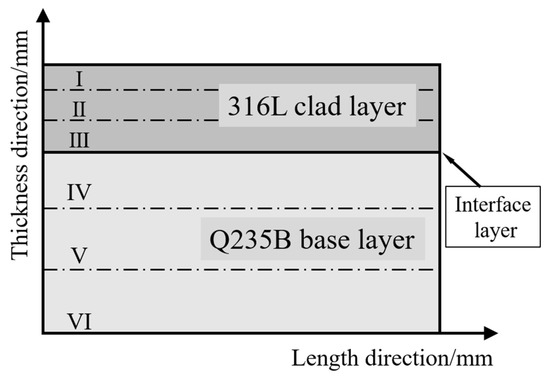
Figure 15.
Layering diagram of 316L/Q235B composite plate.
4.1. Evolution of Residual Stress in Heating Process
As can be seen from Figure 16, the overall residual stress distribution trend of the base layer of the composite plate at the end of heating was roughly as follows: From the region VI to the region IV, the tensile stress gradually increased along the thickness direction. The maximum tensile stress was 34.626 MPa, and the minimum tensile stress was 5.8994 MPa. The overall stress distribution trend of the cladding layer was that the compressive stress gradually decreased along the thickness direction from the region III to the region I, and then turned to tensile stress and gradually increased after passing through the stress neutral surface. The maximum compressive stress was −58.703 MPa, and the maximum tensile stress was 9.406 MPa. At the end of heating process, the distribution of plastic strain was basically consistent with the stress distribution region. The tensile plastic strain mainly appeared in the base layer with the maximum value of 0.007308. The compressive plastic strain mainly occurred in the cladding layer with the maximum value of −0.00292.
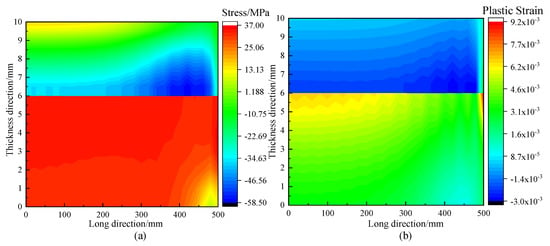
Figure 16.
Distribution cloud diagram of longitudinal stress and plastic strain after heating process. (a) Longitudinal stress. (b) Longitudinal plastic strain.
According to the simulation process of the solution heat treatment of the 316L/Q235B composite plate, it can be seen that, with the change in temperature, the stress and strain state of the composite plate will undergo a complicated evolution process. At the beginning of heating, the internal stress of the composite plate is influenced by the coupling of two aspects:
- Because the thermal expansion coefficient of the 316L cladding layer is larger than that of the Q235B base layer, the expansion of the 316L cladding layer becomes larger than that of the Q235B base layer under the same temperature rise. The Q235B base layer is mainly subjected to the thermal tensile stress from the 316L cladding layer, and the 316L cladding layer is mainly subjected to the hot compressive stress from Q235B base layer.
- The incompatible strain between the base layer and the cladding layer leads to the reverse bending deformation of the composite plate due to the negative moment. The tensile stress reaches the maximum value on the surface of the 316L cladding layer, and decreases gradually along the thickness direction. After the neutral surface of the bending stress, it is transformed into the bending compressive stress, which gradually increases and reaches the maximum value on the surface of the Q235B base layer. It is important to note that the two are carried out at the same time. The bending releases thermal stress, and even makes the cladding surface change from compressive stress to tensile stress, while the base surface change from tensile stress to compressive stress.
4.2. Evolution of Residual Stress in Heat Preservation Process
As is shown in Figure 17, at the beginning of the heat preservation process, the stress–strain state during the heating process was inherited. As the heat preserved, the increase in bending deformation led to the further changes in internal stress distribution, while the plastic strain basically remained unchanged. Region I was influenced by the bending tensile stress, and the maximum tensile stress increased from 15.8874 MPa to 31.87 MPa. Region VI was affected by the bending compressive stress, and the maximum tensile stress decreased from 32.287 MPa to 29.45 MPa. With the release of elastic stress, the stress value at the interface between the composite plate base and the cladding layer decreased to a certain extent. The maximum compressive stress in the region III decreased from 58.073 MPa to 57.009 MPa; the maximum tensile stress of the region IV decreased from 34.626 MPa to 21.94 MPa. At the end of heat preservation, the tensile stress at the surface of the base layer was greater than that inside, and the compressive stress was still dominant inside the cladding layer. The tensile stress of the cladding layer was affected by the bending stress, and its value and distribution range increased to a certain extent.
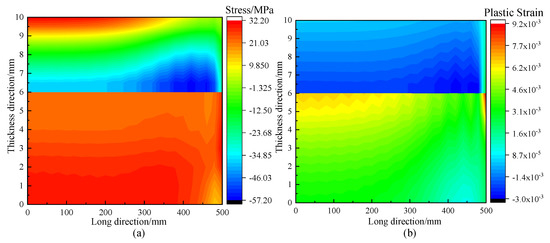
Figure 17.
Distribution cloud diagram of longitudinal stress and plastic strain after holding process. (a) Longitudinal stress. (b) Longitudinal plastic strain.
4.3. Evolution of Residual Stress in Rapid Cooling Process
As can be seen from Figure 18, the overall residual stress distribution trend of the base layer of the composite plate at the end of heating was roughly as follows: From region VI to region IV, the compressive stress increased gradually along the thickness direction, the maximum compressive stress was −173.32 MPa, and the minimum tensile stress was −9.096 MPa. The stress distribution trend of the 316L cladding layer was roughly as follows: From region III to region I, the tensile stress decreased gradually along the thickness direction, with the maximum tensile stress of 178.363 MPa and the minimum tensile stress of 9.406 MPa. The maximum compressive plastic strain of the 316L cladding layer region I decreased from −0.00145 to −0.00129, region II decreased from −0.0023 to −0.00219, and region III decreased from −0.00292 to −0.00268. The maximum tensile plastic strain of the Q235B base layer region IV decreased from 0.00917 to 0.003598, region V decreased from 0.00485 to 0.00211, and region VI decreased from 0.00407 to 0.00187.
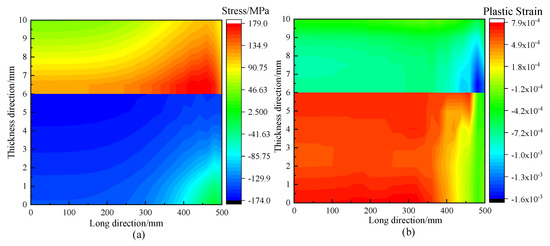
Figure 18.
Distribution cloud diagram of longitudinal stress and plastic strain after rapid cooling process. (a) Longitudinal stress. (b) Longitudinal plastic strain.
From the simulation process, it can be seen that with the rapid decrease in temperature, the shrinkage deformation of the base layer of composite plate becomes larger than that of the cladding layer. The uncoordinated deformation of each material layer produces positive moment on the whole composite plate, and the shape gradually recovers from the reverse bending state. Compared with the stress state of heating and heat preservation process, the base layer mainly bears the thermal compressive stress, while the cladding layer mainly bears the thermal tensile stress during the rapid cooling process. The bending compressive stress reaches the maximum value on the surface of the cladding layer, and decreases gradually along the thickness direction. After the neutral surface of bending stress, it is transformed into bending tensile stress and gradually increases, reaching the maximum value on the surface of the base layer. Compared with the stress state of heating and heat preservation process, the plastic strain distribution region is basically unchanged at the end of rapid cooling process. The distribution of interlaminar thermal stress and bending stress in the cooling process of composite plate is completely opposite to that in the heating process, thus reducing the compressive plastic strain in the cladding layer region and the tensile plastic strain in the base layer region. The cladding layer is mainly subjected to tensile stress, and the base layer is mainly subjected to compressive stress. The distribution trend is gradually increasing from the surface to the interface.
4.4. Evolution of Residual Stress in Slow Cooling Process
As can be seen from Figure 19, similar to the rapid cooling process, in the slow cooling process, the Q235B base layer of the 316L/Q235B composite plate was still subjected to compressive stress from the 316L cladding layer, while the 316L cladding layer still received the tensile stress from the Q235B base layer. The uncoordinated deformation of each material layer produced positive moment on the whole composite plate, and the stress distribution state changed further. Compared with the end of rapid cooling process, the maximum compressive stress of the Q235B base layer IV decreased from −173.320 MPa to −153.381 MPa, and the minimum tensile stress of region VI increased from—9.096 MPa to −31.556 MPa. The maximum tensile stress of the 316L cladding layer region I increased from 178.363 MPa to 205.069 MPa, and the minimum tensile stress of region III increased from 9.406 MPa to 29.390 MPa. Compared with the end of rapid cooling process, the compressive plastic strain in the 316L cladding layer region and the tensile plastic strain in the Q235B base layer region continuously decreased. The maximum compressive plastic strain of the cladding layer region I decreased from −0.00129 to −0.00098, the region II decreased from −0.00219 to −0.00137, and the region III decreased from −0.00268 to −0.00162. The maximum tensile plastic strain of base region IV decreased from 0.003598 to 0.000693, region V decreased from 0.00211 to 0.000683, and region VI decreased from 0.00187 to 0.000667.
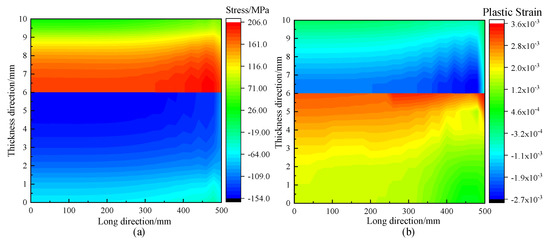
Figure 19.
Distribution cloud diagram of longitudinal stress and plastic strain after slow cooling process. (a) Longitudinal stress. (b) Longitudinal plastic strain.
To sum up, during the solution heat treatment of 316L/Q235B composite plate, the state of internal stress and strain was mainly affected by the interlaminar thermal stress and bending stress, and was in a state of continuous dynamic change. The final residual stress distribution after heat treatment depends on the residual strain distribution in each region of the composite plate: the compressive plastic strain region mainly bears the residual tensile stress, and the tensile stress increases with the increase in compressive plastic strain. The tensile plastic strain region is mainly influenced by residual compressive stress and increases with the increase in tensile plastic strain.
5. Analysis of Residual Stress Distribution Characteristics of Heat-Treated Composite Plate under Different Influencing Factors
In the process of rapid cooling at high temperatures and slow cooling at low temperatures, the internal stress state of the 316L/Q235B composite plate was a process of gradual accumulation. In the heat treatment process, macro-geometric parameters and micro-performance parameters of the composite plate will affect the internal stress state of the composite plate [36,37].
5.1. Effect of Tensile Load on Residual Stress Distribution of Composite Plate
For the cold-rolled 316L/Q235B composite plate, a certain tensile load is often applied during on-line heat treatment [23,38,39]. To investigate the influence of tensile load on the residual stress distribution of the 316L/Q235B composite plate during heat treatment, the simulation parameters with a length of 1000 mm, a width of 400 mm, a total thickness of 10 mm, a 316L cladding layer thickness of 2 mm, a Q235B base layer thickness of 8 mm, and tensile loads of 0 MPa, 2 MPa, 4 MPa, 6 MPa, 8 MPa, and 10 MPa were set up for finite element calculation. The results are shown in Figure 20.
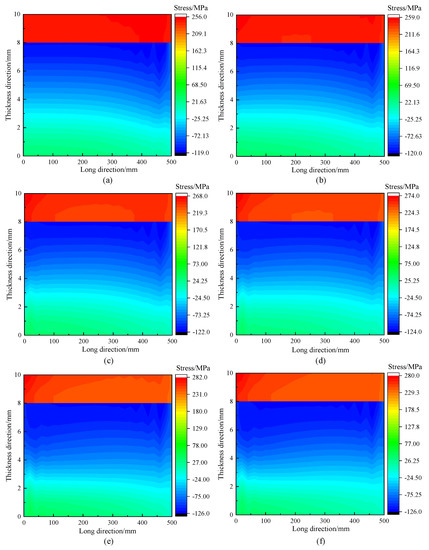
Figure 20.
The residual stress distribution of 316L/Q235B composite plate under different tensile load parameters. (a) 0 MPa; (b) 2 MPa; (c) 4 MPa; (d) 6 MPa; (e) 8 MPa; (f) 10 MPa.
As is shown in Figure 20, the general trend of residual stress distribution along the thickness direction of the 316L/Q235B composite plate was the same under different tensile loads. When the tensile load was 0 MPa, the residual stress of the 316L cladding layer was tensile stress. The maximum tensile stress appeared in region I, the value was 247.128 MPa, and the minimum tensile stress appeared in region III, the value was 239.996 MPa. The general distribution trend of residual stress of the Q235B base layer was that the compressive stress gradually decreased from interface to surface along the thickness direction, and then turned into tensile stress and gradually increased after passing through the stress neutral surface. The maximum compression stress was −112.953 MPa, and the maximum tensile stress was 31.401 MPa. As the tensile load increased from 0 MPa to 10 MPa, the maximum tensile stress in the 316L cladding layer region I increased from 247.128 MPa to 278.601 MPa. The tensile stress in region III decreased from 239.996 MPa to 231.616 MPa. The distribution trend of residual stress in the Q235B base layer was generally unchanged, and its magnitude changes with the increase in tensile load: the residual compressive stress in the IV region decreased from −112.953 MPa to −103.408 MPa; the residual tensile stress at the region VI decreased from 31.401 MPa to 30.601 MPa.
From the analysis, it can be seen that the tensile load can reduce the bending deformation of the composite plate during the heat treatment, thus reducing the influence of bending stress on the internal stress–strain state. During the heating process, the tensile load is helpful to reduce the thermal compressive stress inside the 316L cladding layer and to increase the thermal tensile stress inside the Q235B base layer. During the cooling process, the tensile load is helpful to increase the thermal tensile stress inside the 316L cladding layer and to reduce the thermal compressive stress inside the Q235B base layer. With the increase in tensile load, the residual tensile stress in region I of 316L cladding layer increased, while the residual tensile stress in region III gradually decreased. The residual compressive stress in the base layer region IV and the residual tensile stress in the base layer region VI decreased to some extent. It can be seen that tensile load was helpful to improve the uniformity of the residual stress distribution in the 316L/Q235B composite plate.
5.2. Effect of Total Thickness on Residual Stress Distribution of Composite Plate
In the process of solution heat treatment, the internal stress and strain state of the 316L/Q235B composite plate is always in dynamic change. The shape and size of the composite plate are important factors affecting the distribution of internal residual stress during heat treatment [40]. In order to explore the influence of the total thickness of the 316L/Q235B composite plate on the residual stress distribution after heat treatment, the finite element calculation was carried out by setting up the simulation parameters with a length of 1000 mm, a width of 400 mm, a composite ratio λ = 1/5, a tensile load of 0 MPa, and a total thickness of 5 mm, 7.5 mm, 10 mm, 12.5 mm, 15 mm, and 20 mm. The results are shown in Figure 21.
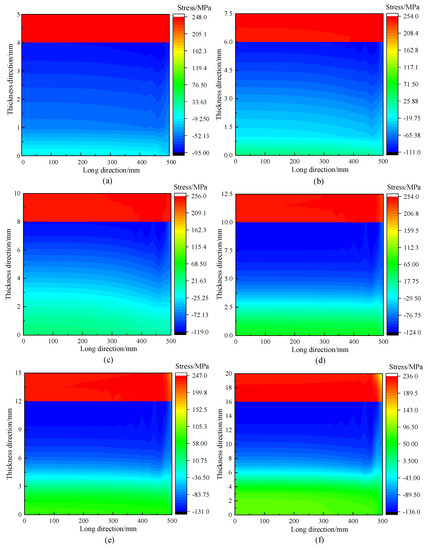
Figure 21.
The residual stress distribution of 316L/Q235B composite plate under different total thickness parameters. (a) 5 mm; (b) 7.5 mm; (c) 10 mm; (d) 12.5 mm; (e) 15 mm; (f) 20 mm.
It can be seen from that the distribution trend of residual stress of the 316L/Q235B composite plate after heat treatment was approximately the same under different total thickness. As the total thickness increased from 5 mm to 12.5 mm, the residual stress of the 316L cladding layer was evenly distributed, with little change, and the residual stress in region I increased from 243.371 MPa to 244.056 MPa. The residual stress in region III reduced from 243.904 MPa to 243.005 MPa. The residual stress of the Q235B base layer presented a gradient distribution from the interface to the surface and obvious changes with the increase in total thickness: the residual stress at region IV increased from −87.799 MPa to −123.656 MPa; the residual stress at region VI increased from 3.019 MPa to 61.681 MPa. When the total thickness increased from 12.5 mm to 20 mm, the residual stress of the 316L cladding layer had changed greatly. The residual stress at region I decreased from 244.056 MPa to 221.516 MPa. The residual stress at region III decreased from 243.005 MPa to 230.185 MPa. With the total thickness increasing from 12.5 mm to 20 mm, the residual stress of the Q235B base increased from −123.656 MPa to −135.59 MPa, and the residual stress of region VI increased from 61.681 MPa to 88.672 MPa.
The results show that when other conditions remain unchanged and the total thickness increases, the increase in the Q235B base layer and 316L cladding layer thickness makes the interlaminar thermal stress and bending stress increase at the same time during solution heat treatment, which affects the final residual stress distribution. The influence of interlaminar thermal stress and bending stress on the overall stress state is related to the specific thickness: when the total thickness increased from 5 mm to 12.5 mm, the increase in interlaminar thermal stress had a significant influence on the stress state, leaving no significant change in the residual stress of the cladding layer and a significant increase in the residual stress of the base layer. When the total thickness increased from 12.5 mm to 20 mm, the interlaminar thermal stress and bending stress of the 316L/Q235B composite plate further increased, and the bending stress had an obvious influence on the stress change of the material layer. Finally, the residual stress of the 316L cladding layer decreased with the increase in thickness, while the residual stress of the Q235B base layer further increased with the increase in thickness.
5.3. Effect of Composite Ratio on Residual Stress Distribution of Composite Plate
For the solution heat treatment process, the ratio of the thickness of the 316L cladding layer to the total thickness, that is, the composite ratio, also had an important influence on the residual stress distribution after heat treatment [40]. In order to explore the influence of different composite ratios on the residual stress distribution of the 316L/Q235B composite plate, the simulation parameters with a length of 1000 mm, a width of 400 mm, a total thickness of 10 mm, a tensile load of 0 MPa, and a composite ratio λ of 1/10, 2/10, 3/10, 4/10 and 5/10 were set for finite element calculation. The results are shown in Figure 22.
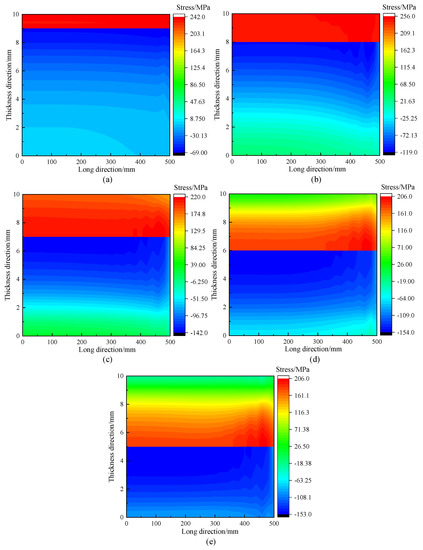
Figure 22.
The residual stress distribution of 316L/Q235B composite plate under different composite ratio parameters. (a) 1/10; (b) 2/10; (c) 3/10; (d) 4/10; (e) 5/10.
It can be seen from Figure 22 that the change in composite ratio parameters greatly changed the residual stress distribution of the 316L cladding layer and the Q235B base layer. When the composite ratio increased from 1/10 to 5/10, the residual stress in the base layer region I reduced from 238.734 MPa to −23.081 MPa, and the stress direction also changed. The residual stress at region III decreased from 236.213 MPa to 179.654 MPa; the residual stress in region VI of the base layer increased from −2.487 MPa to −93.118 MPa; the residual stress in region IV increased from −64.534 MPa to −152.01 MPa.
The results show that the composite ratio has a great influence on the residual stress distribution of the 316L/Q235B composite plate during solution heat treatment. When the composite ratio increased from 1/5 to 1/2, the thickness of the 316L cladding layer increased from 1mm to 5 mm, and the thickness of the Q235B base layer decreased from 9 mm to 5 mm. The interlaminar stress of the Q235B base layer increased with the increase in 316L cladding layer thickness, while the interlaminar stress of the 316L cladding layer decreased with the decrease in the Q235B base layer thickness, thus resulting in the decrease in residual stress in region III and the increase in residual stress in region IV. At the same time, the change in the relative thickness of each material layer had an important influence on the bending state and the magnitude and distribution of bending stress of the composite plate. With the increase in the thickness of the 316L cladding layer, the bending deformation of the composite plate increased relatively during the heating process, which made the residual stress of the region VI gradually increase, while the increase in the thickness of the cladding layer also made the region I more and more affected by the bending stress during the cooling process, and the tensile residual stress gradually decreased and gradually turned into compressive residual stress.
6. Conclusions
- (1)
- The results show that, during the solution heat treatment, the internal stress–strain state of the 316L/Q235B composite plate was affected by the thermal stress and bending stress between layers, and it was in a continuous dynamic state. When the tensile load was increased from 0 MPa to 10 MPa, the residual tensile stress in the 316L cladding region I increased, and that in the region III decreased. The residual tensile stress at region IV and region VI of the Q235B base was reduced. The tensile load can reduce the bending deformation of the composite plate during the heat treatment, thus reducing the influence of the bending stress on the internal stress and strain state, and further helping to improve the uniformity of residual stress distribution in the composite plate.
- (2)
- Under the condition of different total thickness, the residual stress distribution trend of the 316L/Q235B composite plate after heat treatment was almost the same. When the total thickness increased from 5 mm to 12.5 mm, the increase in interlayer thermal stress had a significant impact on the stress state, so that the residual stress of the cladding did not change significantly, while the residual stress of the base increased significantly. When the total thickness increased from 12.5 mm to 20 mm, the thermal stress and bending stress between the layers of the 316L/Q235B composite plate further increased, and the bending stress especially had an obvious influence on the stress change of the material layer. Finally, the residual stress of the 316Lcladding layer decreased with the increase in thickness, while that of the Q235B base layer increased with the increase of thickness.
- (3)
- The composite ratio had a great influence on the residual stress distribution of the 316L/Q235B composite plate after solution heat treatment. When the composite ratio increased from 1/5 to 1/2, the thickness of the 316L coating increased from 1mm to 5mm, and the thickness of the Q235B base decreased from 9 mm to 5 mm. The interlaminar thermal stress of the Q235B base increases with the increase in 316L cladding thickness, and decreased with the decrease in Q235B base thickness, thus resulting in the decrease in residual stress in region III and the increase in residual stress in region IV. At the same time, the change in the relative thickness of each material layer will have an important influence on the bending state and the magnitude and distribution of the bending stress, and then affect the distribution of residual stress.
Author Contributions
Investigation, X.J.; Data curation, X.L.; Writing—original draft, Z.Z.; Writing—review and editing, C.S. (Changshuai Sun); Supervision, R.W.; Project administration, C.S. (Chunjian Su) All authors have read and agreed to the published version of the manuscript.
Funding
This research was funded by the Support Program for Youth Innovation Technology in Colleges and Universities of Shandong Province, grant number 2019KJB015; Shandong Provincial Natural Science Foundation, China, grant number ZR2021QE141.
Institutional Review Board Statement
Not applicable.
Informed Consent Statement
Not applicable.
Data Availability Statement
Not applicable.
Conflicts of Interest
The authors declare that they have no known competing financial interests or personal relationships that could have appeared to influence the work reported in this paper.
References
- Chen, Z.Y.; Li, J.X.; Lin, Z.G.; Qi, J.J.; Sun, L.; Wang, G.D. Process Analysis and Trial Tests for Hot-Rolled Stainless Steel/Carbon Steel Clad Plates. Strength Mater. 2019, 51, 26–31. [Google Scholar] [CrossRef]
- Badiger, P.V.; Desai, V.; Ramesh, M.R.; Prajwala, B.K.; Raveendra, K. Effect of cutting parameters on tool wear, cutting force and surface roughness in machining of MDN431 alloy using Al and Fe coated tools. Mater. Res. Express 2019, 6, 016401. [Google Scholar] [CrossRef]
- El Garouge, S.; Tarfaoui, M.; Hassoon, O.H.; El Minor, H.; Bendarma, A. Effect of impact velocity on the mechanical behavior of a composite plate under slamming impact. Mater. Today Proc. 2022, 58, 1319–1323. [Google Scholar] [CrossRef]
- Liu, B.X.; Wang, S.; Fang, W.; Ma, J.L.; Yin, F.X.; He, J.N.; Feng, J.H.; Chen, C.X. Microstructure and mechanical properties of hot rolled stainless steel clad plate by heat treatment. Mater. Chem. Phys. 2018, 216, 460–467. [Google Scholar] [CrossRef]
- Yin, F.X.; Li, L.; Tanaka, Y.; Kishimoto, S.; Nagai, K. Hot rolling bonded multilayered composite steels and varied tensile deformation behaviour. Mater. Sci. Technol. 2012, 28, 783–787. [Google Scholar] [CrossRef]
- Bi, Z.X.; Li, X.J.; Zhang, T.Z.; Wang, Q.; Rong, K.; Dai, X.D.; Wu, Y. Microstructure and characterization of Ti–Al explosive welding composite plate. Int. J. Adv. Manuf. Technol. 2022, 123, 1825–1833. [Google Scholar] [CrossRef]
- Yang, H.K.; Qiu, J.; Cao, C.; Li, Y.D.; Song, Z.X.; Liu, W.J. Theoretical design and experimental study of the interlayer of Al/Mg bimetallic composite plate by solid-liquid cast rolling. Mater. Sci. Eng. A 2022, 835, 142677. [Google Scholar] [CrossRef]
- Ganilova, O.A.; Cartmell, M.P.; Kiley, A. Application of a dynamic thermoelastic coupled model for an aerospace aluminium composite panel. Compos. Struct. 2022, 288, 115423. [Google Scholar] [CrossRef]
- Pan, Q.; Tan, J.Z.; Feng, Q.Y.; Li, Y.; He, R.D. The Study on Degradation of Stainless Steel Clad Plate Used for a Shift Reactor in Coal Chemical Plant. Appl. Mech. Mater. 2016, 853, 311–316. [Google Scholar] [CrossRef]
- Cheng, Y.; Zuo, X.; Yuan, X.; Huang, H.; Zhang, Y. Life prediction of copper-aluminium composite plate, based on electrical conductivity in a marine atmosphere. Eng. Fail. Anal. 2021, 123, 105299. [Google Scholar] [CrossRef]
- Wachowski, M.; Gloc, M.; Ślęzak, T.; Płociński, T.; Kurzydłowski, K.J. The Effect of Heat Treatment on the Microstructure and Properties of Explosively Welded Titanium-Steel Plates. J. Mater. Eng. Perform. 2017, 26, 945–954. [Google Scholar] [CrossRef]
- Prasanthi, T.N.; Sudha, C.; Parida, P.K.; Dasgupta, A.; Saroja, S. Optimization of Heat Treatments for Reversion of Strain-Induced Martensite in 304L SS Explosive Clad. J. Mater. Eng. Perform. 2016, 25, 536–544. [Google Scholar] [CrossRef]
- Guan, B.; Zang, Y.; Yang, F.; Yang, X.Y.; Qin, Q. Thermomechanical Coupling Model for a Stainless Steel-Clad Plate on Heat Treatment. Strength Mater. 2019, 51, 40–55. [Google Scholar] [CrossRef]
- Jin, H.R.; Yang, X.K.; Cui, Y.W.; Yi, Y.L. Effects of Heat Treatment on Microstructure and Properties of Stainless Clad Plate. Key Eng. Mater. 2016, 4274, 61–64. [Google Scholar] [CrossRef]
- Shen, C.Y.; Fan, K.S.; Wang, J.; Kong, X.P.; Dong, Y.T.; Qian, A. Effect of heat treatment on the microstructure and property of 316L/Q235B explosive welding clad plate. Heat Treat. Met. 2019, 44, 204–208. (In Chinese) [Google Scholar] [CrossRef]
- Jin, H.R.; Zhang, C.L.; Han, X.Y.; Yi, Y.L. Effect of heat treatment on microstructure and mechanical properties of 316L/Q345R stainless steel clad plate. Chin. J. Nonferrous Met. 2015, 25, 952–958. (In Chinese) [Google Scholar] [CrossRef]
- Lei, D.; Ren, Y.; Han, X.R.; Lan, K.; Qiu, J.; Huang, D.J. Effect of heat treatment on microstructure and mechanical properties of 316L/Q235 stainless steel composite panel. Iron Steel 2017, 52, 66–71. (In Chinese) [Google Scholar] [CrossRef]
- Kobzili, L.; Aguib, S.; Chikh, N.; Djedid, T.; Meloussi, M. Modeling and simulation of the static and vibratory behavior of hybrid composite plate off-axis anisotropic. Compos. Struct. 2021, 273, 114297. [Google Scholar] [CrossRef]
- Chen, J.J. Experimental and Modeling Investigations of the Heat-treatment Residual Stress Evolution in GH4169 Superalloy; Harbin Institute of Technology: Harbin, China, 2019. [Google Scholar] [CrossRef]
- Ding, W.H. Study on the Evolution of Residual Stress during Continuous Cooling and Annealing Process of High Strength Steel; University of Science and Technology Beijing: Beijing, China, 2020. [Google Scholar] [CrossRef]
- Hu, S.L.; Wei, H.B.; Hu, J.; Cen, Y.M.; Wang, B.L.; Cai, B.; Zhou, H. Stress-strain constitutive model and forging simulation process of thermoplastic deformation of high strength and toughness gun steel. Ordnance Mater. Sci. Eng. 2019, 42, 87–89. (In Chinese) [Google Scholar] [CrossRef]
- Zhang, M. Numerical Simulation Analysis of Thin-walled Milling in Titanium Alloy Based on Modified JC Constitutive Model; Harbin University of Science and Technology: Harbin, China, 2021. [Google Scholar] [CrossRef]
- Cao, Q. Research on Flatness Evolution of Cold-Rolled High Strength Steel Strip during Heat Treatment; University of Science and Technology Beijing: Beijing, China, 2015. [Google Scholar]
- Ye, J.H.; Chen, M.H.; Wang, N.; Xie, L.S. Flow behavior of TA12 titanium alloy based on modified JC model at high temperature. Chin. J. Nonferrous Met. 2019, 29, 733–741. (In Chinese) [Google Scholar] [CrossRef]
- Lin, X.; Zhang, Q.D. Constitutive model of HC1150/1400MS martensitic steel at high temperature. Heat Treat. Met. 2017, 42, 197–202. (In Chinese) [Google Scholar] [CrossRef]
- Zhang, S.; Meng, Q.Z.; Xie, S.G.; Fang, R.; Meng, X.C.; Meng, X.M. Dynamic Mechanical Behavior and Constitutive Model of B250P1 Low Alloy Steel. Phys. Test. Chem. Ann. (Part A Phys. Test) 2016, 52, 370–374+383. (In Chinese) [Google Scholar] [CrossRef]
- Fu, X.J.; Du, X.Z.; Huang, Q.X. Performance Prediction of Rolling Process based on ABAQUS Secondary Development. J. Taiyuan Univ. Sci. Technol. 2015, 36, 362–368. (In Chinese) [Google Scholar] [CrossRef]
- Zeng, X.G.; Chen, H.Y.; Hu, Y.P. Elastic-Plastic Mechanics of Engineering, 1st ed.; Sichuan University Press: Chengdu, China, 2013; ISBN 978-7-5614-7012-1. [Google Scholar]
- Dong, F.Q.; Yu, P.S.; Zhang, C.F.; Zhao, J.H. Modified Johnson-Cook constitutive model and damage model for 1420 Al-Li alloy. Met. Funct. Mater. 2021, 28, 28–36+43. (In Chinese) [Google Scholar] [CrossRef]
- Wang, G.Y. Study on the Constitutive Model of Al-Li Alloy and Its Secondary Development in ABAQUS; North University of China: Taiyuan, China, 2019. [Google Scholar]
- Wang, R.; Ji, X.Y.; Qian, B.Z.; Zhao, Z.H.; Huang, J.; Su, C.J.; Zhang, Q. Residual Stress Distribution Characteristics and Influencing Factors of 316L/Q235 Composite Plate during Heat Treatment. J. Mater. Eng. Perform. 2022, prepublish. [Google Scholar] [CrossRef]
- Li, Y. Research on Coordination Mechanism of Interlayer Deformation under Thermal/Mechanical Coupling of 304/Q235 Stainless Steel Composite Plate during Heat Treatment; Shandong University of Science and Technology: Qingdao, China, 2020. [Google Scholar] [CrossRef]
- Guo, Y.Z.; Song, N.H.; Ni, L.; Li, H.; Bi, W.Z.; Wei, X.C. JMatPro calculation and experimental study of microstructure transformation of B1800HS hot-formed steel. Heat Treat. Met. 2022, 47, 239–244. (In Chinese) [Google Scholar] [CrossRef]
- Jin, H.R.; Yang, X.K.; Yi, Y.L. Comparison of the Effect of Different Heat Treatment Processes on Microstructure and Mechanical Properties of Stainless Steel Clad Plate. Strength Mater. 2017, 49, 93–100. [Google Scholar] [CrossRef]
- Zhang, T.R.; Chao, X.J.; Guo, L.H.; Zhang, L.; Tang, X.C.; Li, J.Y.; Cheng, Q.; Li, Y.; Qin, Q. Mechanics of Materials, 1st ed.; Chongqing University Press: Chongqing, China, 2023; ISBN 978-7-5689-1035-4. [Google Scholar]
- Chu, Q.L.; Zhang, M.; Li, J.H.; Yan, C. Experimental and numerical investigation of microstructure and mechanical behavior of titanium/steel interfaces prepared by explosive welding. Mater. Sci. Eng. A 2017, 689, 323–331. [Google Scholar] [CrossRef]
- Chu, Q.L.; Tong, X.W.; Xu, S.; Zhang, M.; Li, J.H.; Yan, F.X.; Yan, C. Interfacial Investigation of Explosion-Welded Titanium/Steel Bimetallic Plates. J. Mater. Eng. Perform. 2020, 29, 78–86. [Google Scholar] [CrossRef]
- Bai, Z.H.; Wang, R.; Chen, S.Y.; Chang, J.L.; Qiao, X.; Hou, B. Online shape prediction and control technology of cold rolled strip during continuous annealing. Ironmak. Steelmak. 2015, 42, 791–796. [Google Scholar] [CrossRef]
- Wang, C.H.; Zhang, Q.D.; Li, H.; Zhang, L.Y.; Zhang, B.Y. Warpage deformation behavior of metal laminates. Chin. J. Eng. 2021, 43, 409–421. (In Chinese) [Google Scholar] [CrossRef]
- Cao, M. Study on Microstructure, Mechanical Properties and Formability of Ti/Al Laminated Composites; Taiyuan University of Technology: Taiyuan, China, 2021. [Google Scholar] [CrossRef]
Disclaimer/Publisher’s Note: The statements, opinions and data contained in all publications are solely those of the individual author(s) and contributor(s) and not of MDPI and/or the editor(s). MDPI and/or the editor(s) disclaim responsibility for any injury to people or property resulting from any ideas, methods, instructions or products referred to in the content. |
© 2023 by the authors. Licensee MDPI, Basel, Switzerland. This article is an open access article distributed under the terms and conditions of the Creative Commons Attribution (CC BY) license (https://creativecommons.org/licenses/by/4.0/).