Article

The Influence of Nanoparticle Dispersions on Mechanical and Thermal Properties of Polymer Nanocomposites Using SLA 3D Printing

1
Additive Manufacturing Technologies Application and Research Center-EKTAM, Ankara 06560, Türkiye
2
Department of Mechanical Engineering, Faculty of Engineering, Gazi University, Ankara 06560, Türkiye
3
State Key Laboratory for Mechanical Behavior of Materials, School of Materials Science and Engineering, Xi’an Jiaotong University, Xi’an 710049, China
4
Department of Modern Mechanics, University of Science and Technology of China, Hefei 230052, China
5
ERMAKSAN, Bursa 16065, Türkiye
6
Department of Industrial Engineering, Nanchang Hangkong University, Nanchang 330063, China
7
Advanced Manufacturing Technologies Center of Excellence-URTEMM, Ankara 06560, Türkiye
*
Author to whom correspondence should be addressed.
Crystals 2023, 13(2), 285; https://doi.org/10.3390/cryst13020285
Submission received: 26 December 2022 / Revised: 17 January 2023 / Accepted: 2 February 2023 / Published: 7 February 2023

Abstract

:
The synergistic integration of nanocomposites and 3D printing has opened a gateway to the future and is soon expected to surpass its rivalry with traditional manufacturing techniques. However, there is always a challenge associated with preparing a nanocomposite resin for polymerization-based 3D printing, which is the agglomeration of nanoparticles. Due to the high surface-area-to-volume ratio, the nanoparticles form clusters in the composite matrix, which affects the final properties. This paper aims to analyze the effects of graphene oxide (GO) dispersion on the mechanical and thermal properties of 3D-printed nanocomposites. In particular, a well-dispersed sonication dispersion route is employed for analyzing high and poor GO dispersions and their effects on different properties. After different microscopic analyses and testing, the optimum sonication condition was 30 min at an amplitude of 70%. In terms of mechanical properties, both tensile and compression strength first increased and then decreased gradually with different dispersions as well as varying GO concentrations. Furthermore, there was less or no effect on thermal stability. GO of 0.05 wt.% had the highest compression and tensile strength, while beyond 0.05 to 0.5 wt.%, both strengths reduced slowly. These 3D-printed nanocomposites have found their application in automotive, sports, and biomedical fields.

1. Introduction

Additive Manufacturing (AM), widely known as 3D printing, refers to a series of manufacturing methods in which parts and articles (3D objects) are made by layering materials [1]. According to the ISO/ASTM 52900 standard, AM is defined as “the process of joining materials to make parts from 3D model data, usually layer upon layer, as opposed to subtractive and formative manufacturing methodologies” [2,3]. Stereolithography (SLA) is one of the oldest and most versatile AM techniques used for printing mostly polymers. However, the mechanical and thermal properties of the desired printed material are not good enough to be used in some functional applications depending on the application. The properties of SLA 3D-printed parts can be significantly improved by adding nanoparticles to the photopolymer matrix [4,5,6,7].
Incorporating nanoparticles into a polymer matrix improves its mechanical, thermal, and magnetic properties, etc. [6]. Using nanocomposites via SLA is a multidisciplinary area of research that involves the interaction of machines, materials, computer control systems, etc. The synergy of both technologies shows tremendous enhancements in biomedical, structural, and functional applications, etc. [8,9,10,11,12]. However, the nanocomposite preparation route is often complex, and it is difficult to obtain a homogenous mixture of nanoparticles and polymer matrix. In other words, there is always a challenge associated with preparing nanocomposite resins for SLA 3D printing, which is the agglomeration of nanoparticles [4]. Due to the high surface-area-to-volume ratio, the nanoparticles form clusters in a polymer matrix, which affects the final properties [13]. In previous studies, researchers used nanoparticles in photopolymer resin to enhance customized properties [12,14]. The solution mixing approach, which requires a solvent for premixing and helps in filler dispersion, is frequently used in the manufacture of nanocomposites [15]. However, solvent removal is challenging, and even small traces of solvent molecules can impair print quality [16,17]. Some researchers tried a solvent-free approach in the preparation of nanocomposites [4]. Similarly, the aggregation of the nanofillers inside a polymer matrix is also a serious issue that increases the viscosity, scatters the light, and affects the mechanical properties. Therefore, an improved method of nanocomposite preparation is required, ensuring that the nanofiller is uniformly distributed throughout the polymer matrix without the presence of any solvent molecules.
Sonication is normally used to disperse nanoparticles inside a suspension for different applications [18,19]. However, in the preparation of SLA-based nanocomposites, this type of comprehensive study has not been conducted before. Many studies have used sonication in their experiments; however, the duration and amplitude of the sonicators were not optimized, or they used sonication with other less effective techniques, such as bath sonication, ball milling, etc., which do not give a proper uniform dispersion of nanofillers. As nanofillers agglomerate very easily in a polymer matrix, proper attention is needed in the preparation for achieving maximum dispersion. Unfortunately, whether the different dispersion states of nanofillers can lead to a different impact on mechanical and thermal properties remains an important open question in SLA 3D-printed polymer nanocomposites. We addressed this issue and checked the effects of different dispersion states on the mechanical and thermal properties of nanocomposites. To the best of our knowledge, this is the first kind of study that utilizes a proper sonication route and its effects on different properties in SLA 3D printing.
In this study, graphene oxide (GO) nanoparticles are mixed in an acrylic photopolymer matrix using the ultrasonication method. Different parameters that affect nanoparticle dispersion are studied in detail. A well-dispersed sonication route is selected for further experiments. The purpose of this study is to show how nanoparticle dispersion affects the mechanical and thermal properties of 3D-printed polymer nanocomposites and thus provide a well-dispersed sonication route for maximum dispersion, with high mechanical properties achieved.

2. Materials and Methods

Graphene oxide (GO) was purchased from Sigma Aldrich China. According to the manufacturer’s datasheet, the average thickness and length of GO are 2–5 nm and 15–20 µm, respectively. Polymer resin composed of acrylate PEGDA was purchased from Anycubic China. Ethanol and DIW were purchased from a local supplier. All materials were used as received without any further modifications.

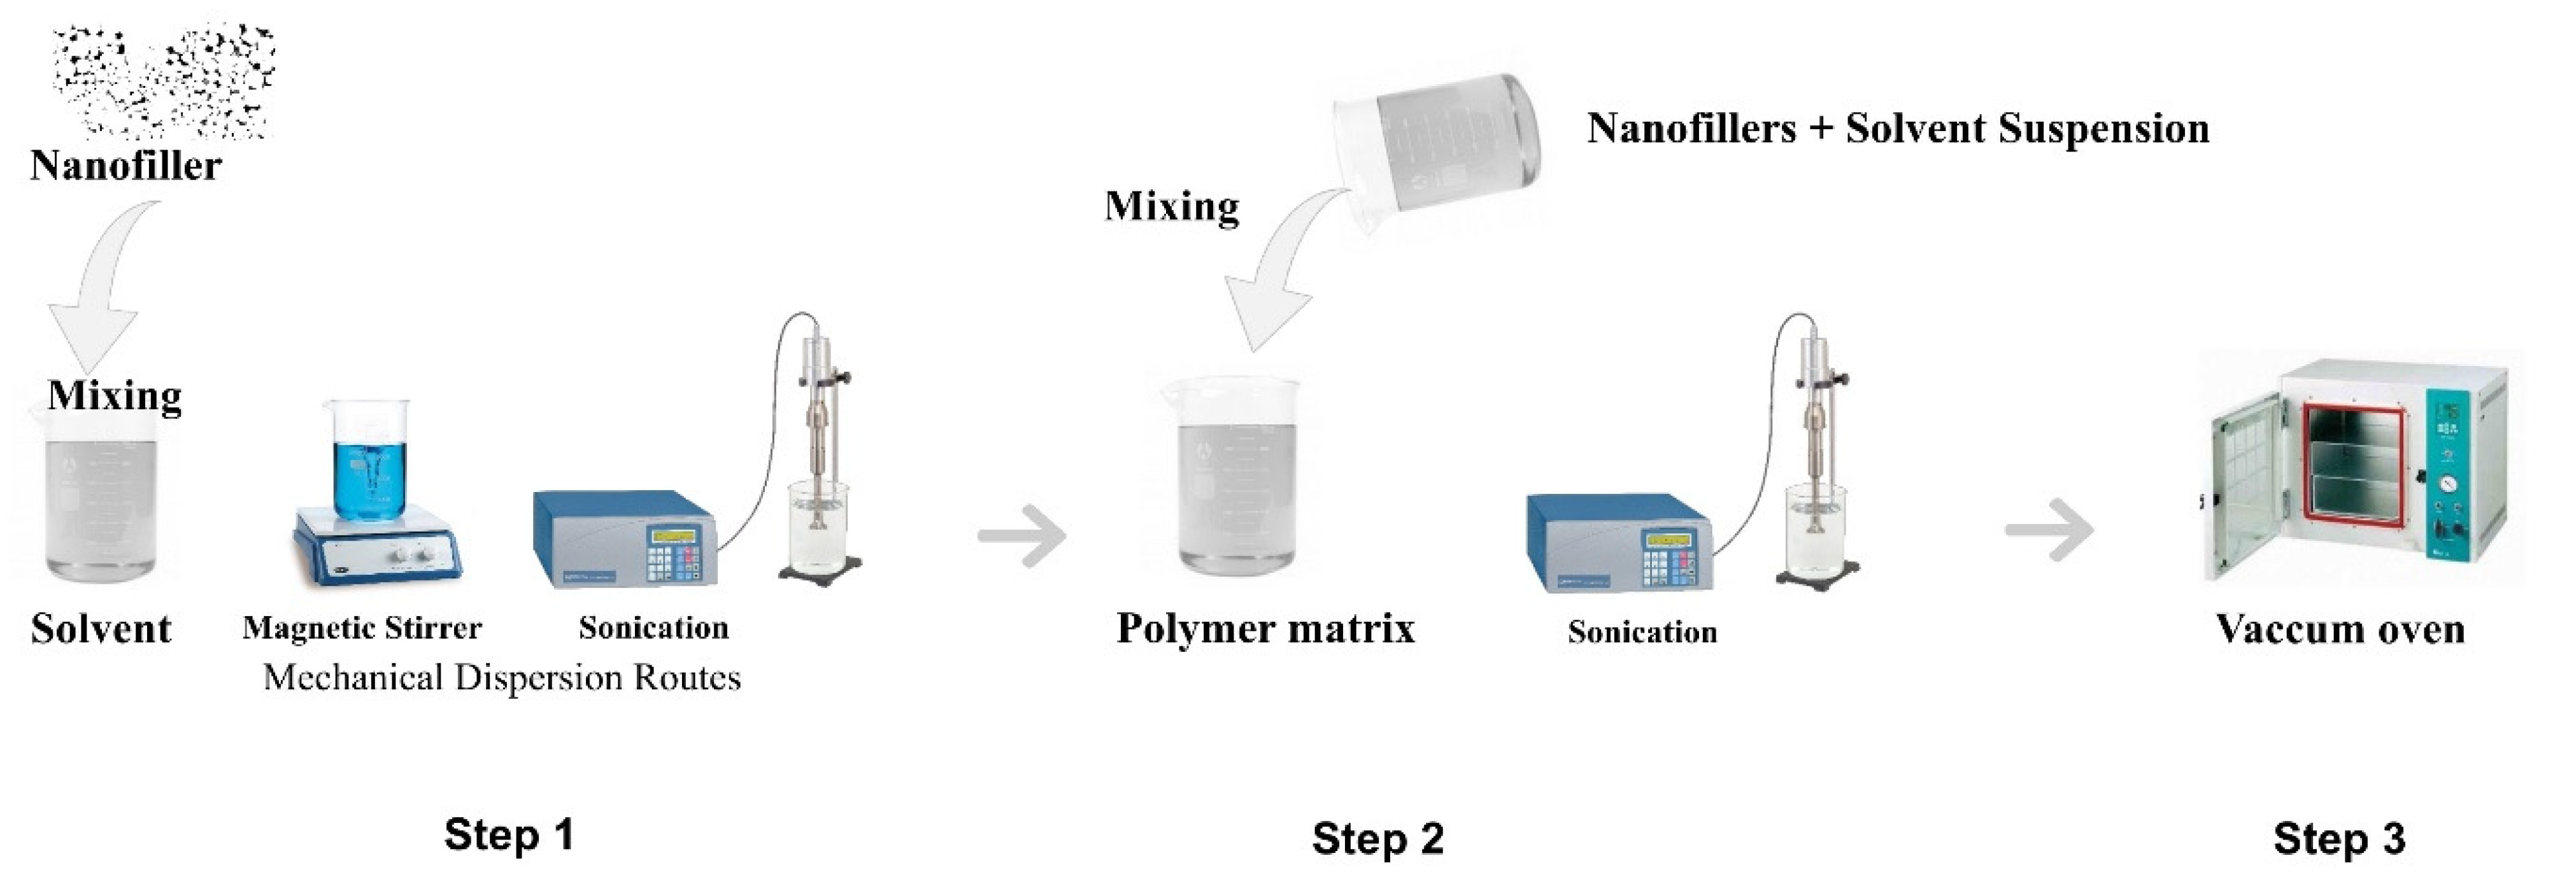
2.1. Preparation Method of Nanocomposite Resin

Nanocomposite resin was prepared via solution intercalation, which is used by many researchers [20,21,22]. The general route of nanocomposite preparation is described in Figure 1, which shows that, first, a nanofiller is mixed with some solvent via the use of a magnetic stirrer or sonication. Then, the nanofiller solution is mixed with the polymer matrix and again sonicated to obtain a homogenous solution. The nanofiller suspension is then put in a vacuum oven or a blast furnace to remove the solvent completely. For a typical (50 mL resin, 0.1 wt.% GO) concentration formulation, the first 0.1 wt.% (0.225 g) of GO was dispersed in 40 mL of ethanol and was sonicated for 30 min, while the amplitude was kept at 70%. After sonication, approximately 50 mL of resin was mixed with the nanoparticle suspension and again sonicated for 30 min keeping the same amplitude. The mixture was then placed overnight in a blast furnace for 12 h at 70 °C to successfully remove the solvent from the solution. After 12 h, the ethanol was completely evaporated, leaving behind a homogenous nanocomposite photopolymer resin. The nanocomposite resin was then quickly poured into the resin vat of the 3D printer to print different test specimens. This method is shown in Figure 1. The same procedure was employed for increasing GO concentration (0.05–0.5 wt.%) and all sonication parameters.

2.2. Ultrasonication

Ultrasonication was employed in dispersing the GO in the solvent as well as in the polymer matrix. In this study, a Sonic Vibra-Cell VCX 750 sonicator was used throughout. To find optimized sonication parameters, sonication at different periods and amplitudes was carried out. The durations employed were 15, 30, and 60 min, respectively, with amplitudes of 50, 70, and 90%. All sonication parameters were performed on 2 s ON and 1 s OFF conditions in order to control the temperature. Sonication is an exothermic process, and there is a lot of heat released, which affects both the nanoparticle and the polymer matrix. Since we lacked a proper cooling system, a small cooling system was developed for this case. The GO and polymer suspensions were both prepared in a 100 mL glass beaker. This beaker was enclosed on all sides with cardboard before being floated in another 1000 mL glass beaker filled with cold water, while the small beaker was supported with the apparatus seen in Figure 2. In this way, the heat was maintained near room temperature. The water in the 1000 mL beaker was changed after every 5 minutes in order to control the temperature. The different varying parameters employed are listed in Table 1.

2.3. 3D Printing

A commercial 3D printer (Photon Mono SE, Anycubic, Shenzhen, China) was used in this study. Like most 3D printing techniques, it requires a 3D CAD model of an object to be printed. In this work, most CAD files were generated using Autodesk Fusion 360 and converted into STL files. To avoid bubbles within the resin, the inks were always transferred carefully into the vat. The following parameters were used for all the specimens: layer height 0.05 mm, exposure time 1.5 s, bottom exposure time 25 s, lifting speed 4 mm/s, lifting distance 6 mm, and infill 100%. The temperature control was then set between 25–30 °C, as the DLP will not print outside of this range. For all prints, support structure designs were generated using Photon Workshop software (version 2.2 from Anycubic Shenzhen China and CHITUBOX Basic Version Shenzhen China). Normally, all the tensile and compression test specimens were printed 45 degrees to the build platform, which has maximum mechanical properties. The tensile test specimens and XJTU logo printed are shown in Figure 3.

2.4. Characterizations

The morphology of the as-received GO was studied using TESCAN MAIA3 TESCAN Korea, field emission scanning electron microscopy (FE-SEM). The fracture surfaces of tensile specimens were examined using HITACHI-SU3500 HITACHI Japan scanning electron microscopy, SEM. All sample images were obtained by using the BSE (back scatter electron) mode with a voltage of 15 kV and a working distance of 6 mm. In order to make the surfaces of the samples conductive, platinum sputtering was performed for 110 s.
Mechanical properties were tested in tension and compression using a tensile machine (CMT5305, MTS China). For samples tested in tension, a 10 kN load cell was used to apply a load to a sample secured between 2 clamps in tension at a constant rate of 0.1 mm/min. An extensometer was used to measure the displacement of the sample as the load increased. All specimen sizes were prepared in accordance with ASTM D638 type IV for tensile and ASTM D695 for compression tests. The tensile properties tested included ultimate tensile strength, yield strength, elongation, and Poisson’s ratio. All the tests were performed in triplicate, and then the average values were selected for further study. Thermal stability of the printed nanocomposites was performed with a TGA-DSC1 equipment from Mettler Toledo USA using ASTM E1131. The samples were prepared by cutting a cross-sectional area of 3.5 mm2 from each of the tensile specimens and then placing it in a 70 µL crucible. The temperature range for DSC was 25 °C to 400 °C at 10 °C/min, while for TGA it was 25 °C to 600 °C at 10 °C/min, under a nitrogen atmosphere.

3. Results and Discussion

3.1. Morphology and Structure Analysis of Graphene Oxide

Representative microscopic images of GO at different magnifications are shown in Figure 4. As can be observed, the GO sheets have a “fluffy” structure, as reported in the previous research [23]. The dimensions of GO are from submicron to several micrometers, as shown in Figure 4. These GO nanoparticle clusters are formed due to the adhesion of particles to each other via weak forces leading to (sub)micron-sized entities. In contrast, GO agglomerates are due to the formation of covalent or metallic bonds that cannot be easily disrupted. In other words, these GO sheets are held together by weak Van der Waals forces and are responsible for the agglomeration. Obtaining a homogeneous dispersion of nanoparticles in any polymer matrix is extremely challenging. Due to the tendency to form aggregates, these GO sheets are responsible for improper dispersion, and this poor dispersion affects the final mechanical properties of a 3D-printed part.

3.2. Effect of Sonication on Dispersion

Ultrasonication is a common way to break up agglomerates and promote the dispersion of nanoparticles into a base polymer matrix [17,18,19]. However, research reports of sonication effects on the final mechanical properties of SLA 3D-printed objects are limited in the open literature. Herein, we design a proper sonication route with varying parameters to check the dispersion mechanism. The different varying parameters employed are listed in Table 1. The main contributing parameters affecting the dispersion and breaking of agglomerates are ultrasonic duration and amplitude; both considerably affect dispersion as well as mechanical properties.

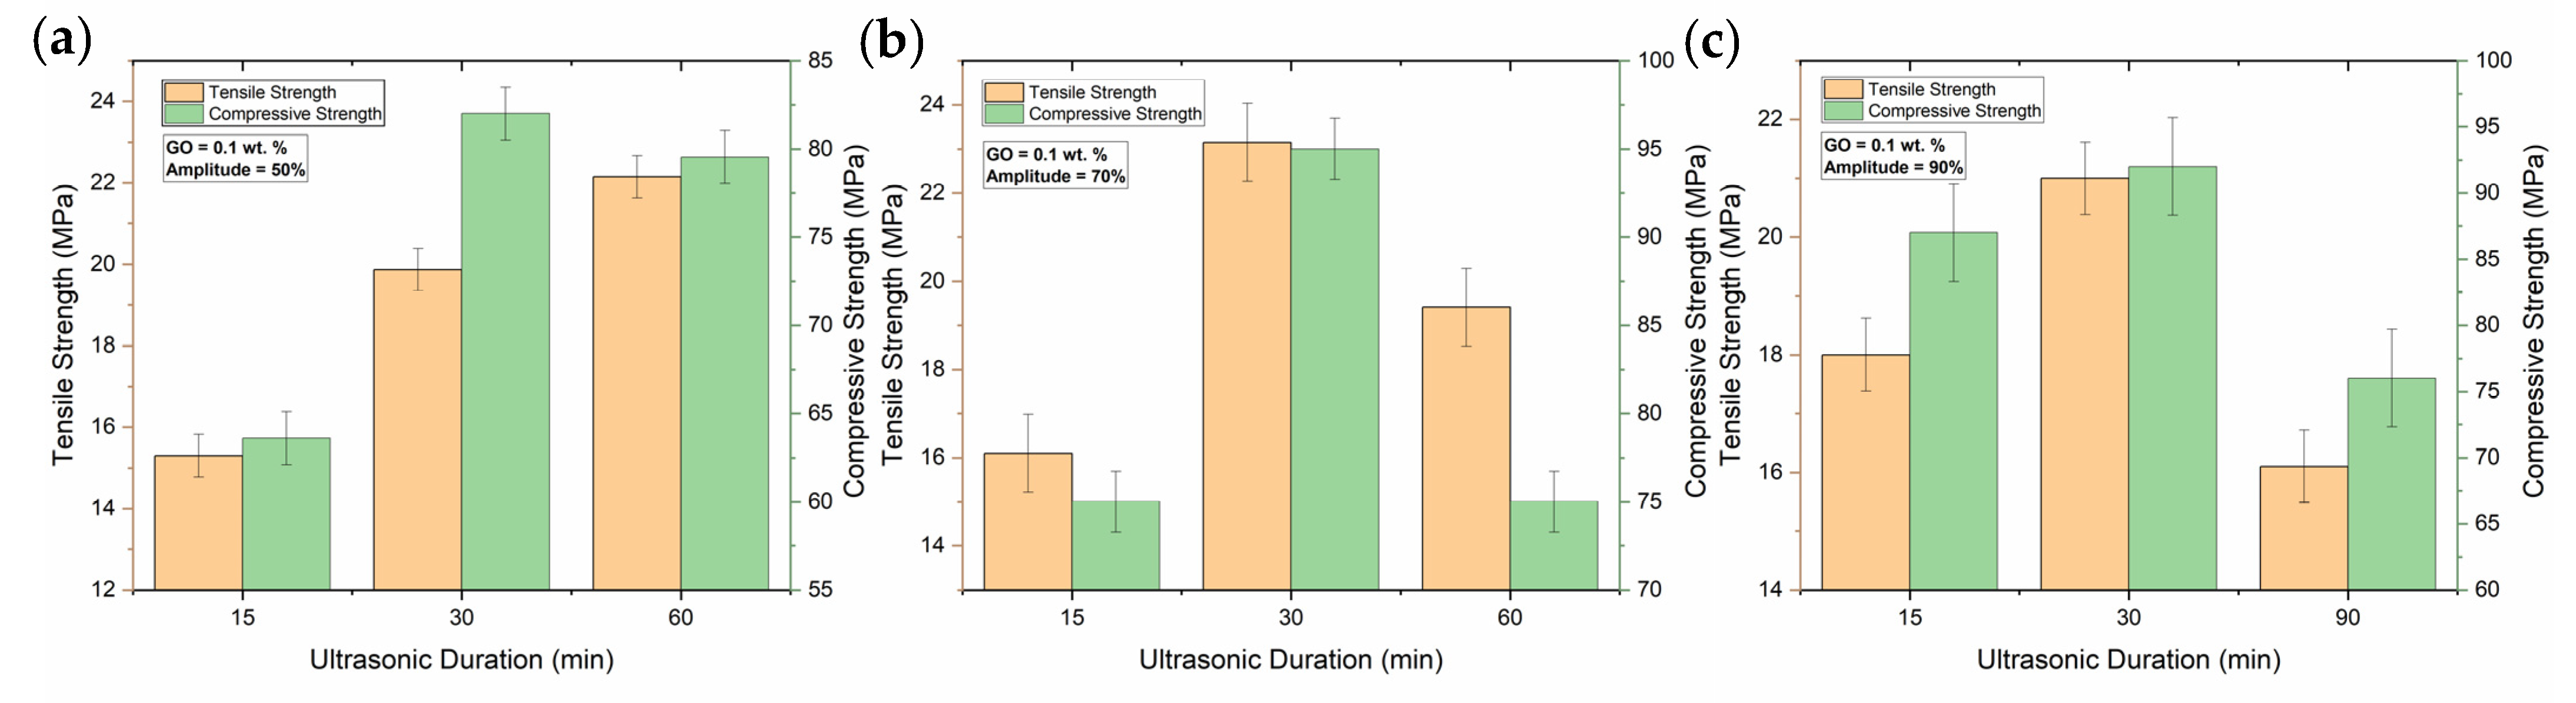
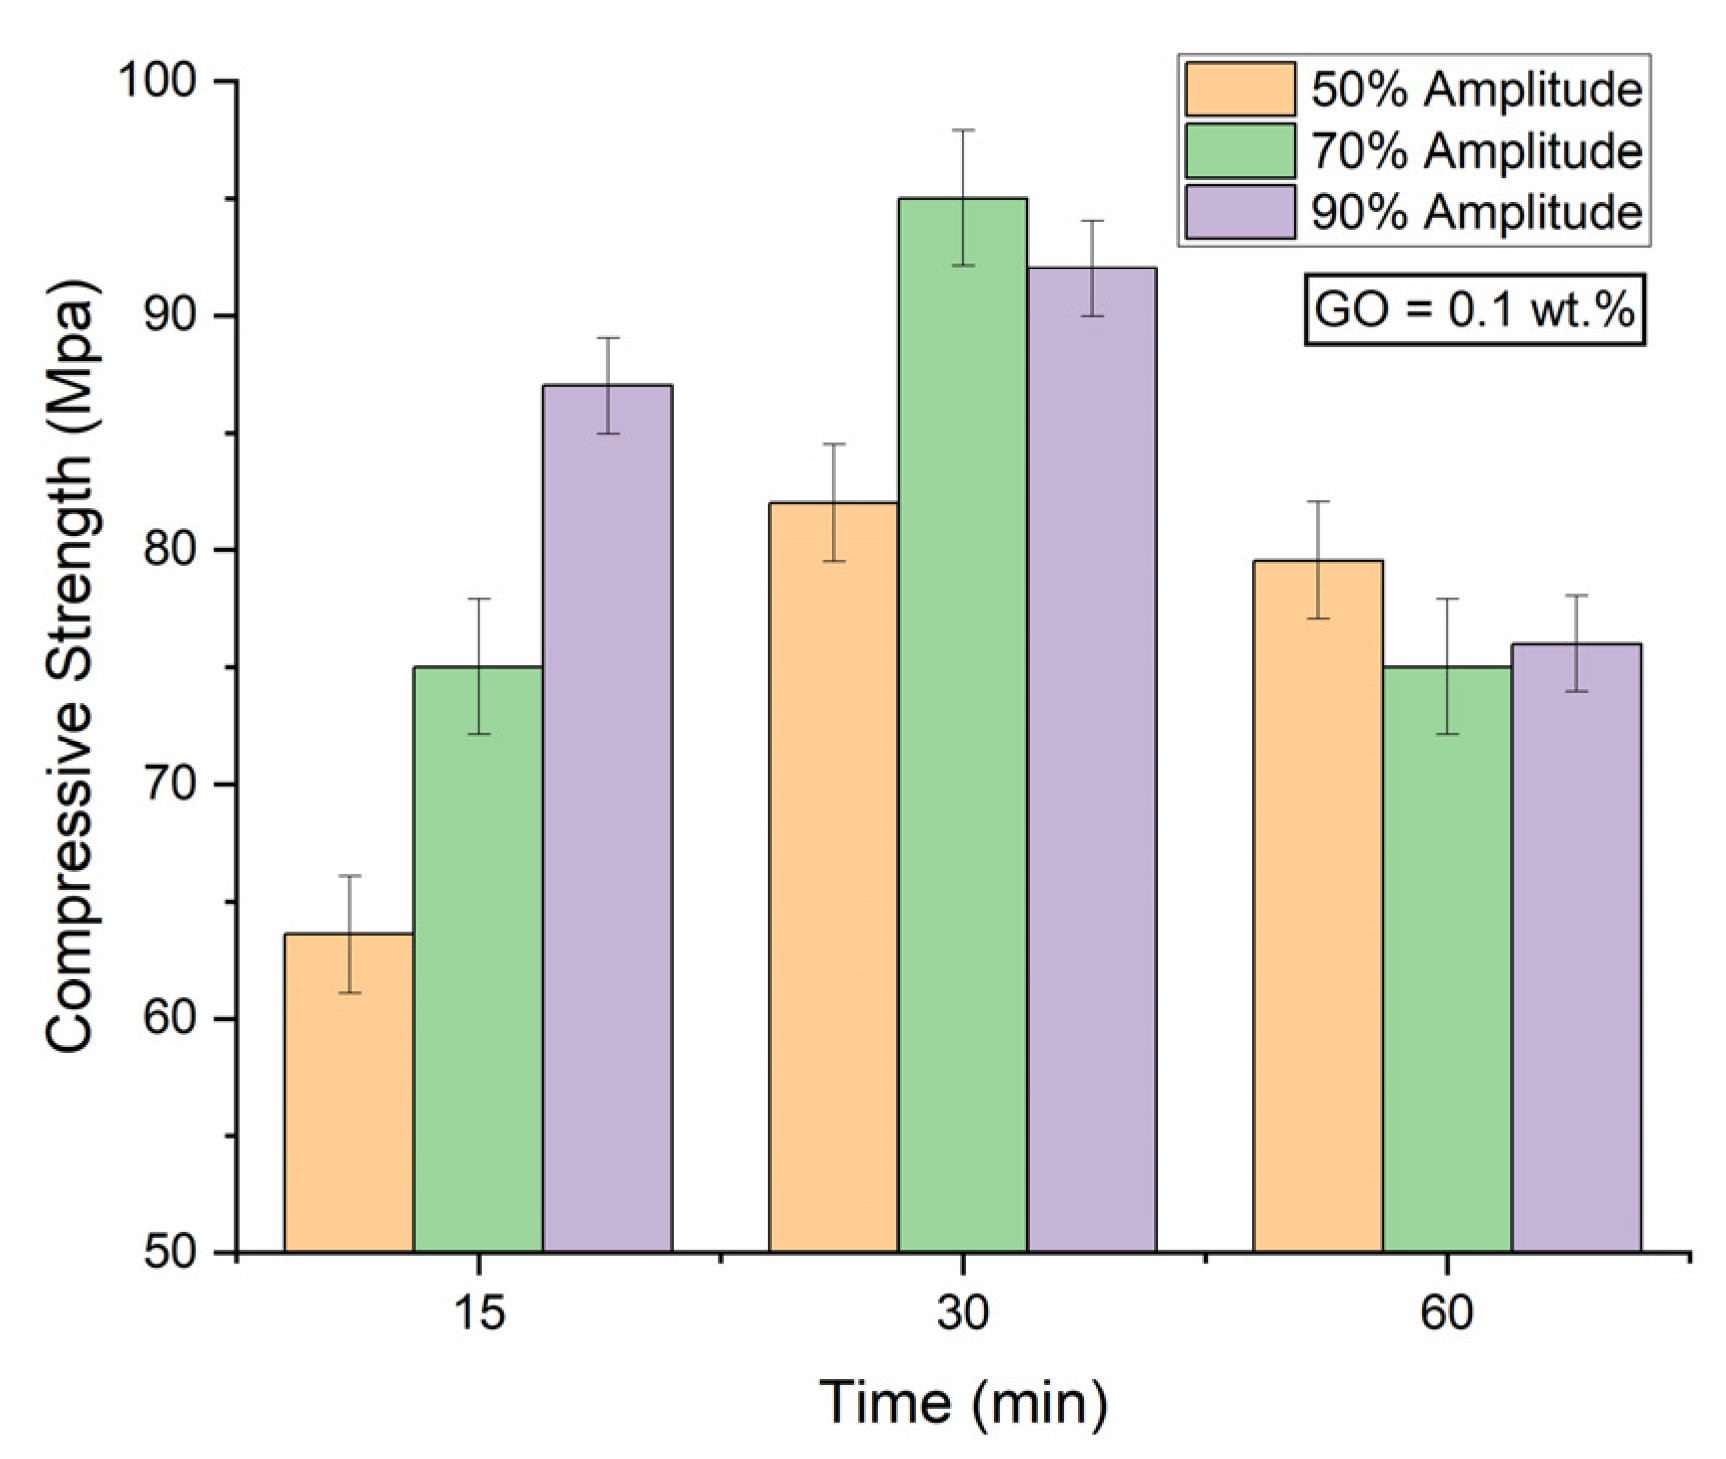
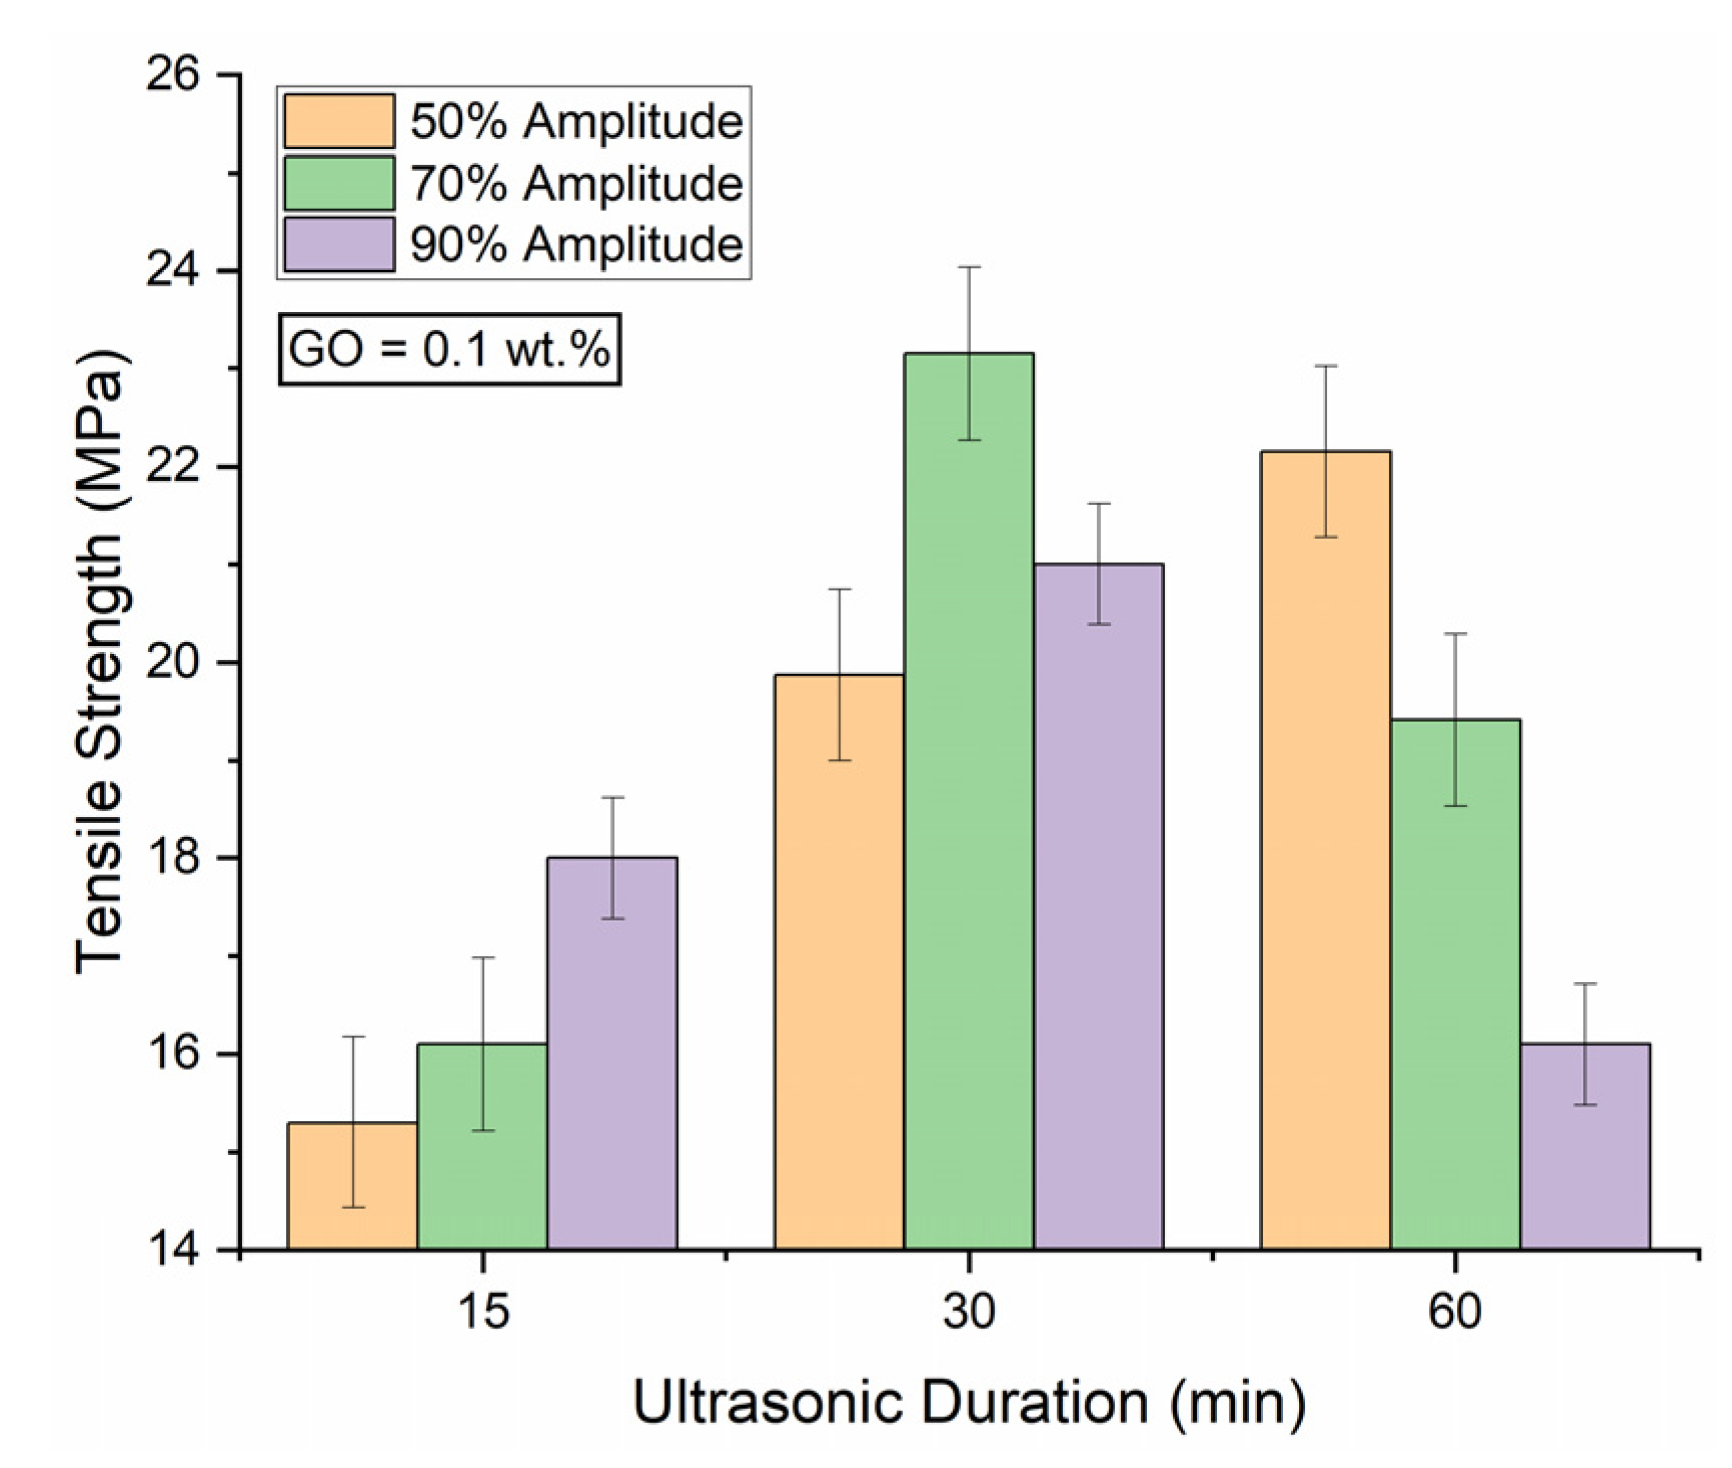
3.2.1. Effect of Ultrasonic Duration

Figure 5 shows the mechanical properties of 3D-printed polymer nanocomposites at varying sonication durations (15, 30, and 60 min), respectively, while the amplitude was kept constant at 50%. It can be seen from Figure 5 that low-duration sonication was insufficient to achieve maximum mechanical properties. Both tensile and compressive strengths were found to be very low when the nanoparticles were dispersed inside the resin by employing sonication for 15 min. As the sonication duration was raised to 30 min, there was a considerable increase in both tensile and mechanical properties. Overall, the compressive strength was increased at a greater concentration than the tensile strength. Similarly, a sonication duration of a much longer time, 60 min, has some effect on the properties. The tensile strength was increased as usual, but the compressive strength was decreased. This phenomenon will be discussed in the following sections on how employing sonication beyond a specific duration results in adverse properties. As such, in this situation, i.e., keeping the amplitude constant and varying the ultrasonic duration, the optimum duration was 30 min.
Similarly, the nanocomposites that were formed were treated at fixed amplitudes of 70% and 90%, respectively, with varying times. As can be inferred from the respective graphs, when the amplitude was 70%, the corresponding mechanical properties were higher than those sonicated at 50% amplitude. This shows that there is an increase in mechanical properties with the same duration but high amplitude. As the ultrasonic duration increased up to 30 min, there was a huge increase in both tensile and compressive strength. This increase in strength is related to the maximum energy received by the nanocomposite matrix at 30 min, which was the most efficient condition employed in this situation. However, as previously reported elsewhere, there is a certain limit to sonication duration [24]. Increasing sonication duration results in the de-agglomeration and de-bundling of the clusters formed [25,26]. However, when the sonication time is prolonged beyond a certain point, the extra sonication does not provide the desired dispersion by integrating the nanoparticles and is instead more destructive to the formed nanocomposite. This is due to the fact that prolonged sonication induces the nanoparticles to form clusters and re-agglomerate, as the extra energy provided in order to properly mix the nanoparticles is used in reverse [24,27]. This phenomenon can be seen in the corresponding graphs in Figure 5. There was a maximum enhancement in both tensile and compressive strength up to sonication for 30 min and 70% amplitude. However, the mechanical characteristics noticeably decreased as the sonication duration was extended up to sixty minutes. The optimum sonication time is 30 min, but extending sonication beyond this point causes the GO to become more agglomerated and reduces mechanical characteristics.
The same pattern was followed with sonication employed at an amplitude of 90% with increasing duration. However, compared with the other 2 situations discussed, the mechanical properties, in this case, were substantially superior at 15 min. At 30 min duration, both tensile and compressive strength was high in this case but less than in the other 2 cases. This is because a high amplitude means more and more energy is delivered in the form of sound waves to disseminate the clusters. The nanoparticles can be appropriately dispersed at a high amplitude in a shorter period. Moreover, the decreasing trend was followed herein, such that beyond 30 min of ultrasonic duration, both properties were reduced, as evidenced in other studies [28,29].

3.2.2. Effect of Ultrasonic Amplitude

The amplitude is the maximum energy delivered to the suspension medium. The effects of sonication amplitude on mechanical properties are shown in Figure 6 and Figure 7. For a duration of 15 min, at varying amplitudes, the lowest mechanical properties were obtained at 50% amplitude. The fact is, ultrasonication used for the dispersion of GO for 15 min at 50% amplitude was not quite enough to break the clusters and agglomerates that formed after mixing with the polymer matrix, as supported by the results. An increasing pattern was followed in both tensile and compressive strength when the nanocomposite suspension was sonicated at 70% and 90%, respectively. This phenomenon is evidenced in many examples in the literature, such that increasing sonication power or amplitude results in better homogenous dispersion of nanoparticles inside a polymer matrix, which directly affects the mechanical properties [24,30]. In this case, for 15 min, the maximum mechanical properties were achieved at an amplitude of 90%.
Similarly, the mechanical properties increased as the ultrasonic time was extended to 30 min with varying amplitudes. However, in Figure 5, the properties are deteriorating, and the tensile and compressive strength are both stronger at 70% amplitude than at 90% amplitude. Again, ultrasonication for 30 min at 50% amplitude was insufficient to break the aggregates, and 90% amplitude was too high, such that the particles again formed clusters, which resulted in a decrease in mechanical properties. The proper optimum sonication parameter applied here was 70% amplitude employed for 30 minutes. Both tensile and compressive strength were high in this case, which shows a proper dispersion of GO inside the polymer matrix as evidenced by [24,27].
Surprisingly, prolonged sonication at any amplitude results in a decrease in mechanical properties [27,31,32,33]. As previously mentioned, there is a limit to sonication duration and the maximum power to be delivered to a solution, beyond which there is no effect on the exfoliation or de-bundling of the nanoparticles. In fact, this results in the re-aggregation and re-bundling of the nanoparticles, which affects both the tensile and compressive strength [34]. In this case, the varying amplitudes for a sixty-minute duration showed poor mechanical properties. After all this discussion, the best route to employ sonication for maximum dispersion and a proper homogenous solution in order to obtain high mechanical properties is 30 min with 70% amplitude, as is evidenced in the respective mechanical results. It is worth mentioning that after some time, GO re-aggregates and forms clusters in the resin, which inhibits polymerization and results in printing failure. Therefore, the resin was printed as soon as possible after the successful evaporation of ethanol from the solution.

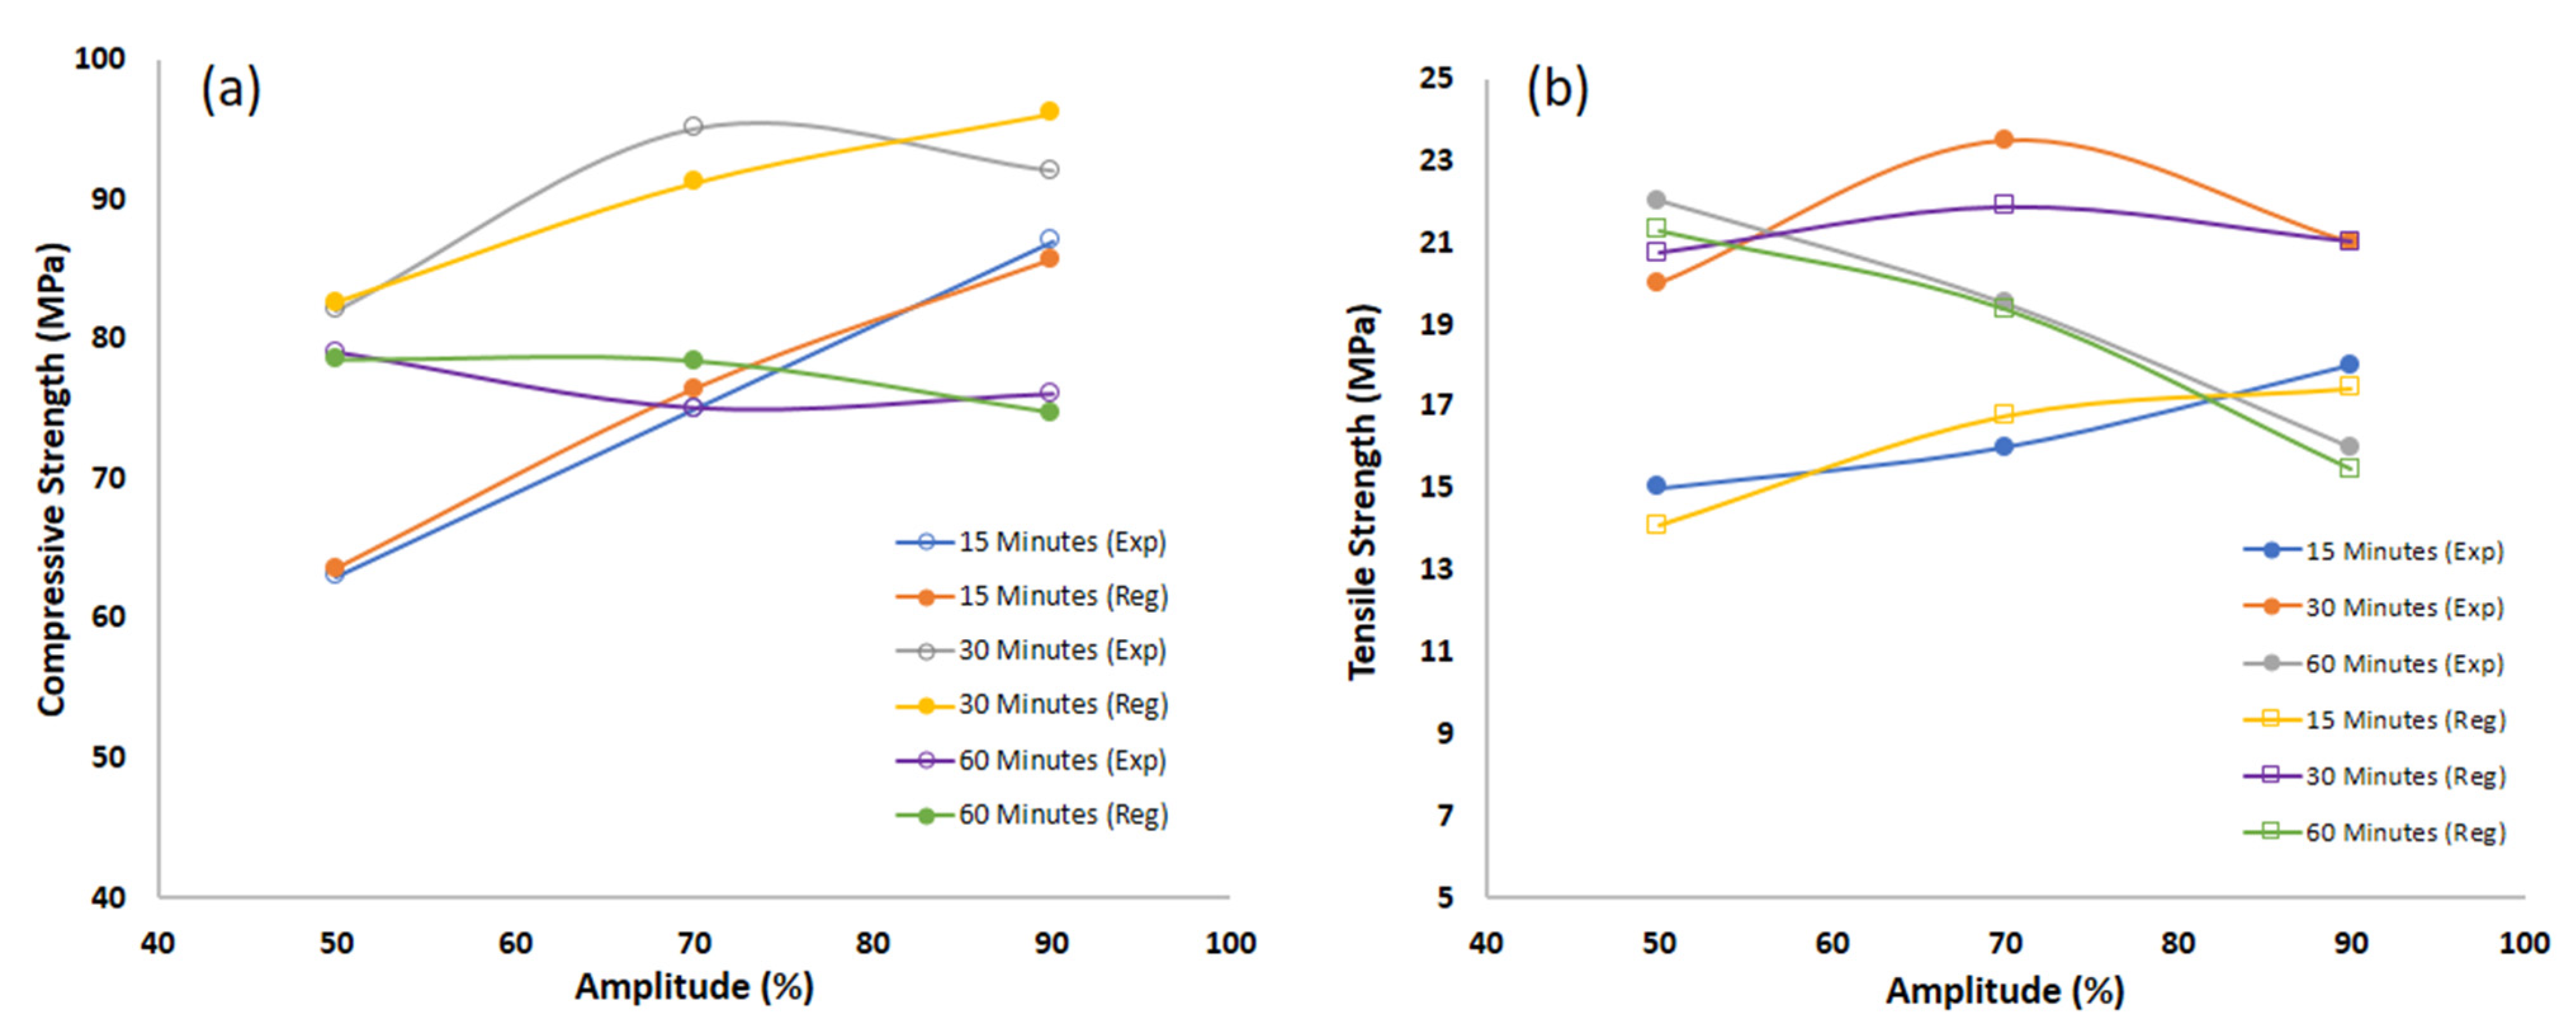
3.3. Regression Model Analysis Based upon Experimental Data

From the above experimental results, there are two factors that mainly influence the mechanical properties of a GO-based nanocomposite. Considering these factors, we have two independent variables, which are amplitude (A) and time of sonication (T), and two dependent variables, which are tensile strength (TS) and compressive strength (CS). Therefore, herein, we incorporate a nonlinear or polynomial regression consisting of two independent variables and one dependent variable. Equation (1) shows the typical form of the second-order polynomial regression equation [35]:
  Y X i = a o + i = 1 N a i X i + i = 1 N a i i X i X i + i = 1 N a i i X i X j
where ao and ai, aii are the constant and coefficient of the above equation, respectively. X represents the independent variables. The ultimately proposed regression model equations predicting the TS and CS in terms of coded variables are given in Equations (2) and (3), respectively, where A and T represent the amplitude and time in minutes, as shown in Table 2:
CS   = 28.39 + 1.40 A + 3.40 T 0.0045 A 2 0.0313 T 2 0.0144 AT
TS   = 16.01 + 0.51 A + 1.12 T 0.0025 A 2 0.0094 T 2 0.0051 AT
Before the regression equation for TS and CS, the amplitude and time variables shown in Table 2 were verified for their significance to compressive and tensile strength using Origin software two-way ANOVA analysis. The F-statistic and p-value were critical for determining the dependency of the variables on the response variable. Herein, the F-value for both amplitude and time and their interaction was very high, and the p-value was almost 0, as the desired value of p was <0.05. The value of the coefficient of determination R-sq and R-sq (adj) was also 100%, proving the significance of the variables. The values obtained from ANOVA are shown in Table 3 and Table 4 for CS and TS, respectively.
In order to compare our regression model with the experimental results, Figure 8 shows contour plots and 3D poly curves to show the range of compressive and tensile strengths and their peak values with varying amplitudes and times. Figure 8 uses Equations (2) and (3) of the regression model, respectively. From Figure 8 and Figure 9, it can be observed that the experimental and regression results are very close to each other. This makes it clear that the regression model accurately predicts the CS and TS. In Figure 8a,c, the contour plot shows the range along which the optimal values of CS and TS are obtained, respectively. Similarly, Figure 8b,d shows the highest values in the 3D plot for CS and TS values. The R-sq and R-sq (adj) values were calculated again for the Equations (2) and (3) regression models. Both the values were 100%, which proves that the second-order regression model derived in Equations (2) and (3) can be used to optimize TS and CS values based on time and amplitude [36].

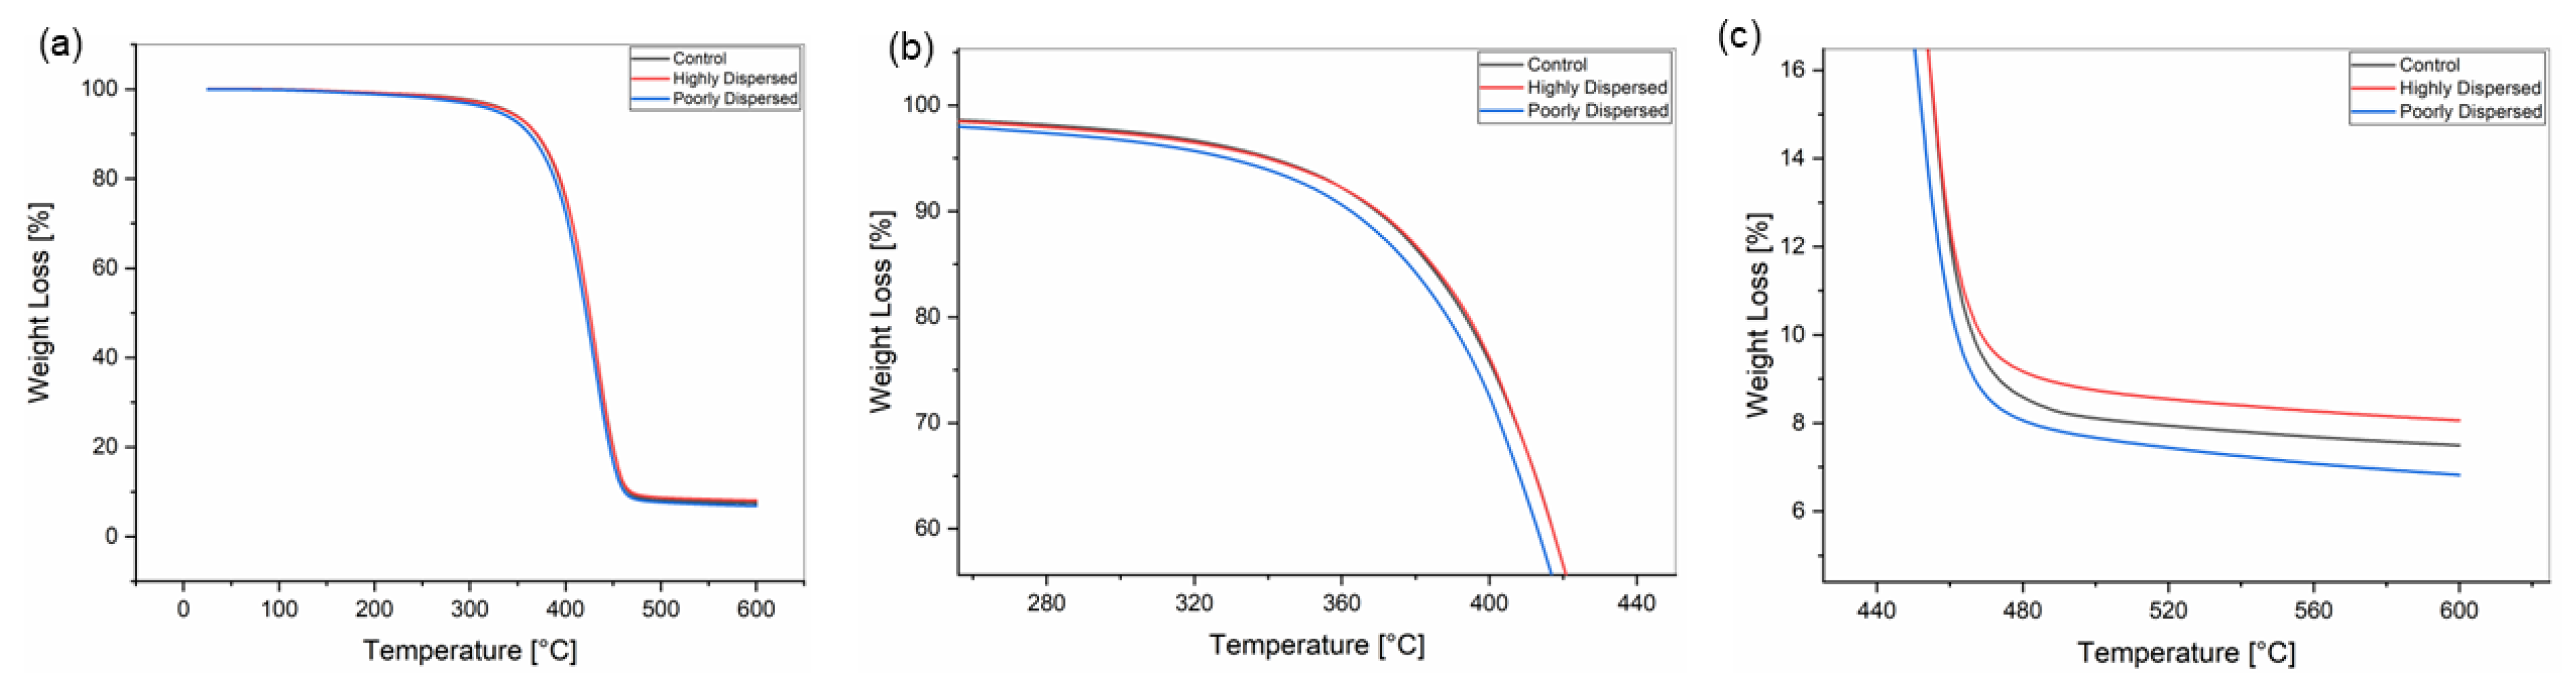
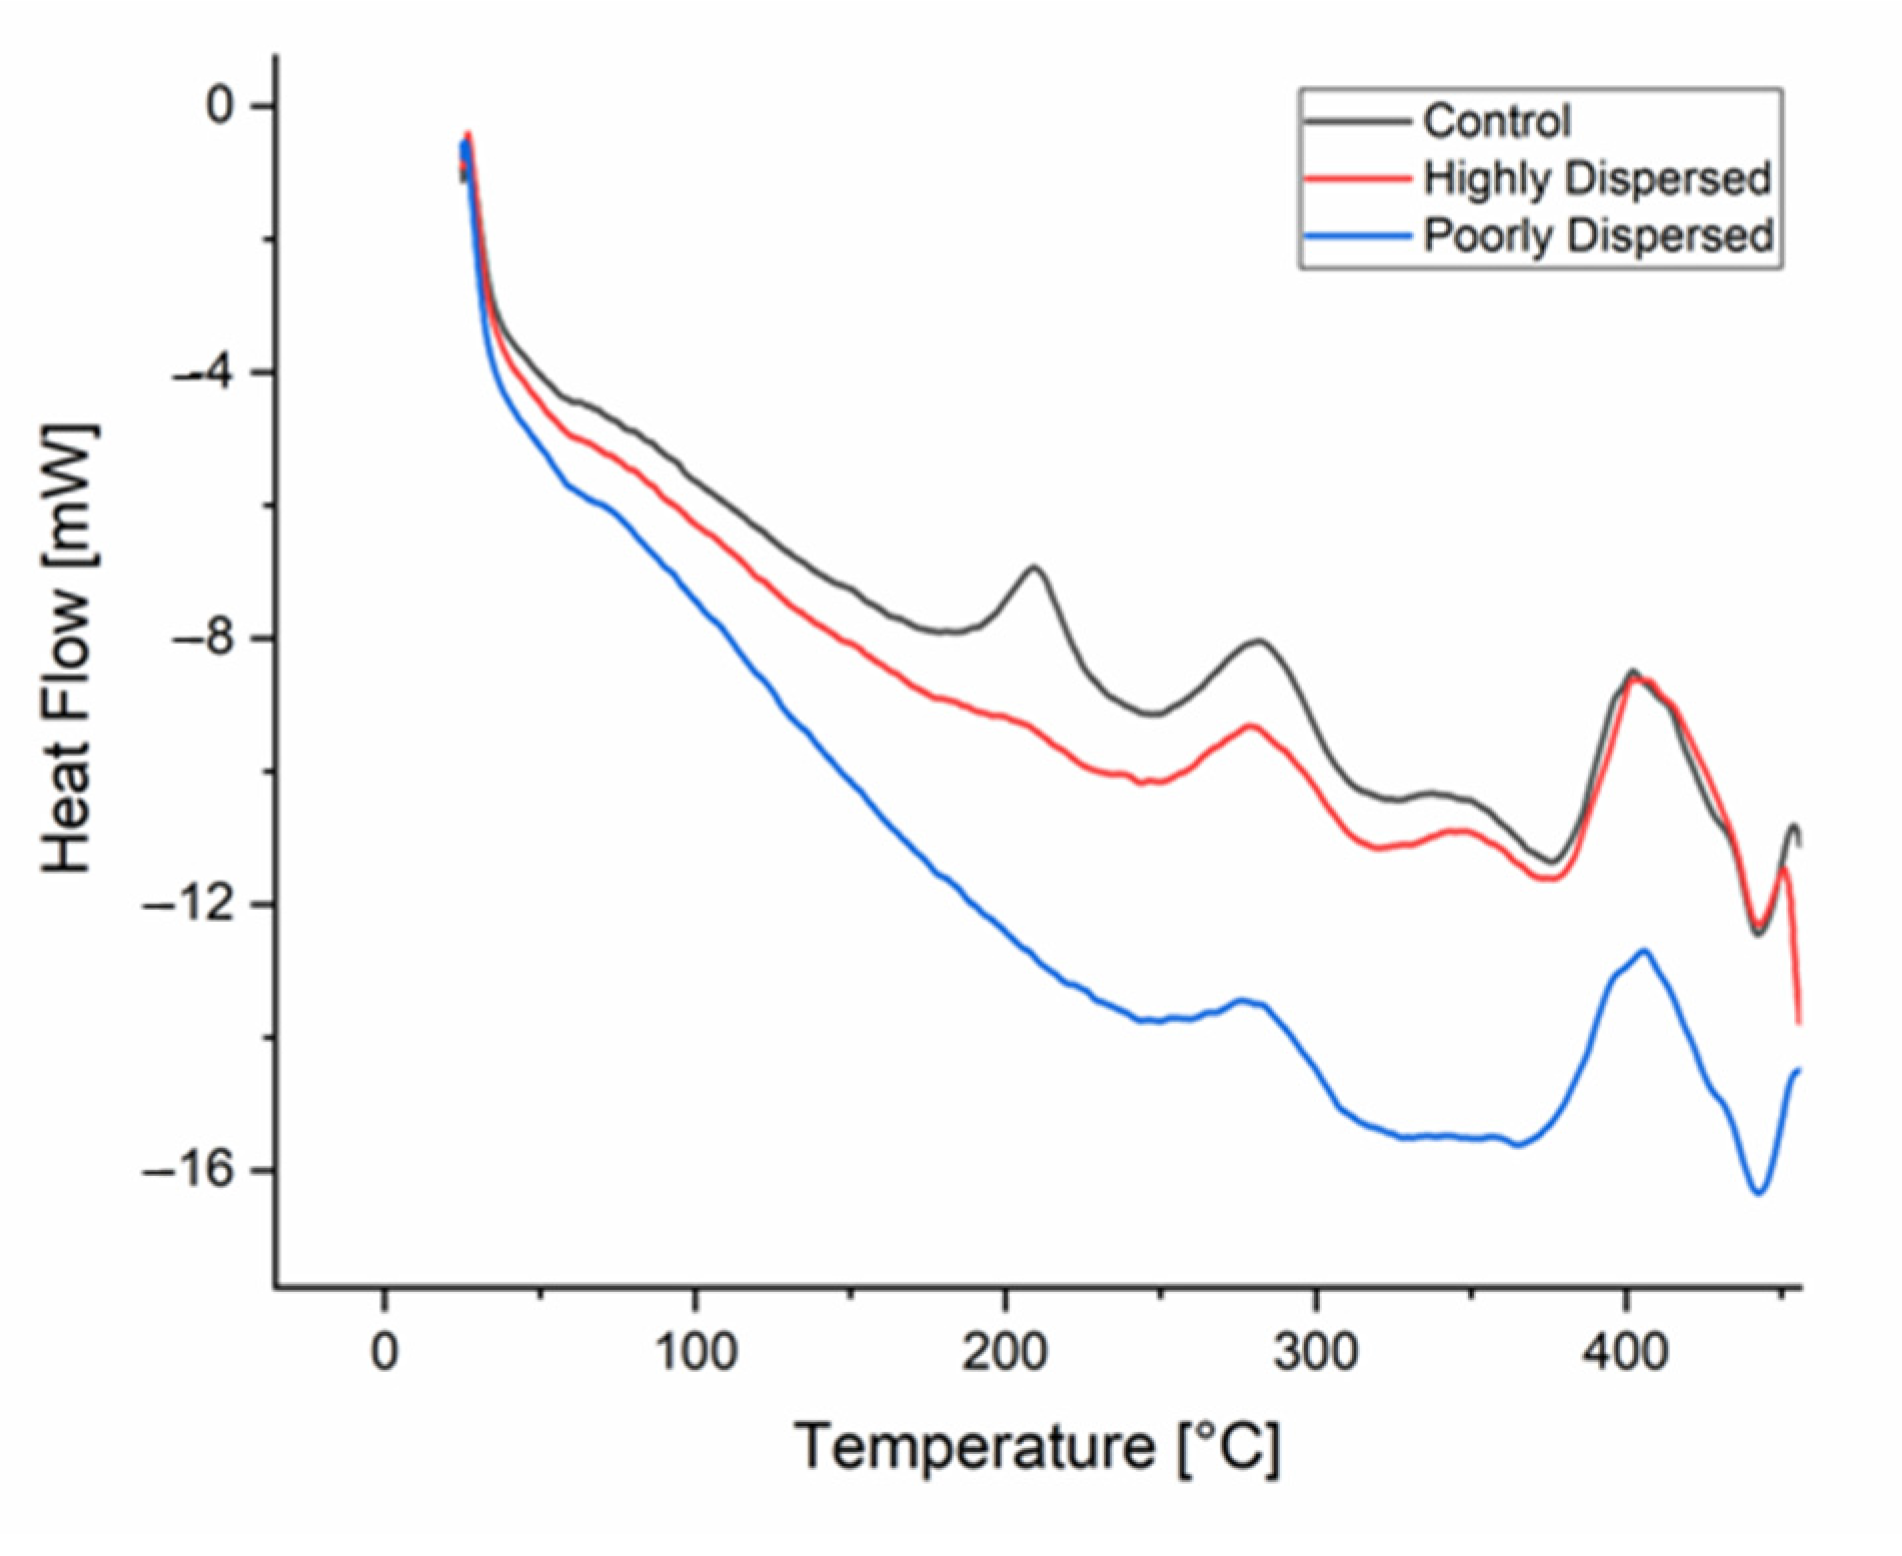
3.4. Thermal Properties of Poorly and Highly Dispersed Composites

TGA/DSC experiments were performed on poorly and highly dispersed nanocomposites along with the control sample resins to find out the effect of dispersion on thermal properties. Control samples were printed with no GO and without any sonication. Figure 10 and Figure 11 show that there are very minimal or no impacts on thermal properties. The thermal behavior of the 3D-printed composites was evaluated using DSC and TGA to ascertain the impact of the addition of GO dispersion on those parameters.
Figure 10 shows the mass percent as a function of sample temperature under a nitrogen purge for the control and highly dispersed and poorly dispersed nanocomposites. All the samples follow a similar trend line with very minimal differences, and, as can be seen from the plot. All the composites undergo thermal degradation beginning at around 330 °C with a total mass loss of 80%. A small amount of inert residue of 5% remains at the end for all the samples. It is obvious from the respective graphs that these samples follow a two-step decomposition. The first mass loss of around 80% is due to a partial loss of the side groups whereas the second one of 10% is due to depolymerization. Both degradation steps progressively shift to slightly lower degradation temperatures as the GO concentration of the 3D-printed nanocomposite increases compared with the control sample. These observations suggest that the thermal stability of the control specimen is slightly reduced upon the addition of GO, with some inert residue left of 10% more than poorly or highly dispersed samples.
Figure 11 shows the DSC results for the control and highly dispersed and poorly dispersed nanocomposites. The DSC shows an endo down as seen in the figure due to the decomposition of acrylate polymers. The first transition this control sample undergoes is seen at 50 °C, which is the glass transition temperature (Tg). At this stage, the polymer changes from a relatively hard, glassy solid into a softer, more flexible, or rubbery material. This is observed as a deflection in the heat flow profile, and not as a distinct peak as in the other transitions. The overall shape of the DSC curve is similar for the other GO nanocomposites and control samples, however, increasing the GO concentration results in a slight increase in the Tg of the 3D-printed nanocomposites, as shown in Figure 11. The control samples show two peaks during melting, which is possible because of the decomposition of monomers and the melting and decomposition of the photo-initiator and/or the polymerization of residual monomers remaining within the polymer particles [37]. The second transition for the control samples lies somewhere around 200 °C while that for the other two samples can be seen at 280 °C, which are the crystallization points. As the temperature reaches this point, the polymer gains maximum flexibility to rearrange from a glossy state into a lower energy crystalline state. This trend holds true for both poorly and highly dispersed nanocomposites. In the present work, a similar pattern was observed by comparing the DSC curves of GO nanocomposites with those of other SLA- or DLP-printed GO polymer nanocomposite studies, whereby an increase in GO concentration decreased the Tg of the resulting nanocomposite, as well as the effect on good and bad dispersion [38,39].

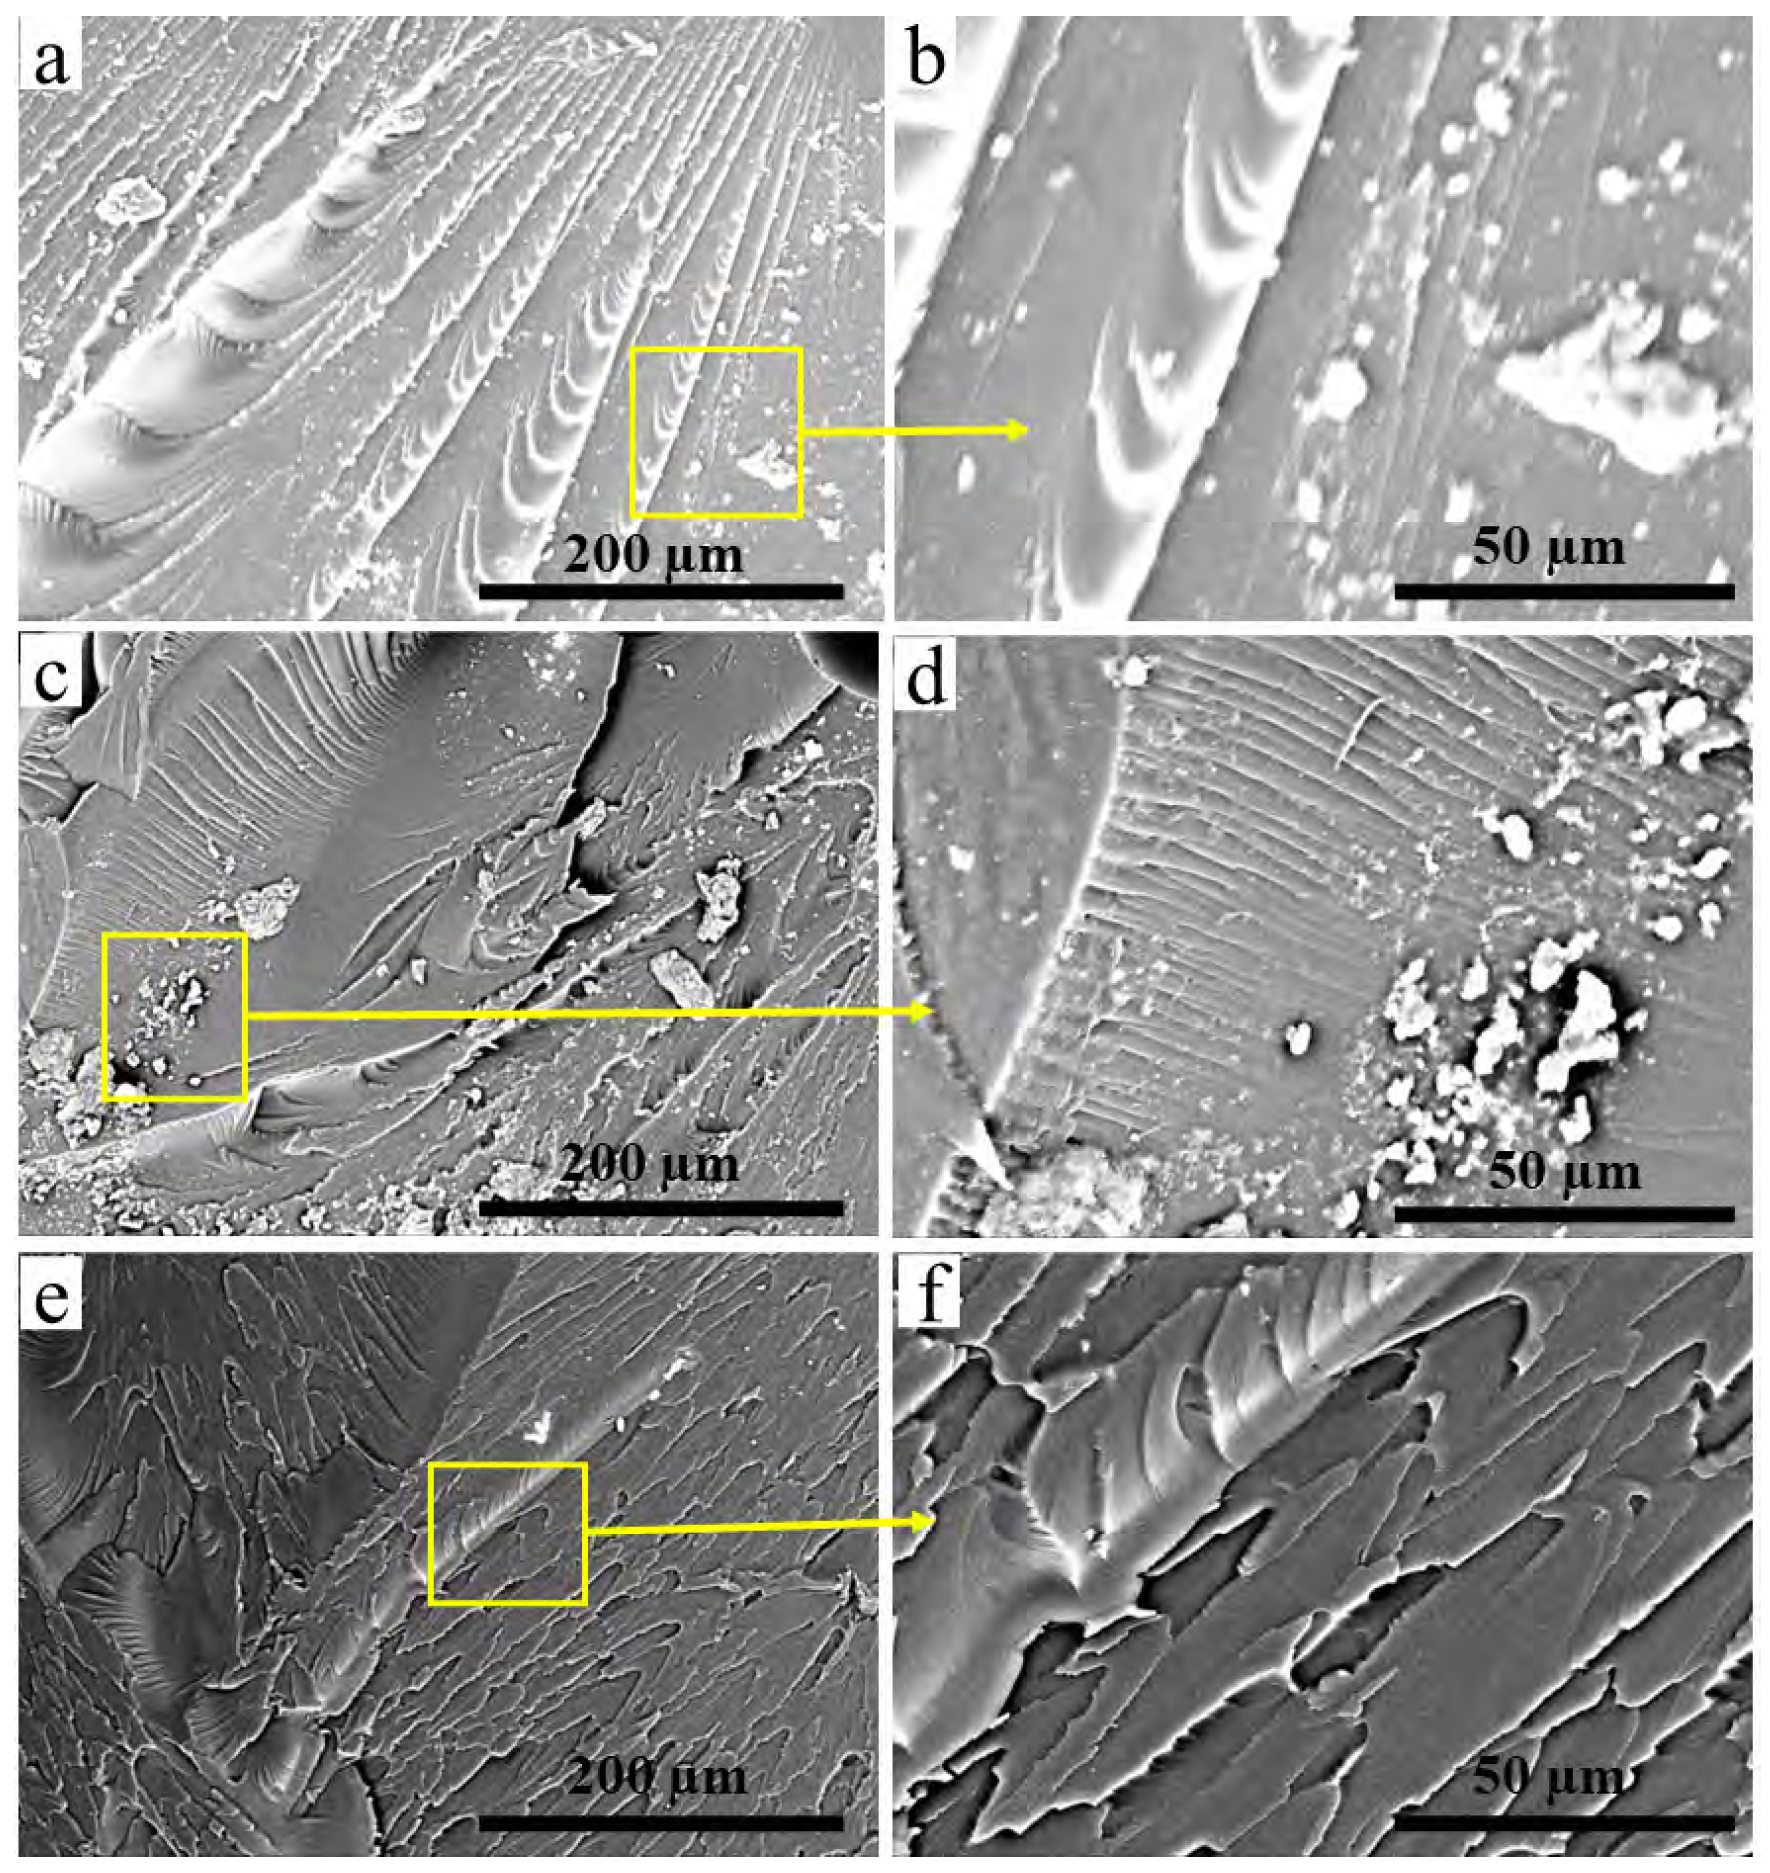
3.5. Mechanical Properties with Varying GO Concentration

A well-dispersed sonication dispersion route was found after performing a series of experiments. Then, this dispersion route was used to print GO-based nanocomposite resins with varying GO concentrations from 0 to 0.5 wt.%, increasing by 0.025 increments. There were surprising effects on both tensile and compressive strengths. The mechanical properties of 3D-printed specimens printed at the optimum sonication route are shown in Figure 12. At 0 wt.%, the tensile strength was about 23 MPa and the compressive strength was 109 MPa, respectively. When the GO concentration was increased by 0.025 increments up to 0.05 wt.%, maximum mechanical properties were achieved. The compressive strength increased by 35.7% while tensile strength increased by 43.7% compared with the control specimens. Similarly, increasing GO concentration beyond 0.075 wt.% resulted in a sudden decrease in mechanical properties in both strengths up to 0.1 and then slowly decreased up to 0.5 wt.%. This phenomenon is due to the fact increasing nanofiller concentrations beyond a certain threshold cannot increase the mechanical properties as the nanofiller is much aggregated inside the resin [29,39]. Beyond 0.5 wt.%, the print was unsuccessful because of the too-populated resin, which mainly blocks light.
The nature of nanoparticles is to with agglomerate each other [40]. Therefore, soon after a nanocomposite resin is prepared, the GO starts to agglomerate again after some time. The reason behind the low tensile strength compared with the literature is explained by the total print time of each nanocomposite resin being 4 h. 30 min; therefore, it took less time to print the compressive specimens before the GO started mixing again. The compression test samples were printed in accordance with ASTM standards [41]. Similarly, the tensile specimens took 4 h and 30 min to print, as all the specimens were printed at 45°. Therefore, during this increased time, the GO had somehow mixed with each other, which affected the tensile strength [26,27,31]. The compressive strength obtained at 0.05 wt.% was 36% more than that for the control samples. This high strength is not reported in the literature for polymer nanocomposites at very low GO loadings. This is because of the series of dispersion routes that were employed before. These high-strength nanocomposites have several practical applications such as in the automotive industry, drone parts manufacturing, customized devices, surgical implants, etc. To check the printability of 0.05 wt.% GO-reinforced nanocomposite resin, a text and the logo of XJTU were printed, as shown in Figure 3.
The fracture surfaces of the tensile specimens of control and poorly and highly dispersed printed composites were investigated using microscopy. Figure 13a is a typical microstructure of brittle materials, as described in the literature [42,43]. The control samples were typical acrylates that undergo a brittle-like failure. The series of cracks in the microstructure is initiated via a river-like flow, which enhances as the cracks propagate. There are also some dark voids that exist in the sample, which is due to incomplete polymerization due to some experimental error, as evidenced in the literature [43,44,45]. Such voids are most likely made during the 3D printing process since it is probable that the resins were not entirely cured with the laser source of the 3D printer or because of the failure of the specimens during the tests. However, as all the parts were tested under the same conditions and with the same built structure, this building structure was taken into consideration in the study and had no impact on the comparison and assessment of the results that were reported in this study. Figure 13c is the fracture surface of a poorly dispersed printed nanocomposite. The wrinkled morphology of GO can be seen with some smooth and vague surfaces. In addition, some gaps between GO and the polymer matrix can be also found on the fracture surface, indicating that the nanofiller–matrix interface is not so strong, which results in debonding, leading to many river-like structures on the fracture surface. The cracks follow a somewhat brittle-like failure that tends toward ductility [39]. More voids or black surfaces also exist, which again is due to the aggregation of the nanofiller inside the polymer matrix that results in incomplete polymerization and poor mechanical properties. The printed nanocomposites’ brittleness in tensile testing was further affected by the increase in GO loading. Therefore, the major reason for the brittle behavior was produced by the voids. Such gaps enable abrupt fracture as the tensile strength increases, resulting in brittle shattered surfaces, as evidenced by [44]. However, as the micro-cracks propagate, the GO is pulled due to the poor nanofiller–polymer matrix interface when the stress exceeds the composite interface strength. The exfoliation/or pullout of GO promotes local plastic deformation of the polymer matrix to dissipate the fracture energy, as evidenced in the rough fracture surface. Similarly, the highly dispersed printed nanocomposite has somewhat smooth and laminated fracture surface, which indicates the cracks propagated, as shown in Figure 13e. The nanofiller polymer matrix interface is strong enough here to restrict the GO inside the matrix. This results in the proper dispersion of GO in the polymer and excellent mechanical properties, as evidenced in the following images.

4. Conclusions

This study investigated the effects of nanoparticle dispersion on the mechanical and thermal properties of polymer nanocomposites. Different constraints and limitation parameters were applied using sonication dispersion routes. The concluding remarks are as follows:
  • The mechanical properties of the final 3D-printed parts greatly depend upon the sonication duration. Increasing the sonication duration up to some extent results in the breaking of GO agglomerates, which directly affects the mechanical properties. Beyond a certain duration limit, there is no effect on the breaking of clusters, but, rather, it helps the GO to re-agglomerate and form clusters. The most efficient and optimized sonication duration is 30 min, which has high dispersion.
  • Similar effects were observed for ultrasonic amplitude. A low amplitude employed for more time or a high amplitude employed for less time has nearly the same properties. In fact, 70% amplitude shows high dispersion and high mechanical properties. The most favorable parameters for maximum mechanical properties achieved are 30 min and 70%.
  • Thermal properties were rarely disturbed. In short, there was no or little effect on thermal properties by varying dispersion parameters.
  • Increasing the GO concentration beyond 0.05 wt.% results in a gradual decrease in mechanical properties. The compressive strength was increased by 35.7% while tensile strength was increased by 43.7% compared with the control specimens. These high-strength GO-reinforced 3D-printed nanocomposites can be used in automotive and sports applications, etc.
  • This graphene oxide dispersion route was employed for the first time in vat-photopolymerization-based 3D-printing and can be extended to other nanoparticles such as CNCs (cellulose nanocrystals), CNT carbon nanotubes, etc., for their uses in specific applications.
  • Similarly, using various nanoparticles in commercial photopolymer resins as well as in customized lab-made resins that can be used to enhance thermal, mechanical, and electrical properties are some of the recommendations for future work.

Author Contributions

Conceptualization, M.S. and A.U.; methodology, M.S.; software, M.S. and A.U.; validation, M.S., A.U. and K.A.; formal analysis, M.S., A.U. and A.U.R.; investigation, M.S., A.U. and K.A.; resources, M.S.; data curation, M.S. and A.U.; writing—original draft preparation, M.S., K.A. and A.U.; writing—review and editing, M.S., A.U., K.A., W.J., N.A., A.U.R. and M.U.S.; visualization, A.U.R. and W.J.; supervision, N.A, C.S.T. and M.U.S.; project administration, M.S. and M.U.S.; funding acquisition, M.S. All authors have read and agreed to the published version of the manuscript.

Funding

This project has received funding from the European Union’s Horizon 2020 research and innovation program under the Marie Skłodowska-Curie grant agreement no. 101034425. This work was also supported by the National Natural Science Foundation of China (grant no. 51974224 and 52174372) and the Natural Science Foundation of Shaanxi Province (grant no. 2020JM-047). This work has also received financial support from the Scientific and Technological Research Council of Turkiye (TUBITAK) under TUBITAK’s 2236/B program Grant No. 120C158.

Institutional Review Board Statement

Not applicable.

Informed Consent Statement

Not applicable.

Data Availability Statement

Not applicable.

Acknowledgments

We would like to thank Liu Zhiwei for additionally supporting and supervising this research work. We would also like to thank the Xi’an Jiaotong University Instrument Analysis Center for its help with the SEM analysis.

Conflicts of Interest

The authors declare no conflict of interest.

References

  1. Shah, M.; Ullah, A.; Azher, K.; Rehman, A.U.; Juan, W.; Aktürk, N.; Tüfekci, C.S.; Salamci, M.U. Vat photopolymerization-based 3D printing of polymer nanocomposites: Current trends and applications. RSC Adv. 2023, 13, 1456–1496. [Google Scholar] [CrossRef] [PubMed]
  2. Ullah, A.; Ur Rehman, A.; Salamci, M.U.; Pıtır, F.; Liu, T. The influence of laser power and scanning speed on the microstructure and surface morphology of Cu2O parts in SLM. Rapid Prototyp. J. 2022, 28, 1796–1807. [Google Scholar] [CrossRef]
  3. ASTM ISO/ASTM52900-15; Standard Terminology for Additive Manufacturing—General Principles—Terminology. ASTM: West Conshohocken, PA, USA, 2015.
  4. Feng, Z.; Li, Y.; Xin, C.; Tang, D.; Xiong, W.; Zhang, H. Fabrication of Graphene-Reinforced Nanocomposites with Improved Fracture Toughness in Net Shape for Complex 3D Structures via Digital Light Processing. J. Carbon Res. 2019, 5, 25. [Google Scholar] [CrossRef]
  5. Bustillos, J.; Montero-Zambrano, D.; Loganathan, A.; Boesl, B.; Agarwal, A. Stereolithography-based 3D printed photosensitive polymer/boron nitride nanoplatelets composites. Polym. Compos. 2019, 40, 379–388. [Google Scholar] [CrossRef]
  6. Markandan, K.; Seetoh, I.P.; Lai, C.Q. Mechanical anisotropy of graphene nanocomposites induced by graphene alignment during stereolithography 3D printing. J. Mater. Res. 2021, 36, 4262–4274. [Google Scholar] [CrossRef]
  7. Lai, C.Q.; Markandan, K.; Luo, B.; Lam, Y.C.; Chung, W.C.; Chidambaram, A. Viscoelastic and high strain rate response of anisotropic graphene-polymer nanocomposites fabricated with stereolithographic 3D printing. Addit. Manuf. 2021, 37, 101721. [Google Scholar] [CrossRef]
  8. Ullah, I.; Zhang, S.; Waqar, S. Numerical and experimental investigation on thermo-mechanically induced residual stress in high-speed milling of Ti-6Al-4V alloy. J. Manuf. Process. 2022, 76, 575–587. [Google Scholar] [CrossRef]
  9. Xu, W.; Jambhulkar, S.; Zhu, Y.; Ravichandran, D.; Kakarla, M.; Vernon, B.; Lott, D.G.; Cornella, J.L.; Shefi, O.; Miquelard-Garnier, G.; et al. 3D printing for polymer/particle-based processing: A review. Compos. Part B Eng. 2021, 223, 109102. [Google Scholar] [CrossRef]
  10. Sampson, K.L.; Deore, B.; Go, A.; Nayak, M.A.; Orth, A.; Gallerneault, M.; Malenfant, P.R.L.; Paquet, C. Multimaterial Vat Polymerization Additive Manufacturing. ACS Appl. Polym. Mater. 2021, 3, 4304–4324. [Google Scholar] [CrossRef]
  11. Momper, R.; Landeta, A.I.; Yang, L.; Halim, H.; Therien-Aubin, H.; Bodenschatz, E.; Landfester, K.; Riedinger, A. Plasmonic and Semiconductor Nanoparticles Interfere with Stereolithographic 3D Printing. ACS Appl. Mater. Interfaces 2020, 12, 50834–50843. [Google Scholar] [CrossRef]
  12. Tsang, C.H.A.; Zhakeyev, A.; Leung, D.Y.C.; Xuan, J. GO-modified flexible polymer nanocomposites fabricated via 3D stereolithography. Front. Chem. Sci. Eng. 2019, 13, 736–743. [Google Scholar] [CrossRef]
  13. Wang, Y.; Chen, S.; Liang, H.; Liu, Y.; Bai, J.; Wang, M. Digital light processing (DLP) of nano biphasic calcium phosphate bioceramic for making bone tissue engineering scaffolds. Ceram. Int. 2022, 48, 27681–27692. [Google Scholar] [CrossRef]
  14. Xiao, R.; Ding, M.; Wang, Y.; Gao, L.; Fan, R.; Lu, Y. Stereolithography (SLA) 3D printing of carbon fiber-graphene oxide (CF-GO) reinforced polymer lattices. Nanotechnology 2021, 32, 235702. [Google Scholar] [CrossRef] [PubMed]
  15. Lin, D.; Jin, S.; Zhang, F.; Wang, C.; Wang, Y.; Zhou, C.; Cheng, G.J. 3D stereolithography printing of graphene oxide reinforced complex architectures. Nanotechnology 2015, 26, 434003. [Google Scholar] [CrossRef] [PubMed]
  16. Wang, L.; Ni, X. The effect of the inorganic nanomaterials on the UV-absorption, rheological and mechanical properties of the rapid prototyping epoxy-based composites. Polym. Bull. 2017, 74, 2063–2079. [Google Scholar] [CrossRef]
  17. Monzón, M.; Ortega, Z.; Hernández, A.; Paz, R.; Ortega, F. Anisotropy of Photopolymer Parts Made by Digital Light Processing. Materials 2017, 10, 64. [Google Scholar] [CrossRef]
  18. Asadi, A.; Alarifi, I.M.; Ali, V.; Nguyen, H.M. An experimental investigation on the effects of ultrasonication time on stability and thermal conductivity of MWCNT-water nanofluid: Finding the optimum ultrasonication time. Ultrason. Sonochemistry 2019, 58, 104639. [Google Scholar] [CrossRef]
  19. Ruan, B.; Jacobi, A.M. Ultrasonication effects on thermal and rheological properties of carbon nanotube suspensions. Nanoscale Res. Lett. 2012, 7, 127. [Google Scholar] [CrossRef]
  20. Wei, J.; Vo, T.; Inam, F. Epoxy/graphene nanocomposites—Processing and properties: A review. RSC Adv. 2015, 5, 73510–73524. [Google Scholar] [CrossRef]
  21. Chiappone, A.; Roppolo, I.; Naretto, E.; Fantino, E.; Calignano, F.; Sangermano, M.; Pirri, F. Study of graphene oxide-based 3D printable composites: Effect of the in situ reduction. Compos. Part B Eng. 2017, 124, 9–15. [Google Scholar] [CrossRef]
  22. Karak, N. Chapter 1—Fundamentals of Nanomaterials and Polymer Nanocomposites. In Nanomaterials and Polymer Nanocomposites; Karak, N., Ed.; Elsevier: Amsterdam, The Netherlands, 2019; pp. 1–45. [Google Scholar]
  23. Manapat, J.Z.; Mangadlao, J.D.; Tiu, B.D.B.; Tritchler, G.C.; Advincula, R.C. High-Strength Stereolithographic 3D Printed Nanocomposites: Graphene Oxide Metastability. ACS Appl. Mater. Interfaces 2017, 9, 10085–10093. [Google Scholar] [CrossRef] [PubMed]
  24. Mahbubul, I.M.; Saidur, R.; Hepbasli, A.; Amalina, M.A. Experimental investigation of the relation between yield stress and ultrasonication period of nanofluid. Int. J. Heat Mass Transf. 2016, 93, 1169–1174. [Google Scholar] [CrossRef]
  25. Cai, X.; Jiang, Z.; Zhang, X.; Zhang, X. Effects of Tip Sonication Parameters on Liquid Phase Exfoliation of Graphite into Graphene Nanoplatelets. Nanoscale Res. Lett. 2018, 13, 241. [Google Scholar] [CrossRef] [PubMed]
  26. Wang, B.; Jiang, R.; Song, W.; Liu, H. Controlling dispersion of graphene nanoplatelets in aqueous solution by ultrasonic technique. Russ. J. Phys. Chem. A 2017, 91, 1517–1526. [Google Scholar] [CrossRef]
  27. Montazeri, A.; Chitsazzadeh, M. Effect of sonication parameters on the mechanical properties of multi-walled carbon nanotube/epoxy composites. Mater. Des. (1980–2015) 2014, 56, 500–508. [Google Scholar] [CrossRef]
  28. Malas, A.; Isakov, D.; Couling, K.; Gibbons, G.J. Fabrication of High Permittivity Resin Composite for Vat Photopolymerization 3D Printing: Morphology, Thermal, Dynamic Mechanical and Dielectric Properties. Materials 2019, 12, 3818. [Google Scholar] [CrossRef]
  29. Manapat, J.Z.; Chen, Q.; Ye, P.; Advincula, R.C. 3D Printing of Polymer Nanocomposites via Stereolithography. Macromol. Mater. Eng. 2017, 302, 1600553. [Google Scholar] [CrossRef]
  30. Li, F.; Li, L.; Zhong, G.; Zhai, Y.; Li, Z. Effects of ultrasonic time, size of aggregates and temperature on the stability and viscosity of Cu-ethylene glycol (EG) nanofluids. Int. J. Heat Mass Transf. 2019, 129, 278–286. [Google Scholar] [CrossRef]
  31. Tarawneh, M.a.A.; Ahmad, S.H.; EhNoum, S.; Lau, K.-t. Sonication effect on the mechanical properties of MWCNTs reinforced natural rubber. J. Compos. Mater. 2012, 47, 579–585. [Google Scholar] [CrossRef]
  32. Sha, X.; Beyle, A.; Ibeh, C.C. Effect of sonication on mechanical properties of polymers and nanocomposites. Tech-Connect. Briefs 2009, 2, 458–460. [Google Scholar]
  33. Razali, N.Z.; Abidin, M.H.; Romli, A.Z. The effect of sonication method on the mechanical properties of nanosilicon/epoxy composite. AIP Conf. Proc. 2017, 1885, 020065. [Google Scholar] [CrossRef]
  34. Löwa, N.; Fabert, J.-M.; Gutkelch, D.; Paysen, H.; Kosch, O.; Wiekhorst, F. 3D-printing of novel magnetic composites based on magnetic nanoparticles and photopolymers. J. Magn. Magn. Mater. 2019, 469, 456–460. [Google Scholar] [CrossRef]
  35. Alba, D.; Roos, A.; Wimmer, G.; Gonzalez, A.; Hanke, S.; Dos Santos, J. Application of Response Surface Methodology for Optimization of Hybrid Friction Diffusion Bonding of Tube-to-Tube-Sheet Connections in Coil-Wound Heat Exchangers. J. Mater. Res. Technol. 2019, 8, 1701–1711. [Google Scholar] [CrossRef]
  36. Muzamil, M.; Wu, J.; Akhtar, M.; Azher, K.; Majeed, A.; Zhang, Z.; Shazad, A. Nanoparticle-induced control (MWCNTs–TiO2) on grain size and tensile strength response and multi-response optimization on TIG welded joints. Trans. Can. Soc. Mech. Eng. 2022, 46, 626–638. [Google Scholar] [CrossRef]
  37. Ohyama, A.; Imai, Y. Differential Scanning Calorimetric Study of Acrylic Resin Powders Used in Dentistry. Dent. Mater. J. 2000, 19, 346–351. [Google Scholar] [CrossRef] [PubMed]
  38. Tang, L.-C.; Wan, Y.-J.; Yan, D.; Pei, Y.-B.; Zhao, L.; Li, Y.-B.; Wu, L.-B.; Jiang, J.-X.; Lai, G.-Q. The effect of graphene dispersion on the mechanical properties of graphene/epoxy composites. Carbon 2013, 60, 16–27. [Google Scholar] [CrossRef]
  39. Markandan, K.; Lai, C.Q. Enhanced mechanical properties of 3D printed graphene-polymer composite lattices at very low graphene concentrations. Compos. Part A Appl. Sci. Manuf. 2020, 129, 105726. [Google Scholar] [CrossRef]
  40. Valencia, L.M.; Herrera, M.; de la Mata, M.; de León, A.S.; Delgado, F.J.; Molina, S.I. Synthesis of Silver Nanocomposites for Stereolithography: In Situ Formation of Nanoparticles. Polymers 2022, 14, 1168. [Google Scholar] [CrossRef]
  41. ASTM E3-01; Standard Practice for Preparation of Metallographic Specimens. ASTM International: West Conshohocken, PA, USA, 2017; pp. 1–15.
  42. Gao, H.; Qiang, T. Fracture Surface Morphology and Impact Strength of Cellulose/PLA Composites. Materials 2017, 10, 624. [Google Scholar] [CrossRef]
  43. Zhang, S.; Li, M.; Hao, N.; Ragauskas, A.J. Stereolithography 3D Printing of Lignin-Reinforced Composites with Enhanced Mechanical Properties. ACS Omega 2019, 4, 20197–20204. [Google Scholar] [CrossRef]
  44. Vidakis, N.; Petousis, M.; Michailidis, N.; Kechagias, J.D.; Mountakis, N.; Argyros, A.; Boura, O.; Grammatikos, S. High-performance medical-grade resin radically reinforced with cellulose nanofibers for 3D printing. J. Mech. Behav. Biomed. Mater. 2022, 134, 105408. [Google Scholar] [CrossRef] [PubMed]
  45. Dong, D.; Su, H.; Li, X.; Fan, G.; Zhao, D.; Shen, Z.; Liu, Y.; Guo, Y.; Yang, C.; Liu, L.; et al. Microstructures and mechanical properties of biphasic calcium phosphate bioceramics fabricated by SLA 3D printing. J. Manuf. Process. 2022, 81, 433–443. [Google Scholar] [CrossRef]
Figure 1. Preparation route for nanocomposite resin.
Crystals 13 00285 g001
Figure 2. Water cooling setup of nanocomposite preparation using a sonicator.
Crystals 13 00285 g002
Figure 3. Tensile test specimens with increasing GO concentration from 0 to 0.5 wt.%. XJTU logo and text printed from 0.5 wt.% nanocomposite.
Crystals 13 00285 g003
Figure 4. (a) General morphology of GO. (b) Magnification of single GO sheet.
Crystals 13 00285 g004
Figure 5. Mechanical properties of 3D-printed nanocomposite at (a) 50%, (b) 70%, (c) 90% amplitudes with varying ultrasonic duration.
Crystals 13 00285 g005
Figure 6. Compressive strength of 3D-printed nanocomposite at varying amplitudes and times.
Crystals 13 00285 g006
Figure 7. Tensile strength of 3D-printed nanocomposite at varying amplitudes and times.
Crystals 13 00285 g007
Figure 8. (a) Contour plot and (b) 3D poly curve of compressive strength shows the range and peak values with varying amplitudes and times. Similarly, (c) contour plot and (d) 3D poly curve shows the range of tensile strength and peak values with varying amplitudes and times.
Crystals 13 00285 g008
Figure 9. The comparison between the experimental and regression values of (a) compressive strength and (b) tensile strength at varying amplitudes and times.
Crystals 13 00285 g009
Figure 10. TGA curves of control and highly and poorly dispersed GO nanocomposites. (a) TGA curves of highly dispersed, poorly dispersed, and control specimens. (b) Magnification of the upper area. (c) Magnification of the lower area.
Crystals 13 00285 g010
Figure 11. DSC curves of control and highly and poorly dispersed GO nanocomposites.
Crystals 13 00285 g011
Figure 12. Tensile and compressive strength of GO-based nanocomposites with varying GO concentrations.
Crystals 13 00285 g012
Figure 13. The fracture surface of (a,b) control specimens and (c,d) poorly dispersed and (e,f) highly dispersed nanocomposites.
Crystals 13 00285 g013
Table 1. Summary of ultrasonic parameters employed.
Time
(min)
Amplitude
(%)
GO Concentration
(wt.%)
Optimized Parameter
15, 30, 60500.1
15, 30, 60700.1
15, 30, 60900.130, 70
30900.05, 0.075, 0.25, 0.50.05
Table 2. Experimental values of compressive and tensile strengths with varying amplitudes and times.
Time
(min)
Amplitude
(%)
Compressive Strength
(MPa)
Tensile Strength
(MPa)
15506315
30508220
60507922
15707516
30709523.5
60707519.5
15908718
30909221
60907616
Table 3. ANOVA analysis for compressive strength (CS).
SourceDFSum of SquaresMean SquareF-Valuep-Value
Amplitude (%)2333.77166.882.47 × 10290.00
Time (minutes)2773.77386.885.74 × 10290.00
Amp*Time4444.88111.221.65 × 10290.00
Error90.000.000.000.00
Total171552.44
R-sq = 100% R-sq(adj) = 100%
* Means Interaction between amplitude and time.
Table 4. ANOVA analysis for tensile strength (CS).
SourceDFSum of SquaresMean SquareF-Valuep-Value
Amplitude (%)25.332.661.75 × 10280.00
Time (minutes)280.3340.162.64 × 10290.00
Amp*Time453.3313.338.79 × 10280.00
Error90.000.000.000.00
Total17139.00
R-sq = 100% R-sq(adj) = 100%
* Means Interaction between amplitude and time.
Disclaimer/Publisher’s Note: The statements, opinions and data contained in all publications are solely those of the individual author(s) and contributor(s) and not of MDPI and/or the editor(s). MDPI and/or the editor(s) disclaim responsibility for any injury to people or property resulting from any ideas, methods, instructions or products referred to in the content.

