Abstract
This report presents ‘giant’ and long-range premelting effects appearing in dielectric properties for the temperature and pressure paths of studies, with an explicit critical-like portrayal. The result was obtained for the ‘classic’ low molecular weight compound: nitrobenzene, tested in the solid and liquid phases. Dielectric studies enable the ‘extraction’ of the response from liquid layers between crystalline grains. Compressing increased the premelting effects, probably due to the ‘crushing’ of crystalline grains by isotropic squeezing and increasing the liquid layers between grains. This report indicates the significance of considering the melting/freezing phenomenon from the point of view of the ‘solid crystalline grains and critical-type liquid layers in synergic interactions’ concept.
1. Introduction
Melting/freezing discontinuous phase transitions between a crystalline solid and a liquid phase are common in the natural environment [1]. Today, their enormous impact has become crucial because of the global warming threat. Melting polar ice caps can change the global climate for millennia [2]. Melting and freezing are the base of significant material engineering applications [3]. A society-important example could be freezing-related food preservation [4]. The ongoing energy crisis, causing the Global Economic Crisis, and even the civilization existence threat, requires the development and implementation of breakthrough innovations [5]. One of the most promising is the so-called barocaloric effect, which uses the energy accumulated and released during the melting/freezing discontinuous transition upon compressing and decompressing. Technologies based on this phenomenon are indicated for new generations of refrigeration equipment, reducing electricity demands and remaining neutral for the environment. The barocaloric effect [6,7,8] can also support energy storage facilities, which is essential for a decentralized energy sector based on renewable energy sources.
In each case, an in-depth knowledge of the phenomenon underlying applications is vital for the fundamental insight into conditioning the effective development of innovations. Unfortunately, such insight into the melting/freezing phenomenon remains puzzling despite more than a century of research efforts [9,10,11,12,13,14,15,16,17,18,19,20,21,22,23,24,25,26]. This cognitive impasse can be associated with minimalistic experimental manifestations of phenomena coupled with melting/freezing discontinuous phase transitions. The basic feature of this transition is related to step changes (jumps) in physical properties, such as volume or density (ρ) or heat capacity (latent heat, ) [13,14] when passing a melting or freezing temperature. Only (very) small and range-limited premelting effects on the solid side of the melting temperature () are observed, although the experimental evidence without the premelting effect is equally common. The functional descriptions of experimentally detected premelting effects is lacking, which can be linked to their weakness and the frequent belief that they are a material-dependent phenomenon [13,14,15,18]. The question of the pressure-related premelting effects remains open. The significance of pretransitional effects in searching for ultimate modeling shows Critical Phenomena Physics, explaining and describing the nature of continuous phase transitions. Notably, it was one of the grand universalistic successes of 20th century physics [27,28].
This report presents the evidence for the ‘giant’ premelting effects appearing in dielectric properties for the temperature and pressure paths of studies, with the explicit critical-like portrayal. The result was obtained for the ‘classic’ low molecular weight compound, nitrobenzene.
It is notable that liquid nitrobenzene is one of the reference materials in Dielectrics Physics [29] due to the high value of the dielectric constant and its relatively low electric conductivity. Dielectric studies revealed a strong tendency to intermolecular coupling leading to various mutual arrangements of the permanent dipole moments. Nitrobenzene with n-alkanes creating mixtures of limited miscibility is the experimental reference system in Physical Chemistry [13] and Critical Phenomena Physics [30,31]. Nitrobenzene is also broadly used in industry as the precursor in aniline or lubricant oils productions.
The first phenomenological insight into the discontinuous melting phase transition offered the Clausius–Clapeyron relation [13,14]:
It links ‘step’ changes in volume () or density , and the heat capacity (latent heat) as the base for calculating the change of enthalpy () or entropy , occurring when passing the melting temperature .
Lindemann used the above relation and additionally linked melting to exceeding a threshold value by the mean square displacement of a particle in a crystalline solid. It led to the Lindemann differential equation [13,14,16]:
where is the bulk modulus, is for the thermal expansion coefficient and the Grueneissen parameter .
The application of Equations (1) and (2) for selected homologous series of materials enabled phenomenological predictions of basic melting/freezing materials characterizations, including melting temperatures [13,14,16]. Equations (1) and (2) also show the significance of high-pressure studies, particularly regarding dependences. Equation (1) can be used for deriving the Simon–Glatzel equation and its successor for systems showing the crossover ⇒ or characterized only by [13,32,33,34].
The analysis recalling Equations (1) and (2) and considering the impact of pressure is often used in geophysics and high-pressure material engineering, where the interplay between temperature and extreme pressures is essential [34,35,36].
In 1974, Honda [12] considered vibrating atoms/ions in a crystalline network for a model system with the interaction potential of hard-core and attractive-well parts. The model led to predictions of heat capacity premelting anomalies in the solid and liquid phases, including their functional descriptions. For the liquid phase, the pretransitional effects were expected in the narrow temperature range between the melting and spinodal supercooling temperatures. Unfortunately, the available heat capacity-related experiments do not show such behavior. Frenkel [10] developed the basics of the classical nucleation theory (CNT), in which the crystalline or liquid phase is preceded by the nucleus of the product phase forming spontaneously from the parent phase under thermal fluctuations to describe the solidification process. For this model, experimental validations focus on the nucleation kinetics in the liquid phase above .
Today, the dominant theoretical explanations of the melting phenomenon consider the previously mentioned weak premelting effects as the primary experimental feature. They are associated with the hypothesis of grains appearing in solid-state on approaching , associated with the coupled impacts of rising vibrations and defects within crystalline materials. These crystalline grains are associated with covering them with quasi-liquid layers. The final fragmentation of the solid crystal leads to the melting at [14,15,17]. The synergic microscopic approach suggests that melting/freezing discontinuous transition develops via multiple competing pathways, linking the above concepts, and is considered the promising theoretical model approach [18]. The grain model-based concepts yield a convincing picture explaining the emergence of premelting effects, but they do not offer the functional dependencies necessary for their ultimate experimental validation. Premelting effects become rather characteristics strictly dependent on a given material, and even the way of its preparation.
However, pretransitional functional dependences in the premelting domain can appear when linking the grain model concept with the theoretical analysis by Lipowsky [37,38] for surface melting, including the constrained melting case for a liquid layer between crystalline solid plates. He noted that liquid layers could be characterized by a specific symmetry of the order parameter M, and associated constraints introduced by the solid crystal surface. It can change continuously to zero for the continuous phase transition when approaching the bulk discontinuous phase transition temperature. It was stated in ref. [38]: ‘Such a discontinuous behavior does not seem to be particularly interesting. However, much more interesting effects can occur if one studies surface rather than bulk phenomena, say, may go continuously to zero. Thus, surface critical exponents can be defined and studied even though there are no bulk exponents.’ The surface order parameter () is related to a break of the translational invariance within layers, changing from completely ordered (‘dead’) related to the crystal surface to the disordered one when shifting from the wall. Its temperature changes are described as follows [37]:
where the order parameter exponent for the mean-field critical point. For the tricritical point (TCP) case, one can expect the value for the lower limit.
For this model, the continuous phase transition occurs in quasi-liquid layers and depends on the singular (‘critical’) temperature , only slightly shifted from the reference melting temperature for a discontinuous transition in the bulk sample. Furthermore, the thickness of the layer diverges [37]:
where the exponent and corresponds to a three-dimensional case associated with short-range forces.
Regarding the susceptibility related to the order parameter [37,38]:
where , although in some cases regarding the layer thickness: .
The latter can be associated with the impact of the mean square of the local order parameter fluctuations when recalling the results of the model developed for the pretransitional anomaly in restriction introduced by the strong electric field developed by the authors of the given report [39,40,41]. The infinitely increasing susceptibility when approaching also leads to extreme sensitivity to endogenic or exogenic impacts, and such generic instability tendency has to support the ultimate fragmentation of grains and the discontinuous melting transition. Equations (3)–(5), as well as some other issues included in Lipowsky model [37,38], can offer excellent tools for the ‘grain + liquid interfaces with critical-like features’ model. However, liquid nano/micro layers constitute only a very minor part of the bulk system, the dominant part of which constitutes solid crystalline grains.
The solution to the problem can be found in studies of the physical properties for which the contribution from the liquid phase is qualitatively more significant than from the solid crystalline part. Broadband dielectric spectroscopy (BDS), especially in dipolar liquids, can be considered as the experimental method, which can be used for extracting the desirable contribution in the premelting domain. The resolution in BDS studies reaching six significant digits is of major importance. The possibility of implementation to high-pressure conditions is meaningful, which is always an experimental challenge [30,42,43,44,45,46,47]. Very recent studies by the authors of this work in menthol [25] and thymol [26] for the surrounding of revealed dielectric constant premelting changes for which the critical-like portrayal takes place. It was possible that even though the dielectric constant change between the liquid and solid phases was small [25,26], the effect was portrayed by relation parallel to Equation (5), and interpreted as a ‘Mossotti Catastrophe’ [29,48] type behavior, resulting from the thinning of the liquid in the layers between the grains and liquid stretching leading to the weakening of dipole–dipole correlations. In ref. [42], the authors scanned the real part of the electrical conductivity for liquid crystal (LC) undecylcyanobiphenyl (11CB), starting from the static domain related to the dielectric constant to the low-frequency (LF) region dominated by residual ionic contaminations in every liquid. A strong rise of the premelting effect on a decreasing frequency in the ionic domains was observed.
This work presents the results of BDS studies in the static and LF frequency domains for nitrobenzene, where melting is associated with a huge dielectric constant jump: . The presented results concern temperature scans at atmospheric pressure, and under . They are supplemented by isothermal pressure tests, up to The analysis of experimental data revealed giant and critical-like premelting effects, both for static and dynamic dielectric properties, in which appearance is facilitated by compressing.
2. Methods and Materials
Nitrobenzene, with the highest available purity, was purchased from Fluka. It was additionally twice distilled under vacuum and carefully degassed prior to measurements. BDS dielectric studies were carried out using Novocontrol Alpha impedance analyzer, software supported, and equipped with Novocontrol Quattro system for temperature control: in the tested range of temperatures. The flat–parallel capacitor with the diameter and the gap between plates was used. It was made from Invar and was gold coated. For high-pressure studies, the capacitor design shown in ref. [43] was used. Its significant features are the ‘soft’ transmission of pressure to the tested sample from the pressurized liquid and the lack of contamination possibilities from the pressurized fluid (Plexol). The capacitor was placed within the pressure chamber, surrounded by a jacket linked to the large volume Julabo thermostat with the external circulation, to reach the required level of temperature stabilization.
The pressure system was designed and manufactured by UnipressEquipment, the unit of IHPP PAS, Warsaw, Poland. The copper–constantan thermocouple measured the temperature inside the chamber, and possible temperature gradients were monitored along the chamber body by two Pt100 resistors.
Most often, dielectric properties are monitored via the complex dielectric permittivity [29,30]. The real part is the base for determining dielectric constant as indicated in Figure 1, showing spectra of this component obtained in nitrobenzene for the high-pressure scan. The rise in lower frequencies is associated with residual ionic contaminations. The emergence of low-frequency (LF) relaxation processes is also visible. The horizontal part indicates the static domain associated with dielectric constant value. The imaginary part of dielectric permittivity can be used for determining DC electric conductivity: in the LF domain, and for testing relaxation processes, appearing mainly in GHz frequencies [30]. This research is limited to , because such a value still constitutes the experimental limit in high-pressure BDS studies.
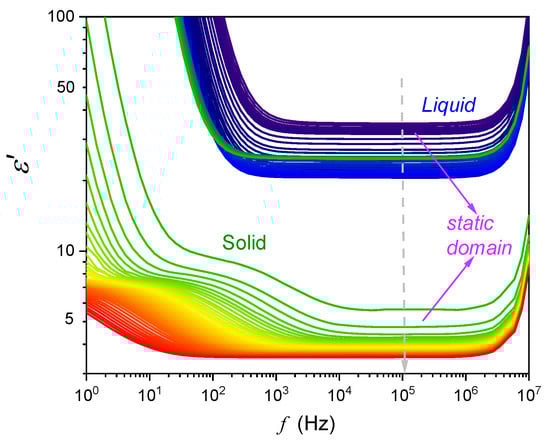
Figure 1.
The real part of dielectric permittivity obtained in isothermal pressure measurements at . The static domain related to ‘horizontal’, frequency independent, and defining dielectric constant is indicated. For frequencies below the static domain, the rise is associated with residual ionic contaminations. For frequencies above the static domain, the impact of relaxation processes emerges.
As visible in Figure 1, the relaxation process in LF relaxation makes the reliability of the analysis of the dynamics in this domain based only on electric conductivity puzzling. To limit the impact of this biasing factor, the alternative analyses based on the complex dielectric modulus [30] were carried out. The results of such transformation are shown in Figure 2. The peak of the modulus loss curve determines the relaxation time , the evolution of which parallels DC electric conductivity changes [30]. The height of the loss curve reflects energy changes related to the given relaxation process [49].
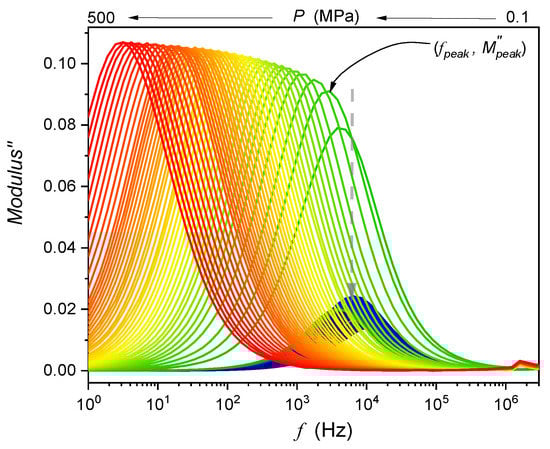
Figure 2.
Dielectric modulus loss curves in nitrobenzene, on compressing from the liquid phase under atmospheric pressure up to , for isothermal tests at . The arrow indicates the melting pressure: the liquid phase is in deep blue, and the solid is in green, yellow, orange, and red.
3. Results and Discussion
The dielectric constant is the basic electric-field-related material characterization introduced by Michel Faraday in the mid-19th century [50]. It is also the essential reference magnitude for Dielectrics Physics [29]. The electric field acting of a molecule within a liquid dielectric differs from the external electric field in a sample placed in a capacitor. The concept of the local electric field was first introduced by Mossotti and Clausius (MC), leading to the relation which can well describe both the density (concentration) and temperature changes of dielectric constant [29,48]. The generic assumption of the MC model limits their relevance to gases and simple non-dipolar liquid dielectric. However, after including the polarizability associated with the permanent dipole moment, which is exceeding the assumptions of the model, the dependence resembling the Curie–Weiss relation for the ferroelectric–paraelectric phase transition is obtained [29,48,51]:
where denotes dielectric susceptibility, is the critical temperature, and is the constant amplitude depending on polarizability, density, etc.
Von Hippel considered water in the frames of Equation (6), substituting its permanent dipole moment and density . He obtained , i.e., below this temperature, water should be a ferroelectric solid if the Clausius–Mossotti local field model obeys [48]. This simple result is often recalled as the ‘Mossotti Catastrophe’ paradox, showing the consequences of exceeding model assumptions. However, at density, is possible only under extreme pressure, the fact this is omitted by von Hippel and his followers indicates that the von Hippel paradox example should be reconsidered. Although the Clausius–Mossotti local field model and Equation (6) fail for simple liquid dipolar dielectrics, they are adequate for describing solid relaxor systems, where ferroelectric ‘grains’ are scattered within a paraelectric matrix [51]. The mentioned paradox for liquid dipolar dielectrics has been removed by Onsager, Kirkwood, Froelich, etc. [29], who introduced the more advanced definition of a cavity with a dielectric material, defining the final electric field acting on a molecule inside the dielectric. They derived relations fairly well by reproducing dielectric constant changes as the function of density or concentration of the dipolar component in a liquid dielectric, and avoiding the Mossotti–Catastroffe paradox. However, these relations do not offer a direct link for portraying the temperature changes of the dielectric constant. Notwithstanding, some qualitative statements regarding the permanent dipole moment are possible using solely changes, namely (i) for , and permanent dipole moments tend to follow the direction of the electric field, which is recalled as the ‘parallel’ arrangement, (ii) for and the preference for the effective antiparallel arrangement of permanent dipole moments is indicated [29].
The situation changes when approaching a critical point for continuous and semi-continuous phase transitions, where strongly temperature-dependent multimolecular collective processes are dominating. In the supercritical domain above the gas-liquid critical point (GLCP) or above the critical consolute point (CCP) in binary mixtures of limited miscibility [30,44,45,46]:
where is for the critical exponent for the specific heat precritical anomaly. For GLCP and CCP [45,46,47] and in the isotropic phase of nematogenic liquid crystals [49,52,53,54,55]. As mentioned above, Equation (6) can portray experimental data in solid relaxor systems, but it also obeys ferroelectric liquid crystals, for instance [51]. For such systems, dielectric susceptibility, and then dielectric constant, are related to the derivative of the order parameter (P—electric polarization) for the directly coupled (E—electric) field and then [51]:
where the susceptibility/compressibility critical exponent within MF or TCP approximations.
The above relation correlates with the ‘Mossotti Catastrophe’ Equation (6). For liquids, when approaching GLCP or CCP, the mentioned coupling is absent and the precritical anomaly described by Equation (7) occurs.
Figure 3 presents changes in the dielectric constant for nitrobenzene on cooling from the liquid phase, which is associated with the freezing temperature , and on heating from the solid state with liquidation when passing the melting temperature . The results are for tests under atmospheric pressure, and . There are no hallmarks of the premelting effect under atmospheric pressure. However, when compressing the system up to , the strong and long-range premelting effect appears for and the dielectric constant increases almost six times at a distance of ca. 20 K. The anomaly is well reproduced by the dependence consistent with Equations (6) and (8):
where is related to the background dielectric permittivity of the crystalline solid. For experimental data presented in Figure 3, the exponent and the singular temperature .
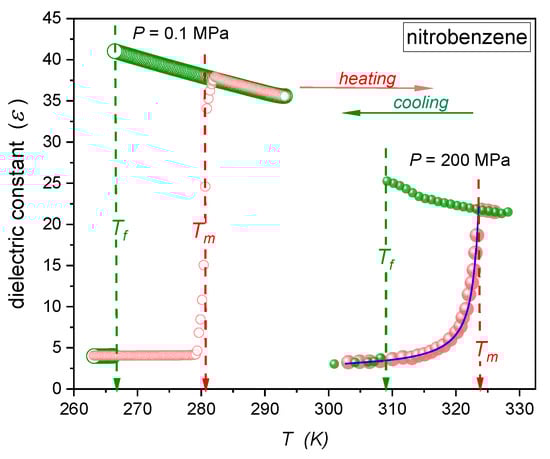
Figure 3.
Temperature evolutions of dielectric constant related to melting (, heating from the solid phase) and freezing (, cooling from the liquid phase) in nitrobenzene, under atmospheric pressure, and for . For the latter, the curve portraying premelting anomaly is coupled to Equation (9), with exponent . The curve is for the critical-like portrayal (Equation (9)) with the amplitude K, singular temperature K, the exponent , and .
The agreement with the Lipowsky model [37,38] and Equation (5) for liquid layers between crystalline solid plates is also notable. Recently, studies in menthol [25] and thymol [26] have shown similar behavior in approaching the melting temperature under atmospheric pressure. It was explained as the consequence of an ‘effective negative pressure’ formed within quasi-liquid layers between grains. It leads to the ‘rarefication’ of the liquid and the decrease of dipole–dipole intermolecular correlations, yielding conditions re-validating the Clausius–Mossotti model, and the description via Equation (6). The lack of the pretransitional effect below on cooling can be commented as the generic feature or the consequence of relatively ‘deep’ supercooling, causing the pretransitional domain close to the singular temperature to remain ‘hidden’.
Figure 4 presents changes in the dielectric constant for isothermal compressing at K, well portrayed by the following critical-like relation:
where the exponent and is the singular pressure.
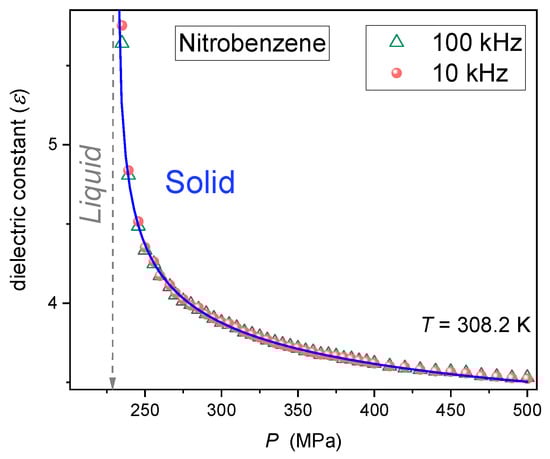
Figure 4.
Pretransitional anomaly of dielectric constant appearing for isothermal compressing in solid nitrobenzene. Experimental data are for two measurement frequencies indicated in the figure. The curve portraying the effect is described by Equation (10) with the following parameters: amplitude , singular pressure , the exponent , and .
Note the overlapping of experimental data for two strongly different measurement frequencies, which proves that studies were carried out in the static domain, defining a dielectric constant, for the whole range of the pretransitional effect, reaching
Broadband dielectric spectroscopy studies enable insight also into dynamic processes. Regarding the frequency ‘window’ explored in presented studies, it can be related to ionic transport processes, the key representative of which is the DC electric conductivity.
Figure 5 shows its temperature changes under atmospheric pressure, and , on cooling from the liquid phase via to the crystalline solid phase and on heating from the solid phase, via , to liquid nitrobenzene. Regarding the temperature evolution of dynamic properties, such as the primary relaxation time (related to orientations), DC electric conductivity, or the coupled transport-related relaxation time, the generalized Arrhenius (super-Arrhenius, SA) description is generally expected [30]:
where is for the orientations-related primary (alpha) relaxation time, is for the conductivity (transport) related relaxation time, and denotes DC electric conductivity; stands for the temperature-related activation energy coupled to the given process, which indicates the SA dynamics. denotes the gas constant.
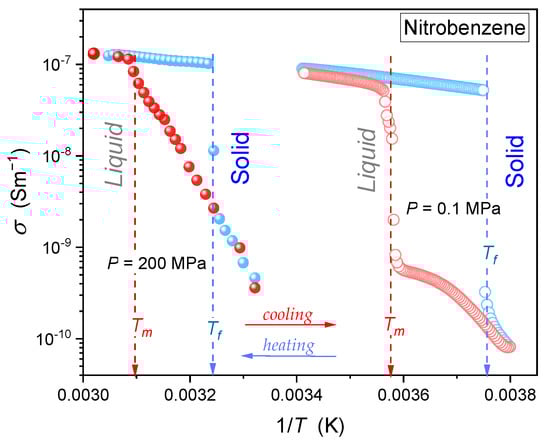
Figure 5.
The Arrhenius-scale plot of DC electric conductivity in nitrobenzene on cooling from the liquid phase, passing the freezing temperature (in light blue), and on heating from the solid phase, passing the melting temperature , under atmospheric pressure (, open circles), and (full circles).
It is notable that for ‘simple’ low molecular weight liquid, most often, the simple Arrhenius behavior with is expected. Nitrobenzene is commonly considered in the group of such materials [29]. For the temperature-dependent activation energy the Super-Arrhenius (SA) behavior takes place. Equation (11) indicates that for testing dynamic properties, using the so-called ‘Arrhenius scale’, revealing basic process features visually can be optimal. For instance, electric conductivity can be expressed as or vs. . In such a case, the linear behavior indicates the simple Arrhenius behavior, with the slope equal to . Bend curves in the Arrhenius plot also appear for more complex liquids, for which the activation energy changes on cooling [42,49]. However, the application of Equation (11) for fitting related experimental data is not possible because of the unknown form of . Consequently, replacement equations are used. The most popular is the Vogel–Fulcher–Tamman (VFT) relation, for which , where is the VFT singular temperature, , and is the fragility strength coefficient [30,56,57,58].
Figure 5 shows that in liquid nitrobenzene on cooling, DC electric conductivity seems to follow the linear behavior, which can be considered as the ‘proof’ for the basic Arrhenius pattern with . In the solid phase, a kind of ‘dynamic’ premelting effect seems to emerge when passing on cooling. For the heating from the solid phase, at , strong non-Arrhenius premelting changes in the temperature range covering almost 30 K emerge in solid nitrobenzene. Weaker but still notable pretransitional changes manifested as a distortion from the linear behavior are visible in liquid nitrobenzene, above .
For the distortions-sensitive insight into dynamics, the authors carried out distortions-sensitive and derivative-based analysis using the so-called steepness index [56,57]:
The above relation shows that the steepness index characterizes the relative changes of dynamic properties on cooling, for the Arrhenius scale representation. Notably, the steepness index is proportional to the apparent activation enthalpy or so-called apparent fragility for glass-forming systems [56,57]. Taking into account the link between the orientations-related primary relaxation time , the translations related to the modulus relaxation time , and DC electric conductivity σ via the Debye–Stokes–Einstein (DSE) law or the fractional DSE law [58], one can expect that such universal scaling obeys all mentioned dynamic properties:
where is the constant amplitude related to the given property and is the singular temperature for the dynamic process, which can be determined from the condition .
Linking Equations (12) and (13), the new ‘mixed’ equation for portraying temperature changes of relaxation time was derived in ref. [57]:
for DC electric conductivity, the following parallel can be expected:
Note that the above relations are not SA-type, in the sense described above, since they contain both the critical-like and ‘activated’ (i.e., exponential) terms. The results of the distortions-sensitive analysis based on Equation (13) for DC electric conductivity are presented in Figure 6. It shows that the simple Arrhenius, related to the horizontal (dashed) line, appears only in the liquid phase for high temperatures limit. The ‘visual Arrhenius’ behavior on cooling from the liquid phase is explicit non-Arrhenius, with the behavior validating the portrayal via Equation (15). It is notable that for the solid phase, the singular temperature in Equations (13) and (15). The pattern for dynamics detected on heating from the solid phase is more complex but also shows preferences for portrayals via Equations (13) and (15) for the premelting effect in the solid phase and the pretransitional effect in the liquid phase, i.e., for both sides of . For conductivity changes under , the derivative analysis of experimental data was not possible.
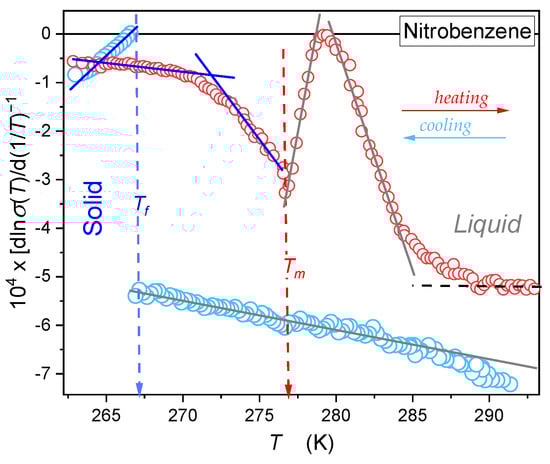
Figure 6.
Temperature changes of the steepness index reciprocals (Equations (12) and (13)). Linear changes are related to the ‘universal’ pattern given by Equation (15). Note that for the premelting behavior in the solid phase, the evolution is related to the singular behavior associated with .
The translational dynamics can be tested based on DC electric conductivity data or a dielectric modulus loss curve, as indicated in Section 2. It allows for the minimizing of the impact of emergent low-frequency relaxation processes. The maximum of dielectric loss curves is defined by the peak frequency, determining the relaxation time and its height: namely and . The latter can be linked to the energy associated with the relaxation process [49]. For the isothermal pressure-related dynamics, the Super-Barus relation, a pressure counterpart of the Super-Arrhenius equation, is generally considered [34,59,60]:
where is the apparent activation volume and .
For , one obtains the basic Barus behavior coupled to the linear changes for the plot or vs. . As in the case of the SA Equation (11), the SB Equation (16) cannot directly portray experimental data, and replacement dependencies have to be shown. The most popular is the pressure counterpart of the VFT equation (PVFT) introduced heuristically by Paluch, Rzoska et al. [61], in which , where is the extrapolated PVFT singular pressure. Notably, recent analysis has shown the limited adequacy of both VFT and PVFT relations, so they should only be considered effective tools for data portrayal [62].
The inset in Figure 7 shows changes in the modulus-related relaxation time on compressing from liquid nitrobenzene. The ‘visual inspection’ of can suggest the basic Barus dynamics ( in liquid nitrobenzene and definitively non-Barus for the solid nitrobenzene (see Equation (16). However, also for the pressure path, one can define the steepness index to carry out the distortions-sensitive analysis [59,60]:
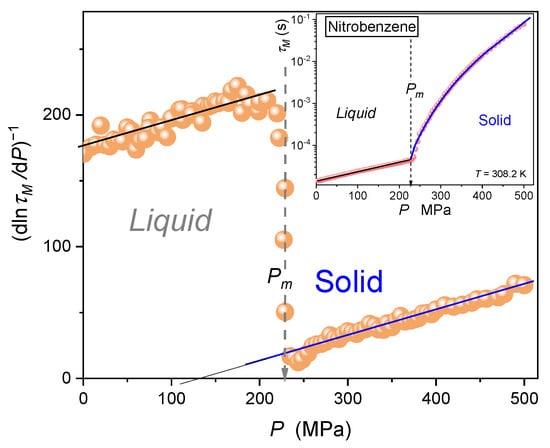
Figure 7.
The distortions-sensitive analysis of the modulus relaxation time focused on the universal portrayal via Equation (18), yielding basic parameters for the critical-like description via Equation (19): and (solid), and and (liquid). Note: the melting pressure . The related portrayal of experimental data, portrayed by Equation (19), are given in the inset.
In refs. [59,60], it was shown that can also show universal scaling changes, parallel to Equation (13), at least in glass-forming systems, namely:
In refs. [59,60], the pressure-related steepness index was noted as , and its link to the pressure-related fragility coefficient was indicated. Linking Equations (17) and (18), the new critical-like relation for portraying relaxation time in complex glassy-type systems was derived for the [59,60]:
where and is the singular pressure, which can be estimated from the condition .
The central part of Figure 7 presents the results of the distortions’ sensitive analysis of experimental data based on Equation (18). It validates the critical-like dynamics expressed by Equation (19) both in liquid and solid nitrobenzene. It is associated with almost the same value of the power exponent but essentially different distances between singular pressures and the tested pressures domains. For solid nitrobenzene, is located relatively close to the tested region. For the liquid phase, is well remote from the tested domain, so only the ‘tail’ of the critical-like behavior is detected, which seems to be a simple description of the type Barus in the inset in Figure 7.
Figure 8 presents pressure changes of the modulus loss curve height in the premelting region for solid nitrobenzene. Strong pretransitional changes towards negative values are visible, and are well portrayed by the critical-like equation:
with the exponent and the value of the singular pressure almost coincided with the ‘freezing pressure . Values of all parameters are given in the caption of Figure 8. Experimental limitations made reliable measurements on decompressing not possible.
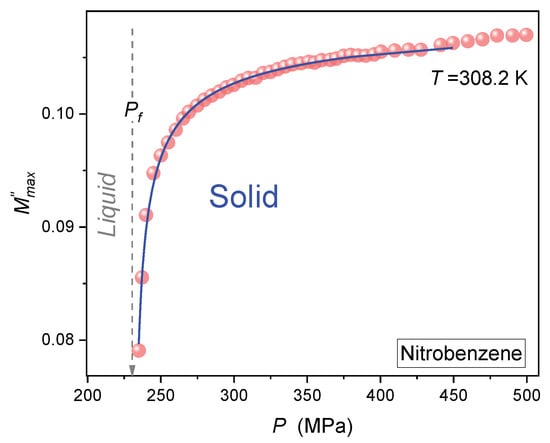
Figure 8.
Premelting changes of the modulus loss curve maximum for isothermal compressing. The curve is for the critical-like portrayal (Equation (20)) with the amplitude , singular temperature , the exponent , and for the constant term related to the behavior remote from .
4. Conclusions
One of the greatest successes of physics in the last 50 years was Critical Phenomena Physics, enabling a universalistic description of properties in the vicinity of continuous phase transitions, combining qualitatively different systems at the microscopic level [27]. The inspiration and validation for these studies were the universal precritical changes of various physical properties described by power relations regarding the distance from the critical point. The critical exponents, whose values depend only on such general features as the dimensions of space (D) and the order parameter (N), were of essential importance. Microscopically distinct systems showed similar behavior in critical points’ surroundings, with the same value of critical (power) exponents depending only on (D, N) values. If the space dimensionality exceeds the threshold values, the classic critical behavior has the same values of critical exponents for an arbitrary physical system. For systems with a single critical point (CP), such classic behavior appears for , and it is associated with the mean-field (MF) exponent for the order parameter, for susceptibility, and for heat capacity exponent () and (). The second type of the classic, mean-field behavior appears in the surrounding of the tricritical point (TCP). It is related to , , and . For the classic precritical behavior in the surroundings of CP or TCP, critical exponents are expressed via small integers or their ratios [27,28].
Such effects seemed absent for discontinuous phase transitions, especially for their canonic melting/freezing example [14,15,16,17,18,19,20,21,22]. There has been only evidence of slight premelting effects for the solid side of , although no such effects were detected [13,14].
This report shows the evidence for giant and long-range premelting effects for the dielectric constant in nitrobenzene, particularly under compression. They are coupled to critical-like portrayals, with the values of critical exponents indicating the classical, mean-field type description. Such behavior can be explained when linking the grain picture of the premelting effect and melting/freezing transition [14,15,16,17,18,19,20,21,22] with the Lipowsky model [37,38] regarding the criticality of liquid layers between two grains-related crystalline surfaces.
It suggests that the bulk melting/freezing discontinuous transition is matched with continuous, classical-type, continuous phase transition in quasi-liquid layers. For the latter, singular/critical temperatures are located in the immediate vicinity of the bulk melting temperature. One can expect that the critical-type rise of susceptibility and liquid layer width increase upon approaching /, resulting from the application of the Lipowsky model [37,38], can support the final fragmentation of grains associated with discontinuous melting.
Two years ago, Pocheć et al. [23] reported a strong non-linear dielectric effect (NDE) [63] for and the real part of dielectric permittivity in the premelting domain for higher-order alcohols, from nonanol to dodecanol. Both values increase ca. 10× between and . The phenomenon was commented on as the impact of a hypothetical plastic crystalline rotator phase emerging just below . The functional evolution of changes were not given in ref. [23]. The authors of this paper made such an attempt, based on the data from [23], and it was unsuccessful. This can be explained by the parasitic bias of relaxation phenomena, due to the relatively high measurement frequency. For nitrobenzene (see Section 2), it is significant even for . For NDE, the simple common description of the premelting changes in the homologous series from nonanol to dodecanol was shown [23]:
Note that the above relation contains the definition of nonlinear dielectric effect as the normalized difference of dielectric constants in the weak and strong electric fields [39,63]. For the authors of the given report, the appearance of as the singular critical-like temperature was surprising, although is explicitly linked to the strongly discontinuous melting transition. The peculiarity of such behavior can illustrate the case of weakly discontinuous phase transitions in liquid crystals [27,52,53,54,55], or when approaching the so-called pseudospinodal [64] behavior for mixtures of limited miscibility. The results of this report, supplemented by last year’s report on menthol [25] and thymol [26], explain this seemingly paradoxical coincidence.
The detection of giant premelting effects in this report, enabling their functional analysis, is directly related to the application of broadband dielectric spectroscopy (BDS) supported by high-pressure impact. For BDS, and also for NDE, the solid crystalline phase can introduce only a minor ‘background’ contribution to the total measured effect. The dominant contribution comes from the liquid phase, associated with layers between crystalline grains in the premelting domain. Hence, BDS and NDE can ‘extract’ the liquid-related effect, even though it constitutes only a minimal part of the sample in the premelting region. Studies using physical methods equally sensitive to the solid and liquid phase, by definition, have to yield only small and range-limited premelting effects, which is puzzling in functional analysis.
Nevertheless, the question of a possible molecular explanation of the reported above long-range critical-like premelting effects remains. To respond to this fundamental question, it is worth recalling the evidence of strong pretransitional critical-like increases for the electrooptic Kerr effect (EKE) and nonlinear dielectric effects in the liquid phase of menthol [26], thymol [27], and earlier nitrobenzene [65,66] on cooling towards the melting/freezing temperature. Formally, such effects should be absent, but constraints introduced by the strong electric field, inherently associated with NDE and EKE studies, leads to the emergence of uniaxial molecular filaments and the pretransitional behavior parallel to the one observed in the isotropic liquid phase on nematic liquid crystals [67,68]. Such strong electric field-induced quasi-nematic behavior emerges already under relatively weak intensities, , which is supported by the strong tendency to intermolecular coupling [41,66]. For nitrobenzene, such behavior is associated with the fact that two molecules are in the uniaxial, strong electric field-related arrangement formally resembling classic nematogenic liquid crystalline compounds, the main part of which consists of two phenyl rings [30].
For the solid side of the melting temperature, the geometrical/topological constraints emerge due to nanoscale layers between solid crystalline grains. In the first liquid-like layer, a part of the nitrobenzene molecules has to be bonded to the nitrobenzene crystal walls. These molecules are bonded to subsequent molecules from the second layer. The latter is located at some angle, related to the natural coupling tendency between rings in nitrobenzene molecules, due to rising arrangement freedom [69,70]. Consequently, one can consider the appearance of bent or banana-shaped quasi-molecules, orientationally ordered. When taking into account the two walls between grains, associated with separating fluid layers, one can consider the emergence of topological constraints inducing a quasi–Smectic B (SmB) structure, for which a hexatic sixfold neighborhood is the generic feature [71,72,73,74]. Such a hypothesis can be supported by qualitative dielectric studies focused on relaxation processes confronted with Monte Carlo simulations for nitrobenzene in the silica-based pores of controlled pore glass [75]. It revealed that the melting/freezing processes depend on the ratio between the molecular diameters d and average pore width l. For freezing into a single crystalline structure was obtained. For part of the confined fluid freezes into a frustrated crystal structure, with the rest forming an amorphous region without even partial crystallization. For lesser ratios, even partial crystallization did not occur. The deeper potential in layers directly adjacent to the pore wall led to the conclusion of hexatic phase appearance [75].
It recalls the orientationally ordered hexatic phase, which can appear in topologically constrained quasi-liquid layers, i.e., near-two dimensional systems, by Kosterlitz and Thouless et al. [76,77]. The defect-mediated topological defects lead to the appearance of the critical point in two-dimensional (2D-, XY-type), which is formally forbidden in perfect systems. It can be related to a liquid layer on a crystal surface where the unbinding of topological defects leads to the symmetry breaking in two steps, at two distinct temperatures. The dissociation of dislocation pairs first melts the crystal into a still orientational ordered (hexatic) phase, and in the second step, the dissociation of free dislocations causes the system to become an isotropic fluid. The behavior changes to a first-order transition when the pore width is increased to allow two adsorbed layers. This behavior change is explained by the interaction between vortices in different adsorbed layers. [76,77]. Notably, in SmB mesophase-related liquid crystalline systems where the hexatic arrangement appears in three dimensions, the tricritical point descriptions, associated with ‘classic’ critical exponents appear. For instance, for temperature-related dielectric constant changes, [72,73] the same relation as Equation (9) in the given report is predicted.
In summary, dielectric methods enable selective insight into liquid layers within the premelting domain. Their applications enable selective insight into the properties of interfacial quasi-liquid layers between crystalline grains, revealing long-range and critical-like behavior. The premelting effect strongly increases under pressure. In the authors’ opinion, isotropic compression/squeezing can lead to the ‘crushing’ of crystalline grains and thus increase the amount of liquid in the layers between the grains. The results and discussion presented in the given report indicate new research tools for testing the puzzling melting/freezing phenomenon. It may indicate the melting/freezing phenomenon explanation via the synergic link of continuous and discontinuous phase transitions, influenced by topological micro-constrains.
Author Contributions
J.K. is responsible for measurements, analysis, and report preparation; A.D.-R. is responsible for conceptualization, methodology, analysis, validation, report preparation, and supervision; S.J.R. is responsible for conceptualization, methodology, analysis, report preparation, and resources. All authors have read and agreed to the published version of the manuscript.
Funding
The research was supported by National Center for Science (Narodowe Centrum Nauki), Poland: grant ref. 2022/45/B/ST5/04005; project headed by Sylwester J. Rzoska.
Institutional Review Board Statement
Not applicable for studies not involving humans or animals.
Informed Consent Statement
Not applicable.
Data Availability Statement
Experimental data are available from the authors on reasonable requests.
Acknowledgments
The authors are grateful to X-PressMatter Lab of the Institute of High Pressure Physics Polish Academy of Sciences: https://xpressmatter.com/ (accessed on 30 January 2023).
Conflicts of Interest
The authors declare no conflict of interest.
References
- Boeker, E.; van Grondelle, R. Environmental Physics. Sustainable Energy and Climate Change; Wiley: New York, NY, USA, 2011; ISBN 978-0470666760. [Google Scholar]
- Doyle, A. The Great Melt: Accounts from the Frontline of Climate Change; Flint: Gloucestershire, UK, 2021; ISBN 978-07509-99137. [Google Scholar]
- Arkenbout, G.F. Melt Crystallization Technology; CRC Press: Boca Raton, FL, USA, 1995; ISBN 978-1566761819. [Google Scholar]
- Evans, J.; Evans, J.A. Frozen Food Science and Technology; Wiley-Blackwell: Hoboken, NJ, USA, 2009; ISBN 9781405154789. [Google Scholar]
- European Commission. 2022 State of the Energy Union Report Highlights Challenges. Directorate-General for Energy, Brussels, Belgium. Available online: https://commission.europa.eu/news/2022-state-energy-union-report-highlights-challenges-2022-10-18_en (accessed on 18 October 2022).
- Lloveras, P.; Aznar, A.; Barrio, M.; Negrier, P.; Popescu, C.; Planes, A.; Mañosa, L.; Stern-Taulats, E.; Avramenko, A.; Mathur, N.D.; et al. Colossal barocaloric effects near room temperature in plastic crystals of neopentylglycol. Nat. Commun. 2019, 10, 1803. [Google Scholar] [CrossRef] [PubMed]
- Cirillo, L.; Greco, A.; Masselli, C. Cooling through barocaloric effect: A review of the state of the art up to 2022. Therm. Sci. Engn. Prog. 2022, 33, 101380. [Google Scholar] [CrossRef]
- Garcia-Ben, J.; Delgado-Ferreiro, I.; Salgado-Beceiro, J.; Bermudez-Garcia, J.M. Simple and low-cost footstep energy-recover barocaloric heating and cooling device. Materials 2021, 14, 5947. [Google Scholar] [CrossRef]
- Lindemann, F.A. Über die berechning molekularer eigenfrequenzen. Phys. Z. 1910, 11, 609–615. [Google Scholar]
- Frenkel, J. Kinetic Theory of Liquids; Oxford University Press: Oxford, UK, 1946. [Google Scholar]
- Dash, J.G. History of the search for continuous melting. Rev. Mod. Phys. 1999, 71, 1737–1743. [Google Scholar] [CrossRef]
- Honda, K. Crystal instability and premelting phenomena. Prog. Theor. Phys. 1974, 52, 385–395. [Google Scholar] [CrossRef]
- Skripov, V.P.; Faizulin, M.Z. Crystal-Liquid-Gas Phase Transitions and Thermodynamic Similarity; Wiley-VCH: Berlin, Germany, 2006; ISBN 978-3-527-40576-3. [Google Scholar]
- Mei, Q.S.; Lu, K. Melting and superheating of crystalline solids: From bulk to nanocrystals. Prog. Mater. Sci. 2007, 5, 1175–1262. [Google Scholar] [CrossRef]
- Riegler, H.; Köhler, R. How pre-melting on surrounding interfaces broadens solid–liquid phase transitions. Nat. Phys. 2007, 3, 890–894. [Google Scholar] [CrossRef]
- Lawson, A.C. Physics of the Lindemann rule. Phil. Mag. 2009, 89, 1757–1770. [Google Scholar] [CrossRef]
- Yang, Y.; Asta, M.; Laird, B.B. Solid-liquid interfacial premelting. Phys. Rev. Lett. 2013, 110, 096102. [Google Scholar] [CrossRef]
- Samanta, A.; Tuckerman, M.E.; Yu, T.-Q.; Ee, W. Microscopic mechanisms of equilibrium melting of a solid. Science 2014, 345, 729–732. [Google Scholar] [CrossRef] [PubMed]
- Toledano, Ó.; Pancorbo, M.; Alvarellos, J.E.; Gálvez, Ó. Melting in two-dimensional systems: Characterizing continuous and first-order transition. Phys. Rev. B 2021, 103, 094107. [Google Scholar] [CrossRef]
- Pogatscher, S.; Leutenegger, D.; Schawe, J.E.K.; Uggowitzer, P.J.; Löffler, J.F. Solid—Solid phase transitions via melting in metals. Nat. Commun. 2016, 7, 11113. [Google Scholar] [CrossRef] [PubMed]
- Kryuchkov, N.P.; Dmitryuk, N.A.; Li, W.; Ovcharov, P.V.; Han, Y.; Sapelkin, A.V.; Yurchenko, S.O. Mean-field model of melting in superheated crystals based on a single experimentally measurable order parameter. Sci. Rep. 2021, 11, 17963. [Google Scholar] [CrossRef] [PubMed]
- Tian, X.-l.; Zhao, Y.-h.; Peng, D.-w.; Guo, Q.-w.; Guo, Z.; Hou, H. Phase-field crystal simulation of evolution of liquid pools in grain boundary pre-melting regions. Trans. Nonferrous Met. Soc. China 2021, 31, 1175–1188. [Google Scholar] [CrossRef]
- Pocheć, M.; Niu, H.; Ren, L.; Bai, S.; Orzechowski, K. Premelting phenomena in n-alcohols from nonanol to dodecanol. J. Phys. Chem. C 2020, 124, 21013–21017. [Google Scholar] [CrossRef]
- Pocheć, M.; Orzechowski, K.; Rutkowski, K. Indicators of premelting in 1-decanol and 1-nonanol studied by FTIR spectroscopy. Surf. Interfaces 2022, 28, 101676. [Google Scholar] [CrossRef]
- Drozd-Rzoska, A.; Rzoska, S.J.; Szpakiewicz-Szatan, A.; Łoś, J.; Orzechowski, K. Pretransitional and premelting effects in menthol. Chem. Phys. Lett. 2022, 793, 139461. [Google Scholar] [CrossRef]
- Szpakiewicz-Szatan, A.; Rzoska, S.J.; Drozd-Rzoska, A.; Kalabiński, J. Pretransitional behavior of electrooptic Kerr effect in liquid thymol. Eur. Phys. J. E 2022, 45, 71. [Google Scholar] [CrossRef]
- Anisimov, M.A. Critical Phenomena in Liquids and Liquid Crystals; Gordon and Breach: Reading, UK, 1991; ISBN 9782881248061. [Google Scholar]
- Honig, J.; Spalek, J. A Primer to The Theory of Critical Phenomena; Elsevier: Amsterdam, The Netherlands, 2018; ISBN 978-0128046852. [Google Scholar]
- Chełkowski, A. Dielectric Physics; PWN-Elsevier: Warsaw, Poland, 1990; ISBN 978-0444997661. [Google Scholar]
- Rzoska, S.J.; Mazur, V.; Drozd-Rzoska, A. (Eds.) Metastable Systems under Pressure; Springer: Berlin, Germany, 2010; ISBN 978-90-481-3408-3. [Google Scholar]
- Drozd-Rzoska, A.; Rzoska, S.J.; Imre, A.R. Liquid-liquid equilibria in nitrobenzene—Hexane mixture under negative pressure. Phys. Chem. Chem. Phys. 2004, 6, 2291–2294. [Google Scholar] [CrossRef]
- Drozd-Rzoska, A. Pressure dependence of the glass temperature in supercooled liquids. Phys. Rev. E 2005, 72, 041505. [Google Scholar] [CrossRef] [PubMed]
- Drozd-Rzoska, A.; Rzoska, S.J.; Imre, A.R. On the pressure evolution of the melting temperature and the glass transition temperature. J. Non-Cryst. Solids 2007, 353, 3915–3923. [Google Scholar] [CrossRef]
- Rzoska, S.J. New Challenges for the Pressure Evolution of the Glass Temperature. Front. Mat. 2017, 4, 33. [Google Scholar] [CrossRef]
- Porowski, S.; Sadovyi, B.; Gierlotka, S.; Rzoska, S.J.; Grzegory, I.; Petrusha, I.; Turkevich, V.; Stratiichuk, D. The challenge of high pressure and high temperature decomposition and melting of gallium nitride. J. Phys. Chem. Solids 2015, 85, 138–143. [Google Scholar] [CrossRef]
- Katz, R.F.; Rees Jones, D.W.; Rudge, J.F.; Keller, T. Physics of melt extraction from the mantle: Speed and style. Ann. Rev. Earth Planet. Sci. 2022, 50, 507–540. [Google Scholar] [CrossRef]
- Lipowsky, R. Critical surface phenomena at first-order bulk transitions. Phys. Rev. Lett. 1982, 49, 1575–1578. [Google Scholar] [CrossRef]
- Lipowsky, R. Surface critical phenomena at first-order phase transitions. Ferroelectrics 1987, 73, 69–81. [Google Scholar] [CrossRef]
- Rzoska, S.J. Kerr effect and nonlinear dielectric effect on approaching the critical consolute point. Phys. Rev. E 1993, 48, 113–1143. [Google Scholar] [CrossRef]
- Drozd-Rzoska, A.; Rzoska, S.J.; Martinez-Garcia, J.C. Nonlinear dielectric effect in supercritical diethyl ether. J. Chem. Phys. 2014, 141, 094907. [Google Scholar] [CrossRef]
- Rzoska, S.J.; Drozd-Rzoska, A.; Starzonek, S. Nonlinear dielectric effect in critical liquids. In Nonlinear Dielectric Spectroscopy: Springer Series Advanced Dielectrics; Richert, R., Ed.; Springer: Berlin, Germany, 2018; pp. 187–217. ISBN 978-3-319-77574-6. [Google Scholar]
- Łoś, J.; Drozd-Rzoska, A.; Rzoska, S.J.; Czupryński, K. The impact of ionic contribution to dielectric permittivity in 11CB liquid crystal and its colloids with BaTiO3 nanoparticles. Eur. Phys. J. E 2022, 45, 74. [Google Scholar] [CrossRef]
- Drozd-Rzoska, A.; Rzoska, S.J.; Kalabiński, J. The impact of pressure on low molecular weight near-critical mixtures of limited miscibility. ACS Omega 2020, 5, 20141–20152. [Google Scholar] [CrossRef] [PubMed]
- Malik, P.; Rzoska, S.J.; Drozd-Rzoska, A.; Jadżyn, J. Dielectric permittivity and electric conductivity studies in the one and in the two-phase region of nitrobenzene—Dodecane critical point. J. Chem. Phys. 2003, 118, 9357–9363. [Google Scholar] [CrossRef]
- Rzoska, S.J.; Urbanowicz, P.; Drozd-Rzoska, A.; Paluch, M.; Habdas, P. Pressure behaviour of dielectric permittivity on approaching the critical consolute point. Europhys. Lett. 1999, 45, 334–340. [Google Scholar] [CrossRef]
- Drozd-Rzoska, A.; Rzoska, S.J. The super- and sub- critical effects for dielectric constant in diethyl ether. J. Chem. Phys. 2016, 144, 24506. [Google Scholar] [CrossRef] [PubMed]
- Rzoska, S.J.; Paluch, M.; Pawlus, S.; Drozd-Rzoska, A.; Jadzyn, J.; Czupryński, K.; Dąbrowski, R. Complex dielectric relaxation in supercooling and superpressing liquid-crystalline chiral isopentycyanobiphenyl. Phys. Rev. E 2003, 68, 031705. [Google Scholar] [CrossRef]
- von Hippel, A. Dielectrics and Waves; Artech House: New York, NY, USA, 1954; ISBN 978-1580531221. [Google Scholar]
- Łoś, J.; Drozd-Rzoska, A.; Rzoska, S.J.; Starzonek, S.; Czupryński, K. Fluctuations-driven dielectric properties of liquid crystalline octyloxycyanobiphenyl and its nanocolloids. Soft Matter 2022, 18, 4502–4512. [Google Scholar] [CrossRef]
- Fisher, H.J. Faraday’s Experimental Researches in Electricity: Guide to a First Reading; Green Lion Press: London, UK, 2001; ISBN 978-1888009149. [Google Scholar]
- Pradhan, L.K.; Kar, M. Relaxor Ferroelectric Oxides: Concepts to Applications; Intech: Rijeka, Croatia, 2021. [Google Scholar] [CrossRef]
- Rzoska, S.J.; Paluch, M.; Drozd-Rzoska, A.; Ziolo, J.; Janik, P.; Czupryński, K. Glassy and fluidlike behavior of the isotropic phase of n-cyanobiphenyls in broad-band dielectric relaxation studies. Europ. Phys. J. E 2004, 7, 387–392. [Google Scholar] [CrossRef] [PubMed]
- Drozd-Rzoska, A.; Rzoska, S.J.; Pawlus, S.; Ziolo, J. Complex dynamics of supercooling n-butylcyanobiphenyl (4CB). Phys. Rev. E 2005, 72, 031501. [Google Scholar] [CrossRef]
- Rzoska, S.J.; Starzonek, S.; Drozd-Rzoska, A.; Czupryński, K.; Chmiel, K.; Gaura, G.; Michulec, A.; Szczypek, B.; Walas, W. The impact of BaTiO3 nanonoparticles on pretransitional effects in liquid crystalline dodecylcyanobiphenyl. Phys. Rev. E 2016, 93, 534. [Google Scholar] [CrossRef] [PubMed]
- Starzonek, S.; Rzoska, S.J.; Drozd-Rzoska, A.; Czupryński, K.; Kralj, S. Impact of ferroelectric/superparaelectric nanoparticles on phase transitions and dynamics in nematic liquid crystal. Phys. Rev. E. 2017, 96, 022705. [Google Scholar] [CrossRef]
- Martinez-Garcia, J.; Rzoska, S.; Drozd-Rzoska, A.; Martinez-Garcia, J. A universal description of ultraslow glass dynamics. Nat. Commun. 2013, 4, 1823. [Google Scholar] [CrossRef]
- Drozd-Rzoska, A. Universal behavior of the apparent fragility in ultraslow glass forming systems. Sci. Rep. 2019, 9, 6816. [Google Scholar] [CrossRef] [PubMed]
- Starzonek, S.; Rzoska, S.J.; Drozd-Rzoska, A.; Pawlus, S.; Martinez-Garcia, J.-C.; Kistersky, L. Fractional Debye–Stokes–Einstein behaviour in an ultraviscous nanocolloid: Glycerol and silver nanoparticles. Soft Matter 2015, 11, 5554–5562. [Google Scholar] [CrossRef] [PubMed]
- Drozd-Rzoska, A. Pressure-related universal previtreous behavior of the structural relaxation time and apparent fragility. Front. Mater. 2019, 6, 103. [Google Scholar] [CrossRef]
- Drozd-Rzoska, A. Activation volume in superpressed glass-formers. Sci. Rep. 2019, 9, 13787. [Google Scholar] [CrossRef]
- Paluch, M.; Rzoska, S.J.; Zioło, J. On the pressure behaviour of dielectric relaxation times in supercooled, glassforming liquids. J. Phys. Condens. Matter 1998, 10, 4131–4138. [Google Scholar] [CrossRef]
- Drozd-Rzoska, A.; Rzoska, S.J.; Starzonek, S. New scaling paradigm for dynamics in glass-forming systems. Prog. Mater. Sci. 2023, 134, 101074. [Google Scholar] [CrossRef]
- Dual field nonlinear dielectric spectroscopy in a glass forming EPON 828 epoxy resin. J. Phys. Condens. Matter 2011, 24, 035101. [CrossRef]
- Chrapeć, J.; Rzoska, S.J.; Zioło, J. Pseudospinodal curve for binary solutions determined from the nonlinear dielectric effect. Chem. Phys. 1987, 111, 155–160. [Google Scholar] [CrossRef]
- Drozd-Rzoska, A.; Rzoska, S.J.; Zioło, J. Anomalous temperature behavior of nonlinear dielectric effect in supercooled nitrobenzene. Phys. Rev. E 2008, 77, 041501. [Google Scholar] [CrossRef]
- Drozd-Rzoska, A.; Rzoska, S.J. Pretransitional behavior of nonlinear dielectric effect for the liquid—Solid transition in nitrobenzene. Phys. Rev. E 2016, 93, 062131. [Google Scholar] [CrossRef]
- Drozd-Rzoska, A.; Rzoska, S.J.; Zioło, J. Mean-field behaviour of the low-frequency nonlinear dielectric effect in isotropic phase of nematogenic and smectogenic n-cyanobiphenyls. Liq. Cryst. 1996, 21, 273–277. [Google Scholar] [CrossRef]
- Drozd-Rzoska, A.; Rzoska, S.J.; Zioło, J. High pressure studies of the low-frequency nonlinear dielectric effect in the isotropic phase of octyl- and dodecyl- cyanobiphenyls. Phys. Rev. E 1997, 55, 2888–2891. [Google Scholar] [CrossRef]
- Toshiyuki, S.; Sakai, Y.; Watanabe, J. Nitrobenzene anti-parallel dimer formation in non-polar solvents. AIP Adv. 2014, 4, 067130. [Google Scholar] [CrossRef]
- Shelton, D.P. Orientation correlation and local field in liquid nitrobenzene. J. Chem. Phys. 2016, 144, 234506. [Google Scholar] [CrossRef] [PubMed]
- Pindak, R.; Moncton, D.E.; Davey, S.C.; Goodby, J.W. X-Ray-Observation of a stacked hexatic liquid—Crystal B phase. Phys. Rev. Lett. 1981, 46, 1135–1138. [Google Scholar] [CrossRef]
- Yurtseven, H.; Killit, E. Temperature dependence of the dielectric constant calculated using a mean field model close to the smectic a—Isotropic liquid transition, in Ferroelectric. In Characterization and Modelling; Lallart, M., Ed.; Intech: Rijeka, Croatia, 2011; pp. 338–448. [Google Scholar] [CrossRef]
- Prasad, S.K.; Nair, G.G.; Kant, R. Dielectric investigations of the dynamics of the hexatic-hexatic transition in a chiral liquid crystal. Phys. Rev. E 1998, 57, 1789–1792. [Google Scholar] [CrossRef]
- Zaluzhnyy, I.A.; Kurta, R.P.; Mukharamova, N.; Kim, Y.Y.; Khubbutdinov, R.M.; Dzhigaev, D.; Lebedev, V.V.; Pikina, E.S.; Kats, E.I.; Clark, N.A.; et al. Evidence of a first-order smectic-hexatic transition and its proximity to a tricritical point in smectic films. Phys. Rev. E 2018, 98, 052703. [Google Scholar] [CrossRef]
- Sliwinska-Bartkowiak, M.; Dudziak, G.; Sikorski, R.; Gras, R.; Radhakrishnan, R.; Gubbins, K.E. Melting/freezing behavior of a fluid confined in porous glasses and MCM-41: Dielectric spectroscopy and molecular simulation. J. Chem. Phys. 2001, 114, 950–962. [Google Scholar] [CrossRef]
- Kosterlitz, J.M. Kosterlitz–Thouless physics: A review of key issues. Rep. Prog. Phys. 2016, 79, 026001. [Google Scholar] [CrossRef]
- Deutschländer, S.; Dillmann, P.; Maret, G.; Keim, P. Kibble−Zurek mechanism in colloidal monolayers. Proc. Natl. Acad. Sci. USA 2015, 112, 6925–6930. [Google Scholar] [CrossRef] [PubMed]
Disclaimer/Publisher’s Note: The statements, opinions and data contained in all publications are solely those of the individual author(s) and contributor(s) and not of MDPI and/or the editor(s). MDPI and/or the editor(s) disclaim responsibility for any injury to people or property resulting from any ideas, methods, instructions or products referred to in the content. |
© 2023 by the authors. Licensee MDPI, Basel, Switzerland. This article is an open access article distributed under the terms and conditions of the Creative Commons Attribution (CC BY) license (https://creativecommons.org/licenses/by/4.0/).