Article

Nanostructure, Mechanical Properties, and Corrosion Resistance of Super Duplex Stainless Steel 2507 Aged at 500 °C

1
School of Materials, Sun Yat-sen University, Shenzhen 518107, China
2
Southern Marine Science and Engineering Guangdong Laboratory, Zhuhai 519000, China
3
Spallation Neutron Source Science Center, Dongguan 523803, China
4
Institute of High Energy Physics, China Academy of Sciences, Beijing 100191, China
5
School of Materials Science and Engineering, Sun Yat-sen University, Guangzhou 510275, China
*
Author to whom correspondence should be addressed.
Crystals 2023, 13(2), 243; https://doi.org/10.3390/cryst13020243
Submission received: 27 December 2022 / Revised: 18 January 2023 / Accepted: 23 January 2023 / Published: 31 January 2023
(This article belongs to the Section Crystalline Metals and Alloys)

Abstract

:
In order to investigate the effect of phase separation (PS) on the super duplex stainless steel SAF 2507, the evolution of the nanostructure, mechanical properties, and corrosion resistance of the alloy was studied after aging at 500 °C for 1, 10, 100, and 1000 h. The nanostructure of PS was quantitatively characterized by small-angle neutron scattering. The hardness, impact toughness, and pitting corrosion resistance were measured for different conditions. The results show that the early stage of PS had a more significant impact on the nanostructure and properties of SAF 2507. The fracture behavior of the alloy was likely determined by the mechanical properties of ferrite for aged conditions. The pitting corrosion resistance of SAF 2507 aged at 500 °C was closely related to the Cr depletion caused by PS, and the resistance became weaker with the progression of PS. The evolution of the passivation region with aging time correlated well with that of mechanical properties and characteristic parameters of PS, indicating that it is possible to develop a new nondestructive electrochemical method to quantify the evolution of PS in SAF 2507.

1. Introduction

Duplex stainless steels (DSSs) consist of almost the same volume fraction of ferrite (bcc) and austenite (fcc). Such a microstructure leads to an attractive combination of mechanical properties and corrosion resistance, e.g., a high resistance to stress-corrosion cracking and pitting [1,2]. DSSs also have better localized corrosion resistance than 316 L and 317 L austenitic stainless steels [3]. Moreover, the lower contents of Ni and Mo in DSSs than in austenitic stainless steels, in addition to their high yield stress, allow for higher cost efficiency and lower weight. Therefore, DSSs are of great engineering importance and have wide applications in, e.g., nuclear power plants and chemical pressure vessels [4,5].
However, the toughness and corrosion resistance of DSSs deteriorate dramatically with service time at 280–550 °C, so-called “475 °C embrittlement” [6]. This is caused by the formation of α′ (Cr-rich) and α (Fe-rich) nanophases due to phase separation (PS) in the ferrite [6]. The service reliability of DSSs is reduced when the alloys are used at the aforementioned temperatures. PS occurs within the miscibility gap in the phase diagrams of Fe–Cr-based alloys, where two different mechanisms are included, namely, nucleation and growth (NG) and spinodal decomposition (SD). The mechanisms are determined by the chemical composition of the alloys and temperature.
The effect of PS on the mechanical and corrosion properties of DSSs has been reported. Rovere et al. [3] studied the influence of low-temperature (400 °C) aging up to 7000 h on the corrosion and mechanical properties of DSS 2205. They found that the precipitation of α′ and α phases promotes the hardening of ferrite and the occurrence site of selective corrosion changes from austenite to ferrite as aging time prolongs. Yi and Shoji [7] investigated the influence of thermal aging on corrosion resistance of different phases in cast DSSs. They concluded that thermal aging mainly impacts ferrite. Chen et al. [8] found that thermal aging severely reduces the pitting corrosion resistance of Fe20Cr9Ni, and that the compositional fluctuation of Cr is not the main cause of the changes in corrosion behavior. Lacoviello et al. [9] argued that a well-developed spinodal structure and coarse G-phase precipitates mainly account for the larger susceptibility to the localized corrosion in DSSs with high ferrite contents. Park and Kwon [10] found that the corrosion and mechanical properties of the tungsten-containing DSSs are degraded due to the Cr depletion around α′ caused by PS. Sliva et al. [11] studied the thermal aging behavior of lean duplex stainless steel (LDSS) 2101 and DSS 2205. They suggested that around 98% and 83% of the ferrite hardening after thermal aging can be attributed to SD for the alloys, and the deterioration of the pitting corrosion resistance is caused by the Cr depletion promoted by PS. However, few reports exist on the effect of long-term aging on the corrosion resistance of the super duplex stainless steel SAF 2507. In addition, the relationship between the evolution of corrosion resistance and mechanical properties and the evolution of the nanostructure of PS in SAF 2507 has not been completely clarified. Furthermore, it is interesting to investigate whether there is a correlation between the variations of corrosion resistance and mechanical properties due to PS.
Therefore, the objective of this study was to investigate the influence of aging at 500 °C up to 1000 h on the corrosion and mechanical properties of SAF 2507. The degree of PS was quantitatively characterized by small-angle neutron scattering. The electrochemical parameters and mechanical properties were also evaluated. The relationship of the extent of PS with the electrochemical parameters and the mechanical properties is discussed.

2. Materials and Methods

2.1. Materials

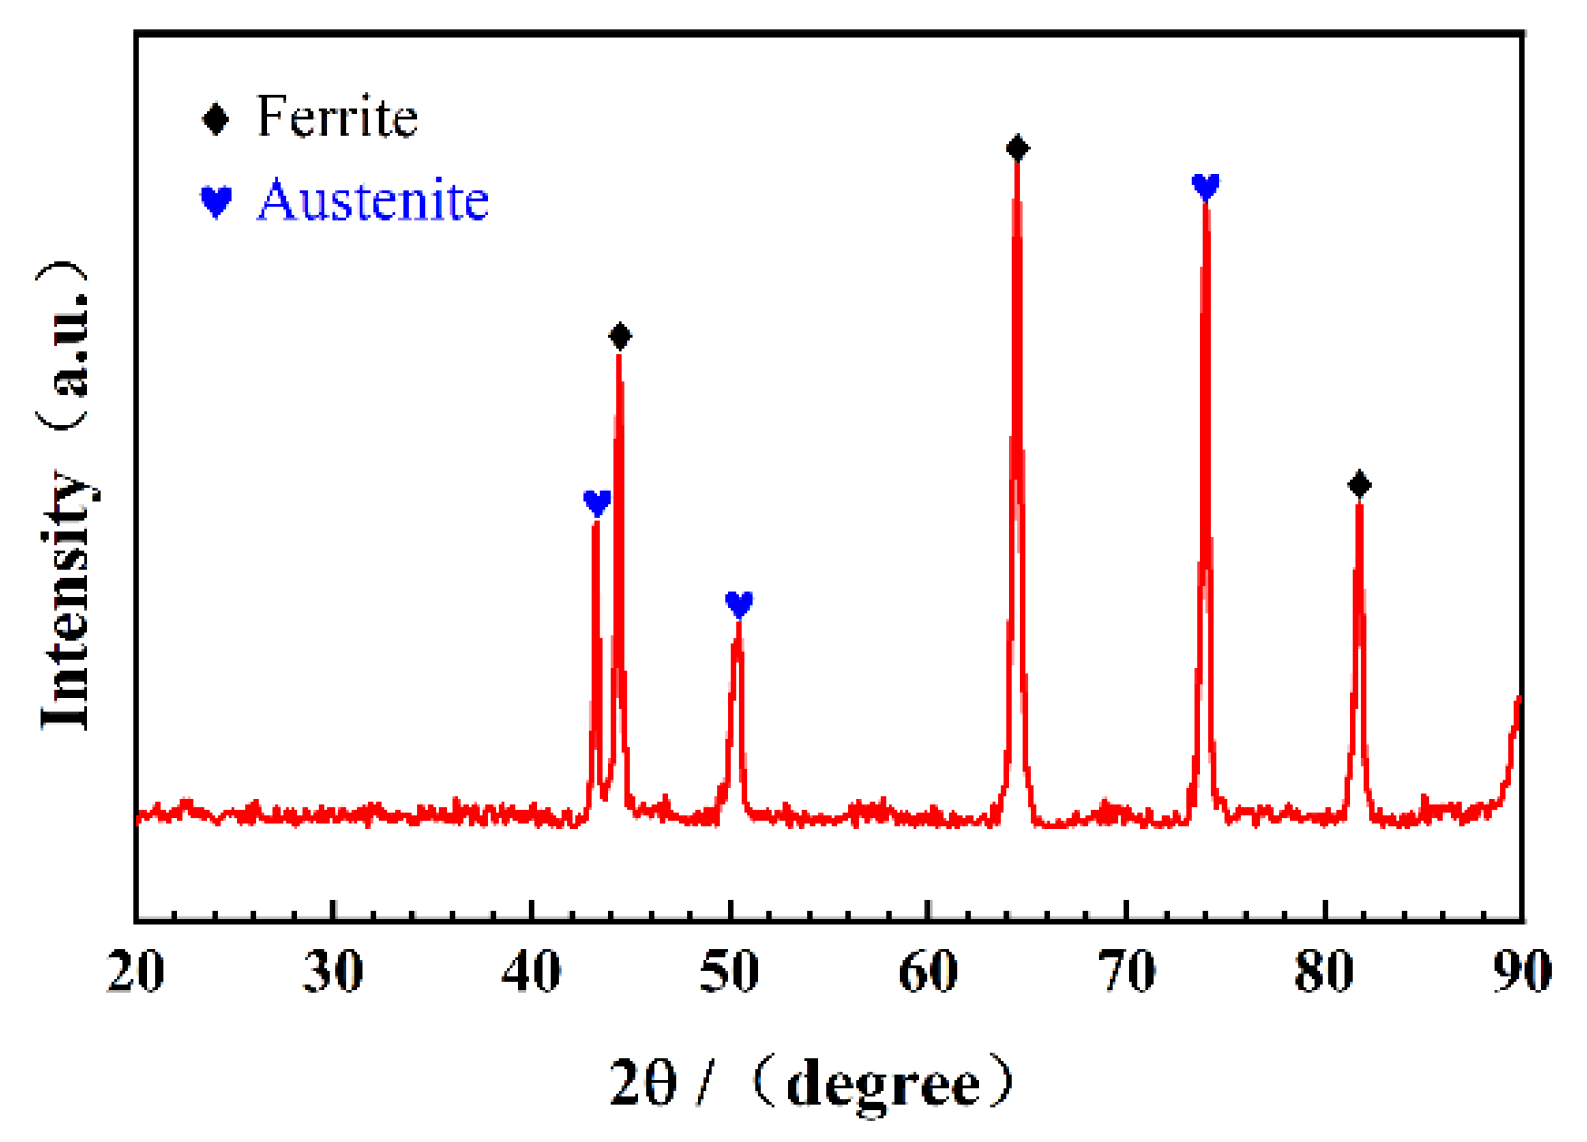
The SAF 2507 used in this study was delivered as 16 mm thick plates from Taiyuan Iron & Steel Co., Ltd. (TISCO, Taiyuan, China). Its chemical composition is listed in Table 1. Four specimens with areas of 60 mm × 60 mm were cut from the original plates and aged at 500 °C for up to 1000 h. The reason for choosing this relatively high temperature was to accelerate the phase separation (PS) process of the alloy, and few studies on PS in SAF 2507 have been conducted at this temperature. The optical micrographs of the different cross-sections of the as-received alloy are shown in Figure 1a. The microstructure was composed of island-like austenite in light gray and ferrite in dark gray. The volume fraction of the ferrite is represented by its area fraction in the micrographs and was evaluated using ImageJ software (version 2.1.0), which was around 46%. In order to confirm whether other brittle phases were generated after the long-term aging, X-ray diffraction (XRD) tests were conducted for the specimen aged for 1000 h using an Empyrean X-ray diffractometer (Almelo, The Netherlands) with a continuous scanning mode, a scanning range of 20°–90°, and a scanning speed of 10° per minute. As shown in Figure 2, no characteristic peaks of other brittle phases, e.g., χ and σ phases, are shown in the XRD data. Additionally, the small-angle neutron scattering (SANS) data do not show indications of nanoprecipitates other than the nanostructure of PS (see the Section 3.4). These results indicate that embrittlement of the alloy can be attributed to PS.

2.2. Mechanical Testing

The Charpy-V impact toughness testing was conducted at room temperature. Half-size Charpy-V specimens with dimensions of 55 × 10 × 5 mm3 were used [2]. Figure 1b shows how the specimens were cut from the plates. The rolling direction, normal direction, and transverse direction are represented by L, S, and T, respectively. The V-type notch was milled in the S–L plane along the S-direction, and the long side of the specimen was aligned with the L-direction. Three tests were conducted for each condition.
Macro-hardness tests were performed on a Veiyee HV-30AT (Laizhou, China) hardness testing machine, and micro-hardness tests were performed on a Mitutoyo HM-101 micro-hardness testing machine (Tokyo, Japan). The loads used for macro-hardness and micro-hardness tests were 5 kg (HV5) and 50 g (HV0.05), respectively. Ten indentations were collected for each condition, and all the hardness tests were measured on the L–T plane. Before hardness tests, the specimens were polished using the 0.05 μm colloidal silica solution to avoid the influence of surface roughness.

2.3. Small-Angle Neutron Scattering (SANS) Measurements

2.3.1. Experimental Details

SANS measurements were conducted at room temperature on the SANS diffractometer at the China Spallation Neutron Source (CSNS), Dongguan, China. Before the experiments, oxide layers on the specimens’ surface were removed by grinding and polishing using sandpaper up to 4000 grit. The final dimensions of the specimens were 10 × 10 × 0.8 mm3. The scattering and transmission data were collected for 100 min and 8 min per specimen, respectively.
The SANS diffractometer at CSNS is a time-of-flight instrument. It simultaneously measures the momentum-transfer vector Q in the range of 0.005 ≤ Q ≤ 0.7 Å−1, using an incident neutron beam with a wavelength range of 1–10 Å. The diameter of the incident neutron spot size is 6.5 mm. In order to obtain an instrument independent macroscopic scattering cross-section, Q / Ω , correction with the efficiency and spatial linearity of the detectors, sample transmission, instrumental background subtraction, and normalization of the raw data were conducted using the SANS offline program (developed by CSNS based on Mantid [12]). A standard sample (BP_62.5K) measurement in comparison was used to give a scale factor and, thus, set the macroscopic scattering cross-section to the absolute scale [13,14]. For convenience, Q / Ω is hereinafter referred to as I(Q). All measurements were performed with an applied transverse magnetic field of 1.1 T which can magnetically saturate the specimens (Figure 3a). Therefore, the scattering contribution along the magnetic field is from the nuclear scattering and the contribution vertical to the magnetic field is the combination of the nuclear and magnetic scattering. In the present study, only nuclear scattering contribution was analyzed and discussed (only the scattering pattern in the range of −10° ≤ ψ ≤ 10° was integrated and averaged, where ψ is the angle between Q and the direction of the applied magnetic field, as shown in Figure 3b) [13,14].

2.3.2. Quantitative Analysis of SANS Data

Phase separation (PS) forms a nearly periodic nanostructure in ferrite in SAF 2507. The periodic nanostructure results in a correlation peak in the one-dimensional SANS data. One can get characteristic parameters of PS from SANS data, namely, the peak position (QP) and the peak intensity (IPS(QP)) which are quantitative indicators of the extent of PS [15,16]. The average distance between α or α′ (characteristic distance) can be calculated from QP using d = 2 π /QP. IPS(QP) can be related to the amplitude of PS, which is also affected by the volume fraction and size of α’. Therefore, QP and IPS(QP) were extracted using the below-described methods to quantitatively describe the nanostructure of PS.
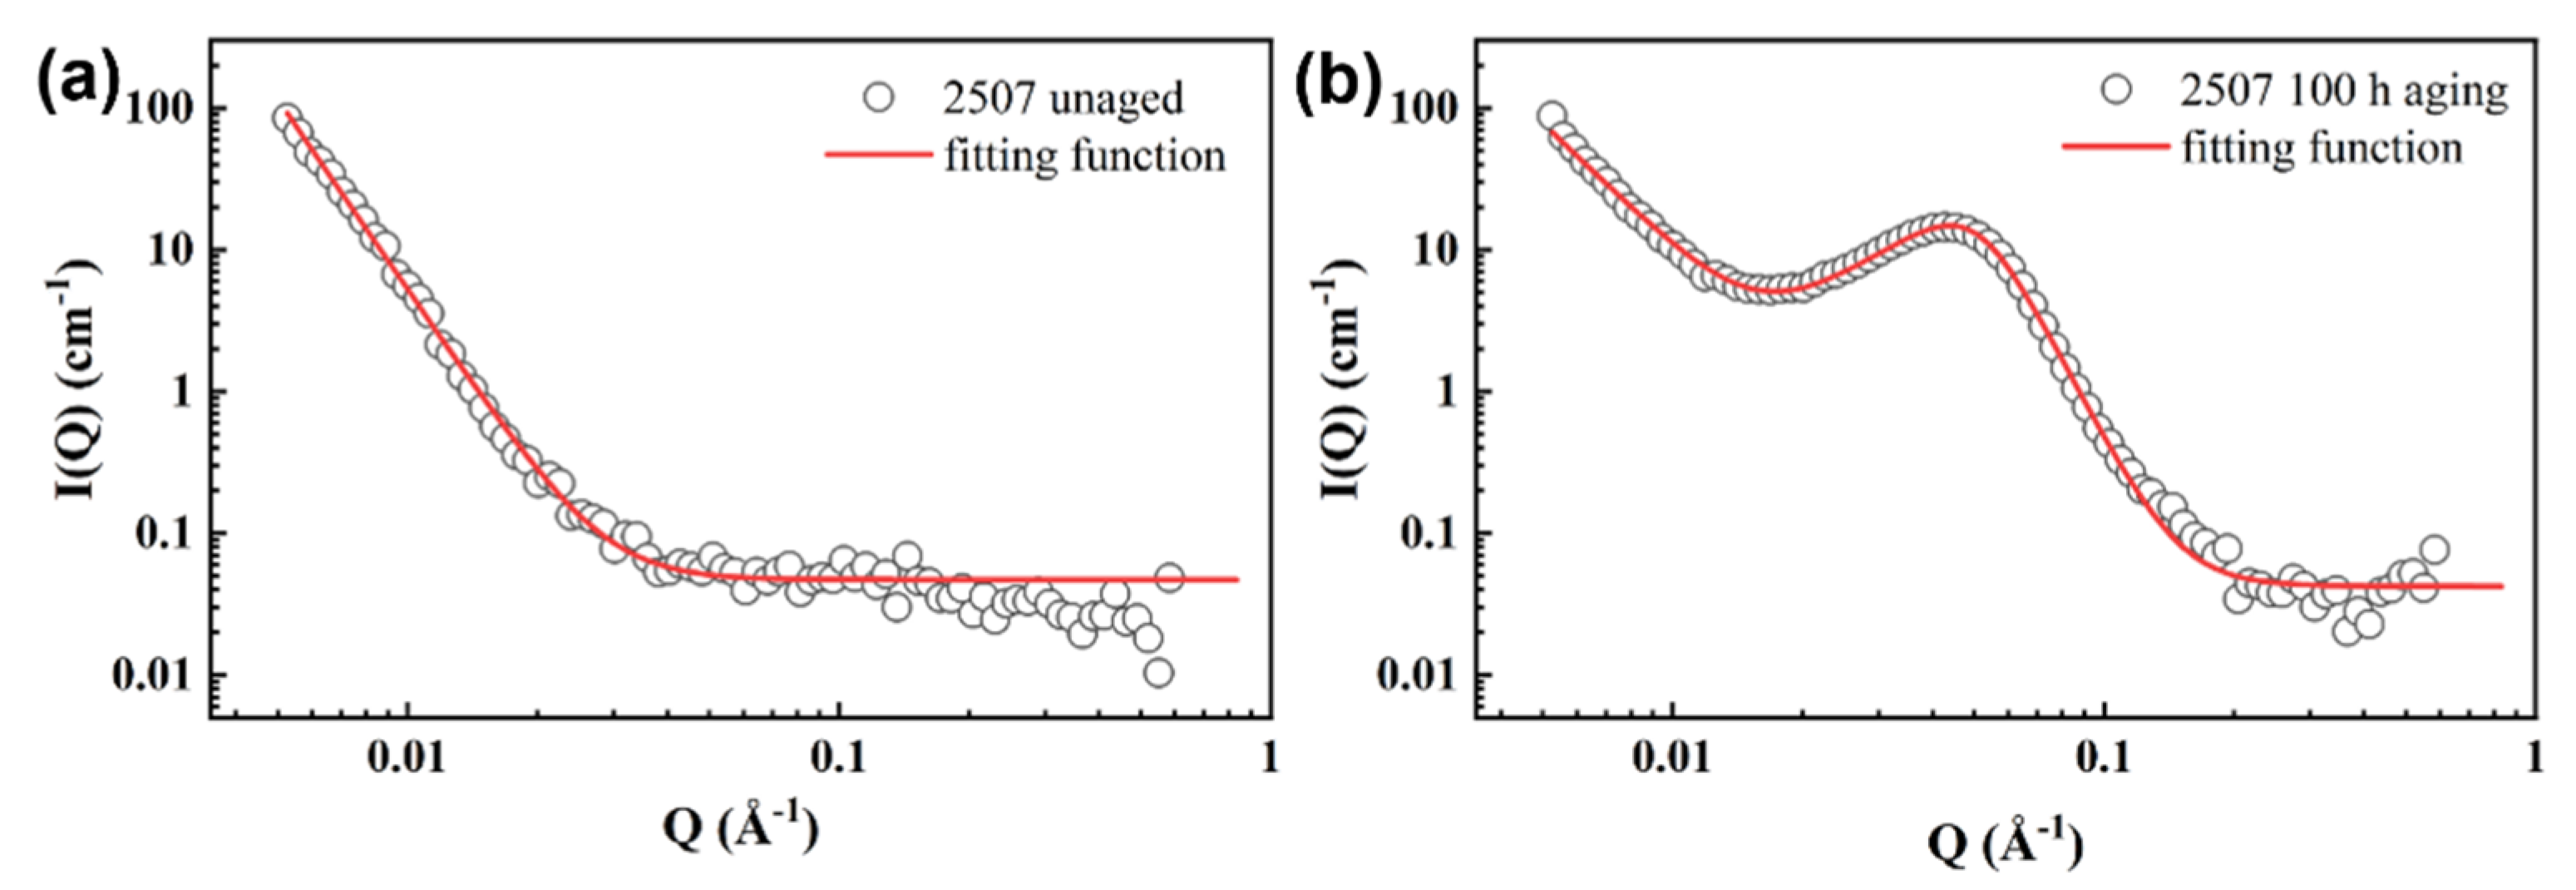
Obvious correlation peaks were not observed in the data of the unaged specimen. This indicates that PS did not occur, or that its extent was still very small in the unaged specimen. Therefore, the SANS data of the unaged specimen (I(Q)unaged) were treated as the background scattering from the matrix. All SANS data were fitted using the SasView program (version 5.0.5) [17]. According to previous studies [15,16,18,19], the data of the unaged specimen were fitted using a power law function (Equation (1)) [2,17,20].
I ( Q ) unaged = A · Q n + B ,
where A is the scale factor, n is the power function exponent, and B is the Q-independent background. As can be seen from Figure 4a, the power law function fit the data of the unaged specimen well. A combination of a power law function (for the background) and a shape-independent spinodal model (for the PS peak) was used to fit the SANS data of aged specimens (Iaged(Q)) (Figure 4b) [17,20,21]:
I aged ( Q ) = A Q n + C I P S 1 + γ 2 Q / Q p γ 2 + Q / Q p 2 + γ + D ,
where C is the scale factor of the spinodal model, D is the total Q-independent background, QP is the position of the PS peak, and IPS is the peak intensity of the PS peak. γ is related to the dimensionality of the system, ρ . When the mixture is below the percolation threshold, γ = ρ + 1 ; when the mixture is above the percolation threshold, γ = 2 ρ [17,21]. In this study, γ = 4 was selected for the 1 h aged specimen, and γ = 6 was selected for the 100 h and 1000 h aged specimens [21], which resulted in good fits for the data of all aged specimens (Figure 4b). After fitting, values of QP and IPS(QP) were extracted to describe the degree of PS.
After obtaining QP and IPS, one can extract the Cr fluctuation amplitude (AP at.%) of PS [22]. According to the studies conducted by Hashimoto et al. [23] and Meier and Strobl [24], and assuming that α′ is a cube, IPS is defined by
I P S = φ 1 φ d / 2 3   Δ ρ 3 ,
where φ represents the volume fraction of α′ (following the assumption by Das et al. [22], the volume fraction was assumed to be 0.5 for the 1 h aged specimen, which may be in the early stage of PS, and 0.25 for the 100 h and 1000 h aged specimens, which are more likely to be in the later stage of PS in this study), and Δ ρ represents the neutron scattering length density (SLD) difference between α and α′. On the basis of the work of Das et al. [22], the amplitude can be obtained by
AP   ( at . % ) = 10   at . % Δ ρ / 0.5 × 10 6   Å 2 .

2.4. Fractograph Observation of Impact Toughness Specimens

The fractograph of impact toughness specimens was observed using a JEOL JEM-6390LA scanning electron microscope (SEM) (Tokyo, Japan). Prior to the observation, all specimens were cleaned.

2.5. Electrochemical Methods

Potentiodynamic polarization measurements were performed in a solution of 1.5 mol/L NaCl at room temperature to investigate the relationship between PS and corrosion resistance. In order to show the phase boundary more clearly and observe the location of pitting corrosion, unaged, 100 h aged, and 1000 h aged specimens were further tested in 0.01 mol/L HCl and 1.5 mol/L NaCl solutions. The specimens for electrochemical tests were cut into dimensions of 10 mm × 10 mm × 5 mm, and then cold-mounted in epoxy resin with a plastic-wrapped copper wire welded on each specimen for electrical contact. Before the electrochemical tests, the exposed surface was ground with sandpaper up to 4000 grit and polished with a 0.05 μm colloidal silica solution, before washing in distilled water and absolute ethyl alcohol.
A conventional three-electrode cell was used in this work, with a Pt counter electrode (CE) and a standard Ag/AgCl reference electrode; the specimen was the working electrode (WE). All specimens were subjected to cathodic polarization for 2 min to remove the oxide layer on the specimen surface. Electrochemical measurements were started after the potential reached a stable open-circuit potential, which was accomplished in 30 min, and the measurements ended when the current density was greater than 1 mA/cm2. The potentiodynamic polarization scan rate was 0.5 mV/s, and each measurement was conducted at least three times to ensure the repeatability of the data.

3. Results

3.1. Vickers-Hardness

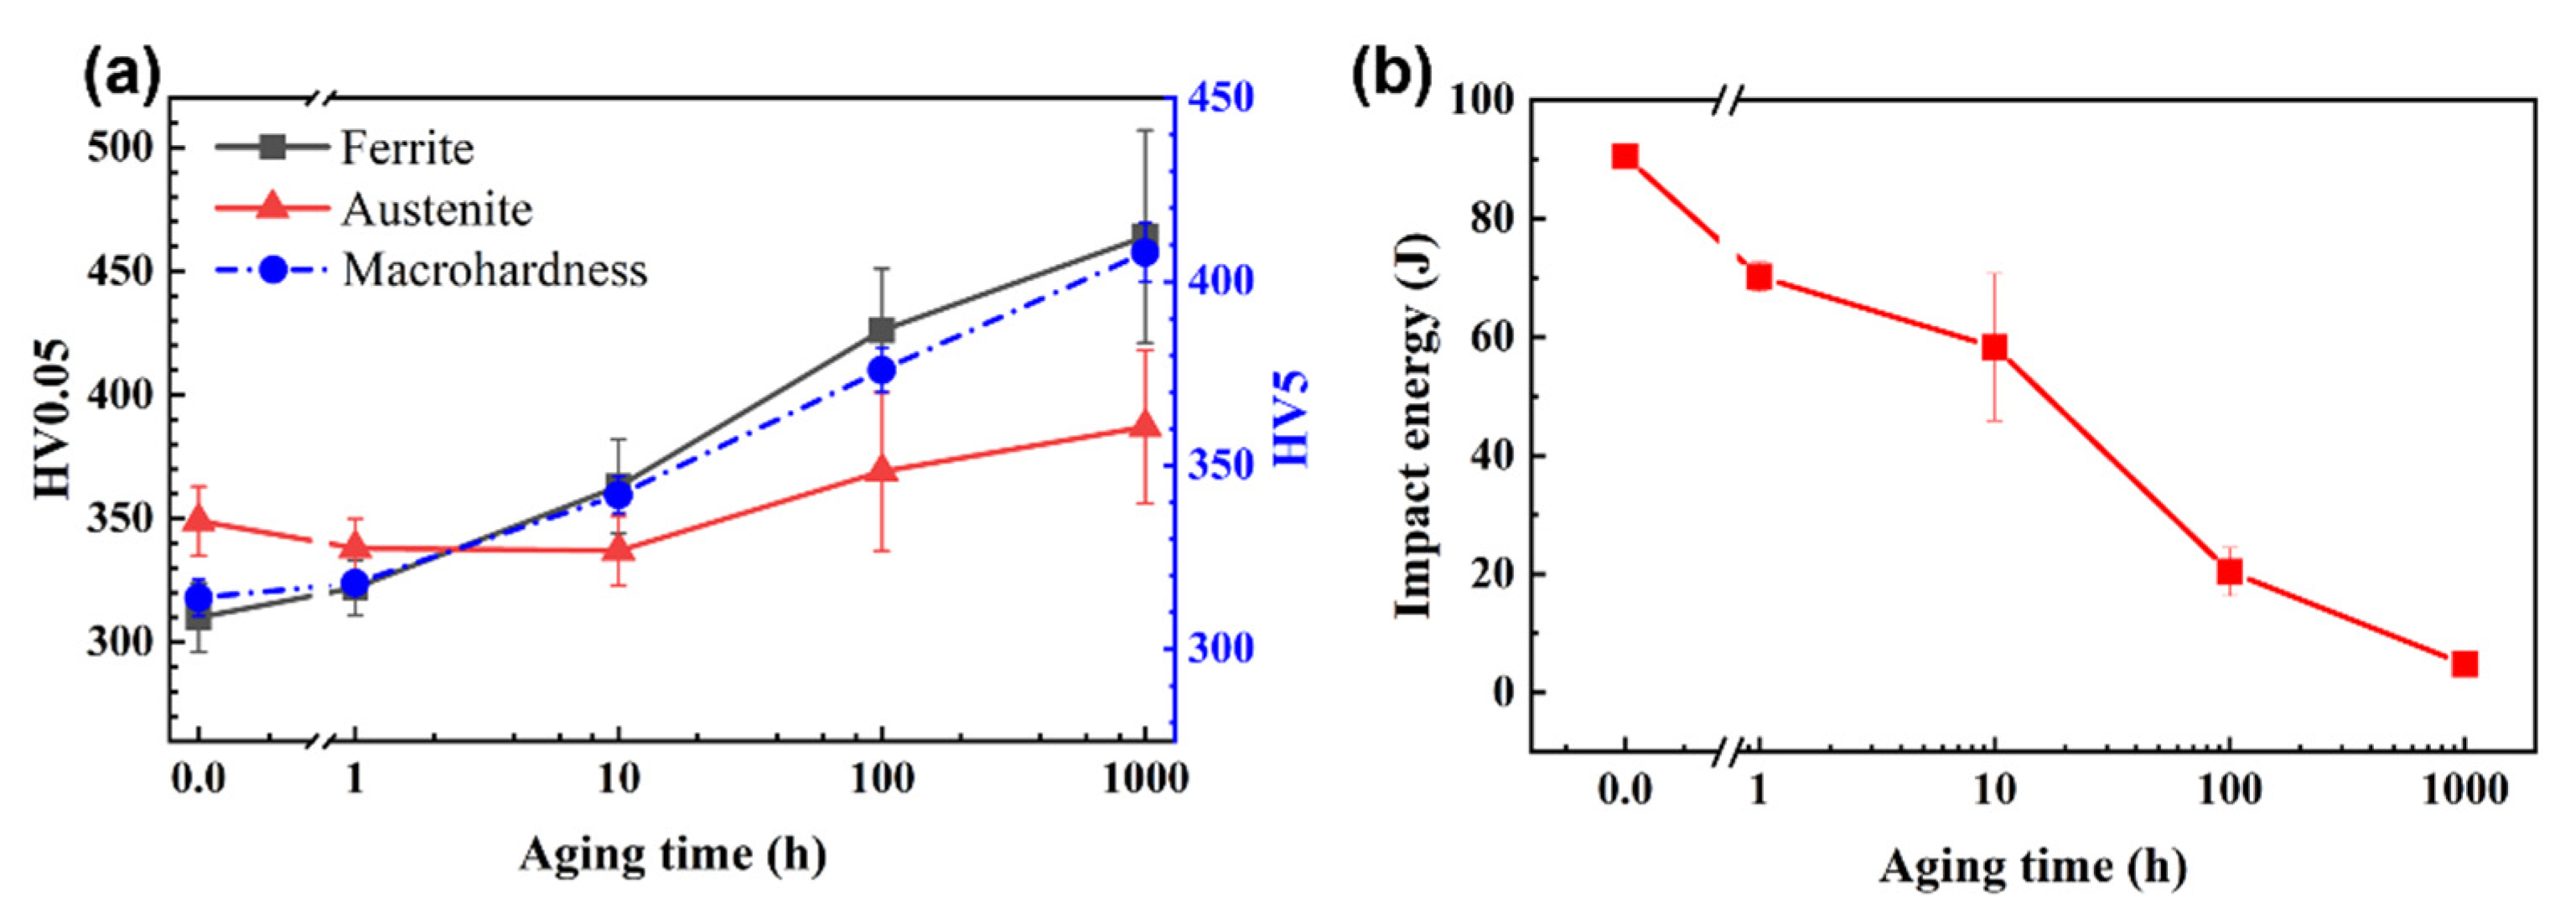
Micro-hardness and macro-hardness tests were performed both before and after aging. Figure 5a shows the variation of Vickers hardness as a function of aging time. Both the macro-hardness and the hardness of ferrite increased obviously with aging time, from 314 HV5 to 408 HV5 (~29.9% increase) and from 310 HV0.05 to 464 HV0.05 (~49.7% increase), respectively. In contrast, the hardness of austenite did not show obvious changes, indicating that the aging treatment had little effect on austenite. These results are consistent with other studies [7,10,25,26,27], stating that the nanostructural evolution caused by phase separation (PS) mainly occurs in ferrite. Therefore, the embrittlement behavior of the alloy is mainly associated with the hardening of ferrite.

3.2. Impact Toughness and Fracture Behavior

Figure 5b illustrates the change in impact energy of SAF 2507 with aging time. The impact energy of aged specimens dropped by 85.7 J (from 90.5 J to 4.8 J; ~94.6% decrease). The impact toughness had an opposite trend with aging time compared to hardness.
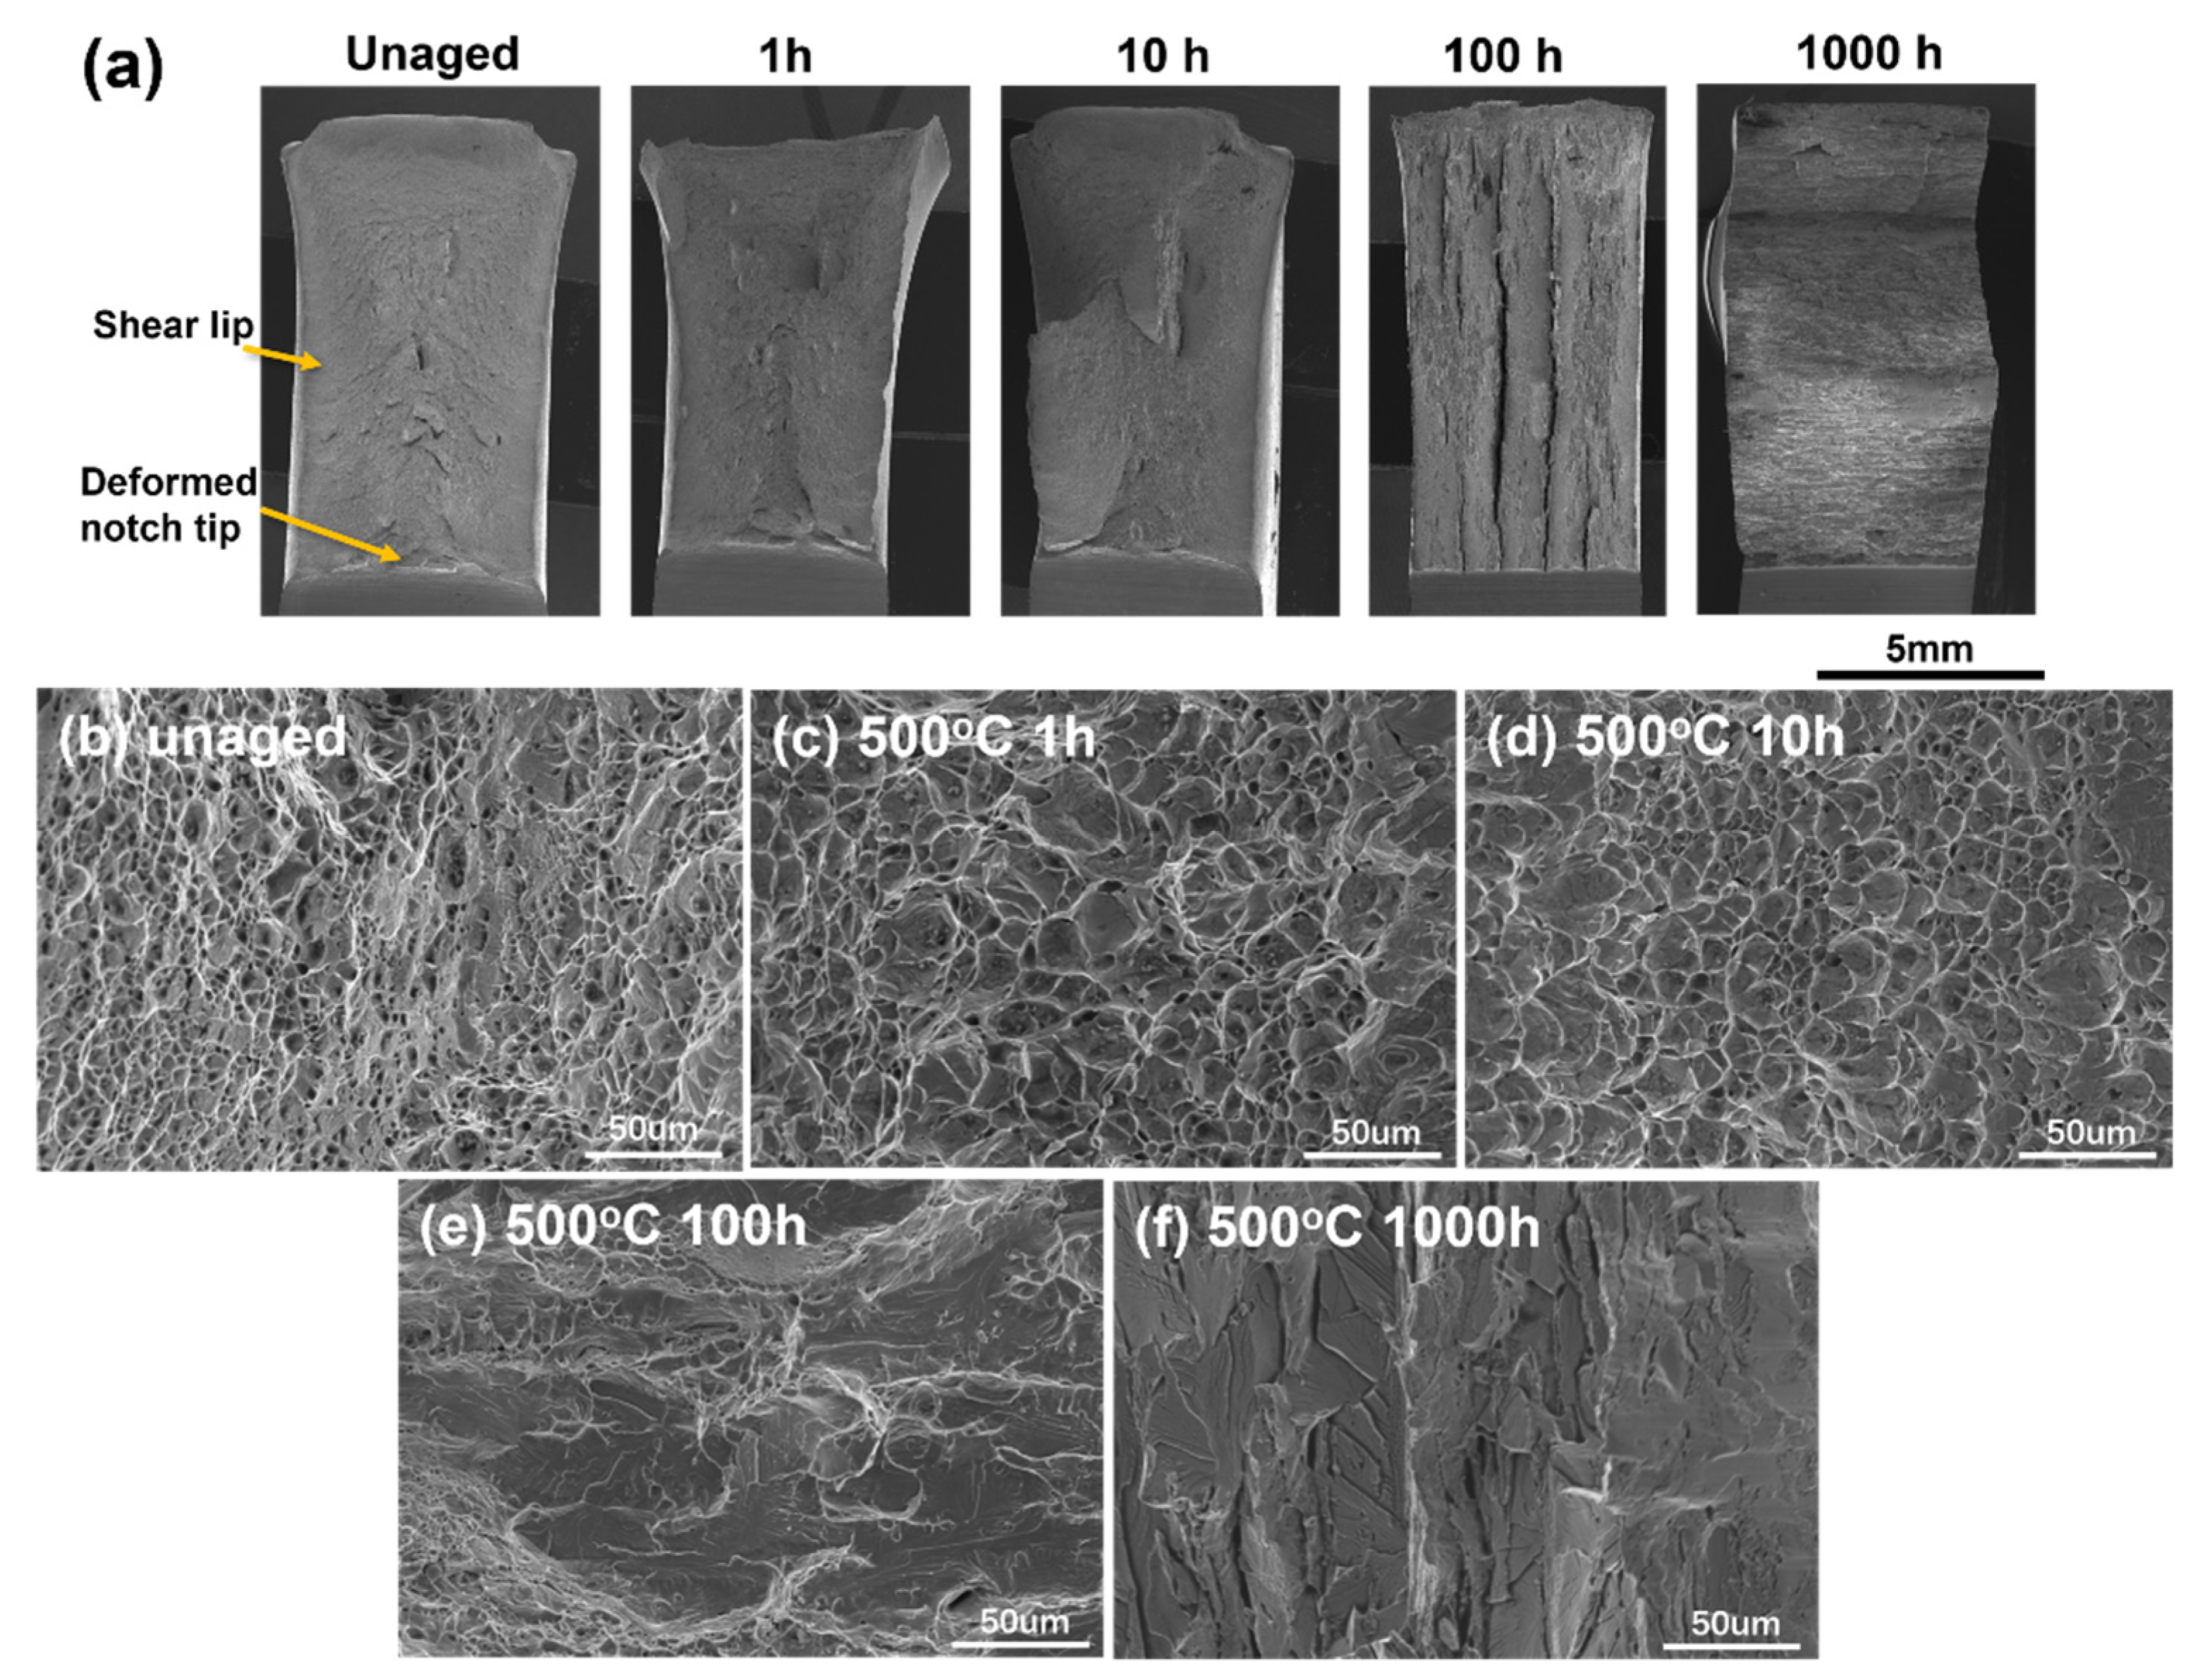
The fracture morphology of the impact toughness specimens shown in Figure 6 indicates the evolution of the fracture mechanisms with aging time. For unaged specimens and those aged for a short time (1 h and 10 h), large shear lips were observed on the fracture surface, and the notch tip was plastically deformed. Dimples were observed in the specimens, while the number and depth of the dimples decreased with aging time. After aging for 100 h, there were several large cracks on the surface, which propagated through the entire specimen along the T-direction of the specimen, i.e., perpendicular to the notch tip. The cracks show the features of delamination or split [28,29] and the 100 h aged specimen seems to have been torn apart. As illustrated in Figure 6e, river lines and cleavage planes can be seen on the fracture surface of the specimen aged for 100 h, which are characteristics of cleavage fracture. As can be seen in Figure 6a, the cracks disappeared for the specimens aged for 1000 h. However, unlike the specimens aged for a short time, that aged for 1000 h did not present the feature of plastic deformation at all, indicating that the specimen was very brittle. Its fracture surface consisted of cleavage tongues and river lines. The above results reveal that the fracture mechanism changed from a ductile mode to a quasi-cleavage mode and then to a cleavage mode as aging time increased. The characteristics of the fracture surface correspond well with the results of Vickers hardness and impact toughness tests.

3.3. Corrosion Behavior

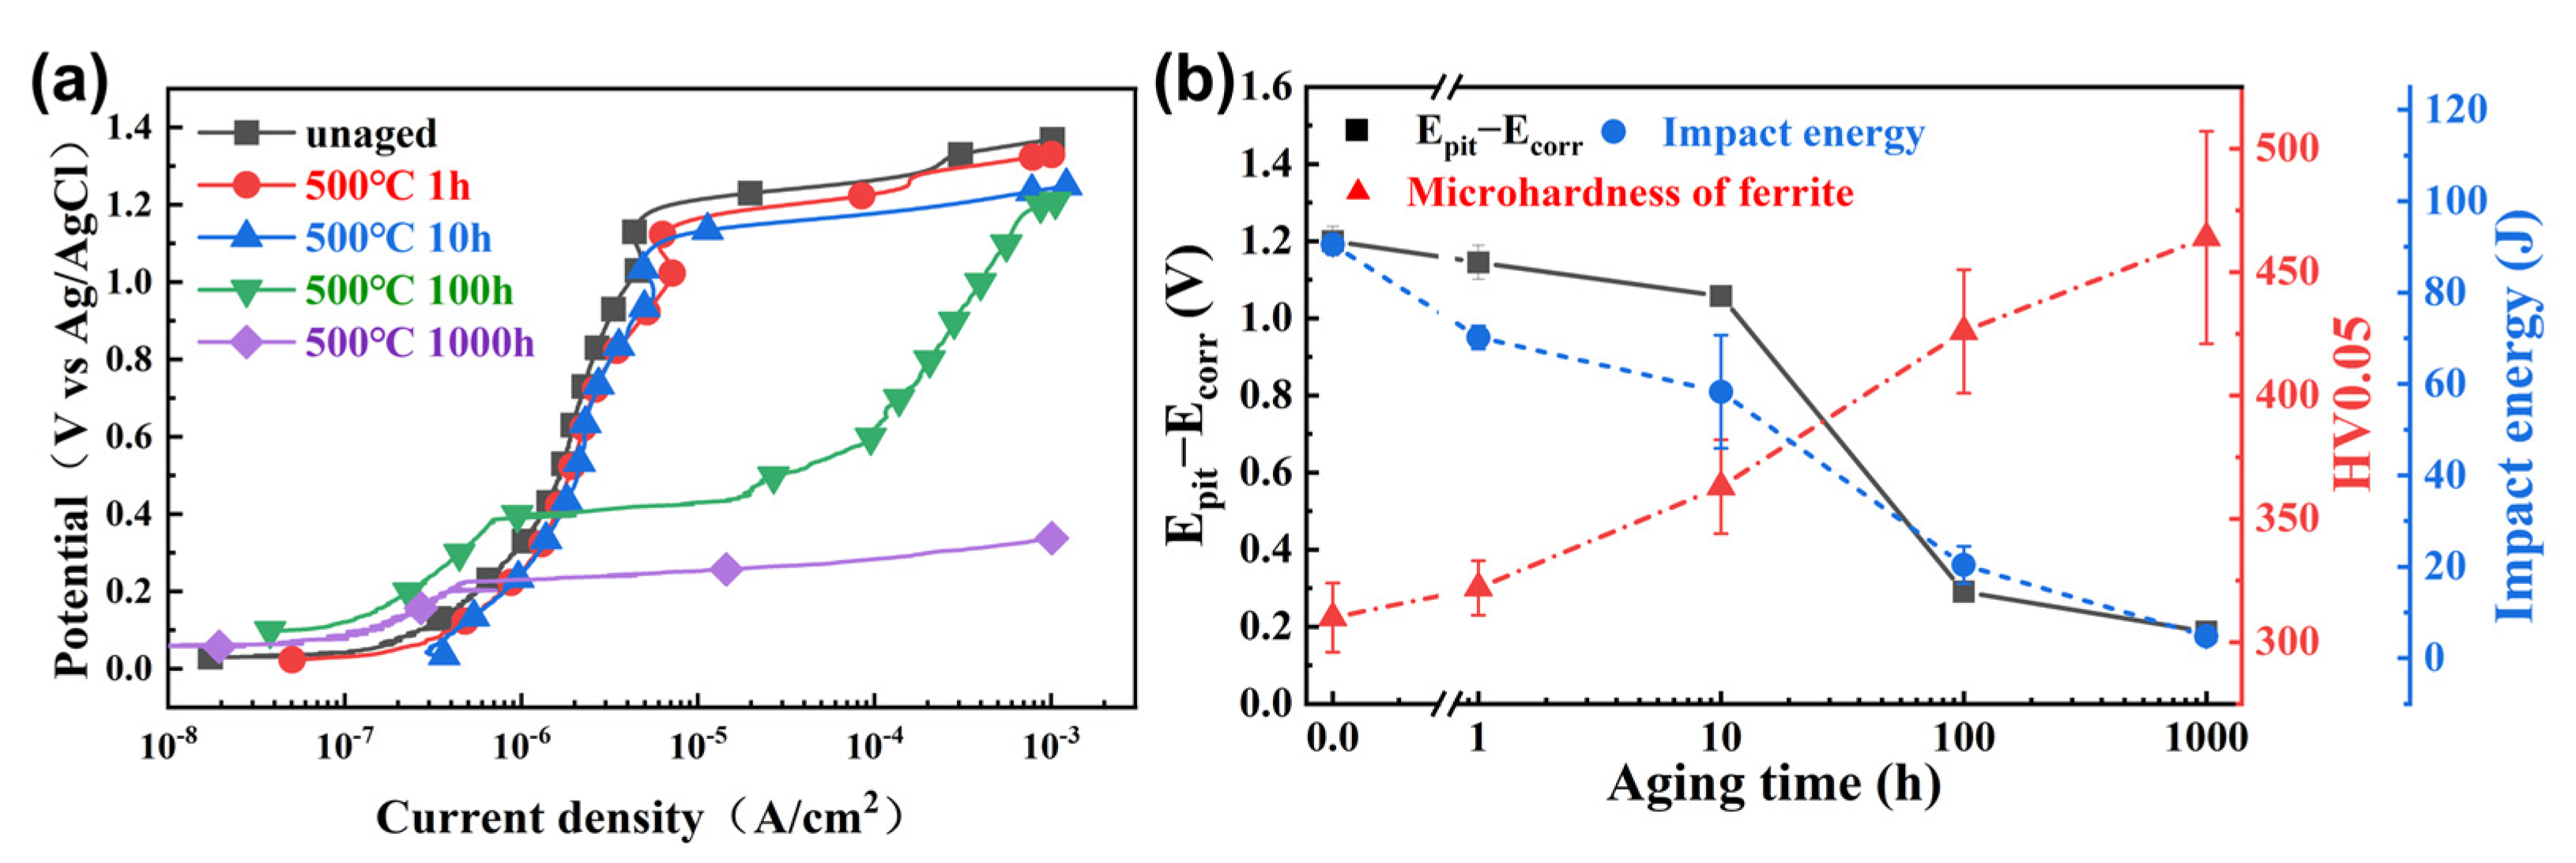
Figure 7a shows the potentiodynamic polarization curves of specimens with different aging times in the 1.5 mol/L NaCl solution. No obvious changes were observed in the corrosion potential (Ecorr) of the unaged and aged specimens. The values of the passive current density fluctuated for the aged specimens. However, the values did not show an obvious trend with aging time, which illustrates that the aging time had little effect on Ecorr or passive current density for SAF 2507. The shape of the polarization curves of the specimens aged for a long time (100 h and 1000 h) exhibited significant differences compared to those of the specimens aged for a short time. The pitting potential Epit of the unaged specimen was 1.2 VAg/AgCl, while Epit values of the 100 h and 1000 h aged specimens were around 0.4 VAg/AgCl and 0.2 VAg/AgCl, respectively.
The values of passivation region, i.e., the difference between Epit and Ecorr (Epit − Ecorr), was calculated on the basis of the polarization curves, as shown in Figure 7b. It can be observed that the aging treatment resulted in a drastic decrease in the values of (Epit − Ecorr). It is worth noting that the values suddenly dropped from around 1.2 V to 0.29 V in the first 100 h of aging. Therefore, it is argued that the aging treatment could affect the corrosion resistance of SAF 2507, and its pitting resistance became worse with the increase in aging time. Furthermore, the variation trend of (Epit − Ecorr) was highly consistent with that of the impact energy, which was opposite to that of the hardness evolution.
Figure 8 shows the optical morphologies of the specimen surface after the potentiodynamic polarization tests in 1.5 mol/L NaCl + 0.01 mol/L HCl. It can be noted that there were pits in austenite for the unaged specimen. However, corrosion mainly occurred in ferrite for the aged specimens and the corrosion became more severe with aging time. Compared to the 100 h aged specimen (Figure 8b,c), the ferrite was heavily attacked in the 1000 h aged specimen (Figure 8d,e), and it was completely dissolved in some regions. The above results show that the corrosion resistance of ferrite decreased with aging time, and the preferential corrosion position in SAF 2507 also moved from austenite to ferrite due to the deteriorated corrosion resistance of ferrite. These results are consistent with those in the literature [3,7,11,30].

3.4. Small-Angle Neutron Scattering

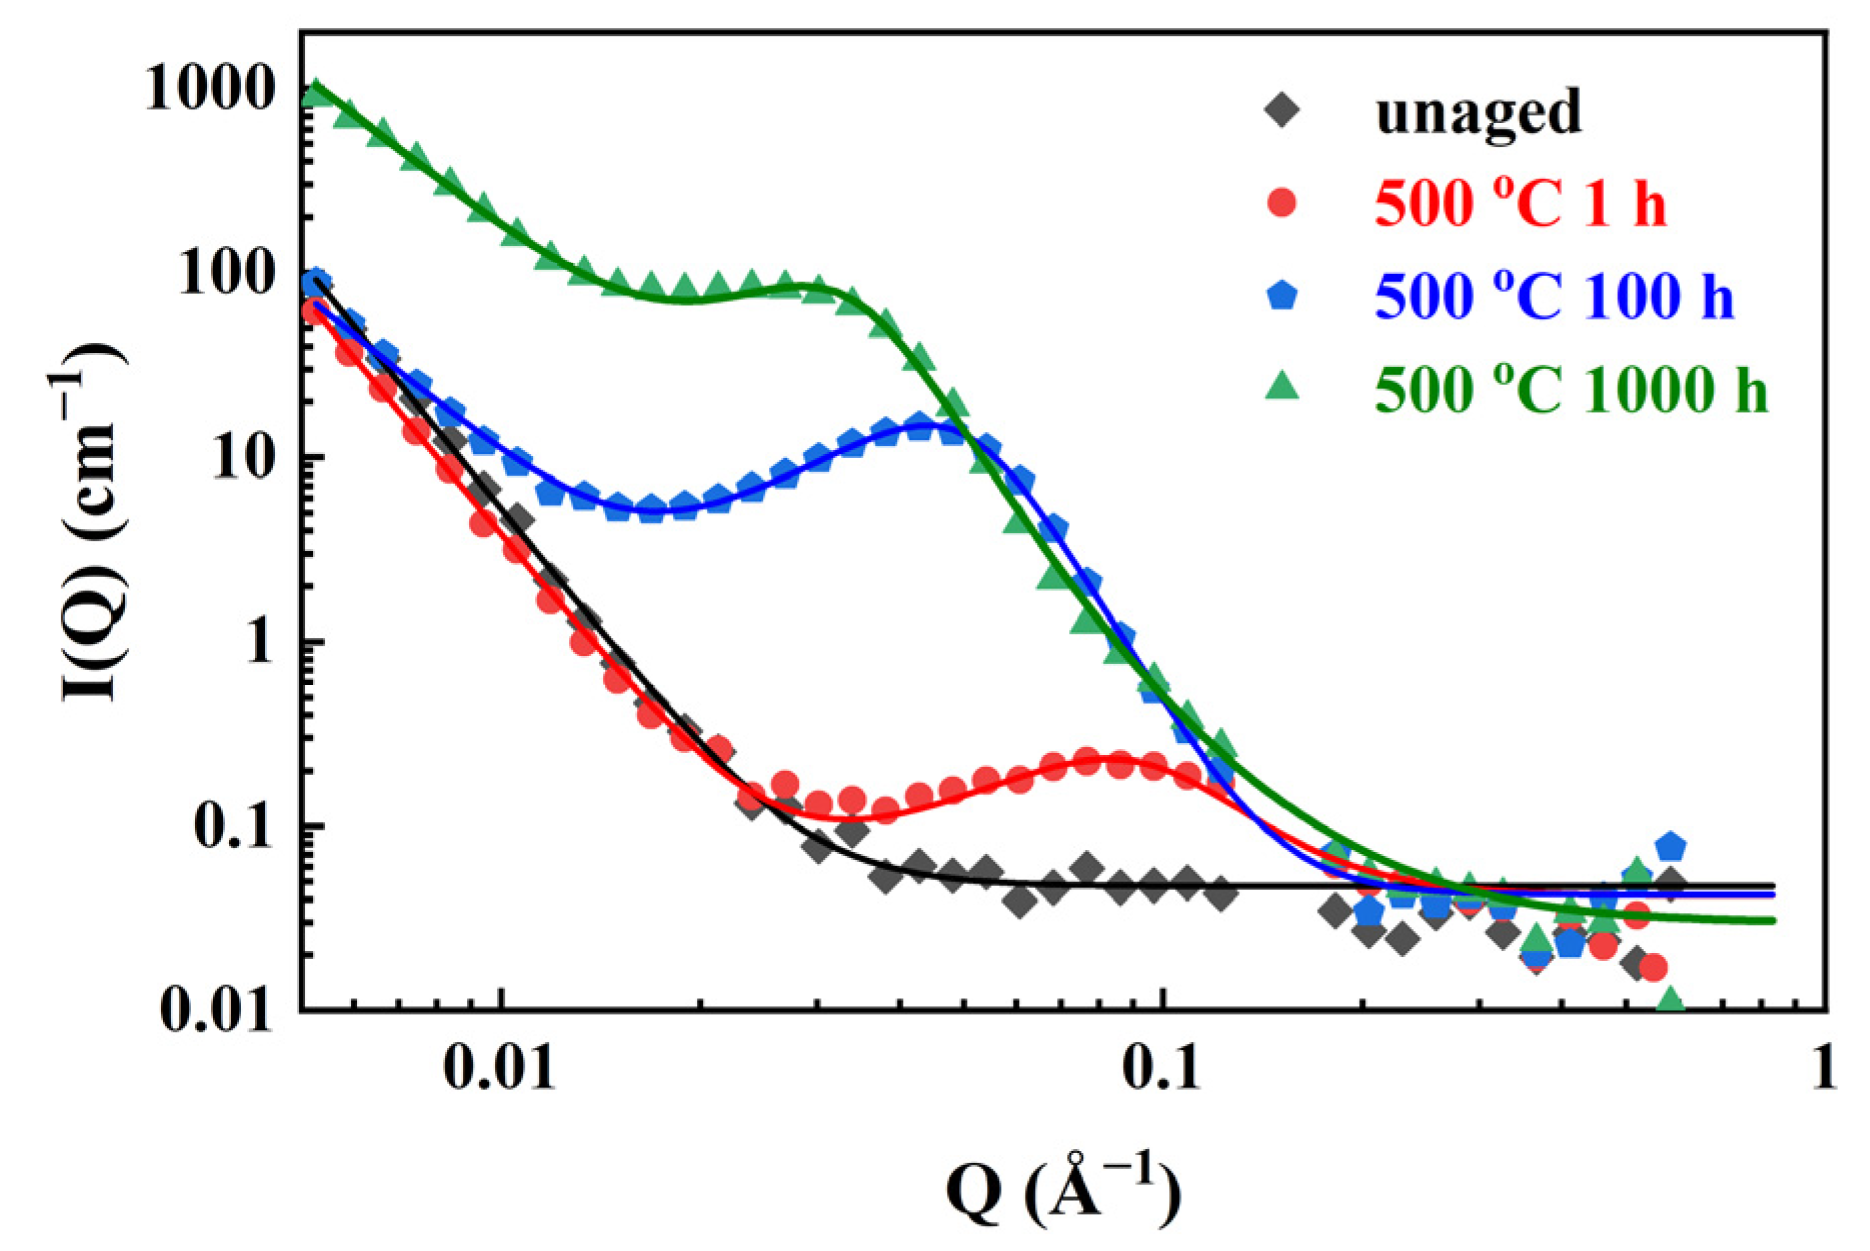
The SANS data are presented in Figure 9. No correlation peak can be seen in the SANS data of the unaged specimen, while correlation peaks appeared in the data of aged specimens. For the data of aged specimens, the peak height increased and the peak position moved to lower-Q values with the increase in aging time.
The characteristic parameters of PS are presented in Table 2 and Figure 10. As can be seen, d, IPS, and AP became larger after 1000 h of aging at 500 °C. Furthermore, both d and AP increased quickly with aging time in the first 100 h, indicating that the kinetics of PS for SAF 2507 was relatively high during this period, before slowing down with a further increase in aging time. It is worth noting that the evolution of (Epit − Ecorr) with aging time indeed had the opposite trend compared to that of d and AP. This indicates that the nanostructural evolution due to PS deteriorated not only the mechanical properties but also the corrosion resistance of SAF 2507.

4. Discussion

4.1. Evolution of Mechanical Properties Due to Nanostructural Development

The effect of aging at 500 °C on the mechanical properties of SAF 2507 is clearly shown in this work (see Figure 5). The micro-hardness and macro-hardness both increased, whereas the impact energy decreased with aging time, which is related to the embrittlement of ferrite caused by phase separation (PS). The results are consistent with other studies [2,10,25,30]. The nanostructural evolution of PS was also clearly shown by the SANS results. It is believed that coherency strain existed around the phase boundaries, producing internal stresses, as α and α’ were highly coherent. The internal stress could restrict the slip motion of dislocations and, hence, embrittle the alloy [31,32,33]. As shown in Figure 5, the variation of mechanical properties was faster in the early stage of aging. After only 100 h of aging, the hardness of ferrite increased by 116 HV0.05 (~37 %) and the impact energy dropped by 70.12 J (~77 %). However, the variation of the mechanical properties between 100 h and 1000 h was relatively slow, where the changes in hardness and impact energy were only 12% and 17%, respectively. A similar trend was observed for the results of electrochemical tests and small-angle neutron scattering (SANS). These trends were also seen in the studies by Yamada et al. [27] and Silva et al. [11]. Therefore, early-stage aging had a more significant impact on the nanostructure of PS and, thus, the properties of SAF 2507.
The fracture mechanisms are indicated by the fractographic observation in Figure 6. The as-received specimen showed ductile fracture, where a large number of deep dimples could be observed. After aging for 100 h, the specimen showed the characteristics of a mixed fracture mode, i.e., the coexistence of ductile and cleavage fracture morphology. For the specimen aged for 1000 h, cleavage fracture became the dominant mechanism; clear cleavage planes could be observed, and no dimples were found. It is apparent that the evolution of the fracture mechanisms was associated with the embrittlement of ferrite. As confirmed by Xu et al. [2], fewer crystal misorientations were found in ferrite for the aged alloys than in the as-received one, as observed using electron backscatter diffraction, indicating less plastic deformation in ferrite for the aged alloys. Due to the increased embrittlement of ferrite, the fracture mechanism of the austenite also evolved from dimple rupture toward shear rupture. As a result, the aged specimen showed cleavage fracture features [34]. Hence, it can be argued that the fracture mode was mainly determined by ferrite in aged specimens.

4.2. Relationship between Corrosion Resistance and Phase Separation

It can be seen from the electrochemical results that the corrosion resistance of SAF 2507 became worse due to PS in ferrite as aging progressed. The evolution of the nanostructure of PS during aging led to a change in current density and potential, as well as the shape of potentiodynamic polarization curves. This may be related to the increase in the Cr-depleted regions (α) around α′ with increasing aging time. As reported by Chandra et al. [30], Cr plays an important role in the corrosion properties of stainless steels. The fluctuation of the Cr concentration in ferrite led to the instability of the metal surface status or passive films and the decrease in Epit. Ferrite has a higher content of Cr compared to austenite, which led to higher passive characteristics and corrosion resistance compared to austenite for the unaged specimens. However, after aging at 500 °C, α′ and Cr depletion regions were formed within ferrite. The Cr depletion regions became the weak areas which were more susceptible to corrosions compared to α′. As PS progressed, the Cr depletion became more serious, such that the corrosion attack of ferrite was more severe, as shown in Figure 10. This was also the reason for the decrease in Epit with aging time.
In addition, it can be noted that the evolution of the passivation region (Epit − Ecorr) with aging time correlated well with the results of mechanical tests and characteristic parameters of PS (Figure 10). In the first 100 h of aging, the value dropped from 1.2 to 0.29 V (~75% decrease). Thereafter, it decreased more slowly. These results indicate that this value was closely related to the evolution of the nanostructure of PS in SAF 2507; hence, it may become a new index for measuring the extent of PS in duplex stainless steels (DSSs). It is possible to develop a new nondestructive electrochemical method to quantify the kinetics of PS in DSSs and predict the lifetime of DSSs.

5. Conclusions

In this study, the effect of phase separation (PS) after aging at 500 °C for up to 1000 h on the mechanical and corrosion properties of SAF 2507 was investigated, and the following conclusions could be drawn:
  • New SANS data of SAF 2507 aged at 500 °C were obtained, indicating that the PS nanostructure developed rapidly during the first 100 h of aging. The characteristic distance (d) and Cr fluctuation amplitude (AP) increased from 75.7 to 142.8 Å (30.9% increase) and from 7.4% to 36.0% (64.2% increase), respectively. However, the kinetics of PS slowed down for a longer aging time. The occurrence of PS in ferrite during the aging at 500 °C had a significant influence on the mechanical properties and corrosion resistance of SAF 2507. The evolution of the PS nanostructure was highly correlated with the variation trend of mechanical properties and corrosion resistance of SAF 2507.
  • The evolution of the mechanical behavior of aged SAF 2507 was mainly attributed to the progress of PS in ferrite. The early stage of PS had a more significant impact on the nanostructure and the properties of SAF 2507. The fracture behavior of the alloy was likely determined by the mechanical properties of ferrite for aged conditions.
  • The pitting corrosion resistance of SAF 2507 aged at 500 °C was closely related to the Cr depletion due to PS, and the resistance became weaker with the progression of PS. The evolution of the passivation region (Epit − Ecorr) with aging time correlated well with the results of mechanical tests and characteristic parameters of PS. The passivation region may become a new index for the extent of PS, and it is possible to use the passivation region to develop a new nondestructive electrochemical method to quantify the evolution of PS in duplex stainless steels (DSSs). Therefore, the service lifetime of DSSs may be reasonably evaluated without irreversible destruction using the method.

Author Contributions

Methodology, SANS data, and data curation, Y.Y.; formal analysis, S.Y.; electrochemical test, Y.W. and S.Y.; mechanical test, Z.D. and Q.L.; investigation, Y.X.; conceptualization and writing—original draft, X.X.; writing—review and editing, X.X., J.X., Y.K., H.Y. and D.S. All authors have read and agreed to the published version of the manuscript.

Funding

This work was funded by the National Key R&D Program of China (2021YFA1601104), the National Natural Science Foundation of China (52101168), and the Innovation Group Project of Southern Marine Science and Engineering Guangdong Laboratory (Zhuhai) (311021013).

Institutional Review Board Statement

Not applicable.

Informed Consent Statement

Not applicable.

Data Availability Statement

Data will be made available on request.

Acknowledgments

Y.Y. thanks Jun Wang for helping with SANS measurements. Y.K. is grateful for the funding from the National Natural Science Foundation of China (12275154) and the Guangdong Basic and Applied Basic Research Foundation, China (2021B1515140028). This work benefited from the use of the SasView application, originally developed under NSF award DMR-0520547. SasView contains code developed with funding from the European Union’s Horizon 2020 research and innovation program under the SINE2020 project, grant agreement No. 654000.

Conflicts of Interest

The authors declare no conflict of interest.

References

  1. Nilsson, J.-O. Super Duplex Stainless Steels. Mater. Sci. Technol. 1992, 8, 685–700. [Google Scholar] [CrossRef]
  2. Xu, X.; Wessman, S.; Odqvist, J.; King, S.M.; Hedström, P. Nanostructure, Microstructure and Mechanical Properties of Duplex Stainless Steels 25Cr-7 Ni and 22Cr-5Ni (Wt.%) Aged at 325 °C. Mater. Sci. Eng. A 2019, 754, 512–520. [Google Scholar] [CrossRef]
  3. Rovere, C.A.D.; Santos, F.S.; Silva, R.; Souza, C.A.C.; Kuri, S.E. Influence of Long-Term Low-Temperature Aging on the Microhardness and Corrosion Properties of Duplex Stainless Steel. Corros. Sci. 2013, 68, 84–90. [Google Scholar] [CrossRef]
  4. Olsson, J.; Snis, M. Duplex—A New Generation of Stainless Steels for Desalination Plants. Desalination 2007, 205, 104–113. [Google Scholar] [CrossRef]
  5. Zhang, Z.; Zhao, H.; Zhang, H.; Yu, Z.; Hu, J.; He, L.; Li, J. Effect of Isothermal Aging on the Pitting Corrosion Resistance of UNS S82441 Duplex Stainless Steel Based on Electrochemical Detection. Corros. Sci. 2015, 93, 120–125. [Google Scholar] [CrossRef]
  6. Solomon, H.D.; Levinson, L.M. Mössbauer Effect Study of ‘475°c Embrittlement’ of Duplex and Ferritic Stainless Steels. Acta Metall. 1978, 26, 429–442. [Google Scholar] [CrossRef]
  7. Yi, Y.S.; Shoji, T. Detection and Evaluation of Material Degradation of Thermally Aged Duplex Stainless Steels: Electrochemical Polarization Test and AFM Surface Analysis. J. Nucl. Mater. 1996, 231, 20–28. [Google Scholar] [CrossRef]
  8. Chen, Y.; Yang, B.; Zhou, Y.; Wu, Y.; Zhu, H. Evaluation of Pitting Corrosion in Duplex Stainless Steel Fe20Cr9Ni for Nuclear Power Application. Acta Mater. 2020, 197, 172–183. [Google Scholar] [CrossRef]
  9. Iacoviello, F.; Casari, F.; Gialanella, S. Effect of “475 °C Embrittlement” on Duplex Stainless Steels Localized Corrosion Resistance. Corros. Sci. 2005, 47, 909–922. [Google Scholar] [CrossRef]
  10. Park, C.-J.; Kwon, H.-S. Effects of Aging at 475 °C on Corrosion Properties of Tungsten-Containing Duplex Stainless Steels. Corros. Sci. 2002, 44, 2817–2830. [Google Scholar] [CrossRef]
  11. Silva, R.; Vacchi, G.S.; Kugelmeier, C.L.; Santos, I.G.R.; Filho, A.A.M.; Magalhães, D.C.C.; Afonso, C.R.M.; Sordi, V.L.; Rovere, C.A.D. New Insights into the Hardening and Pitting Corrosion Mechanisms of Thermally Aged Duplex Stainless Steel at 475 °C: A Comparative Study between 2205 and 2101 Steels. J. Mater. Sci. Technol. 2022, 98, 123–135. [Google Scholar] [CrossRef]
  12. Arnold, O.; Bilheux, J.C.; Borreguero, J.M.; Buts, A.; Campbell, S.I.; Chapon, L.; Doucet, M.; Draper, N.; Ferraz Leal, R.; Gigg, M.A.; et al. Mantid—Data Analysis and Visualization Package for Neutron Scattering and μ SR Experiments. Nucl. Instrum. Methods Phys. Res. Sect. A Accel. Spectrometers Detect. Assoc. Equip. 2014, 764, 156–166. [Google Scholar] [CrossRef] [Green Version]
  13. Wignall, G.D.; Bates, F.S. Absolute calibration of small-angle neutron scattering data. J. Appl. Crystallogr. 1987, 20, 28–40. [Google Scholar] [CrossRef]
  14. Penfold, J.; King, S.M. SANS at Pulsed Neutron Sources: Present and Future Prospects. J. Appl. Crystallogr. 1997, 30, 1140–1147. [Google Scholar] [CrossRef]
  15. Hörnqvist, M.; Thuvander, M.; Steuwer, A.; King, S.; Odqvist, J.; Hedström, P. Early Stages of Spinodal Decomposition in Fe–Cr Resolved by In-Situ Small-Angle Neutron Scattering. Appl. Phys. Lett. 2015, 106, 061911. [Google Scholar] [CrossRef] [Green Version]
  16. Xu, X.; Odqvist, J.; Colliander, M.H.; King, S.; Thuvander, M.; Steuwer, A.; Hedström, P. Effect of Cooling Rate after Solution Treatment on Subsequent Phase Separation during Aging of Fe-Cr Alloys: A Small-Angle Neutron Scattering Study. Acta Mater. 2017, 134, 221–229. [Google Scholar] [CrossRef] [Green Version]
  17. SasView. SasView. Available online: https://sasview.github.io/ (accessed on 17 October 2022).
  18. Xu, X.; Westraadt, J.E.; Odqvist, J.; Youngs, T.G.A.; King, S.M.; Hedström, P. Effect of Heat Treatment above the Miscibility Gap on Nanostructure Formation Due to Spinodal Decomposition in Fe-52.85 at.%Cr. Acta Mater. 2018, 145, 347–358. [Google Scholar] [CrossRef]
  19. Xu, X.; Odqvist, J.; Colliander, M.H.; Thuvander, M.; Steuwer, A.; Westraadt, J.E.; King, S.; Hedström, P. Structural Characterization of Phase Separation in Fe-Cr: A Current Comparison of Experimental Methods. Metall. Mater. Trans. A 2016, 47, 5942–5952. [Google Scholar] [CrossRef] [Green Version]
  20. Hammouda, B. Probing Nanoscale Structures, the SANS Toolbox; National Institute of Standards and Technology: Gaithersburg, MD, USA, 2008.
  21. Furukawa, H. Dynamics-Scaling Theory for Phase-Separating Unmixing Mixtures: Growth Rates of Droplets and Scaling Properties of Autocorrelation Functions. Phys. A Stat. Mech. Its Appl. 1984, 123, 497–515. [Google Scholar] [CrossRef]
  22. Das, Y.; Liu, J.; Wessman, S.; Xu, X.; Odqvist, J.; King, S.; Hedström, P. Small-Angle Neutron Scattering Quantification of Phase Separation and the Corresponding Embrittlement of a Super Duplex Stainless Steel after Long-Term Aging at 300 °C. Materialia 2020, 12, 100771. [Google Scholar] [CrossRef]
  23. Hashimoto, T.; Takenaka, M.; Jinnai, H. Scattering Studies of Self-Assembling Processes of Polymer Blends in Spinodal Decomposition. J. Appl. Crystallogr. 1991, 24, 457–466. [Google Scholar] [CrossRef]
  24. Meier, H.; Strobl, G.R. Small-Angle X-ray Scattering Study of Spinodal Decomposition in Polystyrene/Poly(Styrene-Co-Bromostyrene) Blends. Macromolecules 1987, 20, 649–654. [Google Scholar] [CrossRef]
  25. Yamada, T.; Okano, S.; Kuwano, H. Mechanical Property and Microstructural Change by Thermal Aging of SCS14A Cast Duplex Stainless Steel. J. Nucl. Mater. 2006, 350, 47–55. [Google Scholar] [CrossRef]
  26. Chen, T.H.; Weng, K.L.; Yang, J.R. The Effect of High-Temperature Exposure on the Microstructural Stability and Toughness Property in a 2205 Duplex Stainless Steel. Mater. Sci. Eng. A 2002, 338, 259–270. [Google Scholar] [CrossRef]
  27. Park, J.S.; Yoon, Y.K. Evaluation of Thermal Aging Embrittlement of Duplex Stainless Steels by Electrochemical Method. Scr. Metall. Mater. 1995, 32, 1163–1168. [Google Scholar] [CrossRef]
  28. Sieurin, H.; Sandström, R.; Westin, E.M. Fracture Toughness of the Lean Duplex Stainless Steel LDX 2101. Metall. Mater. Trans. A 2006, 37, 2975–2981. [Google Scholar] [CrossRef]
  29. Sieurin, H.; Sandström, R. Fracture Toughness of a Welded Duplex Stainless Steel. Eng. Fract. Mech. 2006, 73, 377–390. [Google Scholar] [CrossRef]
  30. Chandra, K.; Singhal, R.; Kain, V.; Raja, V.S. Low Temperature Embrittlement of Duplex Stainless Steel: Correlation between Mechanical and Electrochemical Behavior. Mater. Sci. Eng. A 2010, 527, 3904–3912. [Google Scholar] [CrossRef]
  31. Cahn, J.W. Hardening by spinodal decomposition. Acta Metall. 1963, 11, 1275–1282. [Google Scholar] [CrossRef]
  32. Park, K.-H.; LaSalle, J.C.; Schwartz, L.H.; Kato, M. Mechanical Properties of Spinodally Decomposed Fe-30 Wt% Cr Alloys: Yield Strength and Aging Embrittlement. Acta Metall. 1986, 34, 1853–1865. [Google Scholar] [CrossRef]
  33. Weng, K.L.; Chen, H.R.; Yang, J.R. The Low-Temperature Aging Embrittlement in a 2205 Duplex Stainless Steel. Mater. Sci. Eng. A 2004, 379, 119–132. [Google Scholar] [CrossRef]
  34. Bonnet, S.; Bourgoin, J.; Champredonde, J.; Guttmann, D.; Guttmann, M. Relationship between Evolution of Mechanical Properties of Various Cast Duplex Stainless Steels and Metallurgical and Aging Parameters: Outline of Current EDF Programmes. Mater. Sci. Technol. 1990, 6, 221–229. [Google Scholar] [CrossRef]
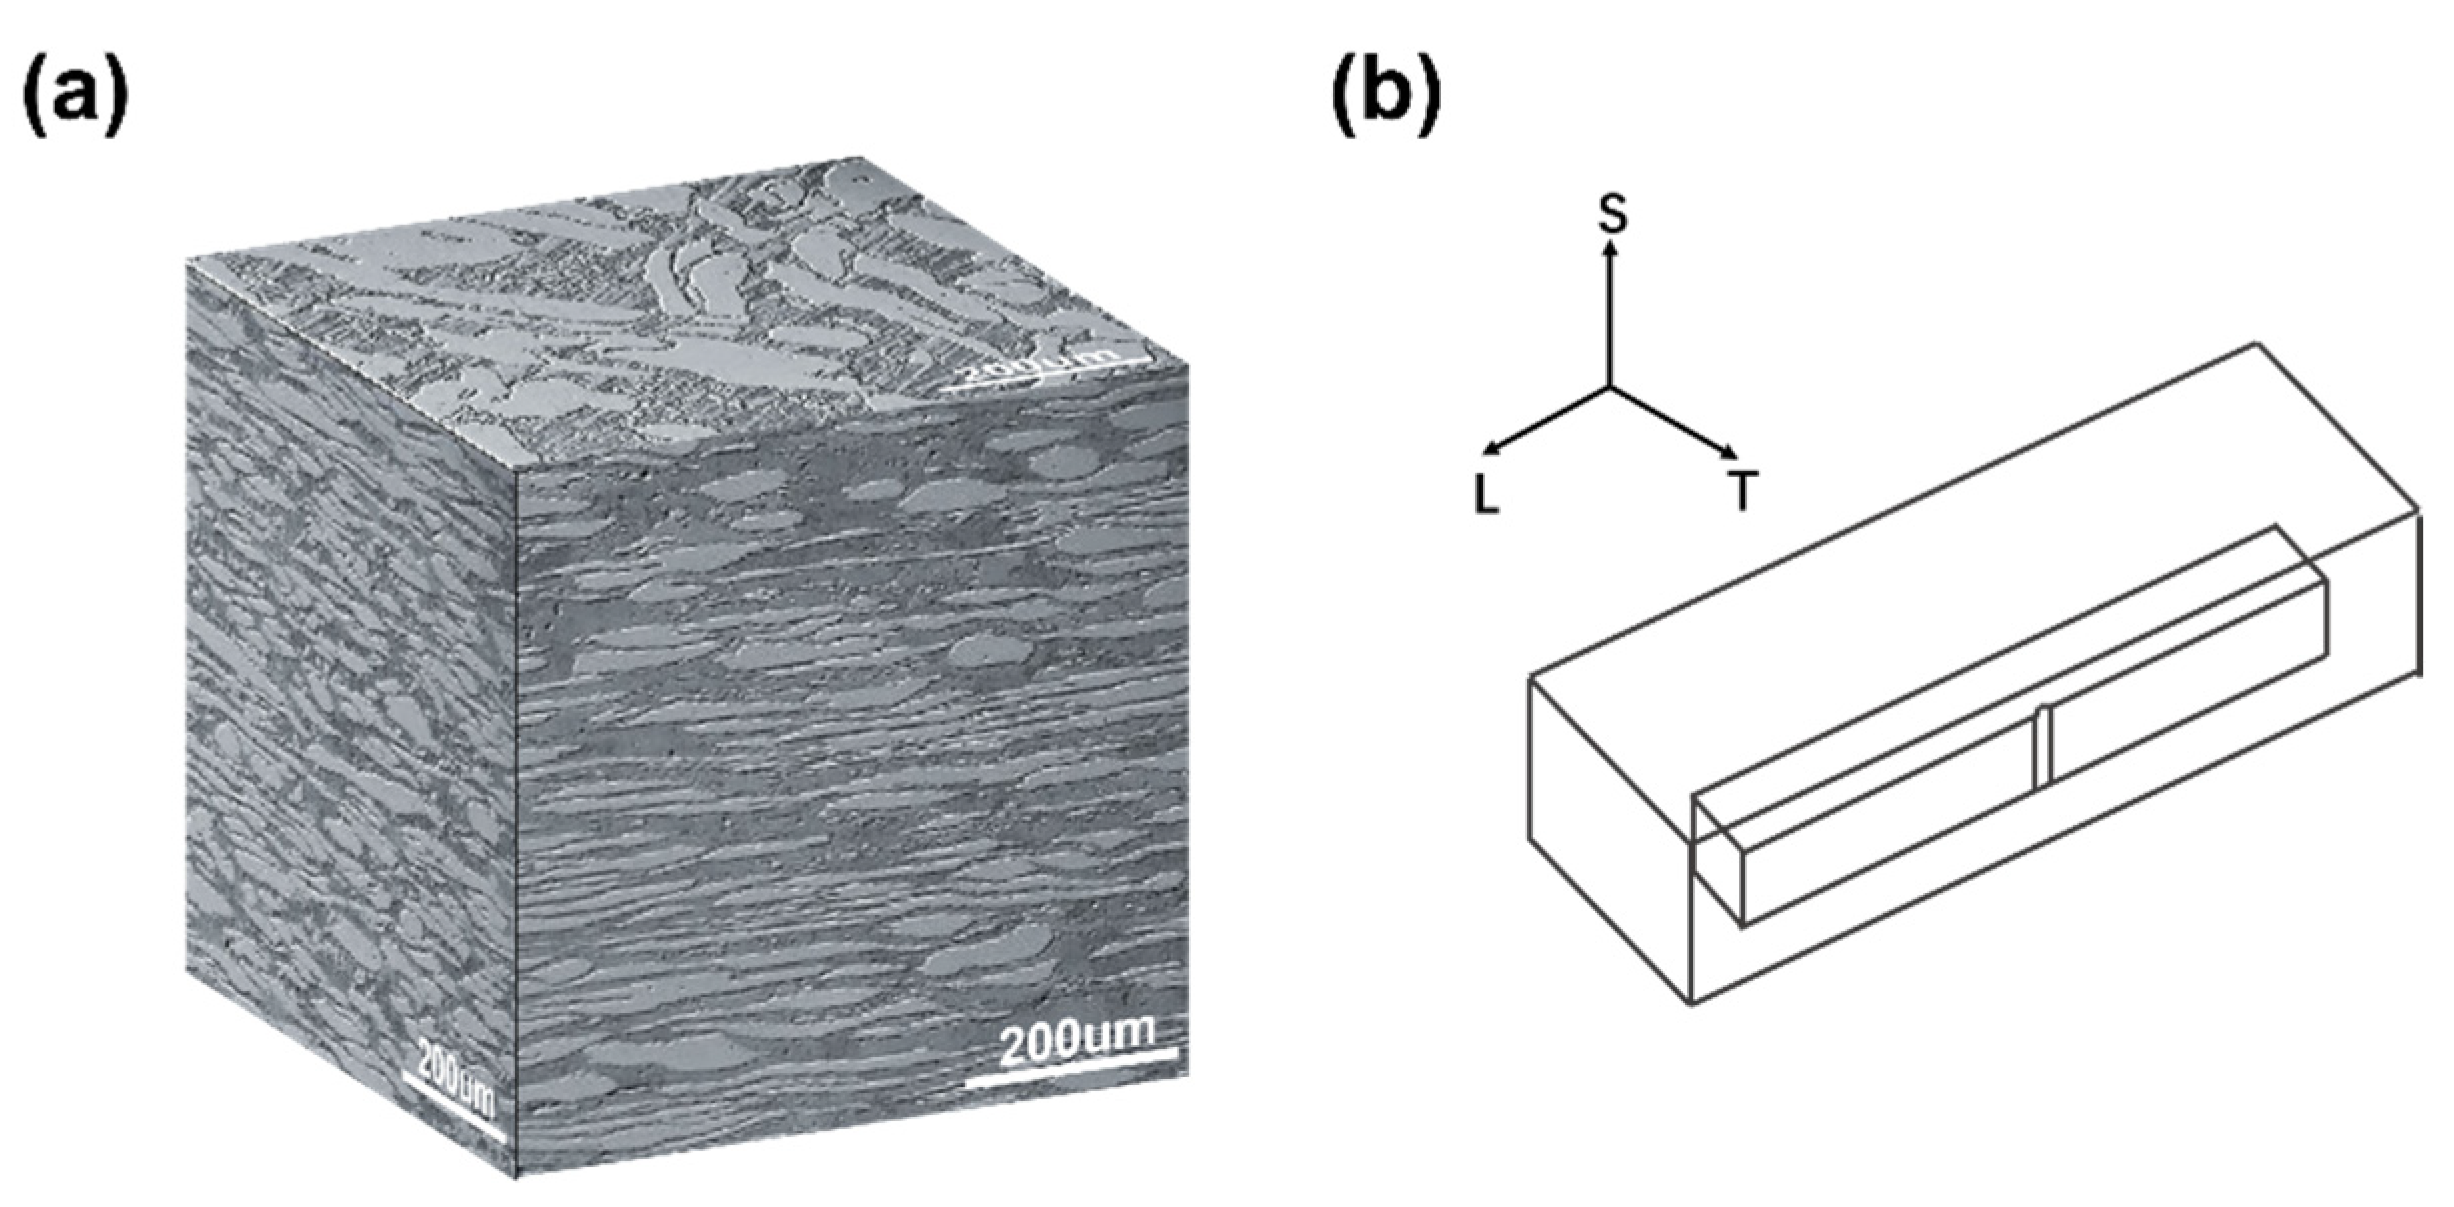
Figure 1. (a) Three-dimensional representation of the as-received SAF 2507; (b) sketch of the half-size impact specimens. S, normal direction; L, rolling direction; T, transverse direction.
Crystals 13 00243 g001
Figure 2. XRD patterns of SAF 2507 aged at 500 °C for 1000 h.
Crystals 13 00243 g002
Figure 3. (a) The schematic diagram of the SANS measurement setup with a transverse saturation magnetic field (1.1 T); (b) the 2D scattering pattern of SAF 2507 aged at 500 °C for 100 h.
Crystals 13 00243 g003
Figure 4. (a) SANS data of the unaged alloy fitted by Equation (1); (b) SANS data of alloys aged at 500 °C for 100 h, fitted by Equation (2).
Crystals 13 00243 g004
Figure 5. (a) Evolution of macro-hardness and micro-hardness of different phases with aging time; (b) evolution of impact energy (at room temperature) with aging time.
Crystals 13 00243 g005
Figure 6. (a) The morphology of the fractured Charpy-V impact toughness specimens. The notch is at the bottom of the images. Fracture surfaces of impact toughness specimens: (b) unaged; (c) 1 h aged; (d) 10 h aged; (e) 100 h aged; (f) 1000 h aged.
Crystals 13 00243 g006
Figure 7. (a) Potentiodynamic polarization curves of SAF 2507 specimens in 1.5 mol/L NaCl solution; (b) variation trend of passivation region with aging time, compared to the evolution of hardness and impact energy.
Crystals 13 00243 g007
Figure 8. The surface morphology of SAF 2507 after anodic polarization in 0.01 mol/L HCl + 1.5 mol/L NaCl: (a) unaged specimen; specimens aged for (b,c) 100 h, and (d,e) 1000 h.
Crystals 13 00243 g008
Figure 9. SANS data of SAF 2507 aged at 500 °C up to 1000 h.
Crystals 13 00243 g009
Figure 10. (a) Characteristic parameters d and of PS after aging for different times at 500 °C; (b) comparison between the variation trend of AP and properties of SAF 2507.
Crystals 13 00243 g010
Table 1. Chemical composition of the investigated SAF 2507 alloy.
ElementFeCNSiPCrMnNiCuMo
Content (%)Bal.0.0150.300.470.02425.350.716.400.203.68
Table 2. The characteristic parameters of phase separation.
Aging Time (h)IPS (cm−1)QP−1)d (Å)SLD (× 10−62)AP (at.%)
10.20.08375.70.3727.5
10014.70.044142.81.8036.0
100075. 40.029216.72.2244.4
Disclaimer/Publisher’s Note: The statements, opinions and data contained in all publications are solely those of the individual author(s) and contributor(s) and not of MDPI and/or the editor(s). MDPI and/or the editor(s) disclaim responsibility for any injury to people or property resulting from any ideas, methods, instructions or products referred to in the content.