


New Insights into the Geochemical Processes Occurring on the Surface of Stuccoes Made of Slaked Lime Putty

 , ,
, ,
Abstract
:1. Introduction
2. Materials and Methods
2.1. Test Tubes
2.2. Conditions for Execution of Test Tubes and for Extraction and Conservation of Samples
2.2.1. Environmental Conditions
2.2.2. Time Sequence
2.2.3. Extraction System
2.3. Instrumentation
3. Results and Discussion
3.1. POM
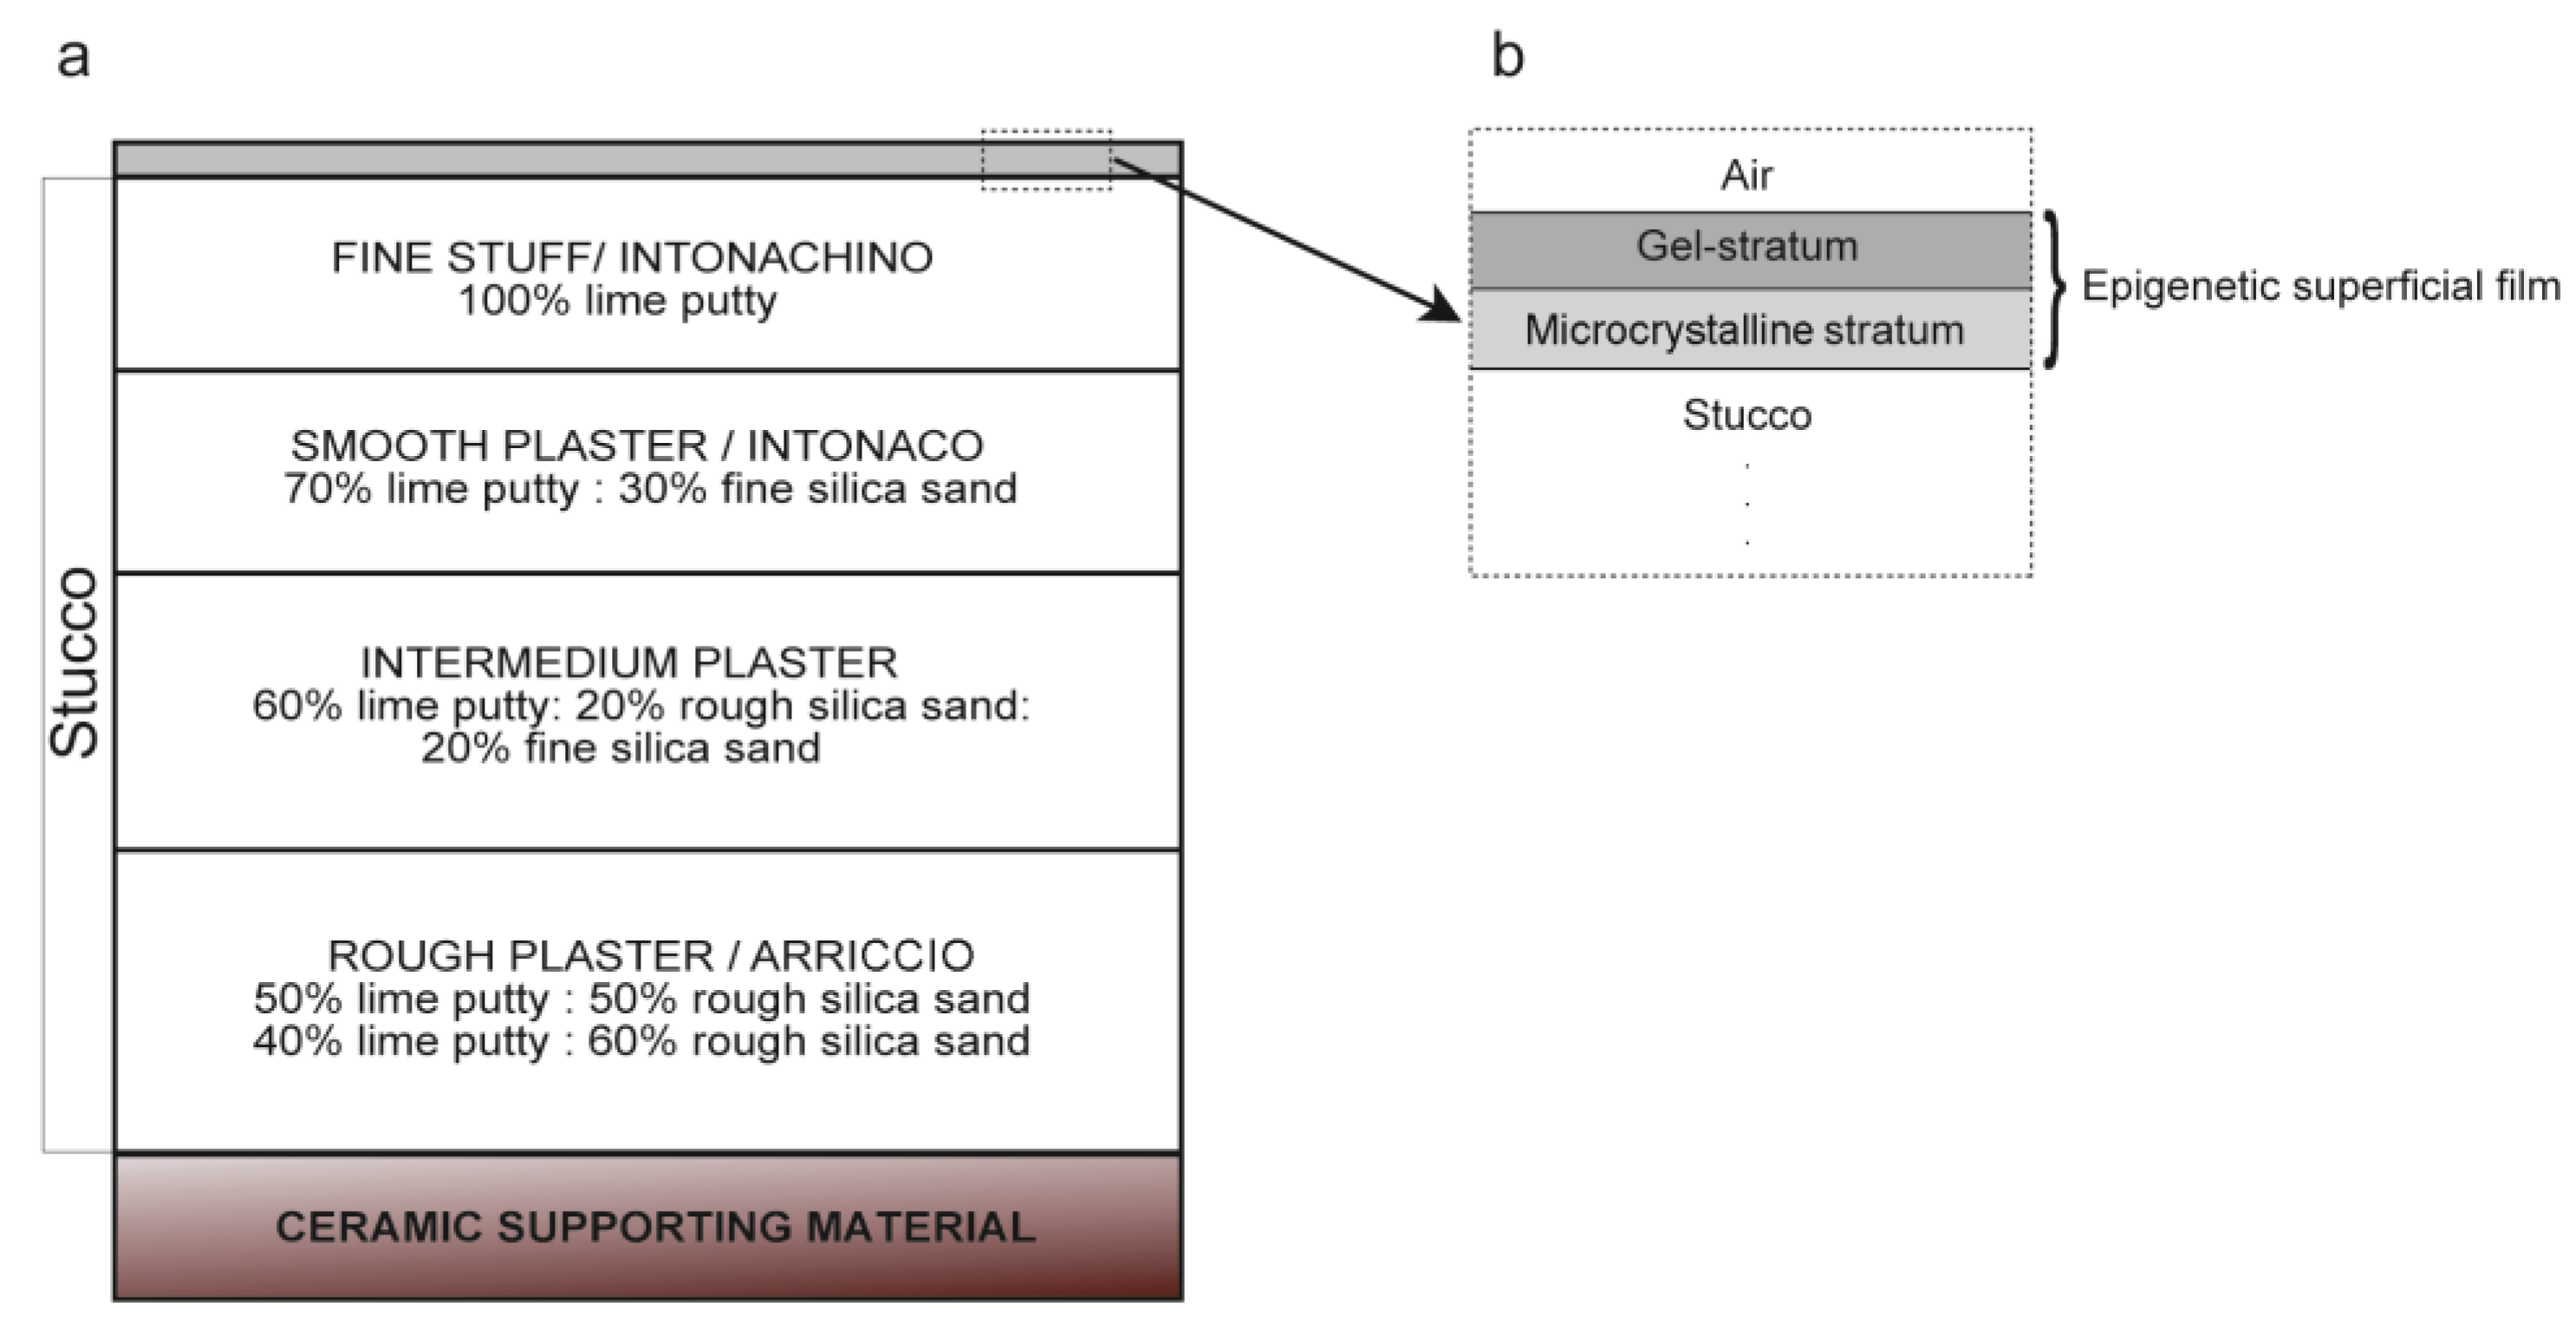
- Gel-like stratum:
- ○
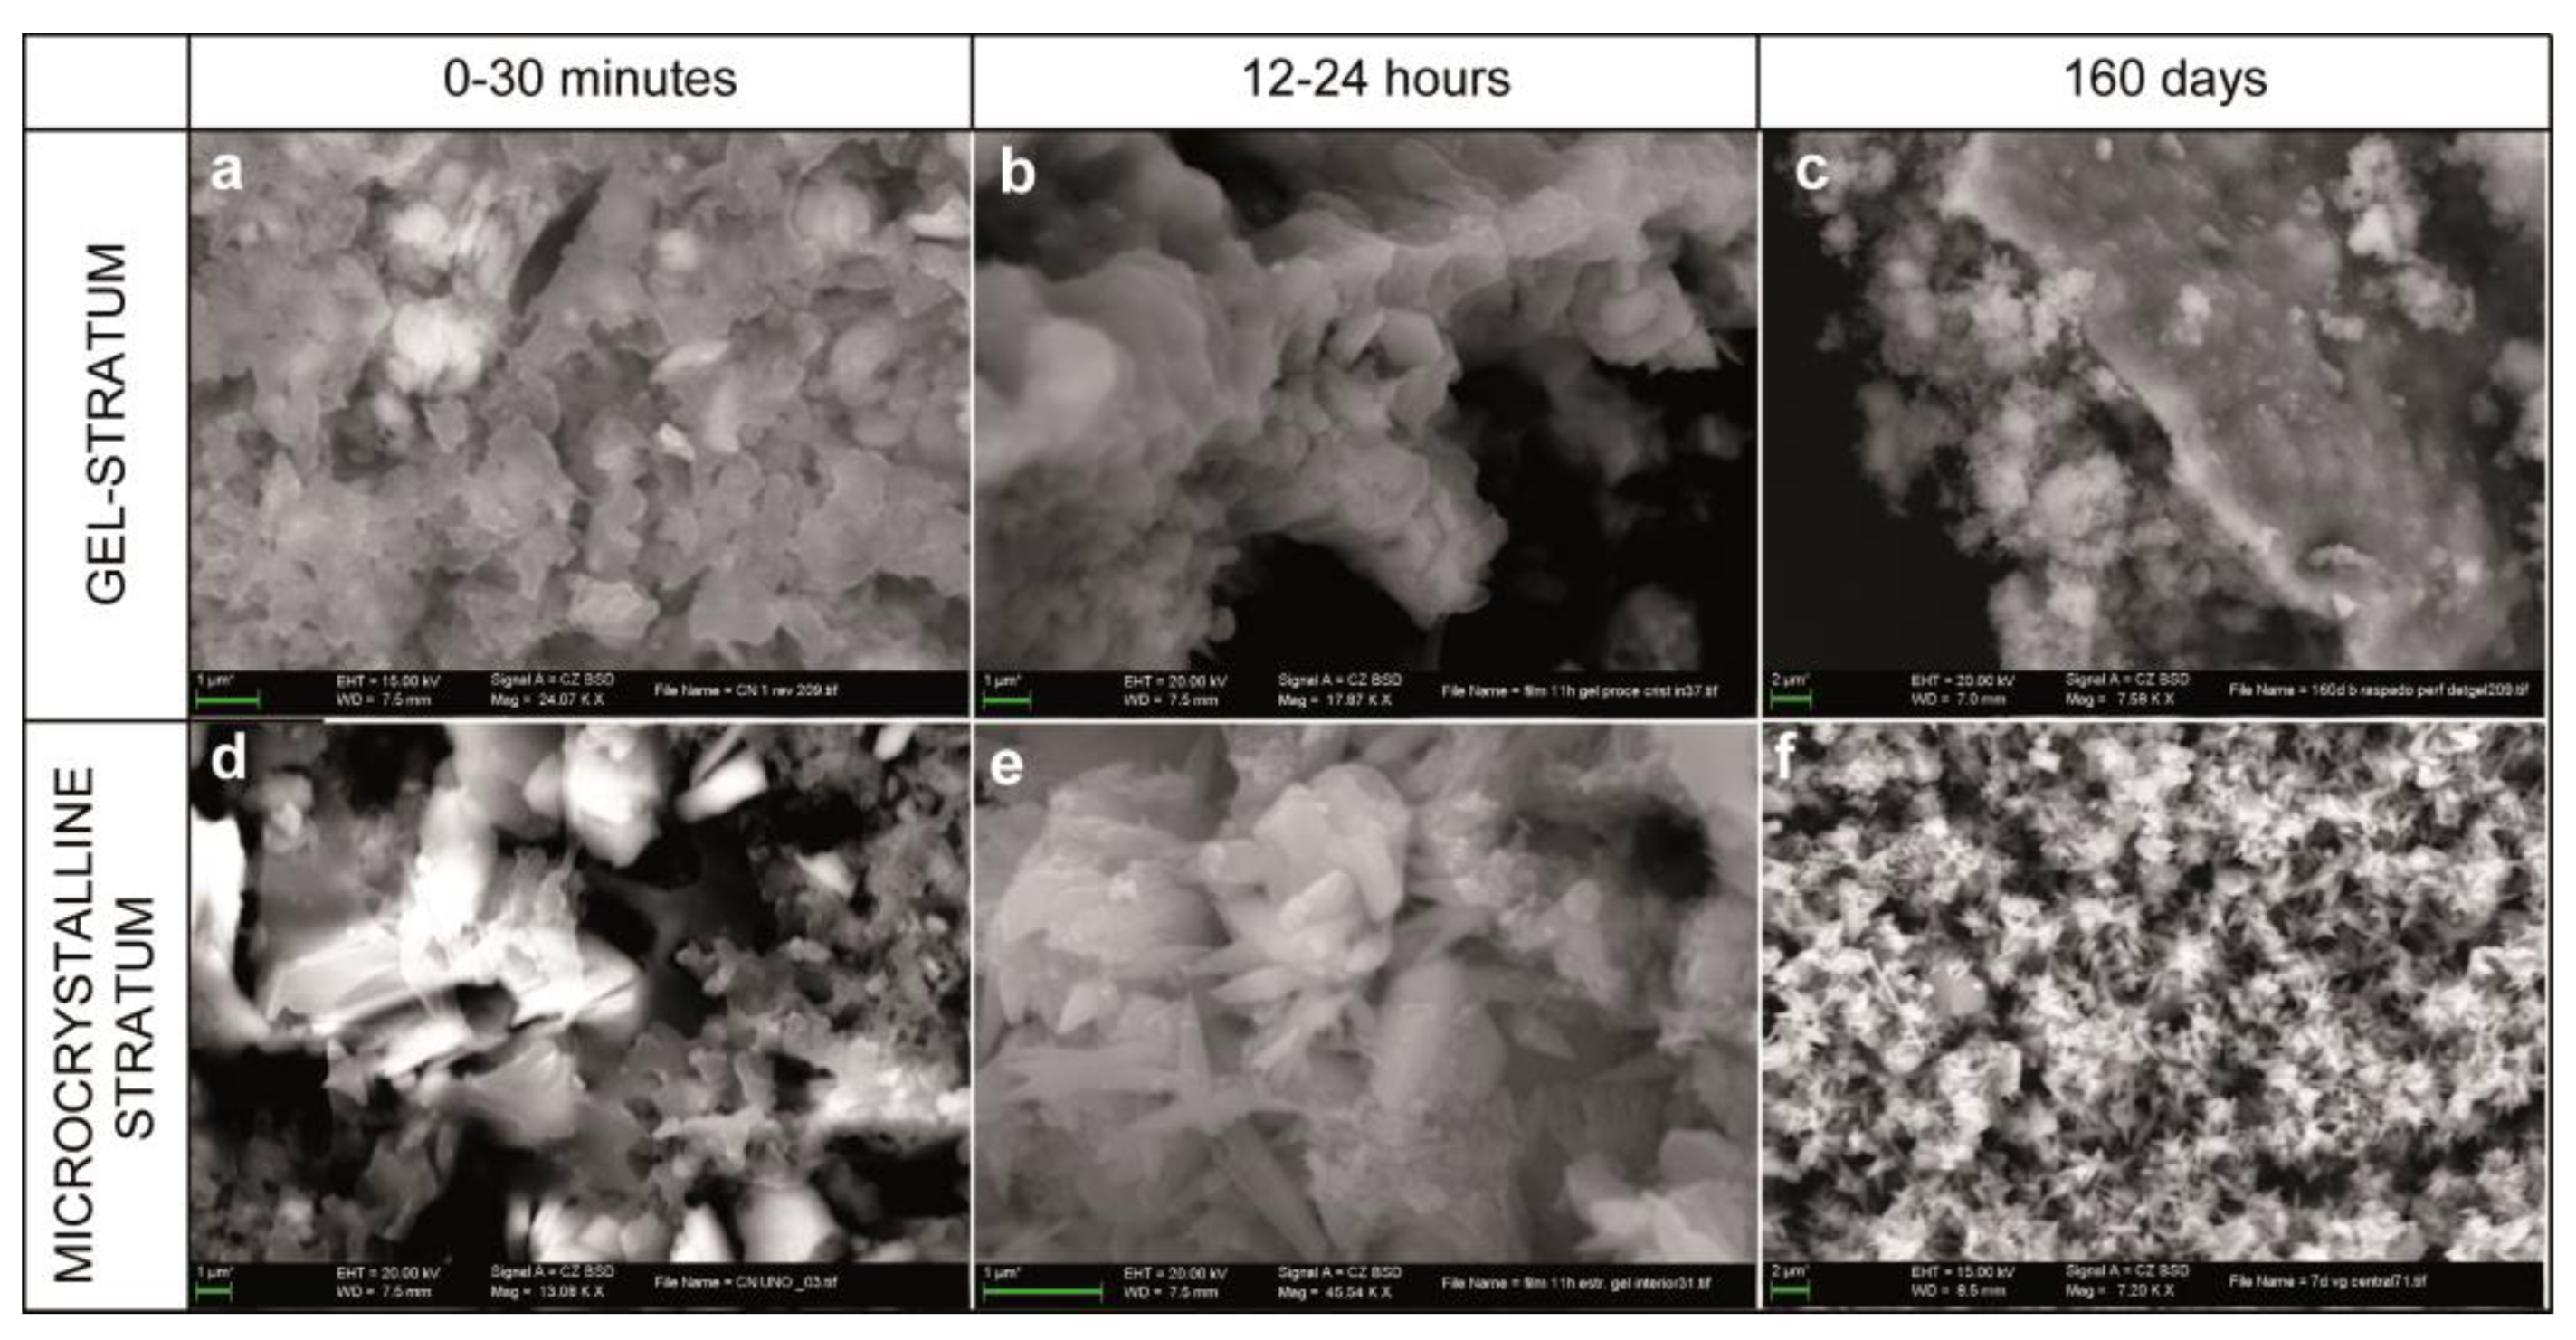
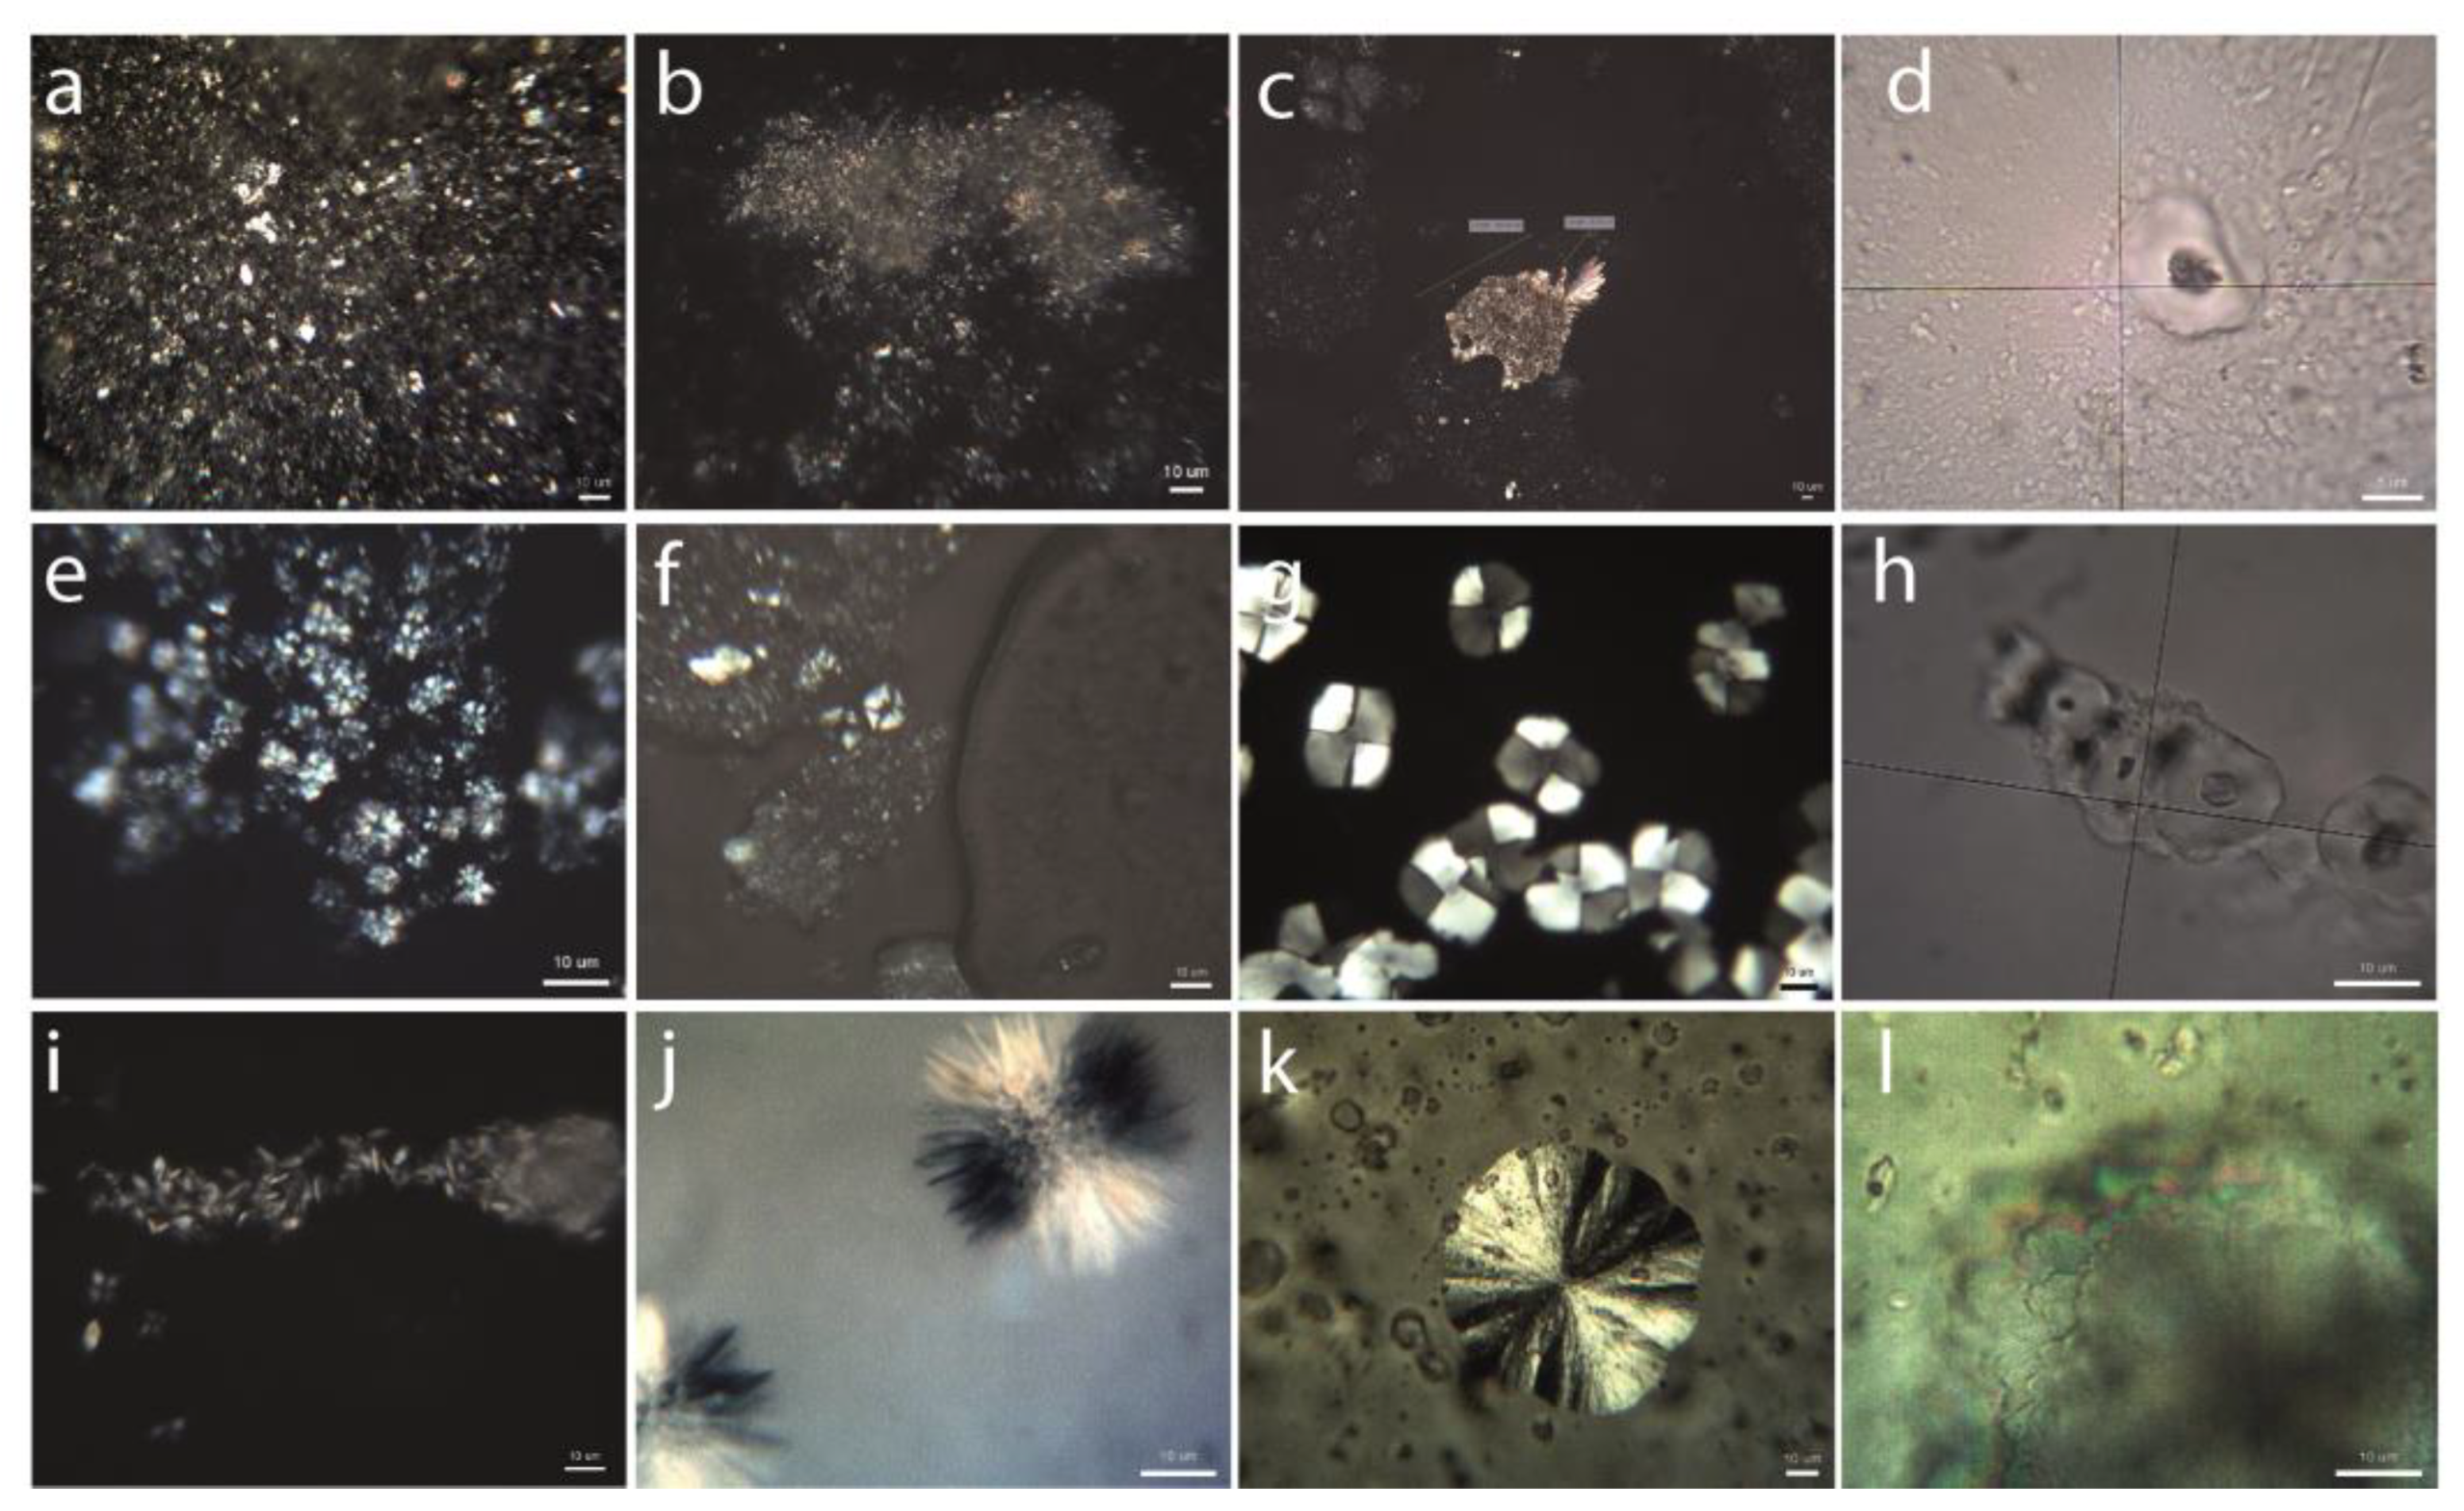
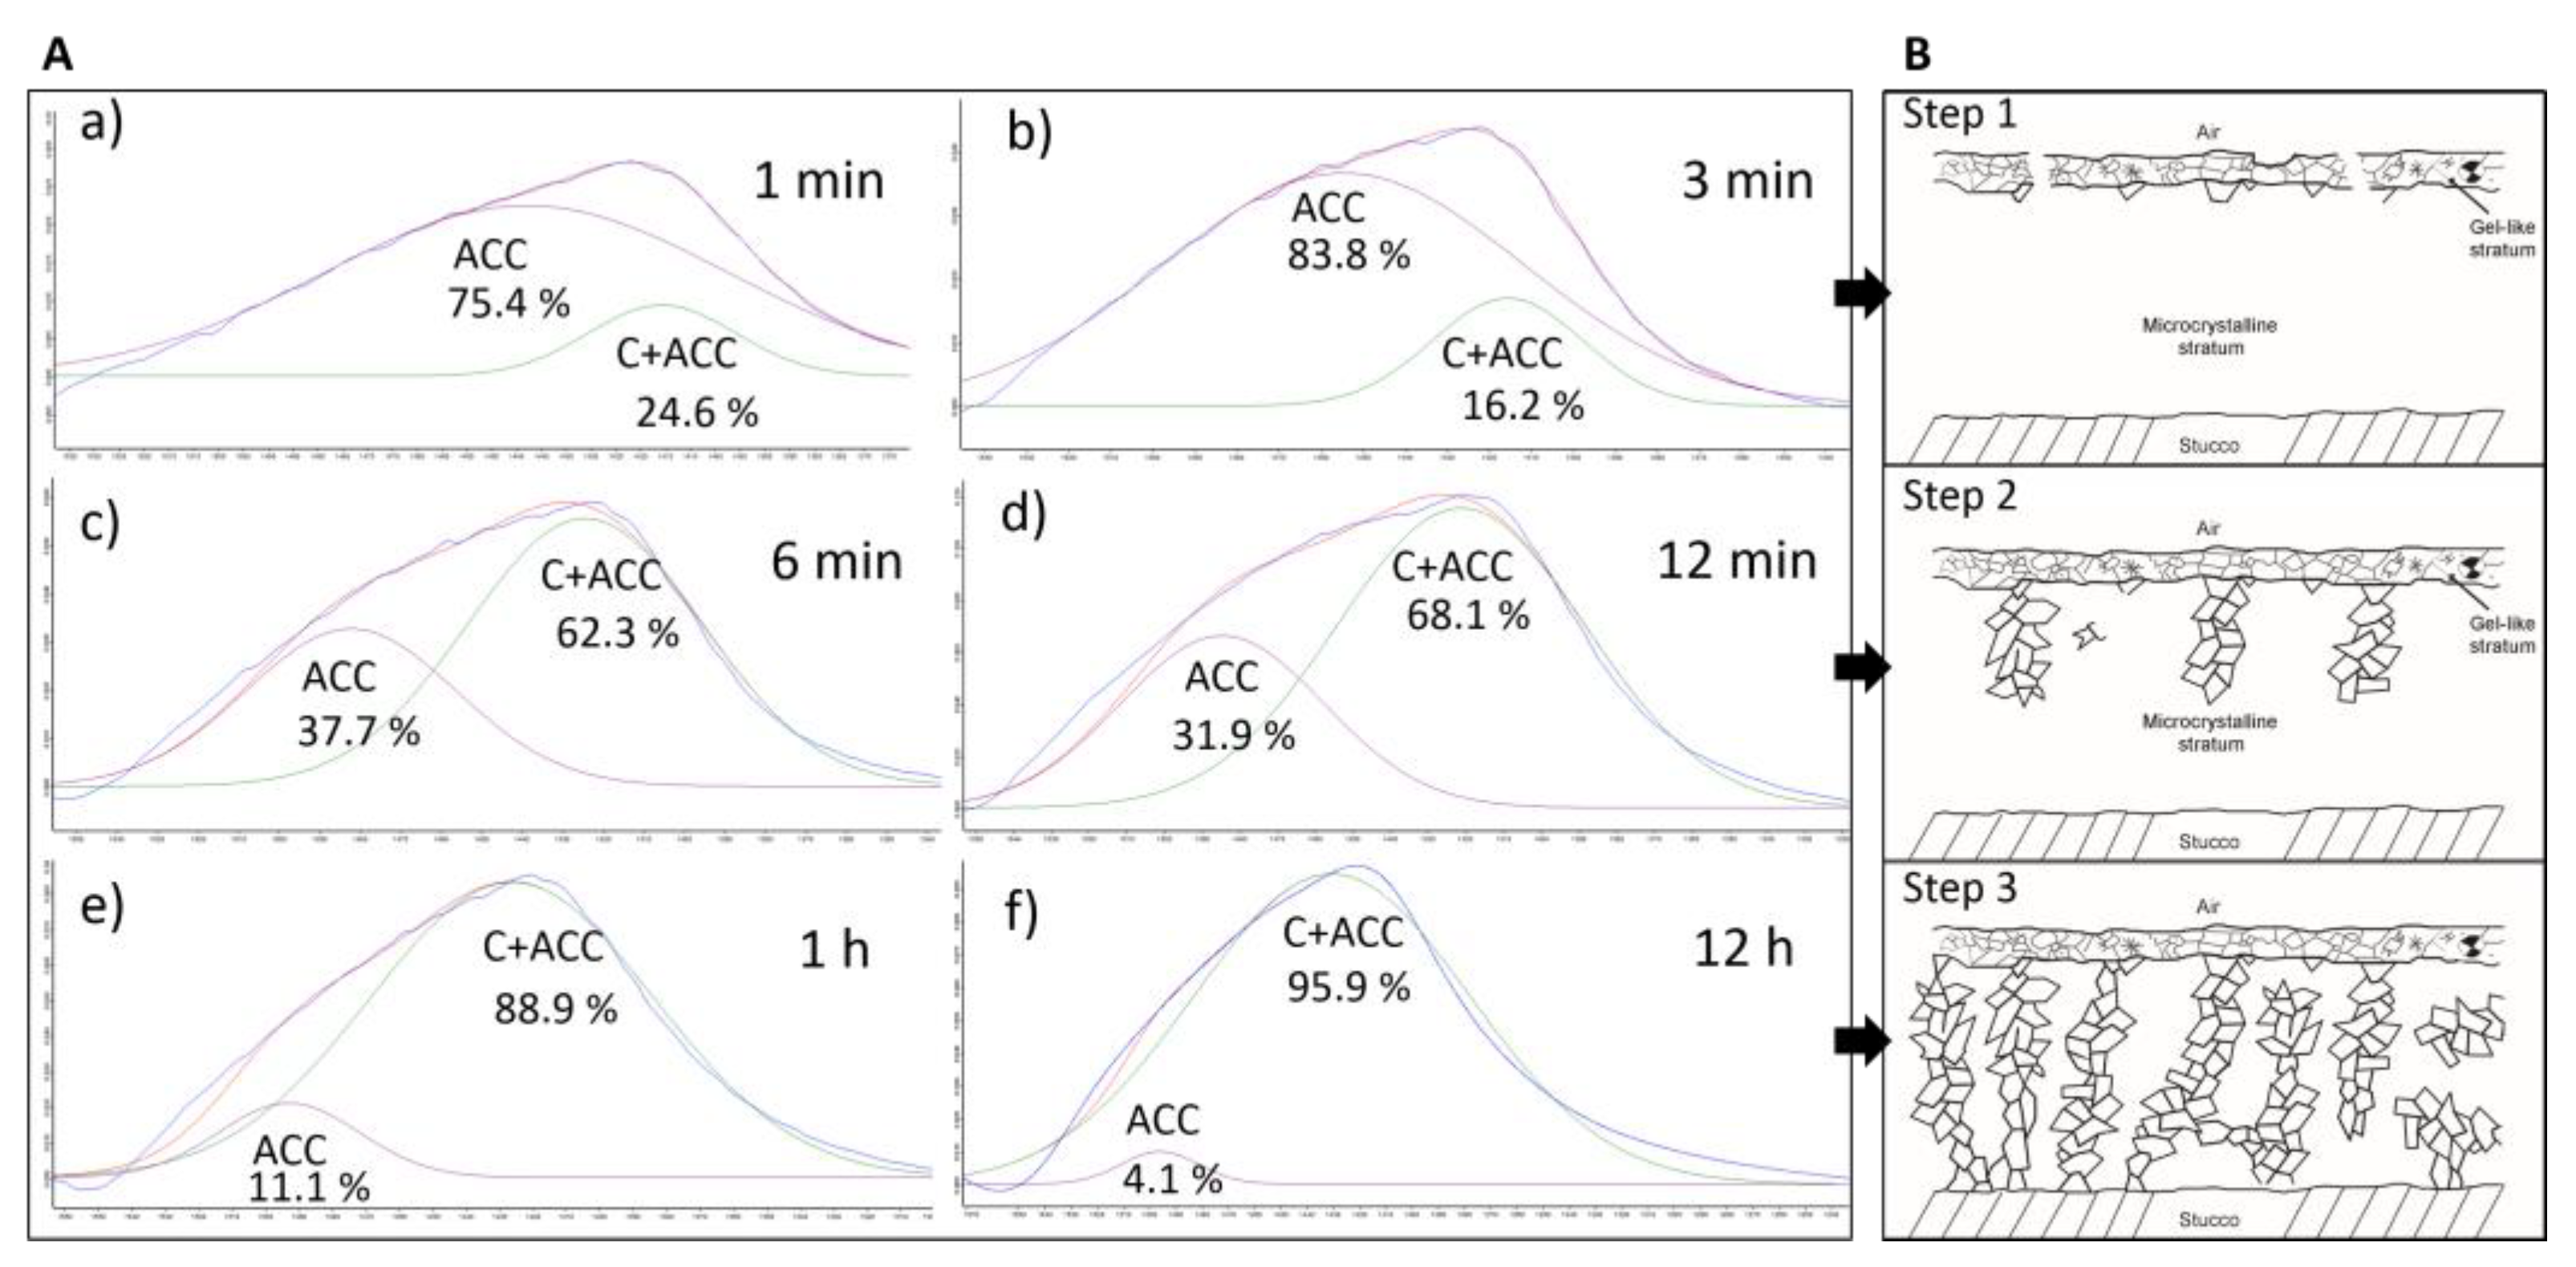
- External face (Figure 2a): It is exposed to the atmosphere. Translucent, with a microgranular texture and low birefringence, it is composed of a nebula of sub-micrometer particles that, in association with each other, present an incipient anisotropy. It is observed from 3 min after the execution of the stucco. As it evolves, it increases both in thickness and birefringence, acquiring a soft golden hue over time. Formation of this nebula does not seem to depend on standard aerial carbonation processes that require longer timeframes as stated by [21].
- ○
- Internal face (Figure 2b): It is composed of a granular mass of sub-micrometric crystals.
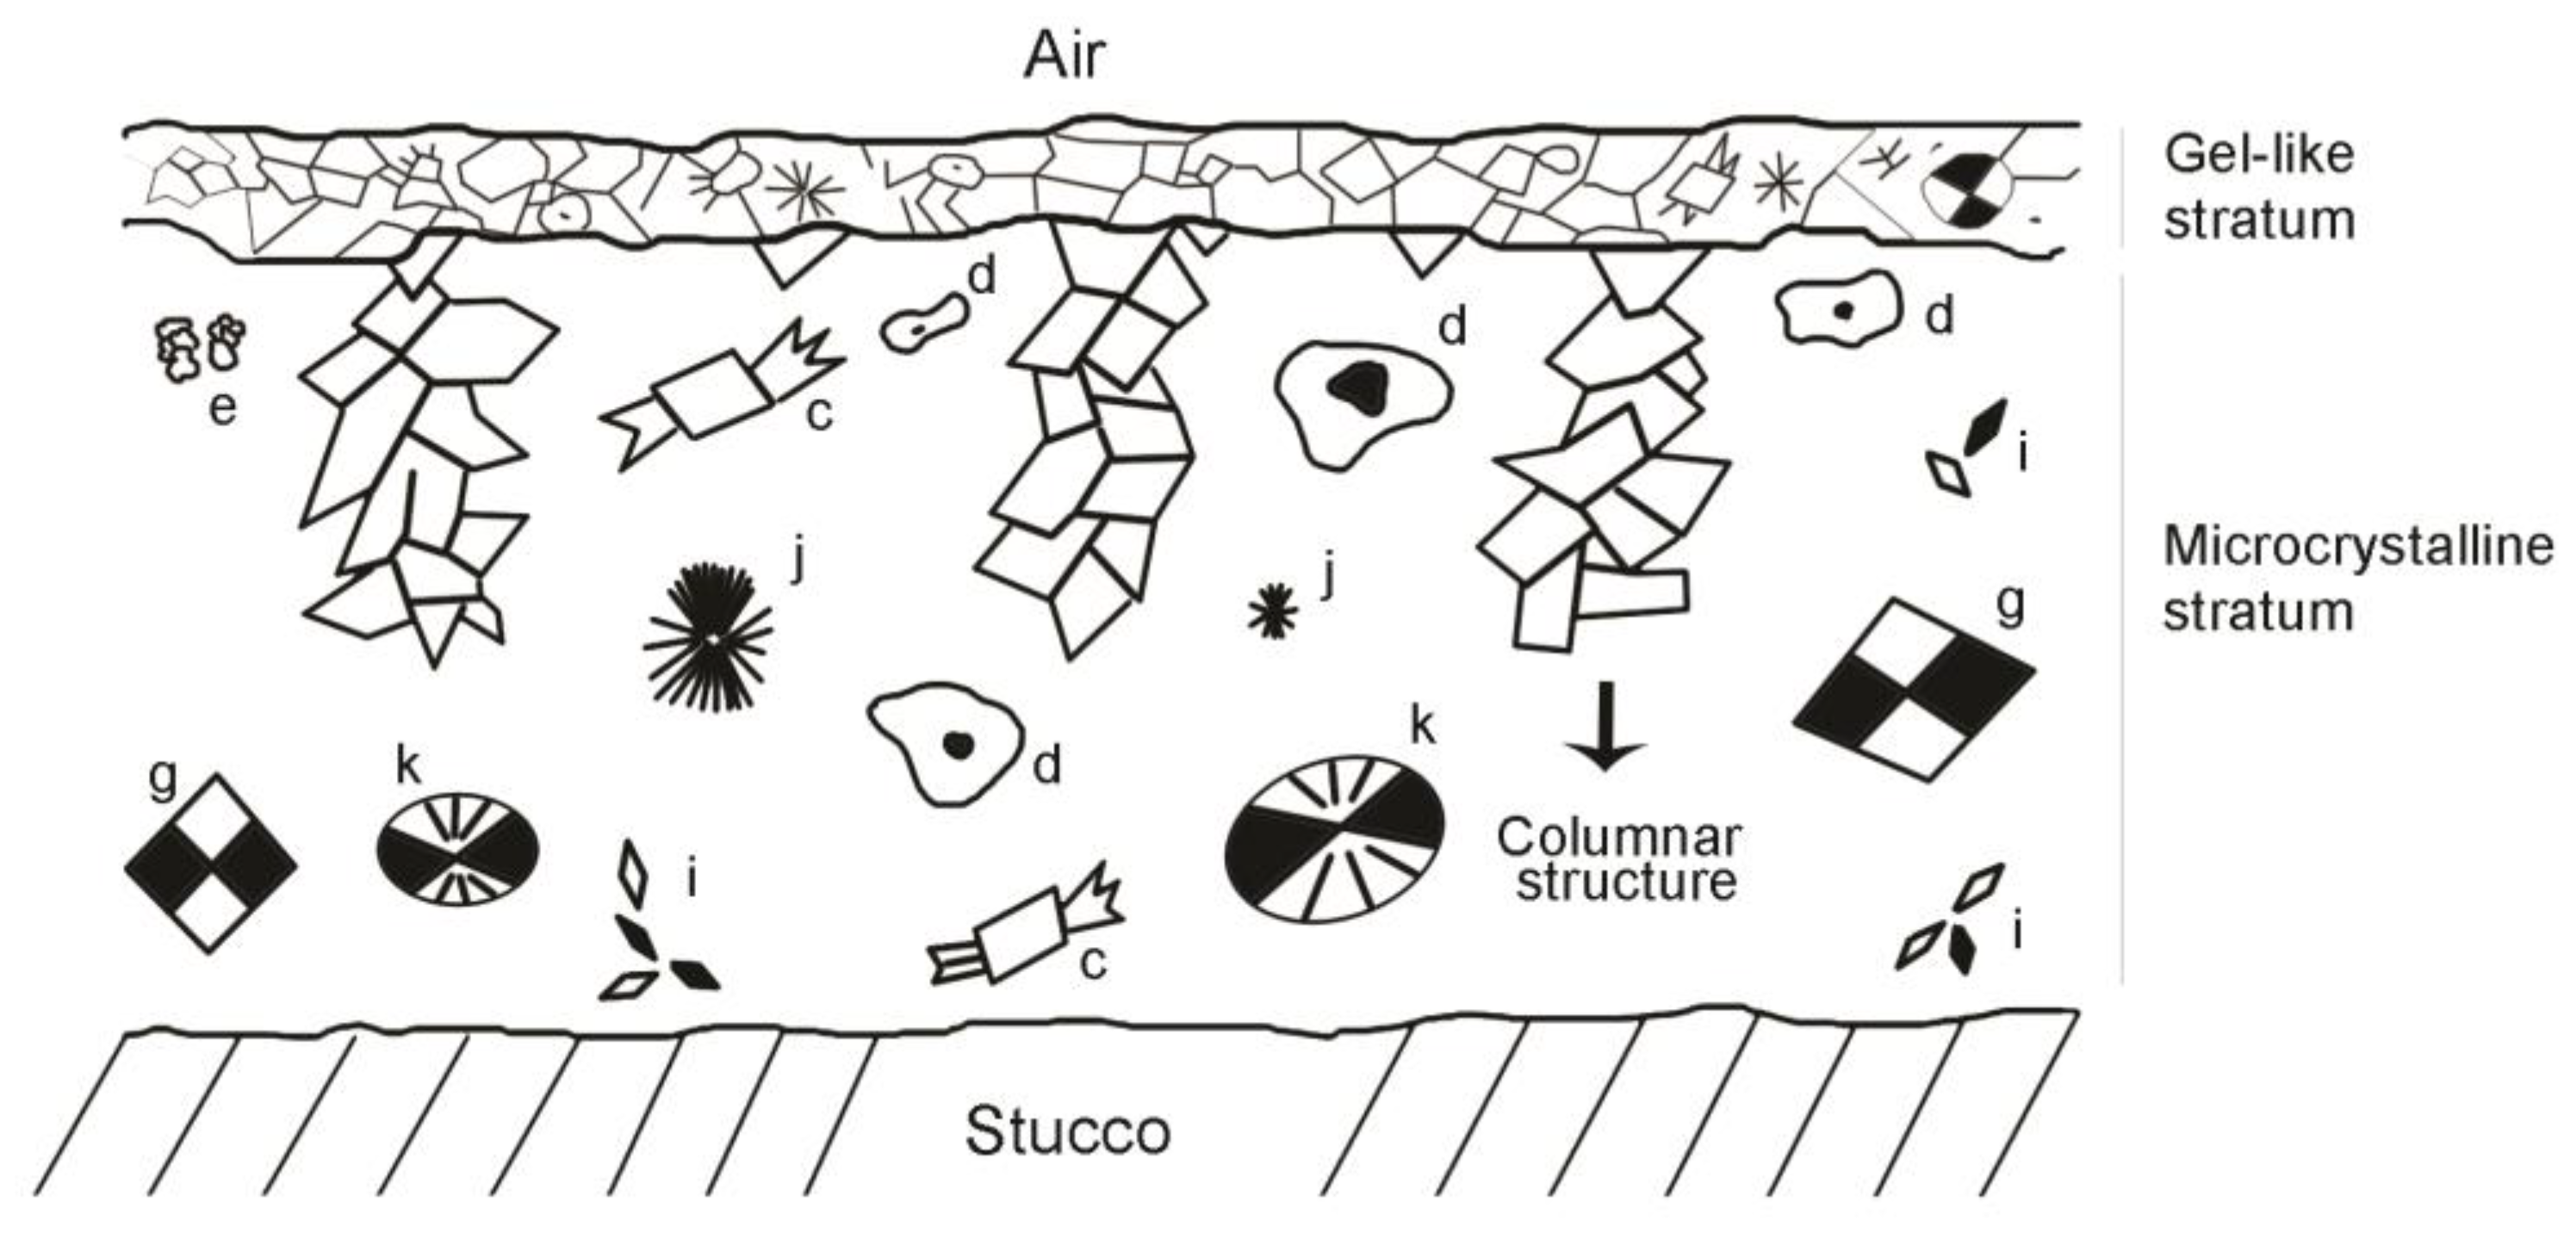
- Underlying microcrystalline stratum: It is located between the gel-like stratum and the stucco surface and formed by crystalline aggregates of different kinds:
- ○
- Aggregates of particles with an amoeboid, botryoidal morphology (Figure 2c–f) arising from the components of slaked lime (carbonate nanocrystals, colloidal particles and crystalline nuclei) generated during the drying process. These appear between 3 and 15 min after the execution of the stucco, by heterogeneous nucleation on the pre-existing components. Aggregates of amoeboid particles evolve via the mechanism of crystal growth in sectors [28], forming subeuhedral (botryoidal) crystals with curved faces that present black–white checkered interference colors (Figure 2g–h).
- ○
- Fibrous aggregates of acicular crystals with a polycrystalline nucleus (Figure 2i). These are observed during the first 3 min after execution. After this period, they disaggregate, giving rise to isolated crystals with an acicular, tubular morphology.
- ○
- Three-dimensional (Figure 2j) or flat (Figure 2g,k) spherulite-type fibroradial aggregates. These are observed during the first minutes after preparation of the test tube. They are of variable size but always in the micrometric order. The flat spherulites (Figure 2l) can group irregularly by stacking along the C axis. Each spherulite has a different rotation angle to the one before [28]. These crystals evolve by growth in sectors the quadrants of which can become disaggregated.
3.2. SEM
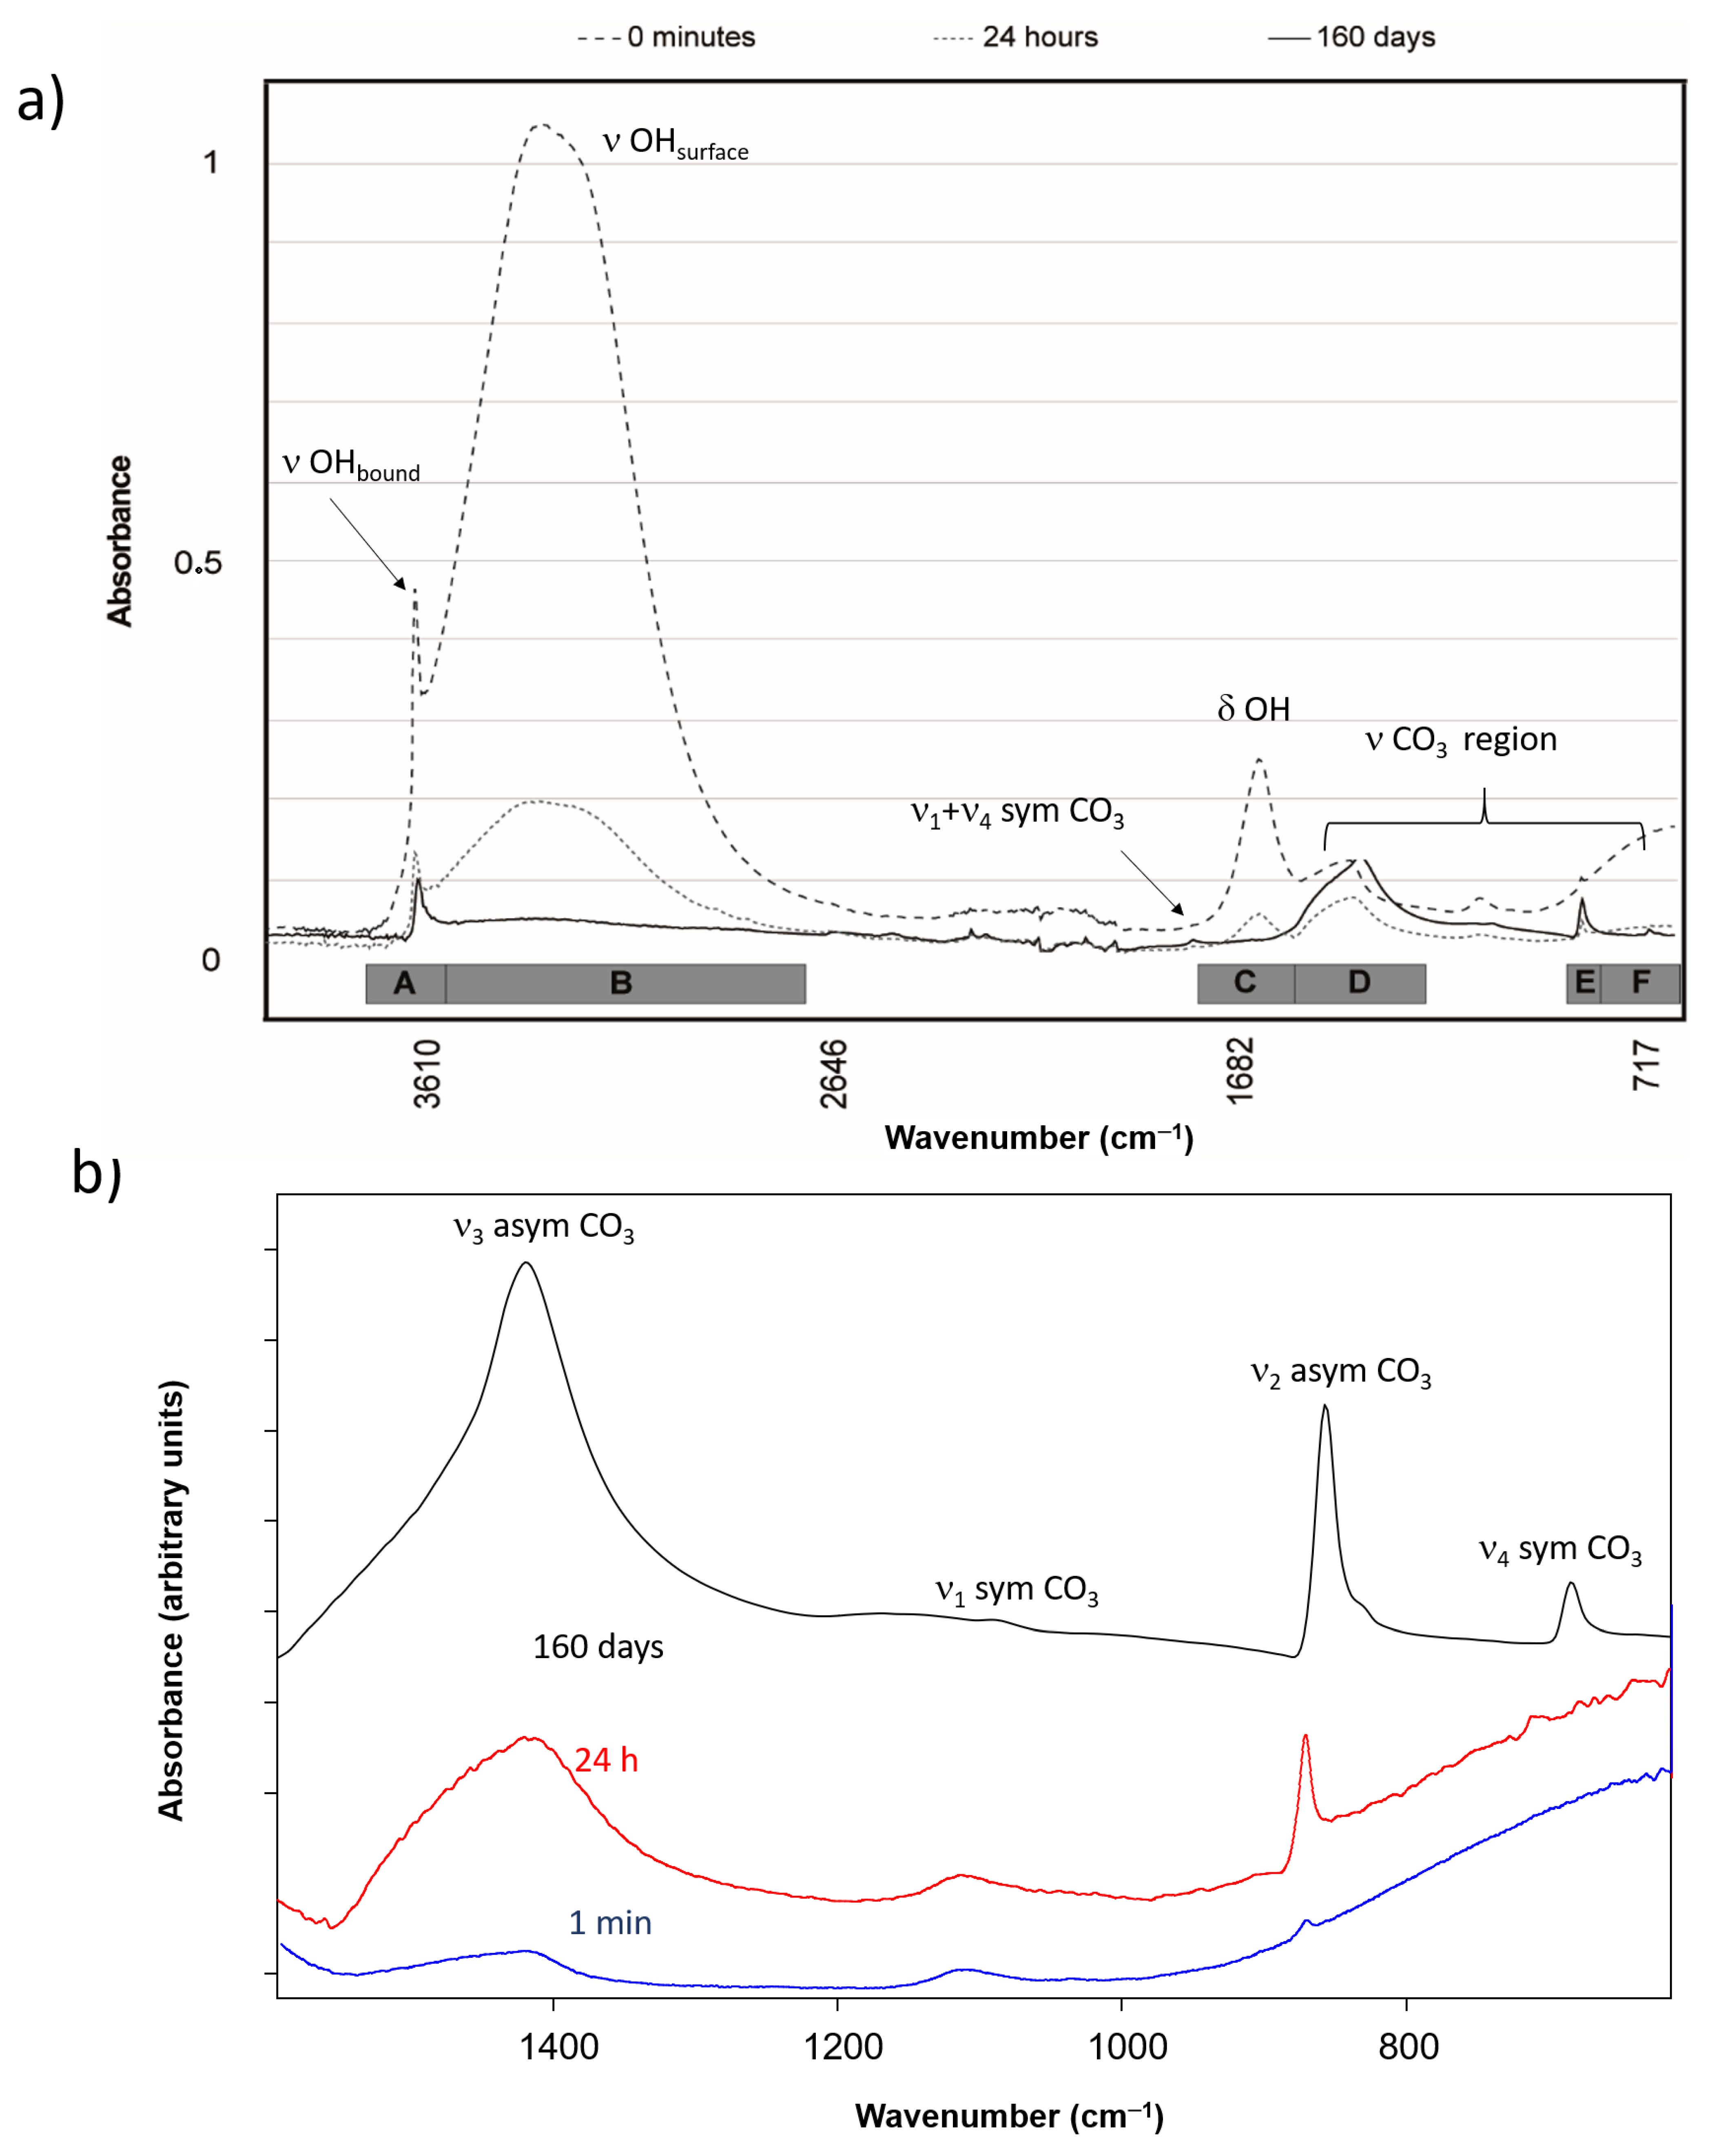
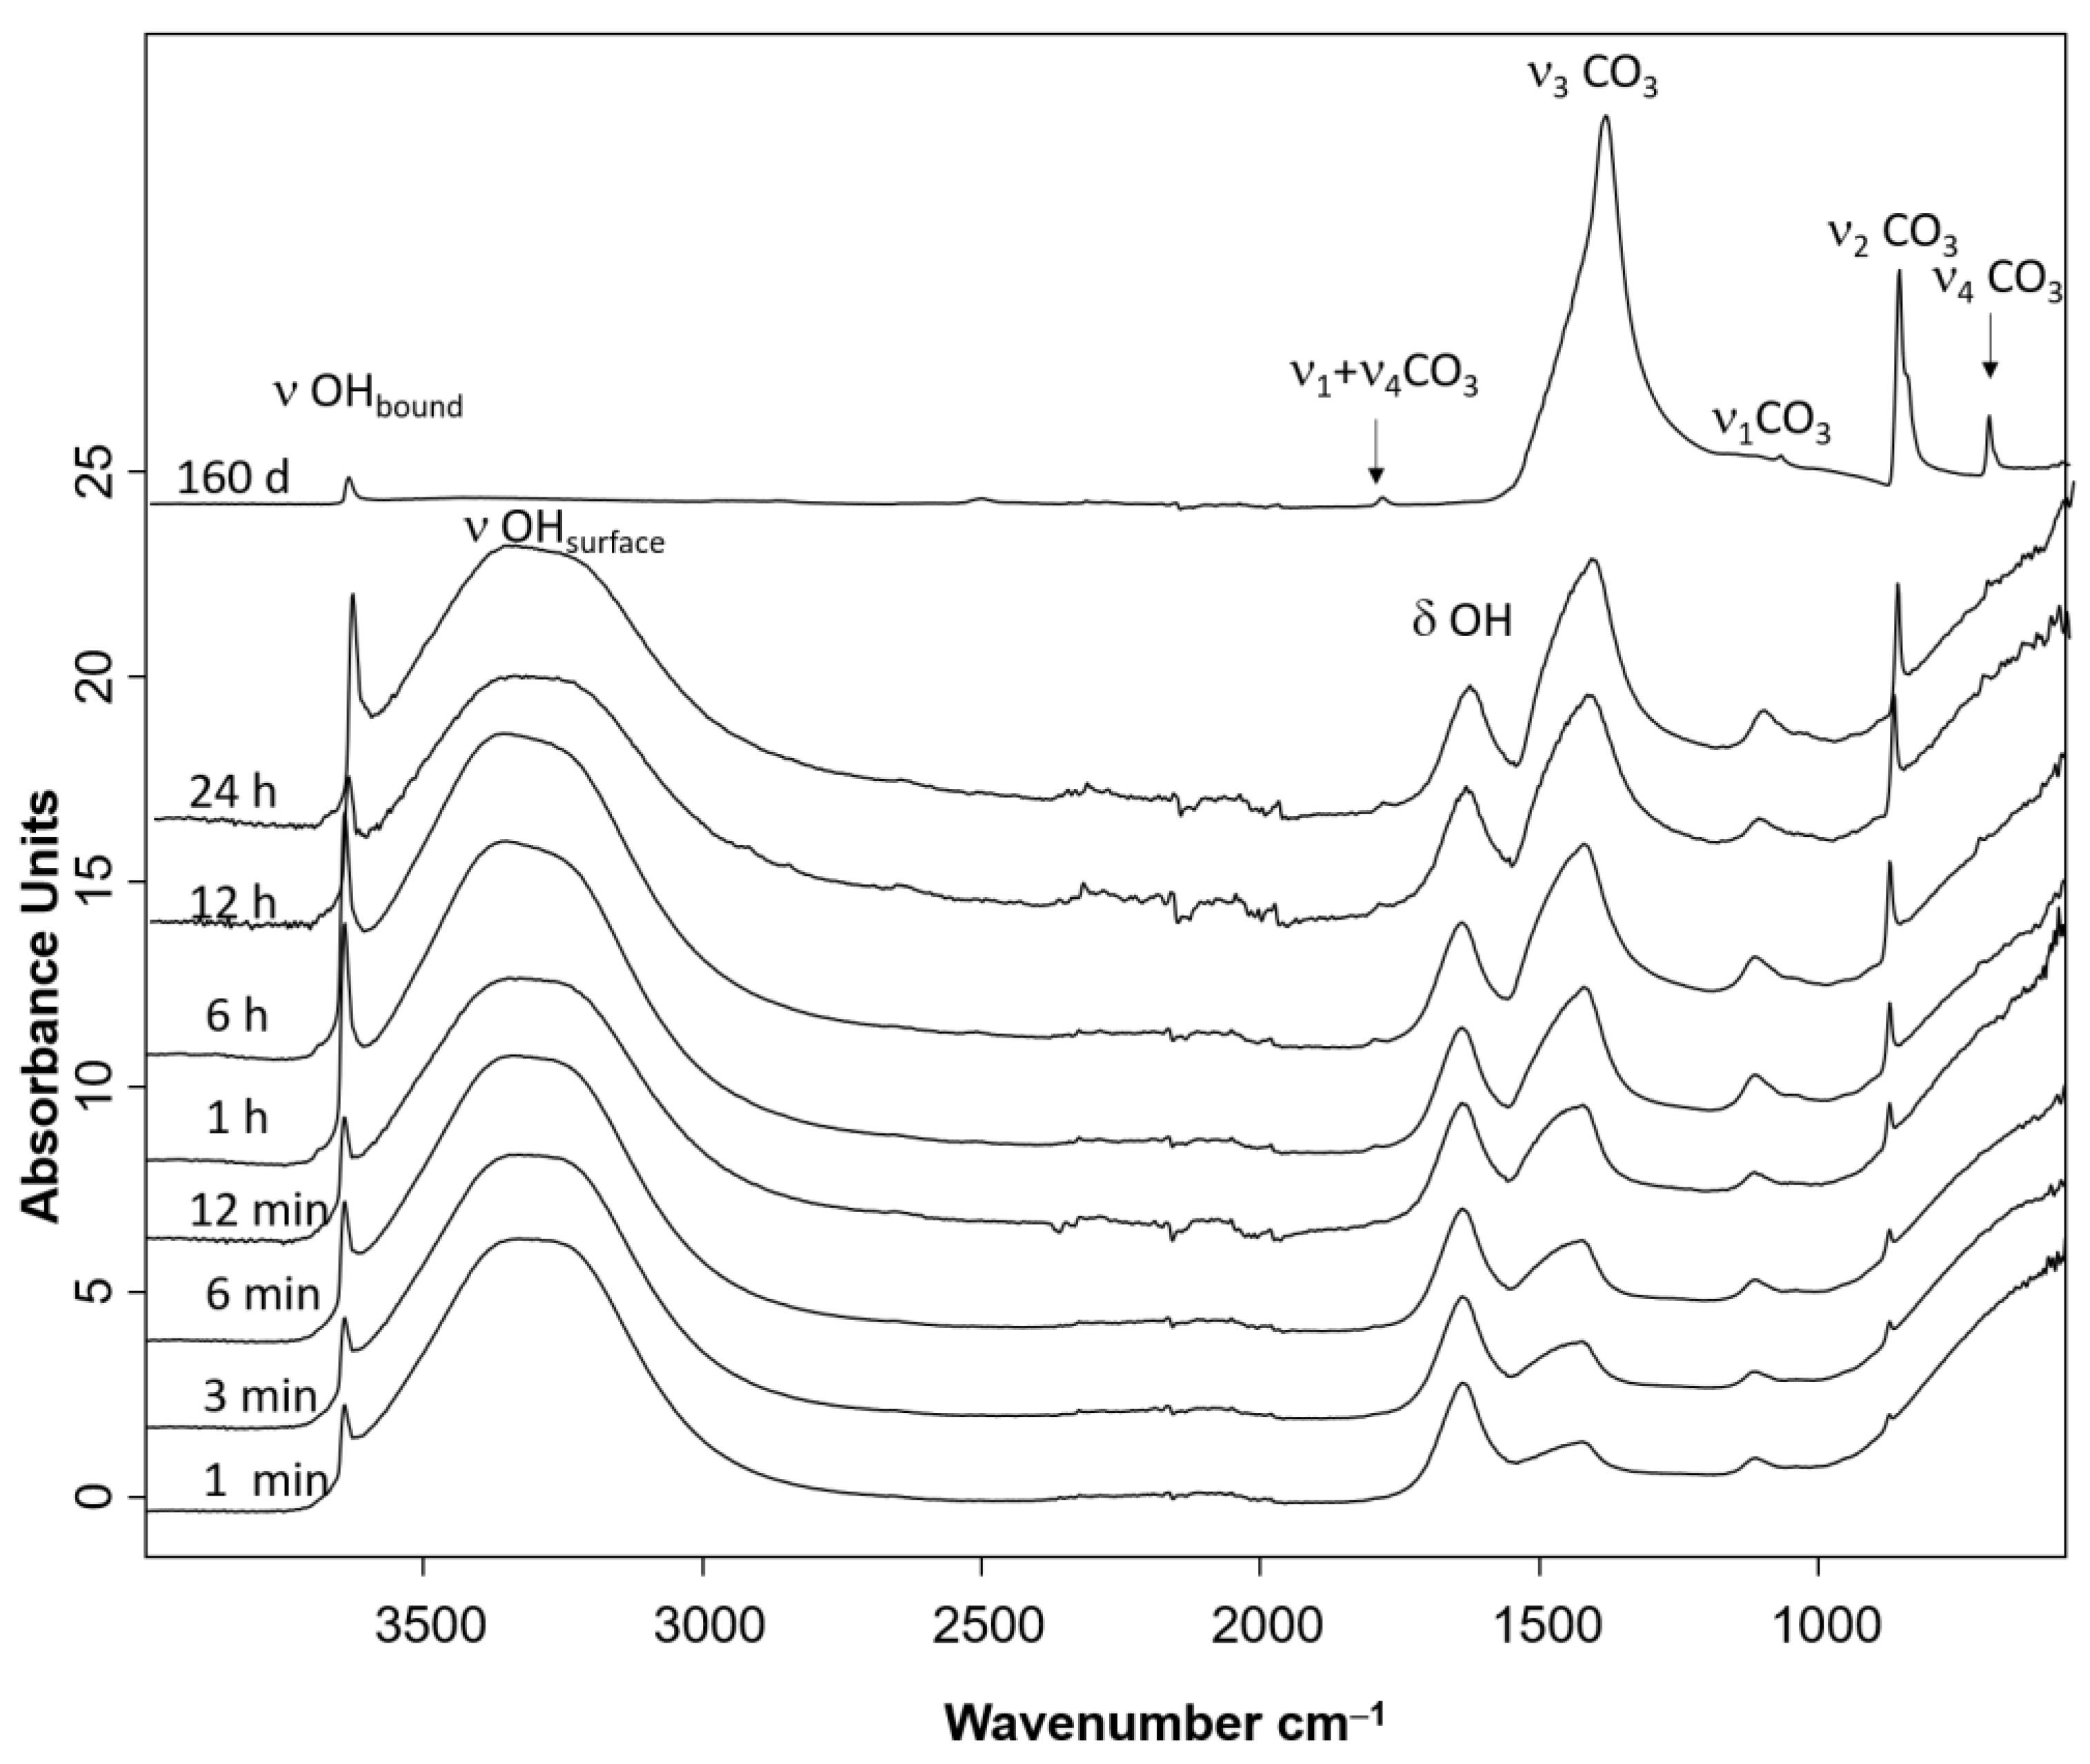
3.3. FTIR Spectroscopy
4. Discussion

5. Conclusions
Author Contributions
Funding
Data Availability Statement
Acknowledgments
Conflicts of Interest
References
- Van Balen, K.; Van Gemert, D. Modelling lime mortar carbonation. Mater. Struct. 1994, 27, 393–398. [Google Scholar]
- Rodriguez-Navarro, E.; Hansen, E.F.; Ginell, W.S. Calciuem hydroxide crystal evolution upon aging of lime putty. J. Am. Ceram. Soc. 1998, 81, 3032–3034. [Google Scholar] [CrossRef]
- Cazalla, O.; Rodriguez-Navarro, C.; Sebastian, E.; Cultrone, G.; De la Torre, M.J. Aging of Lime Putty: Effects on Traditional Lime Mortar Carbonation. J. Am. Ceram. Soc. 2000, 83, 1070–1076. [Google Scholar]
- Hansen, E.F.; Tagle, A.; Erder, E.; Baron, S.; Connell, S.; Rodriguez-Navarro, C.; Van Balen, K. Effects of aging on lime putty. In Proceedings of the 12: International RILEM Workshop on Historic Mortars: Characteristics and Tests, Paisley, Scotland, 12–14 May 1999. [Google Scholar]
- Rodriguez-Navarro, C.; Cazalla, O.; Elert, K.; Sebastian, E. Liesegang pattern development in carbonating traditional lime mortars. Proc. R. Soc. Lond. A 2002, 458, 2261–2273. [Google Scholar] [CrossRef]
- Elert, K.; Rodriguez-Navarro, C.; Sebastian, E.; Hansen, E.; Cazalla, O. Lime Mortars for the Conservation of Historic Buildings. Stud. Conserv. 2002, 47, 62–75. [Google Scholar] [CrossRef]
- Cazalla, O. Morteros de cal. Aplicación en el Patrimonio Histórico. Ph.D. Thesis, Universidad de Granada, Granada, Spain, 2002. [Google Scholar]
- Rodriguez-Navarro, C.; Ruiz-Agudo, E.; Ortega-Huertas, M.; Hansen, E. Nanostructure and Irreversible Colloidal Behavior of Ca(OH)2: Implications in Cultural Heritage Conservation. Langmuir 2005, 21, 10948–10957. [Google Scholar] [CrossRef] [PubMed]
- Cultrone, G.; Sebastian, E.; Ortega Huertas, M. Forced and natural carbonation of lime-based mortars with and without additives: Mineralogical and textural changes. Cem. Concr. Res. 2005, 35, 2278–2289. [Google Scholar] [CrossRef]
- Van Balen, K. Carbonation reaction of lime, kinetics at ambient temperatura. Cem. Concr. Res. 2005, 35, 647–657. [Google Scholar] [CrossRef]
- Lawrence, R.M. A Study of Carbonation in Non-Hydraulic Lime Mortars. Ph.D. Thesis, University of Bath, Bath, UK, 2006. [Google Scholar]
- Arandigoyen, M.; Álvarez, J.I. Proceso de carbonatación en pastas de cal con distinta relación agua-conglomerante. Mater. Construcción 2006, 56, 5–18. [Google Scholar]
- Ruiz-Agudo, E.; Rodriguez-Navarro, C. Microstructure and rehology of lime putty. Langmuir 2009, 26, 3868–3877. [Google Scholar]
- Mascolo, G.; Mascolo, M.C.; Vitale, A.; Marino, O. Microstructure evolution of lime putty upon aging. J. Cryst. Growth 2010, 312, 2363–2368. [Google Scholar] [CrossRef]
- Gomez-Villalba, L.S.; López-Arce, P.; Alvarez de Buergo, M.; Fort, R. Atomic Defects and Their Relationship to Aragonite–Calcite Transformation in Portlandite Nanocrystal Carbonation. Cryst. Growth Des. 2012, 12, 4844–4852. [Google Scholar] [CrossRef]
- Rosell Amigó, J.R. Aportaciones al Conocimiento del Comportamiento Deformacional de Pastas de cal: Tamaño y Formas de las Partículas y su Viscosidad. Ph.D. Thesis, Universitat Politècnica de Catalunya, Barcelona, Spain, 2013. [Google Scholar]
- Guasch Ferré, N. Optimització de Mètodes Multitécnica per a la Caracterització de Components Orgànics i Morters de Calç tradicionals de l’antiguitat. Desenvolupament de Metodologies Experimentals per a la Seva Conservació i Restauració. Aplicació a un cas d’estudi: Els Estucs de la Pintura Mural de la Cultura Maia (Antiga Mesoamèrica). Ph.D. Thesis, Universitat Politècnica, de València, València, Spain, 2016. [Google Scholar]
- Rodriguez-Navarro, C.; Burgos-Cara, A.; Di Lorenzo, F.; Ruiz-Agudo, E.; Elert, K. Nonclassical Crystallization of Calcium Hydroxide via Amorphous Precursors and the Role of Additives. Cryst. Growth Des. 2020, 20, 4418–4432. [Google Scholar] [CrossRef]
- Michalopoulou, A.; Maravelaki, P.N.; Kilikoglou, V.; Karatasios, I. Morphological characterization of water-based nanolime dispersions. J. Cult. Herit. 2020, 46, 11–20. [Google Scholar] [CrossRef]
- Kang, S.H.; Kwon, Y.H.; Moon, J. Controlling the hydration and carbonation in lime-based materials: Advantage of slow carbonation in CO2 curable construction materials. Constr. Build. Mater. 2020, 249, 118749. [Google Scholar] [CrossRef]
- Cizer, O.; Van Balen, K.; Elsen, J.; Van Gemert, D. Real-time investigation of reaction rate and mineral phase modifications of lime carbonation. Constr. Build. Mater. 2012, 35, 741–751. [Google Scholar]
- Amigo, J.M.; Briansó, J.L.; Briansó, M.C.; Coy-Yll, R.; Soláns-Huguet, J. Cristalografía; Editorial Rueda: Madrid, Spain, 1981; p. 548. [Google Scholar]
- Oriols, N.; Salvadó, N.; Pradell, T.; Butí, S. Amorphous calcium carbonate (ACC) in fresco mural paintings. Microchem. J. 2020, 154, 104567. [Google Scholar] [CrossRef]
- Oriols, N.; Salvadó, N.; Pradell, T.; Jiménez, N.; Cotte, M.; Gonzalez, V.; Butí, S. Carbonation of fresco mural paintings with a dolomitic mortar. Cem. Concr. Res. 2022, 157, 106828. [Google Scholar] [CrossRef]
- Pocostales, L. Procedimiento Para el Aislamiento y Estudio de la Capa Superficial de un Material Húmedo por Embutición. “Procedure for the Isolation and Study of the Surface Layer of a Wet Material through Encapsulation”. Nº de patente en la OEPMP20153165, 9 October 2015. [Google Scholar]
- Dee, G.T. The patterns produced by precipitation at a moving reaction front. Physica D 1986, 23, 340–344. [Google Scholar] [CrossRef]
- Dee, G.T. Patterns produced by precipitation at a moving reaction front. Phys. Rev. Lett. 1986, 57, 275–278. [Google Scholar] [CrossRef]
- Viedma, C. Transferencia de Masa y Criterios Onto-Morfogenéticos en Sistemas Difusivos Finitos. Aplicación a la Síntesis de Yeso en gel de Sílice y Agar-Agar. Ph.D. Thesis, Universidad Complutense de Madrid, Madrid, Spain, 1989. [Google Scholar]
- Pomar Gomà, L.; Ginés Gracia, A.; Ginés Gracia, J.; Moyà Niell, G.; Ramon Pérez de Rada, G. Nota previa sobre la petrología y mineralogía de la calcita flotante de algunas cavidades del levante mallorquín. Endins Publicació D’espeleologia 1975, 2, 3–6. [Google Scholar]
- Gebauer, D.; Gunawidjaja, P.N.; Ko, J.Y.; Bacsik, Z.; Aziz, B.; Liu, L.; Hu, Y.; Bergstrom, L.; Tai, C.W.; Sham, T.K.; et al. Proto-Calcite and Proto-Vaterite in Amorphous Calcium Carbonates. Angew. Chem. Int. Ed. 2010, 49, 8889–8891. [Google Scholar] [CrossRef] [PubMed]
- Wang, J.; Becker, U. Structure and carbonate orientation of vaterite (CaCO3). Am. Mineral. 2009, 94, 380–386. [Google Scholar] [CrossRef]
- Makreski, P.; Jovanovski, G. Minerals from Macedonia. IX. Distinction between some rhombohedral carbonates by FTIR spectroscopy. Bull. Chem. Technol. Maced. 2003, 22, 25–32. [Google Scholar]
- Varas, M.J.; Alvarez de Buergo, M.; Fort, R. Natural cement as the precursor of Portland cement: Methodology for its identification. Cem. Concr. Res. 2005, 35, 2055–2065. [Google Scholar] [CrossRef]
- Hughes, T.J.; Methven, C.M.; Jones, T.; Pelham, S.E.; Fletcher, P.; Hall, C. Determining Cement Composition by Fourier Transform Infrared Spectroscopy. Adv. Cem. Based Mater. 1995, 2, 91–104. [Google Scholar]
- Vagenas, N.V.; Gatsouli, A.; Kontoyannis, C.G. Quantitative Analysis of Synthetic Calcium Carbonate Polymorphs Using FT-IR Spectroscopy. Talanta 2003, 59, 831–836. [Google Scholar] [CrossRef]
- Andersen, F.A.; Brčević, L. Infrared Spectra of Amorphous and Crystallyne Calcium Carbonate. Acta Chim. Scand. 1991, 45, 1018–1024. [Google Scholar] [CrossRef]
- Rodriguez-Blanco, J.D.; Shaw, S.; Benning, L.G. The kinetics and mechanisms of amorphous calcium carbonate (ACC) crystallization to calcite, via vaterite. Nanoscale 2011, 3, 265–271. [Google Scholar]
- Coleyshaw, E.E.; Crump, G.; Griffith, W.P. Vibrational spectra of the hydrated carbonate minerals ikaite, monohydrocalcite, lansfordite and nesquehonite. Biomol. Spectrosc. 2003, 59, 2231–2239. [Google Scholar]
- Poduska, K.M.; Regev, L.; Boaretto, E.; Addadi, L.; Weiner, S.; Kronik, L.; Curtarolo, S. Decoupling Local Disorder and Optical Effects in Infrared Spectra: Differentiating Between Calcites with Different Origins. Adv. Mater. 2011, 23, 550–554. [Google Scholar] [CrossRef] [PubMed] [Green Version]
- Chu, V.; Regev, L.; Weiner, S.; Boaretto, E. Differentiating between anthropogenic calcite in plaster, ash and natural calcite using infrared spectroscopy: Implications in archaeology. J. Archaeol. Sci. 2008, 35, 905–911. [Google Scholar] [CrossRef]
- Regev, L.; Poduska, K.M.; Addadi, L.; Weiner, S.; Boaretto, E. Distinguishing between calcites formed by different mechanisms using infrared spectrometry: Archaeological applications. J. Archaeol. Sci. 2010, 37, 3022–3029. [Google Scholar] [CrossRef] [Green Version]
- Maciejewski, M.; Reller, A. Formation of Amorphous CaCO3 during the Reaction of CO2 with CaO. Thermochim. Acta 1989, 142, 175–188. [Google Scholar] [CrossRef]
- Freeman, C.L.; Harding, J.H. The transformation of amorphous calcium carbonate to calcite and classical nucleation theory. J. Cryst. Growth 2023, 603, 126978. [Google Scholar] [CrossRef]
- Gebauer, D.; Kellermeier, M.; Gale, J.D.; Bergstrom, L.; Colfen, H. Pre-nucleation clusters as solute precursors in crystallization. Chem. Soc. Rev. 2014, 43, 2348–2371. [Google Scholar]
- Gebauer, D.; Cölfen, H. Prenucleation clusters and non-classical nucleation. Nano Today 2011, 6, 564–584. [Google Scholar] [CrossRef]


| Material | Description |
|---|---|
| Binding material | Lime putty paste CL 90 PL. supplier: Cales Segarra y Hernández, Barcelona. UNE-EN 459-1. Calcium hydroxide (portlandite) embedded in an aqueous colloidal dispersion composed of carbonate and hydroxyl ions. |
| Aggregate | Siliceous sand *. Granulometry: 4–2.5 mm and 250 µm. |
| Solvent | Bezoya®® weakly mineralised natural mineral water. Chemical composition (in mg/L): dry residue at 180 °C: 28; bicarbonates: 7; chlorides: 0.87; Ca: 2.73; Mg: 0.39; Na: 2.55; Si: 11.0. |
| Supporting material | Unglazed brick. The supporting material was grooved on the back to help the stucco to adhere. Dimensions: 27.5 × 13.5 × 1 cm. |
| Phase | Interval | Macroscopic Observations |
|---|---|---|
| 1 | 0–60 m | Film development starting from the initial raw material prior to construction through 60 min after construction. |
| 2 | 1–4 h | Beginning of film hardening and decrease in plasticity. |
| 3 | 4–24 h | Formation and development of the film. At the end of this process, the surface, which was partially permeable, did not allow the pigment particles to adhere. |
| 4 | 1–30 d | Hardening of the film. |
| 5 | >90 d | Long-term film development. |
| Sequence | Interval of Extraction | Number of Extracted Samples |
|---|---|---|
| 0–1 h | 3 m 20 s | 19 |
| 1–2 h | 10 m | 6 |
| 2–3 h | 30 m | 2 |
| 4–24 h | 60 m | 20 |
| 24 h–7 d | 24 h | 6 |
| 8–30 d | 48 h | 11 |
| 90 d | 1 | |
| 160 d | 1 | |
| TOTAL | 66 |
| Frequencies Ʋ (cm−1) | Assignation | Related Compound | |||||
|---|---|---|---|---|---|---|---|
| ACC [23,30,36,37] | Portlandite [33,34] | Calcite [32,34,35] | Aragonite [35] | Vaterite [31,35] | Monohydrocalcite [38] | ||
| - | 3646 w(sp) 3640 | 3400, | Stretching vibration OH in Ca(OH)2 | Calcium hydroxide | |||
| - | 3450 vs. (b), 3400 vs. (b) 3330 | 3327 s(b) | Stretching vibration OH | Calcium hydroxide | |||
| - | 1650 m(b), 1620 m(b)1637 | - | - | - | 1700 w(b) | Bending vibration OH in Ca(OH)2 | Calcium hydroxide |
| 1470, 1490 (sh), 1425 vs. (b) 1470-1490sh,1420 | 1425 vs. (b) 1420 | 1500 vs. | 1450 vs. | 1492 vs., 1401 s(b) | ν3—asymmetric stretching vibration of carbonate group | Calcium carbonate | |
| 1084 vw(sp) | 1083 vw(s) | 1087 vw(s) | 1063 w(s) | ν1—symmetric stretching vibration of carbonate group | Calcium carbonate | ||
| 874 m(sp) 872 | 845 w(sp), 875 m(sp) 872 | 844 w(sp), 874 m(sp) | 876 m(sp) s | 872 m(s) | ν2—asymmetric bending vibration of carbonate group | Calcium carbonate | |
| 725 vw or absent (sp), 690 (sh) absent | 712 w(s) 712 | 700 w(sp), 712 w(sp) | 744 m(sp) | 762 m, 698 m(s) | ν4—symmetric bending vibration of carbonate group | Calcium carbonate | |
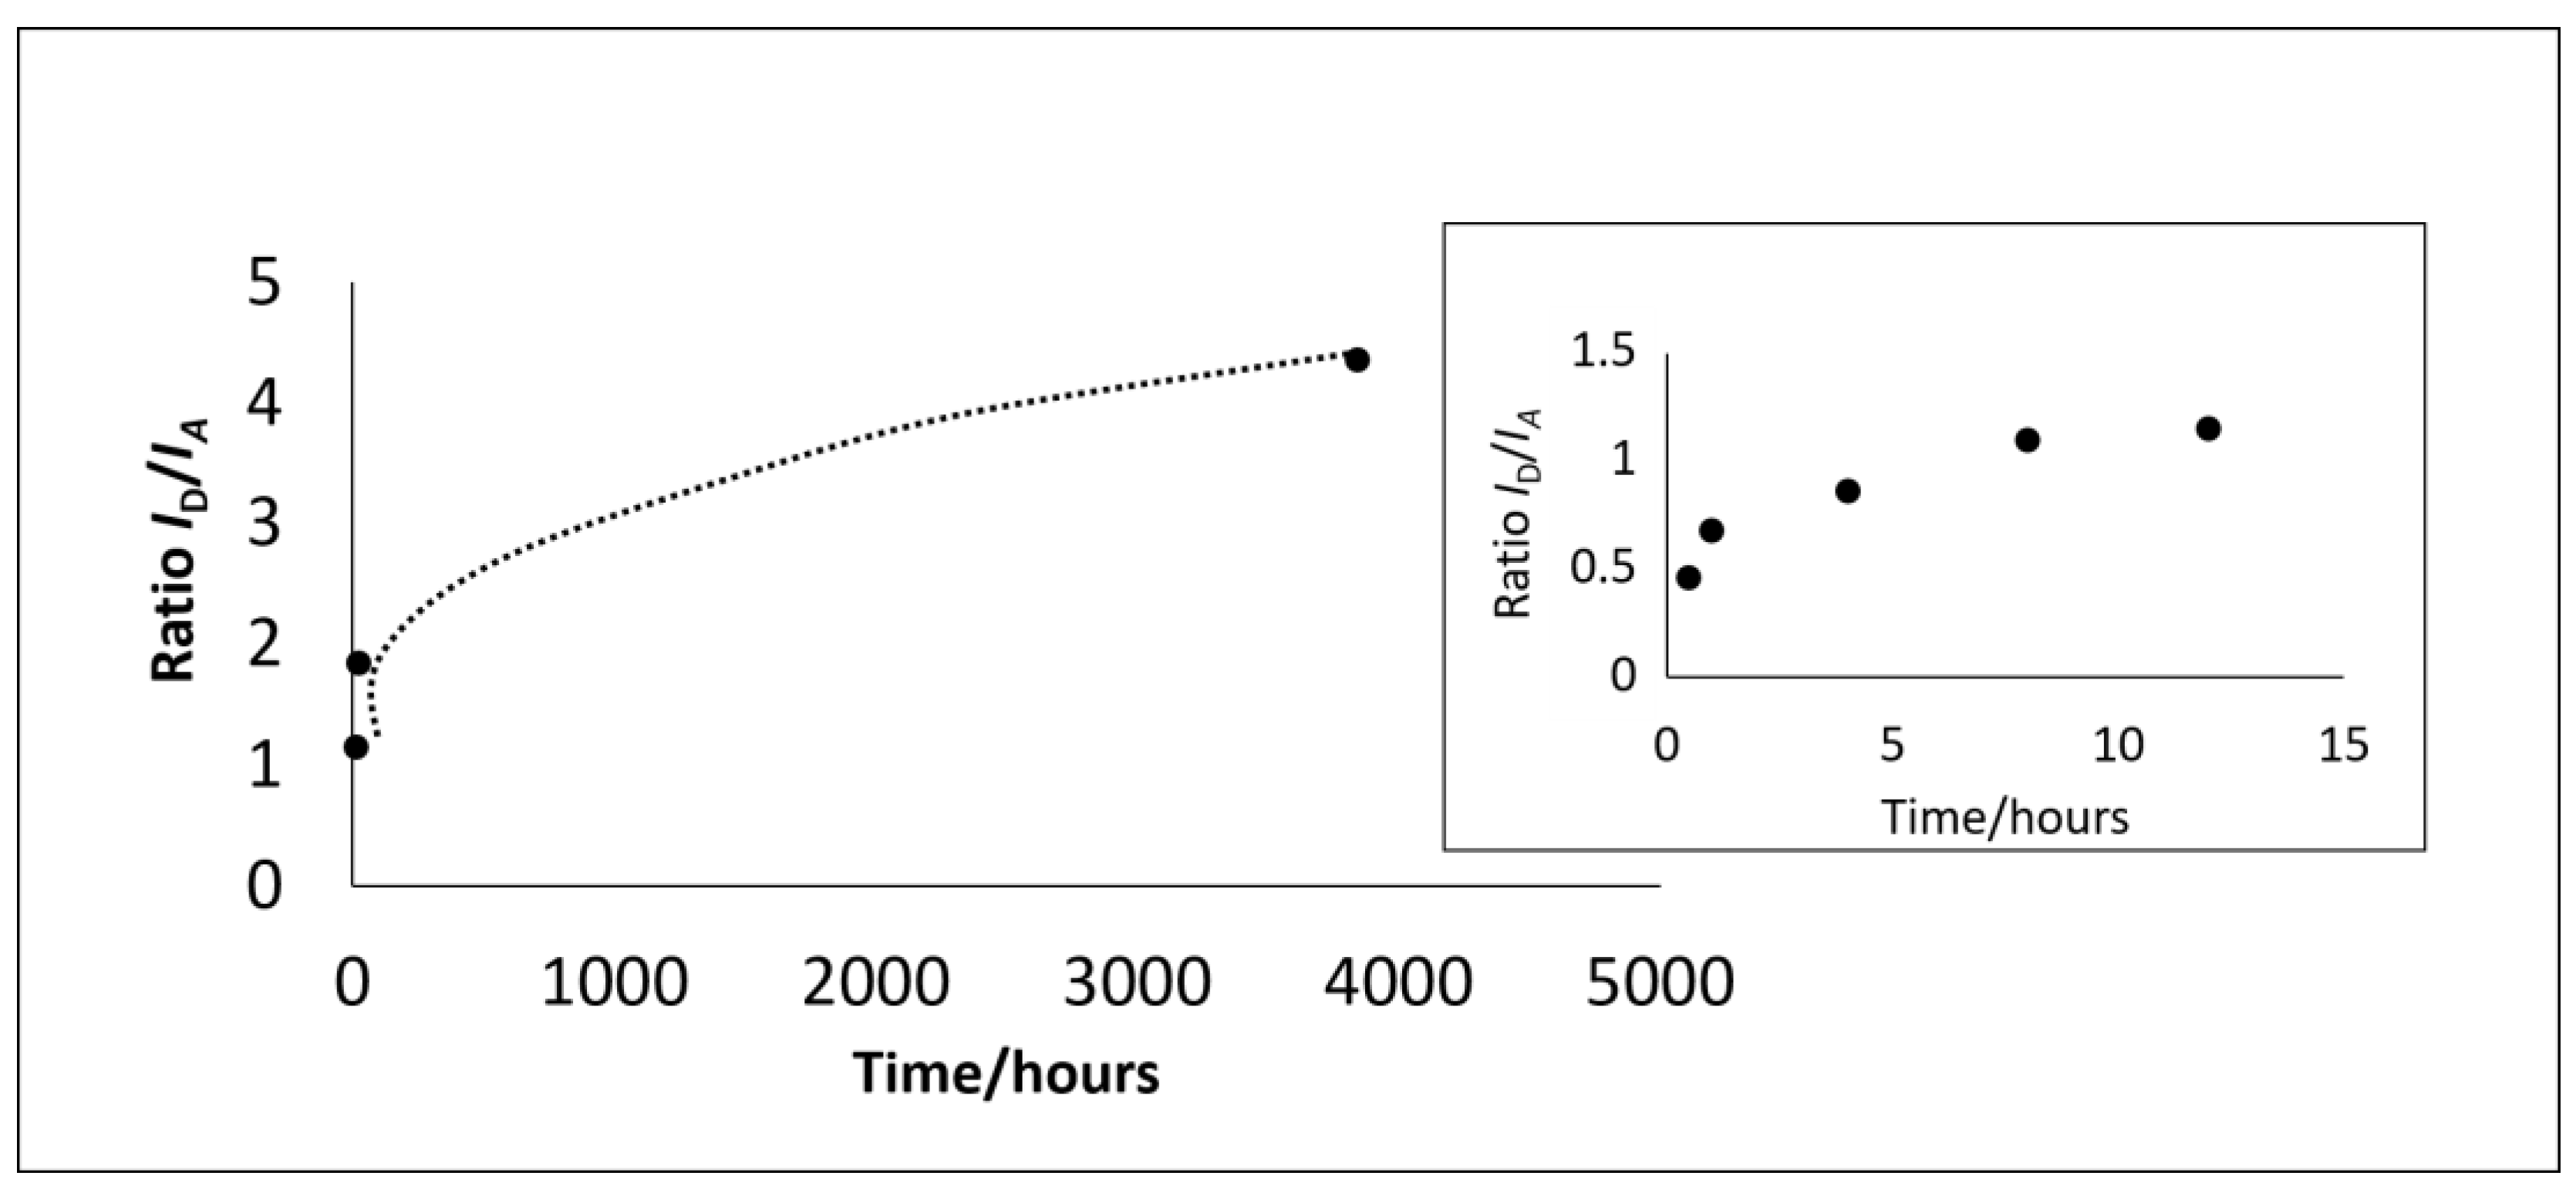
| Time (hours) | 0.48 | 1 | 4 | 8 | 16 | 24 | 3840 | 6480 | 8760 |
|---|---|---|---|---|---|---|---|---|---|
| ID/IA | 0.46 | 0.68 | 0.86 | 1.1 | 1.15 | 1.84 | 4.35 | ||
| IE/IF | 10.8 | 10.78 | 10.4 | 10 | 8.5 | 7.33 | 5.1 | 4.04 * | 4.03 * |
Disclaimer/Publisher’s Note: The statements, opinions and data contained in all publications are solely those of the individual author(s) and contributor(s) and not of MDPI and/or the editor(s). MDPI and/or the editor(s) disclaim responsibility for any injury to people or property resulting from any ideas, methods, instructions or products referred to in the content. |
© 2023 by the authors. Licensee MDPI, Basel, Switzerland. This article is an open access article distributed under the terms and conditions of the Creative Commons Attribution (CC BY) license (https://creativecommons.org/licenses/by/4.0/).
Share and Cite
Pocostales, L.; Pitarch Martí, À.; Guasch-Ferré, N.; Doménech-Carbó, M.T.; Prada Pérez, J.L. New Insights into the Geochemical Processes Occurring on the Surface of Stuccoes Made of Slaked Lime Putty. Crystals 2023, 13, 219. https://doi.org/10.3390/cryst13020219
Pocostales L, Pitarch Martí À, Guasch-Ferré N, Doménech-Carbó MT, Prada Pérez JL. New Insights into the Geochemical Processes Occurring on the Surface of Stuccoes Made of Slaked Lime Putty. Crystals. 2023; 13(2):219. https://doi.org/10.3390/cryst13020219
Chicago/Turabian StylePocostales, Luciana, Àfrica Pitarch Martí, Núria Guasch-Ferré, María Teresa Doménech-Carbó, and José Luís Prada Pérez. 2023. "New Insights into the Geochemical Processes Occurring on the Surface of Stuccoes Made of Slaked Lime Putty" Crystals 13, no. 2: 219. https://doi.org/10.3390/cryst13020219
APA StylePocostales, L., Pitarch Martí, À., Guasch-Ferré, N., Doménech-Carbó, M. T., & Prada Pérez, J. L. (2023). New Insights into the Geochemical Processes Occurring on the Surface of Stuccoes Made of Slaked Lime Putty. Crystals, 13(2), 219. https://doi.org/10.3390/cryst13020219