Abstract
The electronic structure and thermoelectric properties of Bi3+-doped (Sr0.889-xLa0.111Bix)TiO2.963 were studied by the first principles method. Doping Bi3+ can increase the cell parameters, cell asymmetry and band gap. With increasing Bi3+ content, the asymmetry of DOS relative to the Fermi level increases, which results in an enhanced Seebeck coefficient, increasing carrier mobility and decreasing carrier concentration. An appropriate Bi3+-doping concentration (7.4–14.8%) can increase the lattice distortion and reduce the lattice thermal conductivity of the material. An appropriate Bi3+-doping concentration (7.4%) can effectively optimize the electrical transport performance and improve the thermoelectric properties of strontium titanate. The optimal Bi3+-doping concentration is 7.4%, and Sr0.815La0.111Bi0.074TiO2.963 obtains a maximum ZT of 0.48. This work shows the mechanism of Bi3+ doping in enhancing the thermoelectric properties of strontium titanate.
1. Introduction
Due to environmental pollution and other problems, researchers around the world are actively looking for new energy materials for sustainable development. Thermoelectric materials can directly convert heat into electricity through the Seebeck effect [1], and can be widely used in automobiles, refrigeration, space and other fields [2]. Thermoelectric superior value () is generally used to evaluate the performance of thermoelectric materials. Through the application of thermoelectric materials with high ZT values, waste heat recovery can be realized to improve energy utilization efficiency.
Strontium titanate (SrTiO3, STO) is a typical n-type oxide thermoelectric material with a cubic perovskite structure, good thermal stability and broad application prospects. However, the ZT value of strontium titanate is low and cannot meet the application requirements. Therefore, researchers have conducted a lot of studies on SrTiO3 to improve its thermoelectric properties, such as doping modification [3], grain boundary engineering [4], composite second phase [5], etc. Among them, La3+-doping SrTiO3 [4,5,6,7,8,9,10,11,12] has been extensively studied and achieved good results. On the basis of the thermoelectric properties of La3+-doping SrTiO3, it is a difficult problem to further improve the thermoelectric properties of the material.
In addition to experimental research, many scholars have also carried out theoretical calculation research on SrTiO3 materials. In particular, the electronic structure and physical properties of the intrinsic [13,14] and doped [15,16,17,18,19,20,21,22,23,24] SrTiO3 material have been calculated using first principles. Singsoog [17] constructed a supercell containing four protocells and studied the electronic structure and electrical transport properties of Sr1-xLaxTiO3(x = 0, 0.06, 0.13 and 0.25) based on first-principles molecular orbital calculations. Sr0.87La0.13TiO3 shows a maximum power factor of about 2.55 × 10⁻³W/(m·K2) at 1200 K. Baniecki20 constructed Sr1-xLaxTiO3 and SrTi1-xMxO3(M = V, Nb, Ta)(x = 0.125) containing eight protocells, and systematically studied the changes in electronic structure, carrier effective mass, splitting energy and transport characteristics caused by doping.
According to current research, doping tends to change the electronic structure of materials to enhance the S of materials, while heavy ion doping tends to enhance phonon scattering and reduce the lattice thermal conductivity of materials. In the power factor (PF = S2σ) where S is the square term, increasing the Seebeck coefficient is an excellent method to enhance the power factor, so a heavier ionic dopant based on (SrLa)TiO3 can be found to enhance S and reduce the lattice thermal conductivity, thus further enhancing the thermoelectric properties. Bi2O3 is a commonly used sintering aid for electronic functional ceramics [25]. At the late sintering stage, part of Bi3+ diffuses into the lattice of matrix materials, resulting in a donor doping effect and improving the electrical properties of materials. Meanwhile, Bi3+ has been proven to regulate the electronic structure of SrTiO3 [26], and is expected to enhance the thermoelectric properties of the material due to its large atomic mass. However, there are few experiments and calculation reports on the thermoelectric properties of Bi3+-doped SrTiO3 at present. Therefore, it is necessary to explore the internal mechanism of the influence of Bi3+ on the thermoelectric properties of SrTiO3.
In this work, considering oxygen vacancies always appear in the SrTiO3-based thermoelectric materials [27], Sr0.889La0.111TiO2.963 was chosen as matrix material, and a model with 3 × 3 × 3 super-large crystal cell containing 27 protocells and 135 atoms was constructed. Based on the same La3+ doping concentration, the first-principles plane-wave pseudopotential method based on density functional theory (DFT) was adopted to study the electronic structure and thermoelectric properties of strontium titanate doped with different concentrations of Bi3+. The influence of the Bi3+-doping modification mechanism on thermoelectric properties was explored.
2. Calculation Methods and Cell Models
2.1. Cell Models
SrTiO3 belongs to the cubic crystal system, and its crystal structure belongs to the spatial group Pm3m(O1 h). The cell parameter a=b=c=0.3905 nm [28]. Sr2+ occupies the position of the A position of the eight apex angles of the cell, Ti4+ is located at the B position of the body center of the cell, the anion O2− is located at the face-center, and the coordination number is 12, 6 and 6, respectively. In this work, a 3 × 3 × 3 supercell containing 27 protocells and 135 atoms was selected as the computational model of the material. The cell models of (Sr0.889-xLa0.111Bix)TiO2.963 with Bi3+ doping were constructed, and the Bi3+-doping concentration was 0%, 3.7%, 7.4%, 11.1% and 14.8%, respectively. The cell models correspond to the composition of Sr0.889La0.111TiO2.963 (SLT), Sr0.852La0.111Bi0.037TiO2.963 (SLTB1), Sr0.815La0.111Bi0.074TiO2.963 (SLTB2), Sr0.778La0.111Bi0.111TiO2.963(SLTB3), and Sr0.741La0.111Bi0.148TiO2.963 (SLTB4). In order to further explore the effect of Bi3+ and La3+, the composition of Sr0.815La0.185TiO2.963 (SLTL) with the same content of Sr2+ as SLTB2 was designed and calculated. The configurations of supercells are shown in Figure 1.

Figure 1.
Cell models of (Sr0.889-xLa0.111Bix)TiO2.963. (a) Sr0.889La0.111TiO2.963; (b) Sr0.852La0.111Bi0.037TiO2.963; (c) Sr0.815La0.111Bi0.074TiO2.963; (d) Sr0.778La0.111Bi0.111TiO2.963; (e) Sr0.741La0.111Bi0.148TiO2.963; (f) Sr0.815La0.185TiO2.963 (the position of the black circle is the position where the O2- vacancy is introduced, and the position of the O2- vacancy is the same for each cell).
2.2. Calculation Method
In this work, vasp software [29] was used to optimize the cell model, calculate the electronic structure and mechanical properties of the material, vaspkit [30] was used to process the data obtained, BoltzTrap2 software (TU Wien, Austria) [31] was used to calculate the thermoelectric properties of the material, and experimental data combined with the Slack model was used to calculate the lattice thermal conductivity of the material [32]. The relaxation time of the material was calculated using the deformation potential theory [33]. The ultra-soft pseudoptential method of plane waves based on density functional theory (DFT) was calculated, and the Perdew–Burke–Ernzerhof (PBE) function under generalized gradient approximation (GGA) was used to expand the exchange correlation energy [34]. For the integral calculation of k points in the Brillouin area, the k point of supercells is set as 3 × 3 × 3. The four valence electron configurations of Sr, Ti, O, La and Bi are 4s24p65s2,3s23p63d24s2,2s22p4, 5s25p65d16s2 and 6s26p3, respectively. In the calculation process, the energy convergence accuracy is 1.0 × 10⁻⁶ eV/atom, the maximum atomic displacement is 0.0001 nm, the truncation energy is 400 eV, the convergence standard of internal crystal stress is 0.05 Gpa, and the convergence standard of interatomic interaction is 0.3 eV/nm. Firstly, six kinds of 3 × 3 × 3 supercells were constructed. Secondly, the constructed cells were geometrically optimized. Finally, the physical properties were calculated based on the geometrically optimized cells.
3. Results and Discussion
3.1. Lattice Structure and Electronic Structure
Table 1 lists the cell parameters of the relaxed (Sr0.889-xLa0.111Bix)TiO2.963 supercell. It can be seen that the calculated Sr0.889La0.111TiO3 cell parameter of 0.3906 nm is −0.0512% smaller than the experimental data of 0.3908 nm [35], which indicates that the established crystal structure model is reasonable.

Table 1.
Cell parameters of (Sr0.889-xLa0.111Bix)TiO2.963.
It can be seen from the table that after doping Bi3+, the cell structure of (Sr0.889-xLa0.111Bix)TiO2.963 does not change significantly, and it still maintains the cubic system. The cell parameters in the a and b direction are equal, but they decrease slightly in the c direction. c/a represents lattice distortion, and the more c/a deviates from 1.000, the greater the lattice distortion degree. It can be clearly seen from Figure 1 that the Ti–O octahedron has an obvious distortion, and Ti4+ ions are all far away from the center of the octahedron. In the c direction, the atoms shift to the inside of the cell, resulting in a slight contraction of the cell. In the a and b directions, the atoms shift to the outside, resulting in a slight expansion of the cell. The lattice distortion degree of SLTB1-3 is similar, while the lattice distortion degree of SLT, SLTB4 and SLTL is larger.
With the increase of Bi3+ concentration, the cell parameters increased, which is consistent with the results of another experiment [36]. The reason for the increase of cell parameters after the introduction of Bi3+ may be due to the mismatch and electronegativity difference between Bi3+, La3+ and Sr2+, which leads to the growth of Ti–O and Bi–O bonds. The electronegativity of Bi3+ is 2.02, the electronegativity of La3+ is 1.1, the electronegativity of Sr2+ is 0.95, and the electronegativity of O2− is 3.44. According to Pauling’s rule, the larger the electronegativity difference, the stronger the electron-attracting ability of ions, the smaller the distance between ions, and the smaller the bond length. The difference between the electronegativity of Bi3+ and that of O2− is less than 1.7, indicating that Bi3+ and O2− are mainly covalent bonds, and the bond length is large. The positions of Ti1 and O1 are marked in Figure 1a, and the positions of Bi1, La1, Sr1, O2, and O3 are marked in Figure 1b. Table 1 lists the bond lengths of Ti1–O1, La1–O2, Bi1–O3 and Sr1–O3 at the same position in the cell models of the six kinds of supercells. It can be seen that the Bi–O bond length is larger than the La–O bond length and Sr–O bond. At the same time, when Bi3+ doping concentration increases, the Ti1–O1 bond length and Bi1–O3 bond length increase, resulting in cell distortion and slight expansion.
After geometric optimization, the non-self-consistent calculation of the band structure was performed, and the band structure of (Sr0.889-xLa0.111Bix)TiO2.963 was obtained, as shown in Figure 2. The calculation of the band structure of SrTiO3 brillouin zone high-symmetry point selection was as follows: Γ → X → M → Γ → R → X (Γ, X, M, R, X, are the brillouin zone high-symmetry points). It can be found that the Fermi level of (Sr0.889-xLa0.111Bix)TiO2.963 is in the top of the valence band; the band at the top of valence band is point R, and the bottom of the conduction band is in point Γ, which is consistent with Benrekia [37]. The experimental value of the band gap of intrinsic SrTiO3 is measured as 3.25 eV [38], and the calculated band gap is in the range of 2.907–2.305 eV; due to the PBE function, this will significantly underestimate the band gap [37]. Although there is a certain difference between the calculated value and the experimental value, the selected parameters in the calculation are consistent, the obtained law of band structure change is reliable and this will not affect the theoretical analysis of the electronic structure.
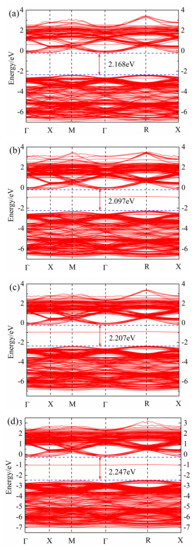
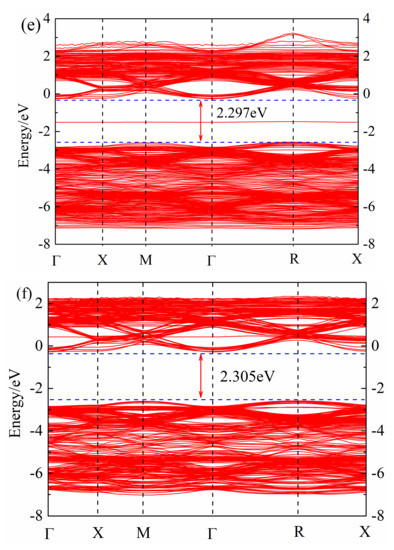
Figure 2.
Band structure of (Sr0.889-xLa0.111Bix)TiO2.963. (a) Sr0.889La0.111TiO2.963; (b) Sr0.852La0.111Bi0.037TiO2.963; (c) Sr0.815La0.111Bi0.074TiO2.963; (d) Sr0.778La0.111Bi0.111TiO2.963; (e) Sr0.741La0.111Bi0.148TiO2.963; (f) Sr0.815La0.185TiO2.963.
By comparing Figure 2a–e, it can be seen that with the increase of Bi3+ concentration, the band gap of ((Sr0.889-xLa0.111Bix)TiO2.963 first decreases and then increases. The minimum band gap of SLTB1 is 2.097 eV, and the maximum band gap of SLTB4 is 2.297 eV. With the increase of the incorporation concentration of Bi3+ ions, the deeper the Fermi level enters the conduction band, indicating that Bi3+ ions emit more electrons than Sr2+ ions, which increases the carrier concentration of the system and generates a degenerate system. Bi3+ doping changes the conductivity of strontium titanate, and the Fermi level is greater than the minimum conduction band, indicating that the strontium titanate material system has exhibited metallic properties at this time [20].
The specific defect chemical reaction can be given by Formula (1):
By comparing Figure 2a,f and Figure 2b–e, it can be found that impurity levels appear after Bi3+ doping, indicating that Bi3+ doping causes certain changes in the material energy band structure, which is consistent with the calculation of Zhang26. Bi3+ doping introduces an impurity level at the −2 eV~0 eV position, which promotes the electron transition. Electrons can jump from the valence band to the impurity level first, and then jump into the conduction band, which will increase the electron mobility and conductivity of the material.
In order to further study the influence of Bi3+ doping on the electronic structure of SrTiO3, the total state density (DOS) and split-wave state density (PDOS) of (Sr0.889-xLa0.111Bix)TiO2.963 were calculated, as shown in Figure 3. As can be seen from Figure 3b, the top of the valence band of doped strontium titanate is mainly composed of O-2p orbitals, and the bottom of the conduction band is mainly composed of Ti-3d orbitals, indicating that the co-vertex-connected titano-oxygen octahedron determines the electronic structure of strontium titanate, the energy level of Sr orbital does not contribute to the valence band and conduction band, and the 6p of Bi3+ and 5d of La3+ participate in forming the conduction band. However, its split-wave state density is small. At the same time, it is obvious that the 6p orbital of Bi3+ introduces a small DOS peak in the center of the valence and conduction bands, which corresponds to the impurity level in the previous band structure. It is foreseeable that the inclusion of Bi3+ will have an impact on the electrical transport performance of the material. The Seebeck coefficient is related to the asymmetry of DOS relative to the Fermi level and the steepness of state density. The larger the asymmetry, the steeper the state density peak, and the larger the Seebeck coefficient. By comparing Figure 3a and Figure 3b–e, the change of the value of second peak around the conduction band position of the total state density is about 2 eV, and the DOS of (Sr0.889-xLa0.111Bix)TiO2.963 increases asymmetrically relative to the Fermi level. The introduction of Bi3+ may increase the absolute Seebeck coefficient of the material. Under the condition of the same concentration of Sr2+ replace, the value of the second peak of SLTB2 is less than that of SLTL, which shows that the contribution to the DOS in the bottom of the conduction band of Bi3+ is less than La3+ with the same concentration. As shown in Figure 3a–e, with the increase of Bi3+ ion incorporation concentration, the deeper the Fermi level enters the conduction band, the greater the value of DOS at Fermi level and the steeper the peak. The addition of Bi3+ ions will increase the absolute value of the Seebeck coefficient.
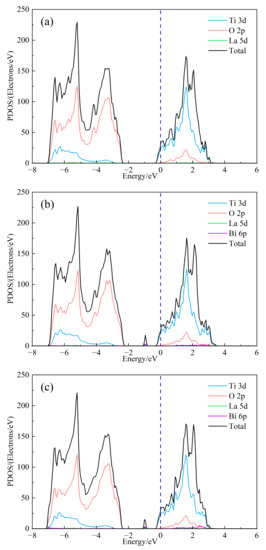
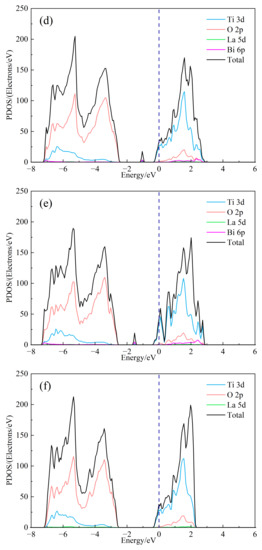
Figure 3.
The DOS of (Sr0.889-xLa0.111Bix)TiO2.963. (a) Sr0.889La0.111TiO2.963; (b) Sr0.852La0.111Bi0.037TiO2.963; (c) Sr0.815La0.111Bi0.074TiO2.963; (d) Sr0.778La0.111Bi0.111TiO2.963; (e) Sr0.741La0.111Bi0.148TiO2.963; (f) Sr0.815La0.185TiO2.963.
3.2. Thermoelectric Properties
The Seebeck coefficient of (Sr0.889-xLa0.111Bix)TiO2.963 changes with the chemical potential at different temperatures, as shown in Figure 4. When the chemical potential µ > 0, it indicates that the material is n-type doped; when the chemical potential µ < 0, it indicates that the material system is p-type doped. The larger the chemical potential µ, the deeper the Fermi level moves up into the conduction band; the smaller the chemical potential µ, the deeper the Fermi level moves down into the valence band [38]. It can be seen from Figure 4a,f that the S-curve of (Sr1-xLax)TiO2.963 is similar, and its absolute value is very large near µ = 0, and the absolute value increases rapidly, and then increases when the chemical potential slowly decreases. When μ < −0.1 Ry and μ > 0.1 Ry, S tends to zero and is almost independent of temperature, which is mainly due to the gradual decrease of carrier concentration [24,39]. Comparing Figure 4a with Figure 4b–e, it can be seen that when Bi3+ is doped, within the range of chemical potential 0.05 Ry < µ < 0.1 Ry, the second peak appears in the Seebeck coefficient, which increases with the increase of Bi3+-doping concentration. The possible reason for this is that the chemical potential range of 0.05 Ry < µ < 0.1 Ry corresponds to the impurity level between the top of the valence band and the bottom of the conduction band in the energy band structure. When the doping concentration of Bi3+ increases, the energy level of the impurity increases, and the presence of impurity levels has a significant impact on the Seebeck coefficient of the material.
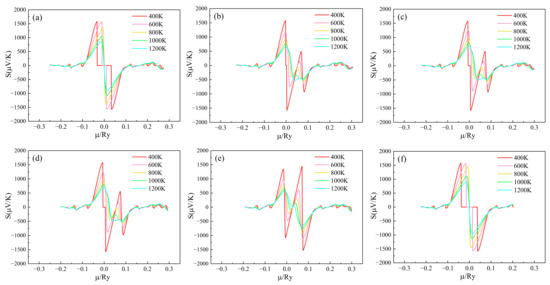
Figure 4.
Chemical potential dependent of S of (Sr0.889-xLa0.111Bix)TiO2.963. (a) Sr0.889La0.111TiO2.963; (b) Sr0.852La0.111Bi0.037TiO2.963; (c) Sr0.815La0.111Bi0.074TiO2.963; (d) Sr0.778La0.111Bi0.111TiO2.963; (e) Sr0.741La0.111Bi0.148TiO2.963; (f) Sr0.815La0.185TiO2.963.
Figure 5 shows the conductivity/relaxation time(σ/τ) of (Sr0.889-xLa0.111Bix)TiO2.963 as a function of chemical potential. In the vicinity of μ = 0, σ/τ is almost 0, but mainly exhibits conductivity below −0.1 Ry and above 0.1 Ry. The σ/τ curves of (Sr0.889-xLa0.111Bix)TiO2.963 have similar trends. The conductivity of n-type doping is greater than that of p-type doping, indicating that SLTB materials are n-type semiconductors. When 0 < μ < 0.1 Ry, the conductivity increases with the chemical potential. When μ is around 0.2 Ry, the conductivity begins to decrease with the increase of chemical potential. The higher the temperature, the smaller the σ/τ of the material system, which is due to the severe carrier scattering at high temperature and the decrease of carrier mobility. For the (Sr0.889-xLa0.111Bix)TiO2.963, when the Bi3+-doping concentration is 0%, 3.7%, 7.4%, 11.1%, 14.8%, the maximum σ/τ of the material system is 1.802 × 10²⁰/(Ω·ms), 1.985 × 10²⁰/(Ω·ms), 1.680 × 10²⁰/(Ω·ms), 1.452 × 10²⁰/(Ω·ms), and 1.165 × 10²⁰/(Ω·ms) at 400 K, respectively. For the SLTL, the maximum σ/τ of the material system is 1.597 × 10²⁰/(Ω·ms) at 400 K. After the introduction of Bi3+ doping, the σ/τ of the material system first increased and then decreased, indicating that an appropriate Bi3+-doping concentration (3.7–7.4%) is conducive to the improvement of electrical conductivity, while an excessive Bi3+-doping concentration (11.1–14.8%) will severely scatter carriers and deteriorate the conductivity.
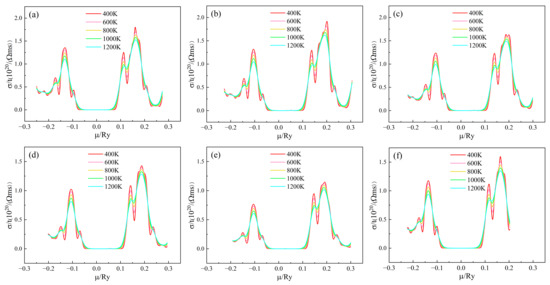
Figure 5.
Chemical potential dependent of σ/τ of (Sr0.889-xLa0.111Bix)TiO2.963. (a) Sr0.889La0.111TiO2.963; (b) Sr0.852La0.111Bi0.037TiO2.963; (c) Sr0.815La0.111Bi0.074TiO2.963; (d) Sr0.778La0.111Bi0.111TiO2.963; (e) Sr0.741La0.111Bi0.148TiO2.963; (f) Sr0.815La0.185TiO2.963.
The trend of electronic thermal conductivity/relaxation time of (Sr0.889-xLa0.111Bix)TiO2.963 as a function of chemical potential at different temperatures is shown in Figure 6. For (Sr0.889-xLa0.111Bix)TiO2.963, when the Bi3+-doping concentration is 0%, 3.7%, 7.4%, 11.1%, and 14.8%, respectively, the material system κe/τ maximum is 3.358 × 10¹⁵ W/(mKs), 3.634 × 10¹⁵ W/(mKs), 3.191 × 10¹⁵ W/(mKs), 2.929 × 10¹⁵ W/(mKs) and 2.420 × 10¹⁵ W/(mKs) at 1200 K, respectively. For the SLTL, the maximum κe/τ is 3.006 × 10¹⁵ W/(mKs) at 1200 K. κe/τ increases, and the trend of κe/τ is similar to σ/τ. κe/τ mainly has two peaks in the range of μ < −0.1 Ry and μ > 0.1 Ry.
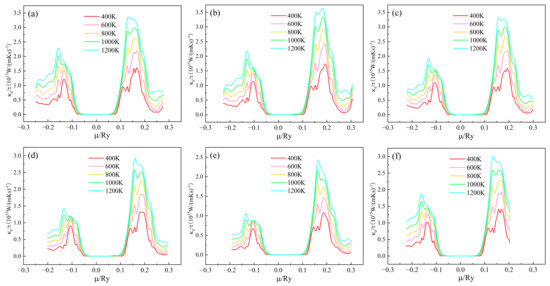
Figure 6.
Chemical potential dependent of κe/τ of (Sr0.889-xLa0.111Bix)TiO2.963. (a) Sr0.889La0.111TiO2.963; (b) Sr0.852La0.111Bi0.037TiO2.963; (c) Sr0.815La0.111Bi0.074TiO2.963; (d) Sr0.778La0.111Bi0.111TiO2.963; (e) Sr0.741La0.111Bi0.148TiO2.963; (f) Sr0.815La0.185TiO2.963.
The power factor/relaxation time of the (Sr0.889-xLa0.111Bix)TiO2.963 varies with the chemical potential as shown in Figure 7. The value of S2σ/τ of n-type doped material is greater than that of the p-type doped material, indicating that the material is more suitable for n-type doping and is an n-type semiconductor, which is consistent with the previous analysis of σ/τ. For the SLTB, the maximum S2σ/τ values of the material are 8.175 × 10¹¹, 8.551 × 10¹¹, 8.282 × 10¹¹, 7.518 × 10¹¹, 6.546 × 10¹¹ W/(mK2s) at 1200 K. For SLTL, the maximum S2σ/τ of the material is 7.402 × 10¹¹ W/(mK2s) at 1200K. The values of (Sr0.889-xLa0.111Bix)TiO2.963 reached the highest values at 0.11007 Ry, 0.11293 Ry, 0.11685 Ry, 0.12111 Ry, 0.08539 Ry, and 0.08929 Ry, respectively. Therefore, the later calculated thermoelectric properties are based on these chemical potentials to obtain better thermoelectric properties [24]. The variation diagram of S2σ/τ values of (Sr0.889-xLa0.111Bix)TiO2.963 with the chemical potential at 1200K is shown in Figure S1 (See Supplementary Materials). After the introduction of Bi3+ doping, the maximum value of S2σ/τ of the material increases first and then decreases. When the Bi3+ concentration is higher, the deterioration of S2σ/τ is more obvious. At the same time, it can be seen that the chemical potential value at which SLTB achieves the maximum S2σ/τ is significantly greater than that of SLTL. The possible reason for this is that with the increase of Bi3+ concentration, the deeper the Fermi level enters the conduction band. Bi3+ affects the band structure of the material so that the chemical potential at which the maximum value is obtained increases.
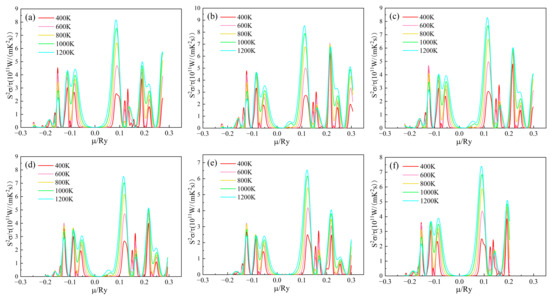
Figure 7.
Chemical potential dependent of S2σ/τ of (Sr0.889-xLa0.111Bix)TiO2.963. (a) Sr0.889La0.111TiO2.963; (b) Sr0.852La0.111Bi0.037TiO2.963; (c) Sr0.815La0.111Bi0.074TiO2.963; (d) Sr0.778La0.111Bi0.111TiO2.963; € Sr0.741La0.111Bi0.148TiO2.963; (f) Sr0.815La0.185TiO2.963.
The effective mass of carriers is calculated by the parabolic model, which is mainly related to the quadratic term of the lowest conduction band [40]. The calculated carrier effective mass of (Sr0.889-xLa0.111Bix)TiO2.963 is shown in Table 2. With the increase of Bi3+ concentration, the electronic effective mass of strontium titanate material system increases slightly, from 2.422 to 2.722 me. At the same time, electron effective mass of (Sr0.889-xLa0.111Bix)TiO2.963 is greater than that of SLT and SLTL, which is due to the larger mass of Bi3+.
Table 2.
m∗/me, µ, n of (Sr0.889-xLa0.111Bix)TiO2.963 at 300 K.
There is a relaxation time τ term in the electrical transport performance, and this paper adopts the DFT to deal with the electronic relaxation time [33]. According to the deformation potential theory and the rigid energy band model, the relaxation time does not change with the doping concentration, and the electronic relaxation time of the three-dimensional material is shown as:
where C3D is the elastic constant, E is the deformation potential energy, m* is the electronic effective mass, kB is the Boltzmann constant, ℏ as the Planck constant divided by 2 π, T is temperature, µ is the carrier mobility, and E is the unit charge.
By applying pressure to each unit cell to cause deformations of −1.5%, −1.0%, −0.5%, 0.0%, 0.5%, 1.0%, and 1.5%, the elastic constant C3D is calculated according to the energy–stress relationship. The deformation potential energy E is calculated according to the energy change of the conduction band energy level, and the electron effective mass m* is fitted according to the curve of the conduction band energy band. Finally, we substitute the parameters into the formula to obtain the relaxation time τ of each unit cell separately, and obtain the relationship between the relaxation time and temperature. As shown in Figure S2, when the temperature increases, the relaxation time decreases from 5.23–8.17 fs to 1.01–1.57 fs. Ohta [10] did a similar experiment and Kinaci [13] reported that the relaxation time of La3+-doped strontium titanate decreases from 8 fs to 1.5 fs, which is consistent with the calculated results in this work. It shows the rationality of this method to calculate the relaxation time.
It can be found from the figure that the relaxation times of the four unit cells of SLTB1, SLTB2, SLTB3, SLTB4 are similar. The relaxation times of SLT and SLTL are slightly smaller. This is mainly due to the fact that the excessive Bi3+ concentration reduces the deformation potential energy, E. The calculation of deformation potential theory is based on the scattering process between phonons and electrons, without considering optical phonon scattering and possible impurity scattering, which may lead to overestimation of relaxation time, electrical conductivity, and ZT at medium and low temperatures [41]. However, the changing trend of the conductivity and ZT of Bi3+ and La3+ doping in the high temperature section revealed in this study will not be affected.
Carrier mobility can be calculated according to the relaxation time, as shown in Formula (3). Carrier concentration can be calculated by carrier mobility and conductivity:
where σ is conductivity, µ is carrier mobility. The calculated carrier mobility and carrier concentration of (Sr0.889-xLa0.111Bix)TiO2.963 are shown in Table 2. For (Sr0.889-xLa0.111Bix)TiO2.963, with the increase of Bi3+ concentration, the carrier migration first increases and then decreases. When the doping concentration is 7.4%, the maximum carrier mobility is 8.937 cm2V−1s−1. The high carrier mobility of SLTB2 is due to the impurity level introduced by Bi3+ into the band structure, which acts as the carrier migration path. When the doping concentration of Bi3+ is greater than 11.1%, the excessive mass of Bi3+ greatly scatters the carrier, thus reducing the carrier mobility. The carrier mobility of SLTB1, SLTB2, SLTB3 and SLTB4 is similar at 8.5–9 cm2V−1s−1.
What is more, with the increase of Bi3+ concentration, the carrier concentration increases from 2.183 × 1021 cm−3 to 2.674 × 1021 cm−3. As can be seen from the defect chemical reaction equation, Bi3+ is a +3 valence state, and when it replaces Sr2+, it will introduce excessive electrons into the system, thus increasing the carrier concentration. Meanwhile, under the condition of the same concentration of Sr2+, the carrier concentration of SLTB2 (2.183 × 1021 cm−3) is lower than that of SLTL (2.905 × 1021 cm−3). This may be due to the fact that the contribution of Bi3+ to DOS at the bottom of the conduction band is smaller than that of La3+ at the same concentration. At the same time, the carrier concentration basically does not change with temperature and is greater than 1010 cm−3, indicating that the material is a degenerate semiconductor [42].
After the term of relaxation time is substituted, the Seebeck coefficient, electrical conductivity, power factor and electron thermal conductivity of (Sr0.889-xLa0.111Bix)TiO2.963 change with temperature are shown in Figure 8. The absolute value of Seebeck coefficient increases with the increase of temperature, from 91.428 μV/K–101.255 μV/K at 400 K to 129.225 μV/K–144.570 μV/K at 1200 K, indicating that the Bi3+-doped SrTiO3 material is an n-type degenerate semiconductor. By comparing SLTB, SLT, and SLTL, the absolute value of the Seebeck coefficient of the material with Bi3+ showed a relatively large value, which is consistent with the previous analysis of the band structure and state density. For (Sr0.889-xLa0.111Bix)TiO2.963, the absolute value of the Seebeck coefficient ranges from 91.428 μV/K to 144.570 μV/K, which is slightly smaller than the experimental data of 95 μV/K to 175 μV/K25. With the increase in Bi3+ concentration, although the effective electron mass of the material system increases, the Seebeck coefficient of the material decreases.
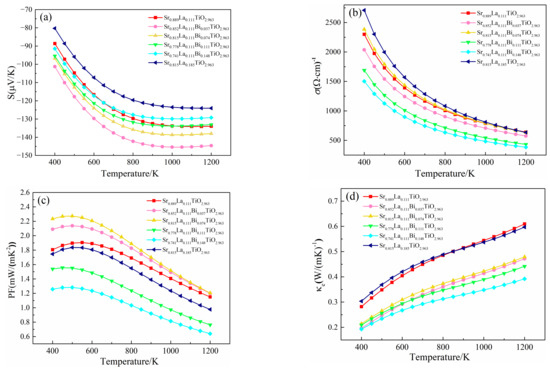
Figure 8.
Thermoelectric properties of (Sr0.889-xLa0.111Bix)TiO2.963 vary with temperature. (a) Seebeck coefficient; (b) conductivity; (c) power factor; (d) electronic thermal conductivity; (e) lattice thermal conductivity; (f) thermal conductivity; (g) ZT.
By comparing SLTB SLT and SLTL, the effective mass of electrons, carrier mobility and migration ability are increased after the introduction of Bi3+, but the carrier concentration is reduced. Due to the conductivity equation σ = neµ, finally, the conductivity of (Sr0.889-xLa0.111Bix)TiO2.963 was reduced [39]. The electrical conductivity of SLT and SLTL at 1200 K are 640.312/(Ω·m) and 642.797/(Ω·m), respectively, which is greater than the experimental data of 250/(Ω·m)–460/(Ω·m) [11,12,18]. For SLTB, with the increase of Bi3+ concentration, the carrier concentration of the material increases, the carrier mobility decreases, and the conductivity of the material first increases and then decreases. The material with a Bi3+-doping concentration of 7.4% obtained the maximum conductivity value (633.015/(Ω·m)). However, when the Bi3+concentration continues to increase, the carrier mobility decreases significantly. When Bi3+ concentration is 14.8%, the value of electrical conductivity moves down to 383.179/(Ω·m).
The reason why the conductivity of the material system is relatively high at room temperature is that the calculation considers the full excitation of electrons instead of the scattering of optical phonons and possible impurity. In practice, electrons can only gradually achieve thermal excitation when the temperature rises. So, the conductivity of the material at room temperature is overestimated [41].
By comparing SLTB and SLT, the power factor of SLTB1 and SLTB2 is higher than that of SLT. However, when the Bi3+ concentration is 11.1% and 14.8%, the power factor of (Sr0.889-xLa0.111Bix)TiO2.963 decreases sharply, indicating that an appropriate Bi3+ concentration (3.7–7.4%) is beneficial to optimize the power factor of the material. The power factors of SLTB were 1.199 mW/(mK2), 1.205 mW/(mK2), 0.762 mW/(mK2), and 0.639 mW/(mK2) at 1200 K, which is consistent with the experimental data of 0.5 mW/(mK2)–0.9 mW/(mK2) [25,36].
Thermal conductivity refers to the heat transferred by phonon transport in a temperature gradient. The main factors affecting it include average relative atomic mass, Young’s modulus, density, defects in the crystal and porosity. For the most perfect electrical-insulating materials, the heat transfer is mainly performed by phonon–phonon scattering. Combined with sound velocity and elastic properties, the lattice thermal conductivity of materials can be calculated. Slack derived the quantitative expression of intrinsic lattice thermal conductivity [32]:
where A is constant, A = 3.04 × 10⁷ W·mol/kg/m2/K3, M is the average atomic mass, n is the number of atoms in primitive cells, δ is average atomic volume, γ is Gruneisen parameters, including gamma sigma calculated by Poisson’s ratio 24, and ΘD is the Debye temperature. σ and ΘD are calculated by the mechanical properties with first principles; the detailed data are shown in Table S1.
Due to the scattering of acoustic phonons with the increase of temperature, the relationship between thermal conductivity and temperature in the experiment is often expressed as κ = A/T + LσT, where A/T and LσT are respectively the thermal conductivity of lattices and the thermal conductivity of electrons [43]. The electronic thermal conductivity has been substituted into the relaxation time term, and the calculated relation of electron thermal conductivity with temperature is shown in Figure 8d. The electron thermal conductivity of SLTB is smaller than that of SLT and SLTL. At present, a lot of research on the lattice thermal conductivity of La3+-doped SrTiO3 materials in the experiment have been reported [4,5,6,7,8,9,10,11,12]. The lattice thermal conductivity of Sr0.9La0.1TiO3 at 1073K is within the trend range of 2.0–2.6 W/m·K, and the relationship between the lattice thermal conductivity of Sr0.9La0.1TiO3 and temperature is as follows: κl = 2860.0/T. The detailed fitting process is seen in the Supplementary Materials. Finally, the variation of lattice thermal conductivity with temperature calculated by combining experimental data with Slack model is shown in Figure 8e.
The lattice thermal conductivity of SLT, SLTB1, SLTB2, SLTB3, SLTB4 and SLTL at 1200 K are 2.454 W/m·K, 3.465 W/m·K, 2.594 W/m·K, 2.383 W/m·K, 2.686 W/m·K and 2.516 W/m·K, respectively. It can be seen that the lattice thermal conductivities of SLT, SLTB2, SLTB3, SLTB4 and SLTL are similar, except for SLTB1 with a larger lattice thermal conductivity. When the temperature is 1200 K, the lowest lattice thermal conductivity is 2.383 W/m·K for SLTB3. κl is related to lattice distortion [44], a phonon-scattering effect by Bi3+ [45] and the average mass of lattice atoms [32]. The larger the lattice distortion is, the smaller the lattice symmetry is. The strain field fluctuation leads to lattice relaxation, which slows down the propagation speed of phonons and inhibits the κl [44]. Meanwhile, due to the mass difference between the doped ions Bi3+ and Sr2+, the phonon scattering is enhanced, thus reducing the lattice thermal conductivity [45]. However, a lager average mass of lattice atoms lead to higher κl [32]. From Table 1, the lattice distortion degree of SLT is larger than SLTB1. Therefore, despite the presence of a phonon-scattering effect by Bi3+, κl of SLTB1 increases. When Bi3+-doping concentration increases to 7.4–11.1%, the Ti–O bond length and Bi–O bond length both increase, the lattice distortion degree increases, and the phonon-scattering effect of Bi3+ ion increases, so κl decreases. κl is the lowest when Bi3+-doping concentration is 11.1%. When the Bi3+-doping concentration is further increased to 14.8%, the heavier Bi3+ ions greatly increase the average atomic mass of the cell, as shown in Table S2. Despite the enhanced lattice distortion and phonon scattering, the bigger average mass of lattice atoms lead to higher κl of SLTB4 than that of SLTB3.
The total thermal conductivity of (Sr0.889-xLa0.111Bix)TiO2.963 is shown in Figure 8f. The trends of total thermal conductivity and lattice thermal conductivity are basically identical. The total thermal conductivity of SLT, SLTB2, SLTB3, SLTB4 and SLTL is similar except for SLTB1 with a larger total thermal conductivity. Due to the enhanced phonon scattering at high temperature, the total thermal conductivity decreases with increasing temperature, ranging from 7.4–10.6 W/m·K at room temperature to 2.8–3.9 W/m·K at 1200 K, which is consistent with the reported data of 8.2 W/m·K at 373 K to 2.5 W/m·K at 973 K [36].
Figure 8g shows the ZT of (Sr0.889-xLa0.111Bix)TiO2.963 as a function of temperature. The ZT of SLTB increases with temperature from 0.06–0.11 (400 K) to 0.25–0.48 (1200 K). The ZT of SLT and SLTL increased from 0.09–0.10 (400 K) to 0.37–0.46 (1200 K). When the Bi3+ concentration is 7.4%, the maximum ZT value is 0.48 for SLTB2 at 1200 K. However, except for SLTB2, the ZT values of SLTB are all smaller than that of SLT and SLTL. When the Bi3+ concentration is 14.8%, the ZT value decreases to 0.25.
The results of thermoelectric calculation show that only an appropriate Bi3+-doping concentration (7.4%) can optimize the thermoelectric properties of materials. A smaller Bi3+ concentration (3.7–7.4%) can increase the Seebeck coefficient of the material and thus have a larger power factor, but its thermal conductivity is higher. Although a larger Bi3+-doping concentration (11.1–14.8%) will reduce the thermal conductivity of the material, it will significantly deteriorate the electrical conductivity of the material, resulting in a lower ZT. Therefore, the Bi3+-doping concentration could be 7.4%, which is best for practical preparation of the real materials and applications. In the future, more suitable dopants should be searched to improve the electrical transport performance of materials on the basis of reducing the thermal conductivity of materials, so as to obtain excellent thermoelectric performance.
4. Conclusions
The thermoelectric properties of (Sr0.889-xLa0.111Bix)TiO2.963 were studied by the first principles method. The introduction of Bi3+ affects the crystal cell structure and electronic structure of (Sr0.889-xLa0.111Bix)TiO2.963, and increases the cell parameters, cell asymmetry and band gap. The introduction of Bi3+ increases the asymmetry of DOS with respect to the Fermi level, thus increasing the absolute Seebeck coefficient of the material. When the Bi3+ concentration increases, the electronic effective mass increases, the carrier mobility decreases, and the carrier concentration increases. When the Bi3+concentration of is 3.7% and 7.4%, the conductivity and power factor of the material are larger. However, when the Bi3+-doping concentration is higher than 11.1%, the excessive Bi3+-doping concentration greatly deteriorates the electrical conductivity and power factor of the material. The lattice distortion caused by Bi3+ doping greatly enhances the phonon scattering and decreases the thermal conductivity. Finally, when Bi3+ concentration was 7.4%, the maximum ZT of 0.48 for Sr0.815La0.111Bi0.074TiO2.963 at 1200 K was obtained. The results show that an appropriate Bi3+-doping concentration (7.4%) can effectively optimize the electrical transport performance of the material, enhance the ZT and improve the thermoelectric properties of SrTiO3.
Supplementary Materials
The following supporting information can be downloaded at: https://www.mdpi.com/article/10.3390/cryst13020178/s1, Figure S1: Chemical potential dependent of S2σ/τ for (Sr0.889-xLa0.111Bix)TiO2.963 at 1200 K; Figure S2: Temperature dependent of τ for (Sr0.889-xLa0.111Bix)TiO2.963; Table S1: Mechanical properties of (Sr0.889-xLa0.111Bix)TiO2.963; Table S2: Thermal properties of (Sr0.889-xLa0.111Bix)TiO2.963.
Author Contributions
Conceptualization, P.Z. and Z.L.; methodology, L.G.; software, L.G.; data curation, P.Z.; writing—original draft preparation, L.G.; writing—review and editing, P.Z. and Z.L.; visualization, Z.W. (Ziyao Wei) and Z.W. (Zhuozhao Wu); supervision, X.C., W.X. and Y.W.; project administration, J.X. and F.G. All authors have read and agreed to the published version of the manuscript.
Funding
This research was funded by National Natural Science Foundation of China (No. 52272123, 52072301), the China-Poland International Collaboration Fund of National Natural Science Foundation of China (No. 51961135301), National Innovative Entrepreneurship Training Program for Undergraduates (S202210699186), the Fundamental Research Funds for the Central Universities (No. D5000210722), the Research Fund of State Key Laboratory of Solidification Processing (NPU) (No. 2021-TS-08), the Open Fund of State Key Laboratory of New Ceramic and Fine Processing Tsinghua University (No. KFZD202102), and the ‘111’ Project (No. B20028).
Institutional Review Board Statement
Not applicable.
Informed Consent Statement
Not applicable.
Data Availability Statement
The data presented in this study are available on request from the corresponding authors.
Acknowledgments
The authors gratefully acknowledge the National Natural Science Foundation of China, the China-Poland International Collaboration Fund of National Natural Science Foundation of China, National Innovative Entrepreneurship Training Program for Undergraduates, the Fundamental Research Funds for the Central Universi-ties, the Research Fund of State Key Laboratory of Solidification Processing (NPU), the Open Fund of State Key Laboratory of New Ceramic and Fine Pro-cessing Tsinghua University, and the ‘111’ Project.
Conflicts of Interest
The authors declare no conflict of interest.
References
- Okhay, O.; Zlotnik, S.; Xie, W.; Orlinski, K.; Gallo, M.J.H.; Otero-Irurueta, G.; Fernandes, A.J.S.; Pawlak, D.A.; Weidenkaff, A.; Tkach, A. Thermoelectric performance of Nb-doped SrTiO3 enhanced by reduced graphene oxide and Sr deficiency cooperation. Carbon 2019, 143, 215–222. [Google Scholar] [CrossRef]
- Elsheikh, M.H.; Shnawah, D.A.; Sabri, M.F.M.; Said, S.B.M.; Hassan, M.H.; Bashir, M.B.A.; Mohamad, M. A review on thermoelectric renewable energy: Principle parameters that affect their performance. Renew. Sust. Energ. Rev. 2014, 30, 337–355. [Google Scholar] [CrossRef]
- Zhang, B.; Wang, J.; Zou, T.; Zhang, S.; Yaer, X.; Ding, N.; Liu, C.; Miao, L.; Li, Y.; Wu, Y. High thermoelectric performance of Nb-doped SrTiO3 bulk materials with different doping levels. J. Mater. Chem. C. 2015, 3, 11406–11411. [Google Scholar] [CrossRef]
- Lu, Z.; Zhang, H.; Lei, W.; Sinclair, D.C.; Reaney, I.M. High-figure-of-merit thermoelectric La-doped A site-deficient SrTiO3 ceramics. Chem. Mater. 2016, 28, 925–935. [Google Scholar] [CrossRef]
- Wang, K.X.; Wang, J.; Li, Y.; Zou, T.; Wang, X.H.; Li, J.B.; Cao, Z.; Shi, W.J.; Yaer, X. Enhancement of thermoelectric properties of SrTiO3/LaNb-SrTiO3 composite by different doping levels. Chin. Phys. B. 2018, 27, 048401. [Google Scholar] [CrossRef]
- Li, X.; Zhao, H.; Zhou, X.; Xu, N.; Xie, Z.; Chen, N. Electrical conductivity and structural stability of La-doped SrTiO3 with A-site deficiency as anode materials for solid oxide fuel cells. Int. J. Hydrogen Energ. 2010, 35, 7913–7918. [Google Scholar] [CrossRef]
- Zhang, P.; Gong, L.Y.; Lou, Z.H.; Xu, J.; Cao, S.Y.; Zhu, J.T.; Yan, H.X.; Gao, F. Reduced lattice thermal conductivity of perovskite-type high-entropy (Ca0.25Sr0.25Ba0.25RE0.25)TiO3 ceramics by phonon engineering for thermoelectric applications. J. Alloys Compd. 2022, 898, 162858. [Google Scholar] [CrossRef]
- Qin, M.J.; LouA, Z.H.; Zhang, P.; Shi, Z.M.; Xu, J.; Chen, Y.; Gao, F. Enhancement of thermoelectric performance of Sr0.9La0.1TiO3-based ceramics regulated by nanostructures. ACS Appl. Mater. Inter. 2020, 12, 53899–53909. [Google Scholar] [CrossRef]
- Muta, H.; Kurosaki, K.; Yamanaka, S. Thermoelectric properties of reduced and La-doped single-crystalline SrTiO3. J. Alloys Compd. 2005, 392, 306–309. [Google Scholar] [CrossRef]
- Ohta, S.; Nomura, T.; Ohta, H.; Koumoto, K. High-temperature carrier transport and thermoelectric properties of heavily La- or Nb-doped SrTiO3 single crystals. J. Appl. Phys. 2005, 97, 034106. [Google Scholar] [CrossRef]
- Park, K.; Son, J.S.; Woo, S.I.; Shin, K.; Oh, M.-W.; Park, S.-D.; Hyeon, T. Colloidal synthesis and thermoelectric properties of La-doped SrTiO3 nanoparticles. J. Mater. 2014, 2, 4217–4224. [Google Scholar] [CrossRef]
- Wang, J.; Zhang, B.Y.; Kang, H.J.; Li, Y.; Yaer, X.; Li, J.F.; Tan, Q.; Zhang, S.; Fan, G.H.; Liu, C.Y.; et al. Record high thermoelectric performance in bulk SrTiO3 via nano-scale modulation doping. Nano Energy 2017, 35, 387–395. [Google Scholar] [CrossRef]
- Kinaci, A.; Sevik, C.; Çagin, T. Electronic transport properties of SrTiO3 and its alloys: Sr1-xLaxTiO3 and SrTi1-xMxO3 (M=Nb,Ta). Phys. Rev. B. 2010, 82, 155114. [Google Scholar] [CrossRef]
- Zou, D.; Liu, Y.; Xie, S.; Lin, J.; Li, J. Effect of strain on thermoelectric properties of SrTiO3: First-principles calculations. Chem. Phys. Lett. 2013, 586, 159–163. [Google Scholar] [CrossRef]
- Feng, L.; Shiga, T.; Shiomi, J. Phonon transport in perovskite SrTiO3 from first principles. Appl. Phys. Express. 2015, 8, 071501. [Google Scholar] [CrossRef]
- Gillani, S.S.A.; Ahmad, R.; Din, I.U.; Rizwan, M.; Shakil, M.; Rafique, M.; Murtaza, G.; Jin, H.B. First-principles investigation of structural, electronic, optical and thermal properties of Zinc doped SrTiO3. Optik 2020, 201, 163481. [Google Scholar] [CrossRef]
- Singsoog, K.; Seetawan, T.; Vora-Ud, A.; Thanachayanont, C. Theoretical enhancement of thermoelectric properties of Sr1-xLaxTiO3. Integr. Ferroelectr. 2014, 155, 111–118. [Google Scholar] [CrossRef]
- Li, Y.; Hou, Q.Y.; Wang, X.H.; Kang, H.J.; Yaer, X.; Li, J.B.; Wang, T.M.; Miao, L.; Wang, J. First-principles calculations and high thermoelectric performance of La-Nb doped SrTiO3 ceramics. J. Mater. 2019, 7, 236–247. [Google Scholar] [CrossRef]
- Zhang, R.; Wang, C.; Li, J.; Su, W.; Zhang, J.; Zhao, M.; Liu, J.; Zhang, Y.; Mei, L. Determining Seebeck coefficient of heavily doped La:SrTiO3 from density functional calculations. Solid State Sci. 2010, 12, 1168–1172. [Google Scholar] [CrossRef]
- Baniecki, J.D.; Ishii1, M.; Aso1, H.; Kurihara, K.; Ricinschi, D. Density functional theory and experimental study of the electronic structure and transport properties of La, V, Nb, and Ta doped SrTiO3. J. Appl. Phys. 2013, 113, 013701. [Google Scholar] [CrossRef]
- Adessi, C.; Thébaud, S.; Bouzerar, R.; Bouzerar, G. Ab initio investigation of the role of vanadium impurity states in SrTiO3 for thermoelectricity. J. Phys. Chem. Solids. 2020, 138, 109180. [Google Scholar] [CrossRef]
- Shenoy, U.S.; Bhat, D.K. Electronic structure engineering of SrTiO3 via rhodium doping: A DFT study. J. Phys. Chem. Solids. 2021, 148, 109708. [Google Scholar] [CrossRef]
- Sikam, P.; Sararat, C.; Moontragoon, P.; Kaewmaraya, T.; Maensiri, S. Enhanced thermoelectric properties of N-doped ZnO and SrTiO3: A first principles study. Appl. Surf. Sci. 2018, 446, 47–58. [Google Scholar] [CrossRef]
- Chen, Q.; Zhang, P.; Qin, M.J.; Lou, Z.H.; Gong, L.Y.; Xu, J.; Kong, J.; Yan, H.X.; Gao, F. Effect of La3+, Ag+ and Bi3+ doping on thermoelectric properties of SrTiO3: First-principles investigation. Ceram. Int. 2022, 48, 13803–13816. [Google Scholar] [CrossRef]
- Gong, C.L.; Dong, G.G.; Hu, J.X.; Chen, Y.S.; Qin, M.J.; Yang, S.J.; Gao, F. Effect of reducing annealing on the microstructure and thermoelectric properties of La–Bi co-doped SrTiO3 ceramics. J. Mater. Sci. Mater. Electron. 2017, 28, 14893–14900. [Google Scholar] [CrossRef]
- Zhang, R.Z.; Wang, C.L.; Li, J.C.; Mei, L.M. Theoretical analysis of cascade levels forming in SrTiO3. Acta Phys. Sin. 2009, 58, 7162–7167. [Google Scholar] [CrossRef]
- Qin, M.; Gao, F.; Cizek, J.; Yang, S.; Fan, X.; Zhao, L.; Xu, J.; Dong, G.; Reece, M.; Yan, H. Point defect structure of La-doped SrTiO3 ceramics with colossal permittivity. Acta Mater. 2019, 164, 76–89. [Google Scholar] [CrossRef]
- Tomio, T.; Miki, H.; Tabata, H.; Kawai, T.; Kawai, S. Control of electrical conductivity in laser deposited SrTiO3 thin films with Nb doping. J. Appl. Phys. 1994, 76, 5886–5890. [Google Scholar] [CrossRef]
- Kresse, G.; Furthmüller, J. Efficiency of ab-initio total energy calculation for metals and semiconductors using a plane-wave basis set. Comput. Mater. Sci. 1996, 6, 15–50. [Google Scholar] [CrossRef]
- Wang, V.; Xu, N.; Liu, J.C.; Tang, G.; Geng, W.T. VASPKIT: A user-friendly interface facilitating high-throughput computing and analysis using VASP Code. Comput. Phys. Commun. 2021, 267, 108033. [Google Scholar] [CrossRef]
- Madsen, G.K.H.; Carrete, J.; Verstraete, M.J. BoltzTraP2, a program for interpolating band structures and calculating semi-classical transport coefficients. Comput. Phys. Commun. 2018, 231, 140–145. [Google Scholar] [CrossRef]
- Slack, G.A. Nonmetallic crystals with high thermal conductivity. J. Phys. Chem. Solids. 1973, 34, 321–335. [Google Scholar] [CrossRef]
- Bardeen, J.; Shockley, W. Deformation potentials and mobilities in non-polar crystals. Phys. Rev. 1950, 80, 72–80. [Google Scholar] [CrossRef]
- Kohn, W.; Sham, L.J. Self-consistent equations including exchange and correlation Effects. Phys. Rev. A. 1965, 140, A1133. [Google Scholar] [CrossRef]
- Hashimoto, S.; Kindermann, L.; Poulsen, F.W.; Mogensen, M. A study on the structural and electrical properties of lanthanum-doped strontium titanate prepared in air. J. Alloy. Compd. 2005, 397, 245–249. [Google Scholar] [CrossRef]
- Chen, C.; Bousnina, M.; Giovannelli, F.; Delorme, F. Influence of Bi on the thermoelectric properties of SrTiO3-δ. J. Materiomics 2019, 5, 88–93. [Google Scholar] [CrossRef]
- Benrekia, A.R.; Benkhettou, N.; Nassour, A.; Driz, M.; Sahnoun, M.; Lebèguec, S. Structural, electronic and optical properties of cubic SrTiO3 and KTaO3: Ab initio and GW calculations. Physica. B Condens. 2012, 407, 2632–2636. [Google Scholar] [CrossRef]
- Benthem, K.V.; Elsässer, C.; French, R.H. Bulk electronic structure of SrTiO3: Experiment and theory. J. Appl. Phys. 2001, 90, 6156. [Google Scholar] [CrossRef]
- Zilber, T.; Cohen, S.; Fuks, D.; Gelbstein, Y. TiNiSn half-Heusler crystals grown from metallic flux for thermoelectric applications. J. Alloys Compd. 2019, 781, 1132–1138. [Google Scholar] [CrossRef]
- Vurgaftman, I.; Meyer, J.R.; Ram-Mohan, L. Band parameters for III–V compound semiconductors and their alloys. J. Appl. Phys. 2001, 89, 5815–5875. [Google Scholar] [CrossRef]
- Wang, N.; Li, M.; Xiao, H.; Gong, H.; Liu, Z.; Zua, X.; Qiao, L. Optimizing the thermoelectric transport properties of Bi2O2Se monolayer via biaxial strain. Phys. Chem. Chem. Phys. 2019, 21, 15097–15105. [Google Scholar] [CrossRef] [PubMed]
- Ganguly, P.; Vasanthacharya, N.Y.; Rao, C.N.R.; Edwards, P.P. Composition-controlled metal-insulator transitions and minimum metallic conductivity in the oxide systems LaNi1-xMxO3 (M = Cr, Mn, Fe, or Co). Phys. Rev. B Solid State 1978, 17, 2575–2581. [Google Scholar] [CrossRef]
- Sun, J.F.; Singh, D.J. Thermoelectric properties of n-type SrTiO3. APL Mater. 2016, 4, 104803. [Google Scholar] [CrossRef]
- Wan, C.L.; Pan, W.; Xu, Q.; Qin, Y.X.; Wang, J.D.; Qu, Z.X.; Fang, M.H. Effect of point defects on the thermal transport properties of (LaxGd1−x)2Zr2O7 experiment and theoretical model. Phys. Rev. B. 2006, 74, 144109. [Google Scholar] [CrossRef]
- Liu, D.; Zhang, Y.; Kang, H.; Li, J.L.; Chen, Z.N.; Wang, T.M. Direct preparation of La-doped SrTiO3 thermoelectric materials by mechanical alloying with carbon burial sintering. J. Eur. Ceram. Soc. 2018, 38, 807–811. [Google Scholar] [CrossRef]


Disclaimer/Publisher’s Note: The statements, opinions and data contained in all publications are solely those of the individual author(s) and contributor(s) and not of MDPI and/or the editor(s). MDPI and/or the editor(s) disclaim responsibility for any injury to people or property resulting from any ideas, methods, instructions or products referred to in the content. |
© 2023 by the authors. Licensee MDPI, Basel, Switzerland. This article is an open access article distributed under the terms and conditions of the Creative Commons Attribution (CC BY) license (https://creativecommons.org/licenses/by/4.0/).