3.1. Ambient Pressure Results
LiInCr
O
crystallizes in the cubic space group F
3m with four formula units per unit cell [
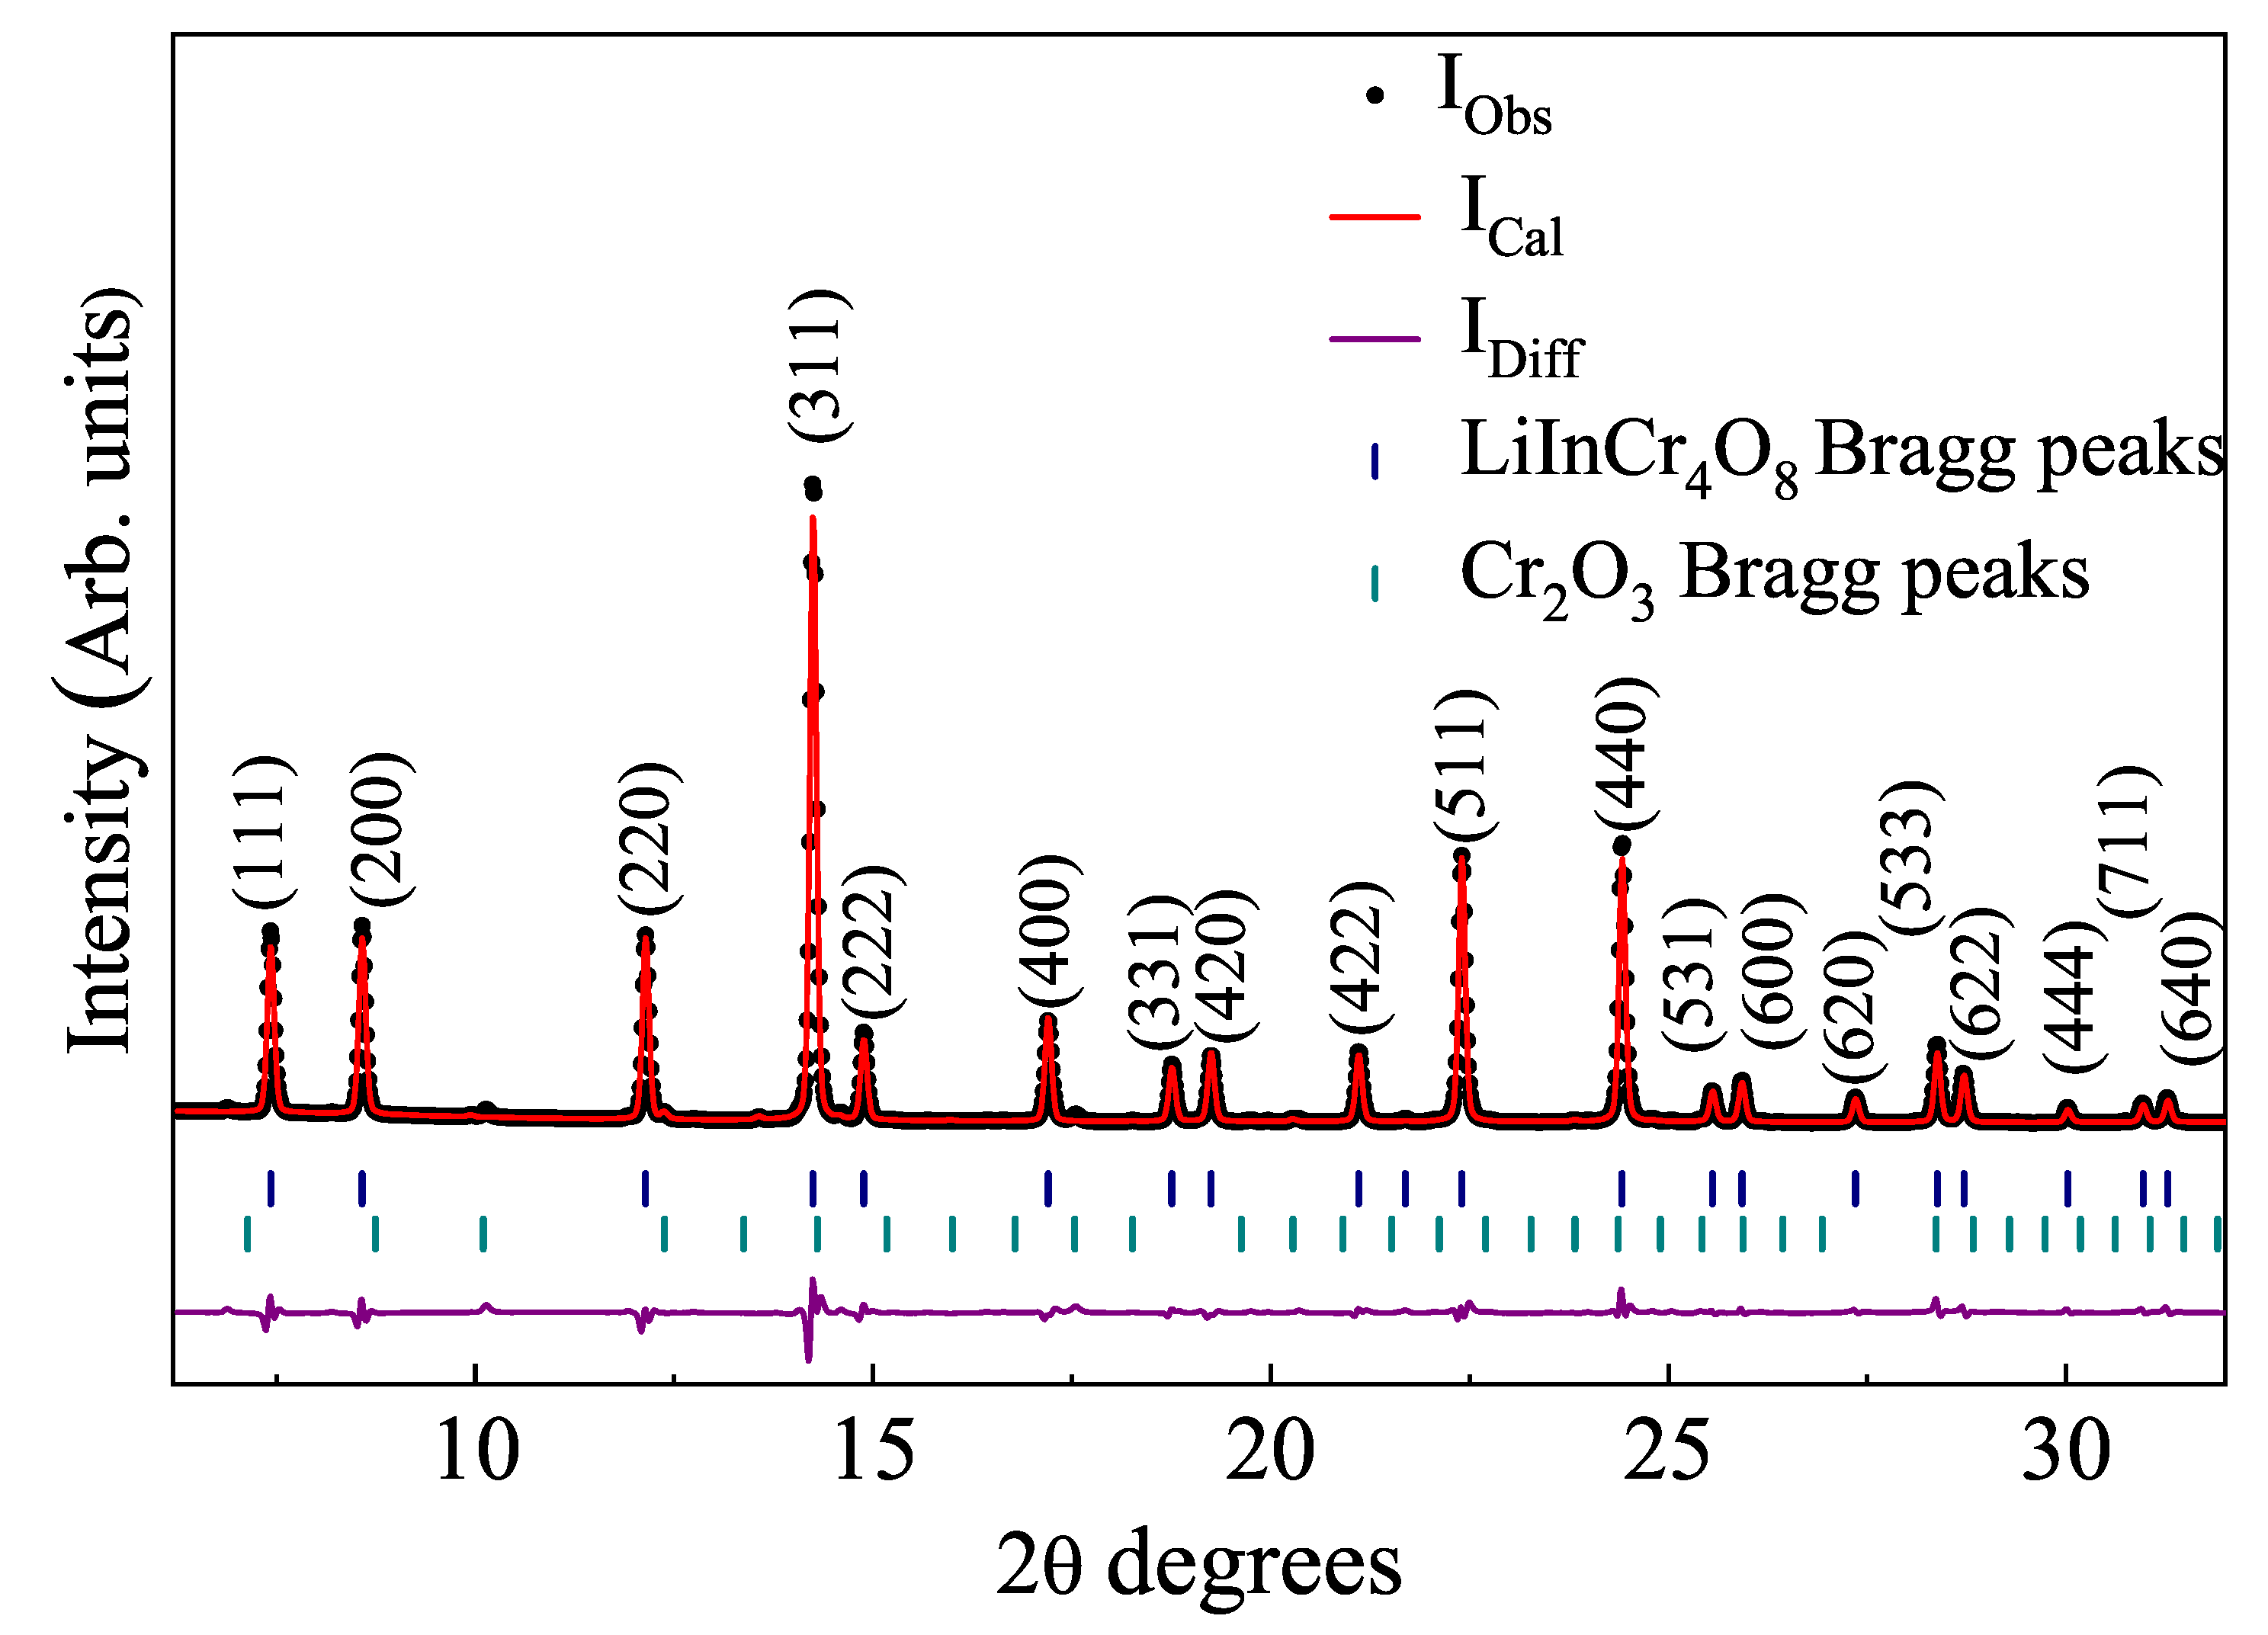
5]. The lattice parameter, shape profile parameters, and asymmetry corrections were refined during the Rietveld refinement of the ambient pressure XRD pattern, shown in
Figure 2. The background was fitted using a Chebyschev polynomial. The synthesized sample contains less than 2% unreacted Cr
O
as observed from
Figure 2. The refined lattice parameter is
a = 8.4038(1) Å and the unit cell volume amounts to V = 593.52(2) Å
, with R
= 0.075 and R
= 0.109. These values are in good agreement with the reported values of
a = 8.4205 Å and V = 597.05 Å
[
4,
5]. The fractional coordinates, occupations, and Wyckoff sites as reported by an earlier study [
5] and the refined thermal parameter obtained from the Rietveld analysis are given in
Table 1.
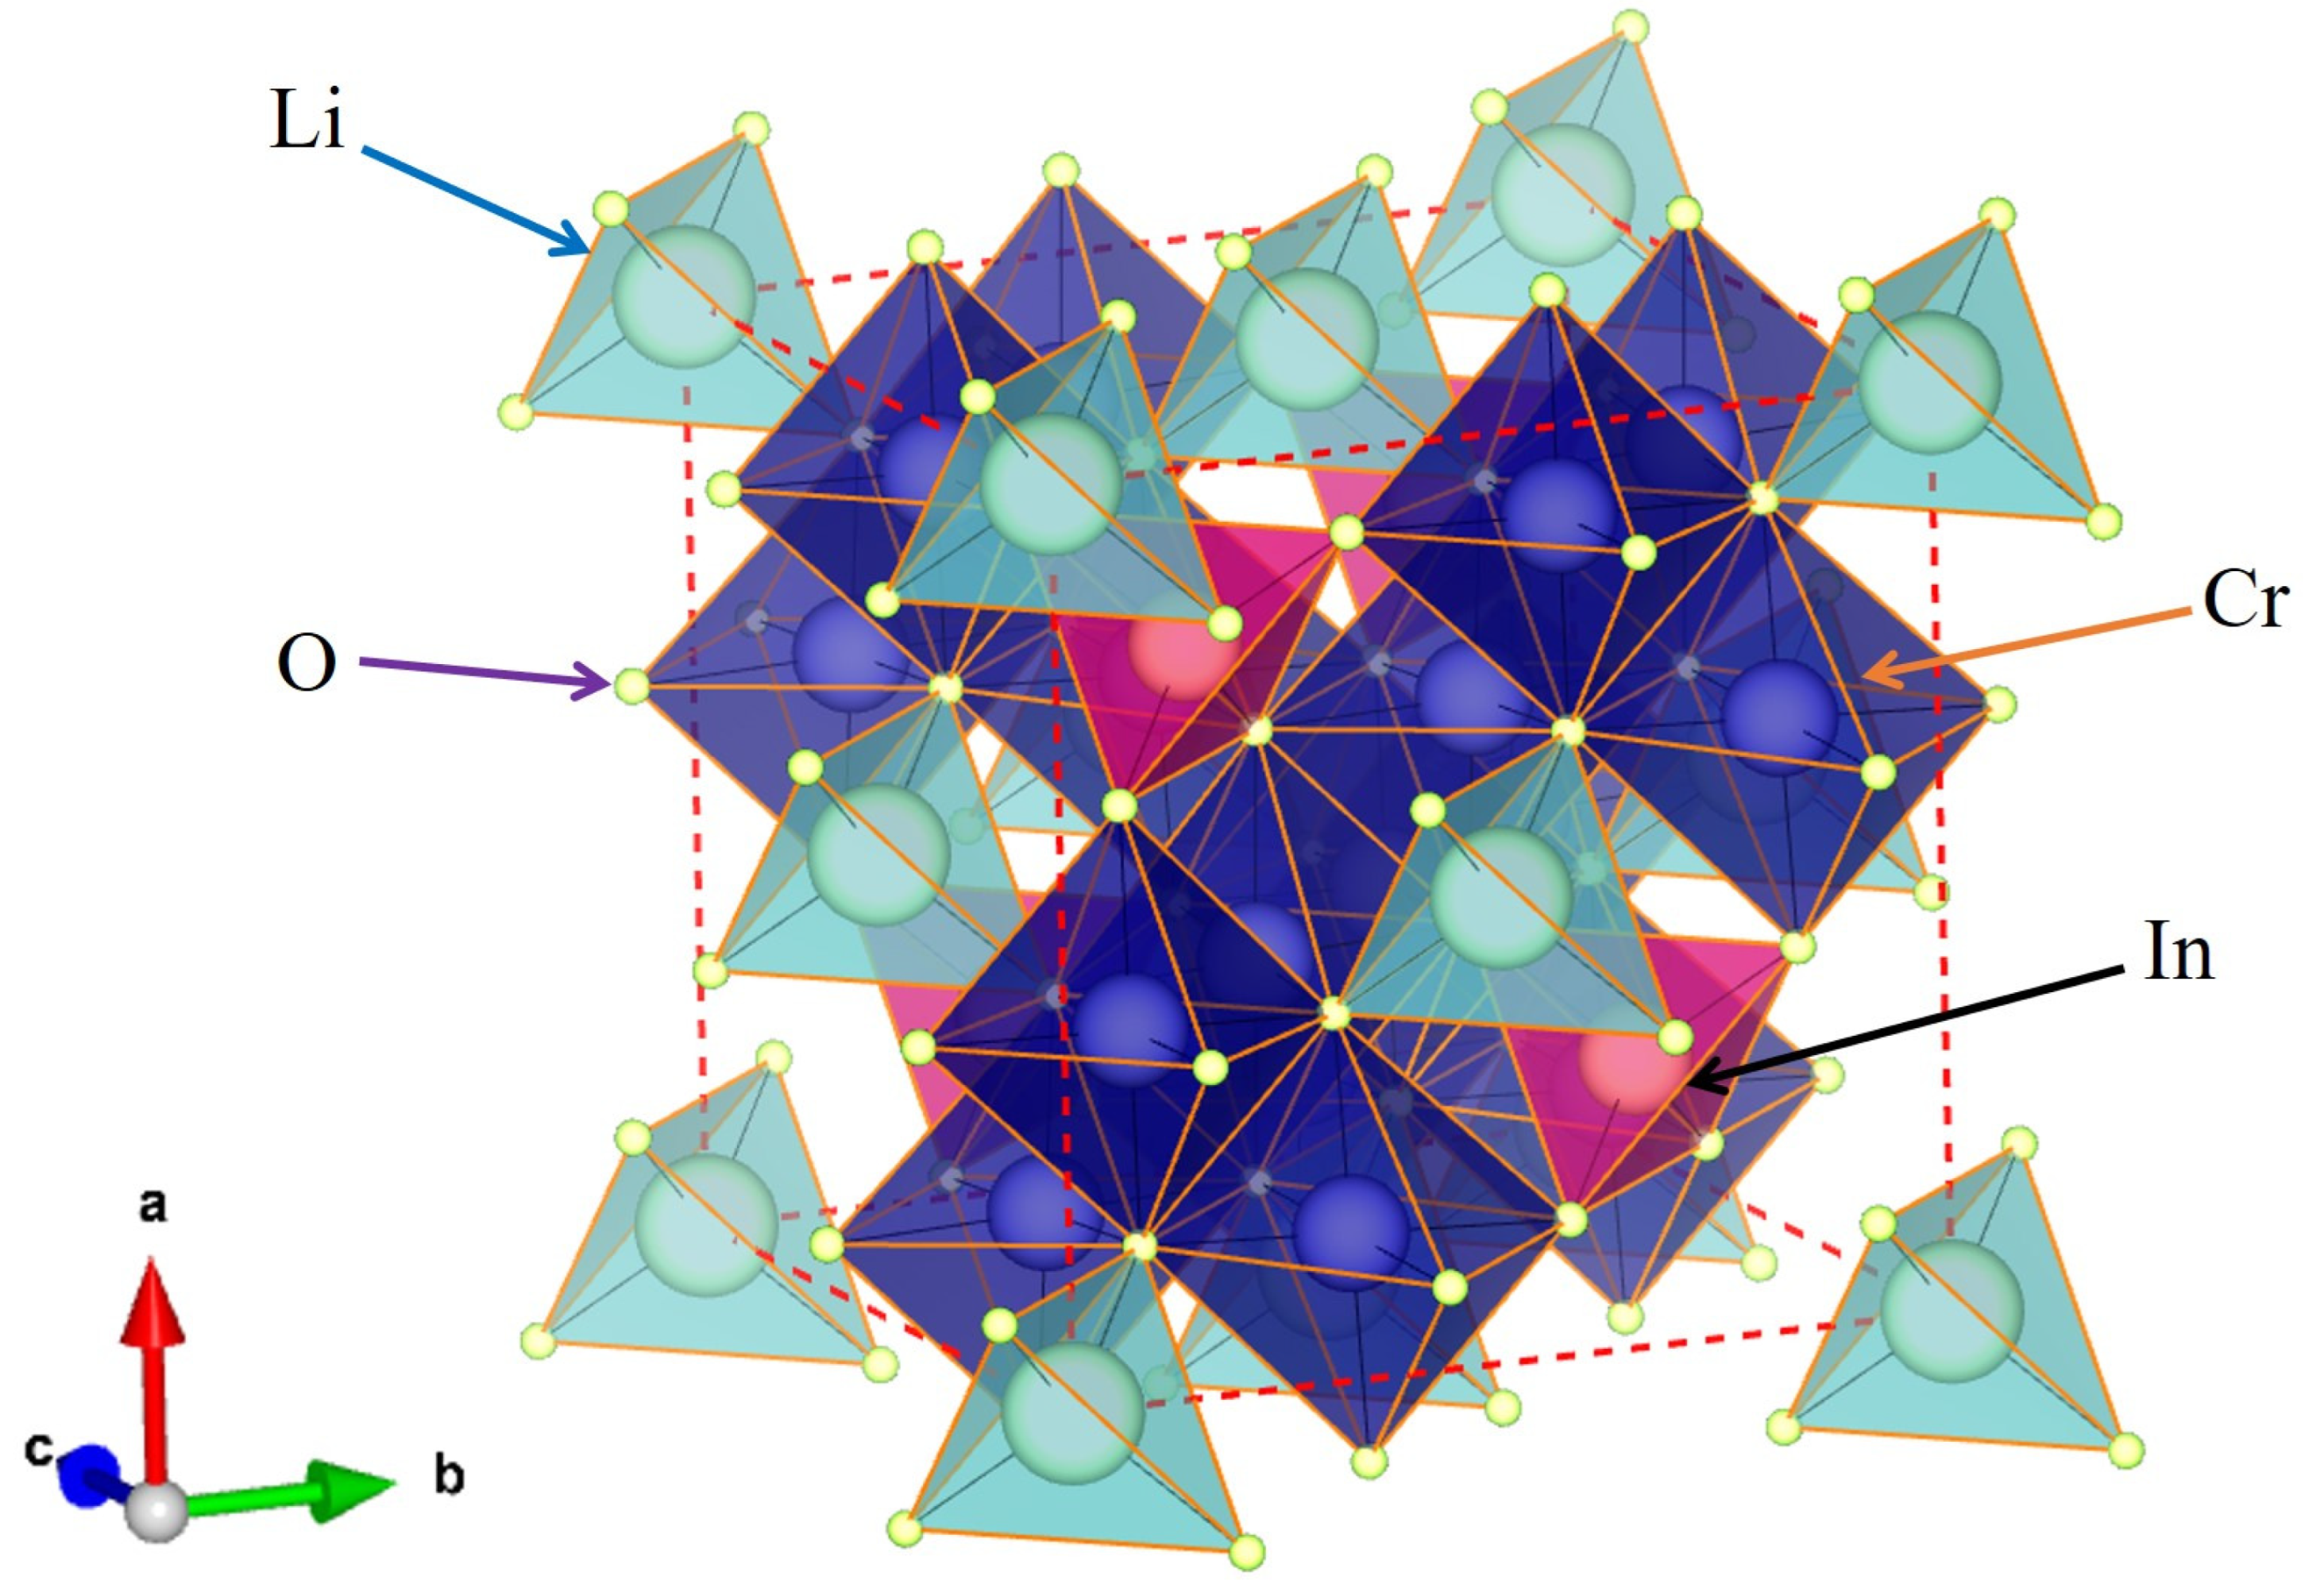
DFT-based simulations were performed using LDA and GGA pseudopotentials and the results for ambient volume calculations are compared in
Table 2. The
A-site cations Li
and In
at 4a and 4d crystallographic sites form LiO
and InO
tetrahedra, respectively, and share corners with CrO
at the B-site (see
Figure 1). The CrO
octahedral units at the general 16e Wyckoff positions have shared edges between them, and the Cr
tetrahedra form the breathing pyrochlore lattice. The Cr–Cr distances are usually short enough to facilitate electron hopping in some of the conventional spinels (Mott insulators). The quality of synthesized sample was verified by determining the degree of distortion (d
/d) due to the two different Cr–Cr bond lengths of Cr
tetrahedra from the Rietveld refinement, where the ratio d
/d is found to be 1.051, which matches with the reported value [
4,
5,
8]. This ratio of dissimilar Cr–Cr distances can be directly associated with the breathing factor B
in LiInCr
O
.
For a primitive cell containing one formula unit (14 atoms), the factor group analysis gives the following irreducible representations:
This can further be classified as:
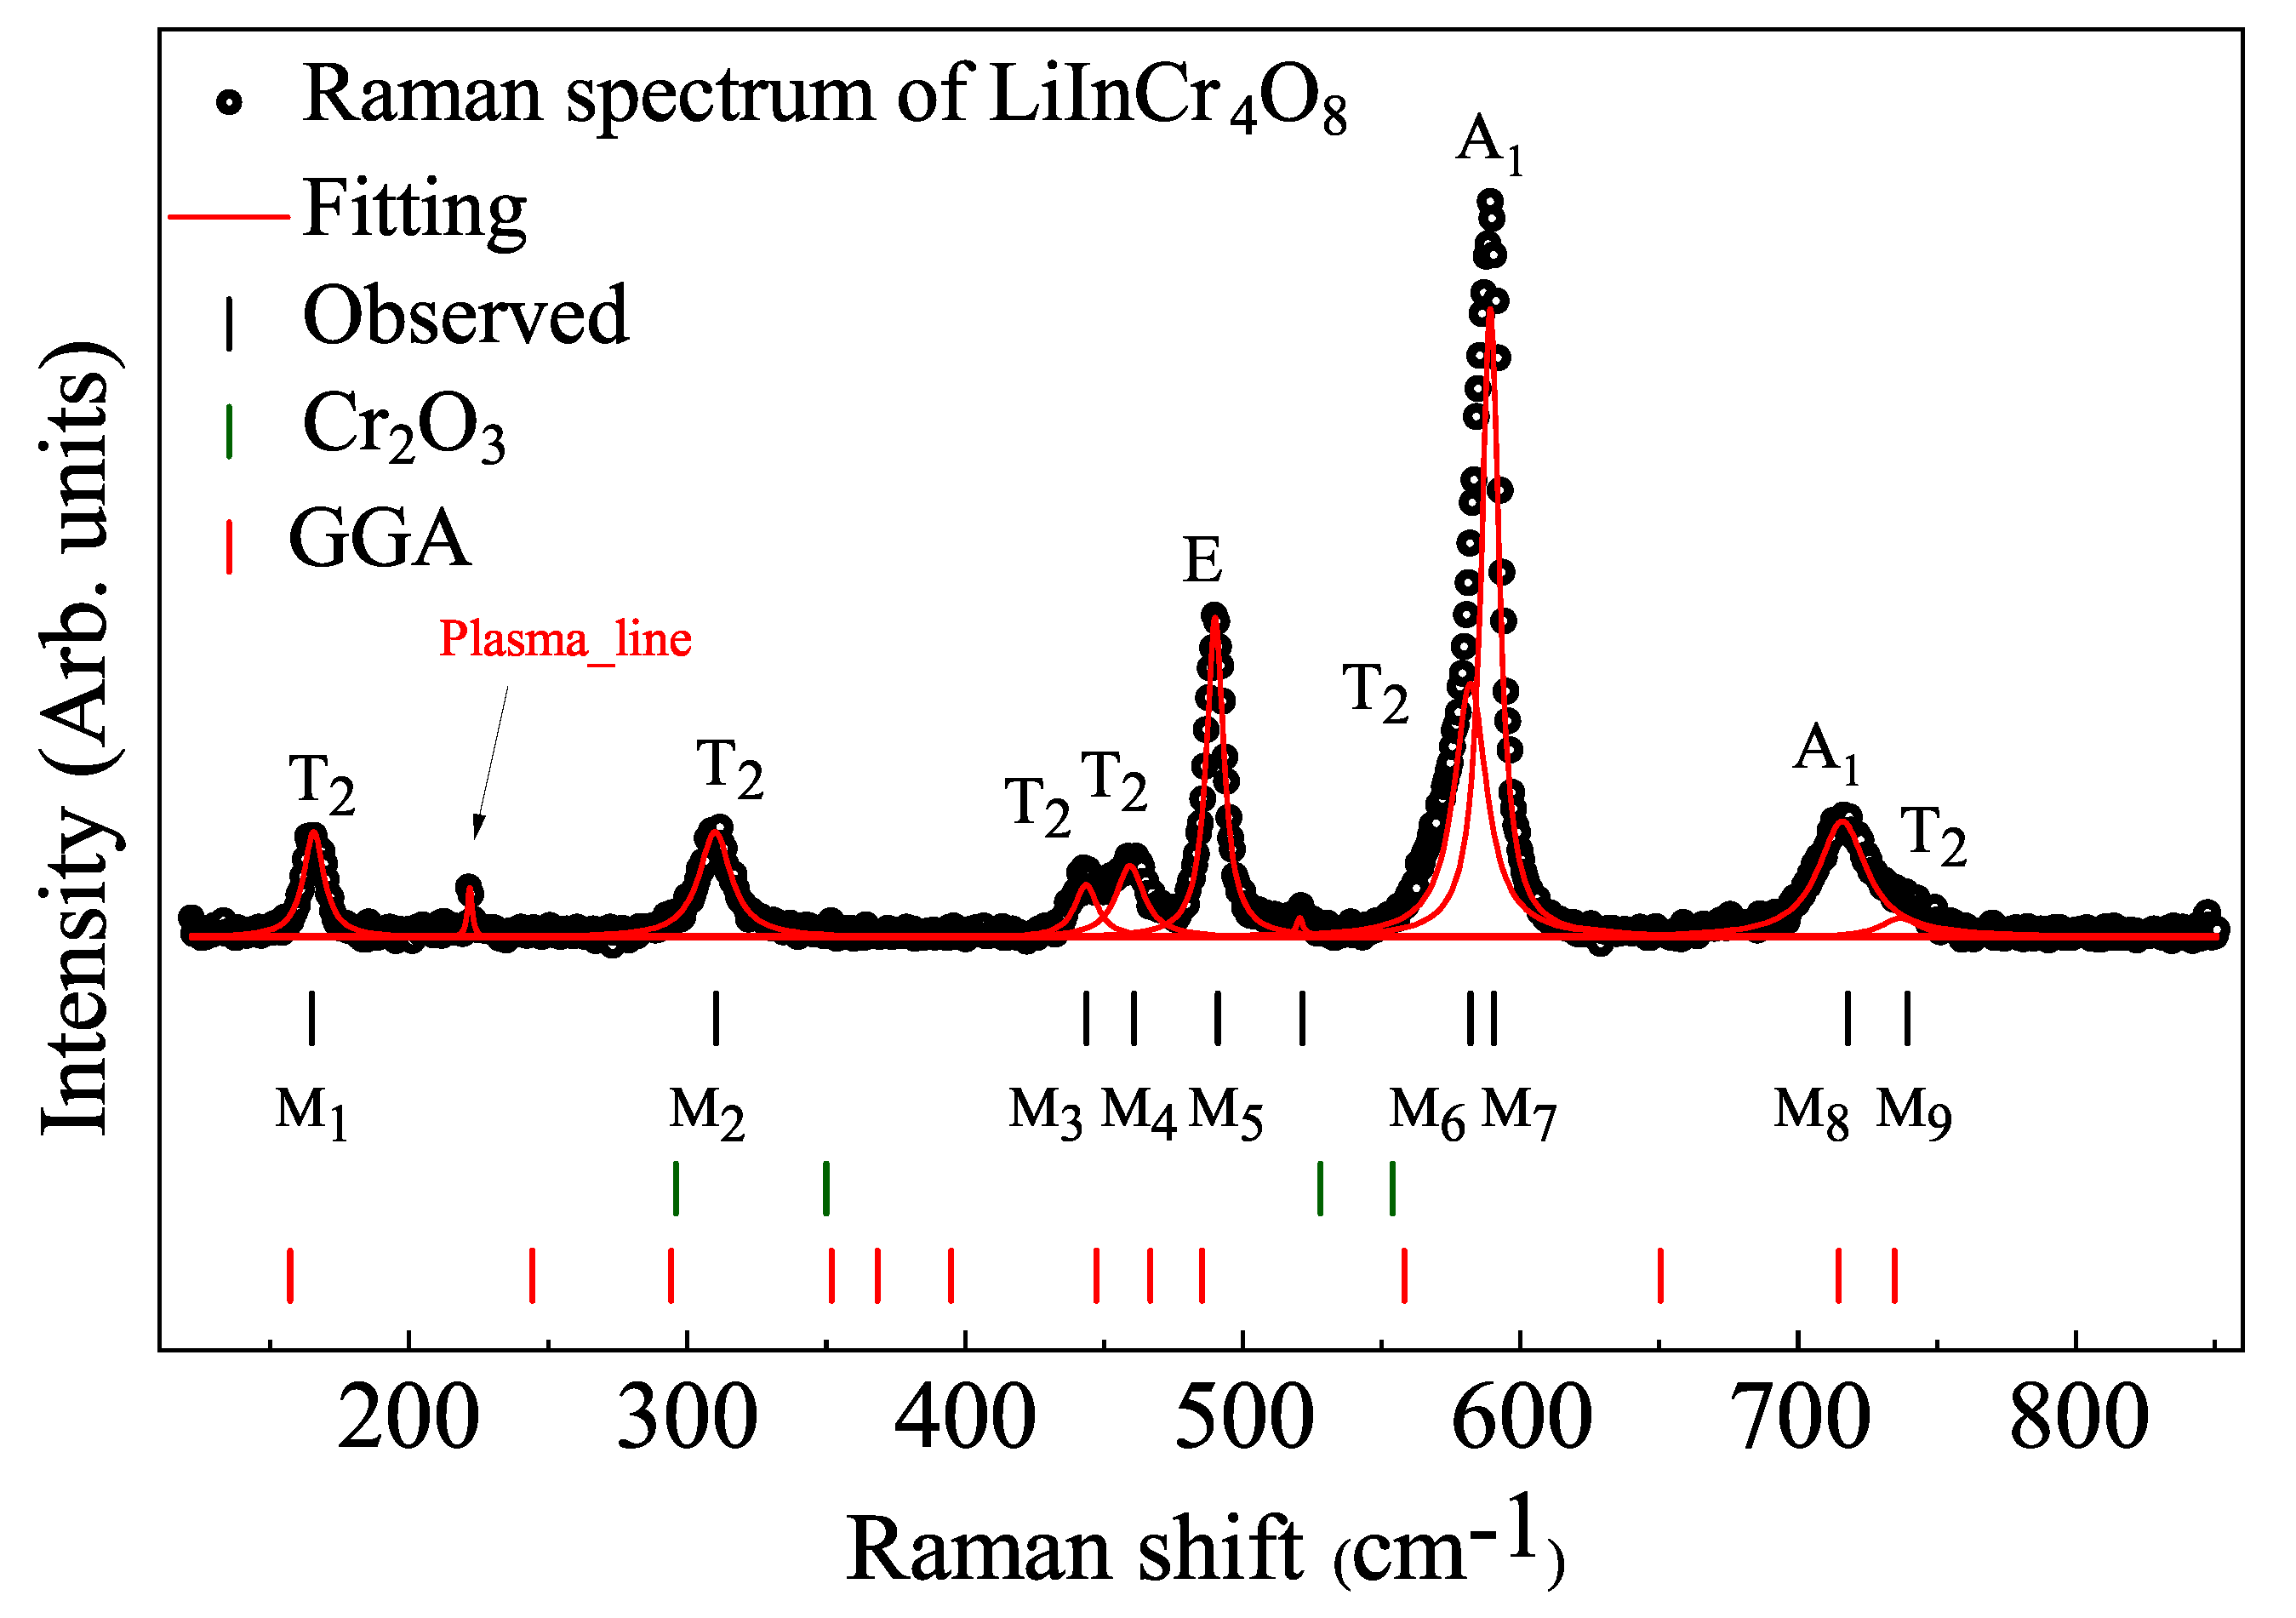
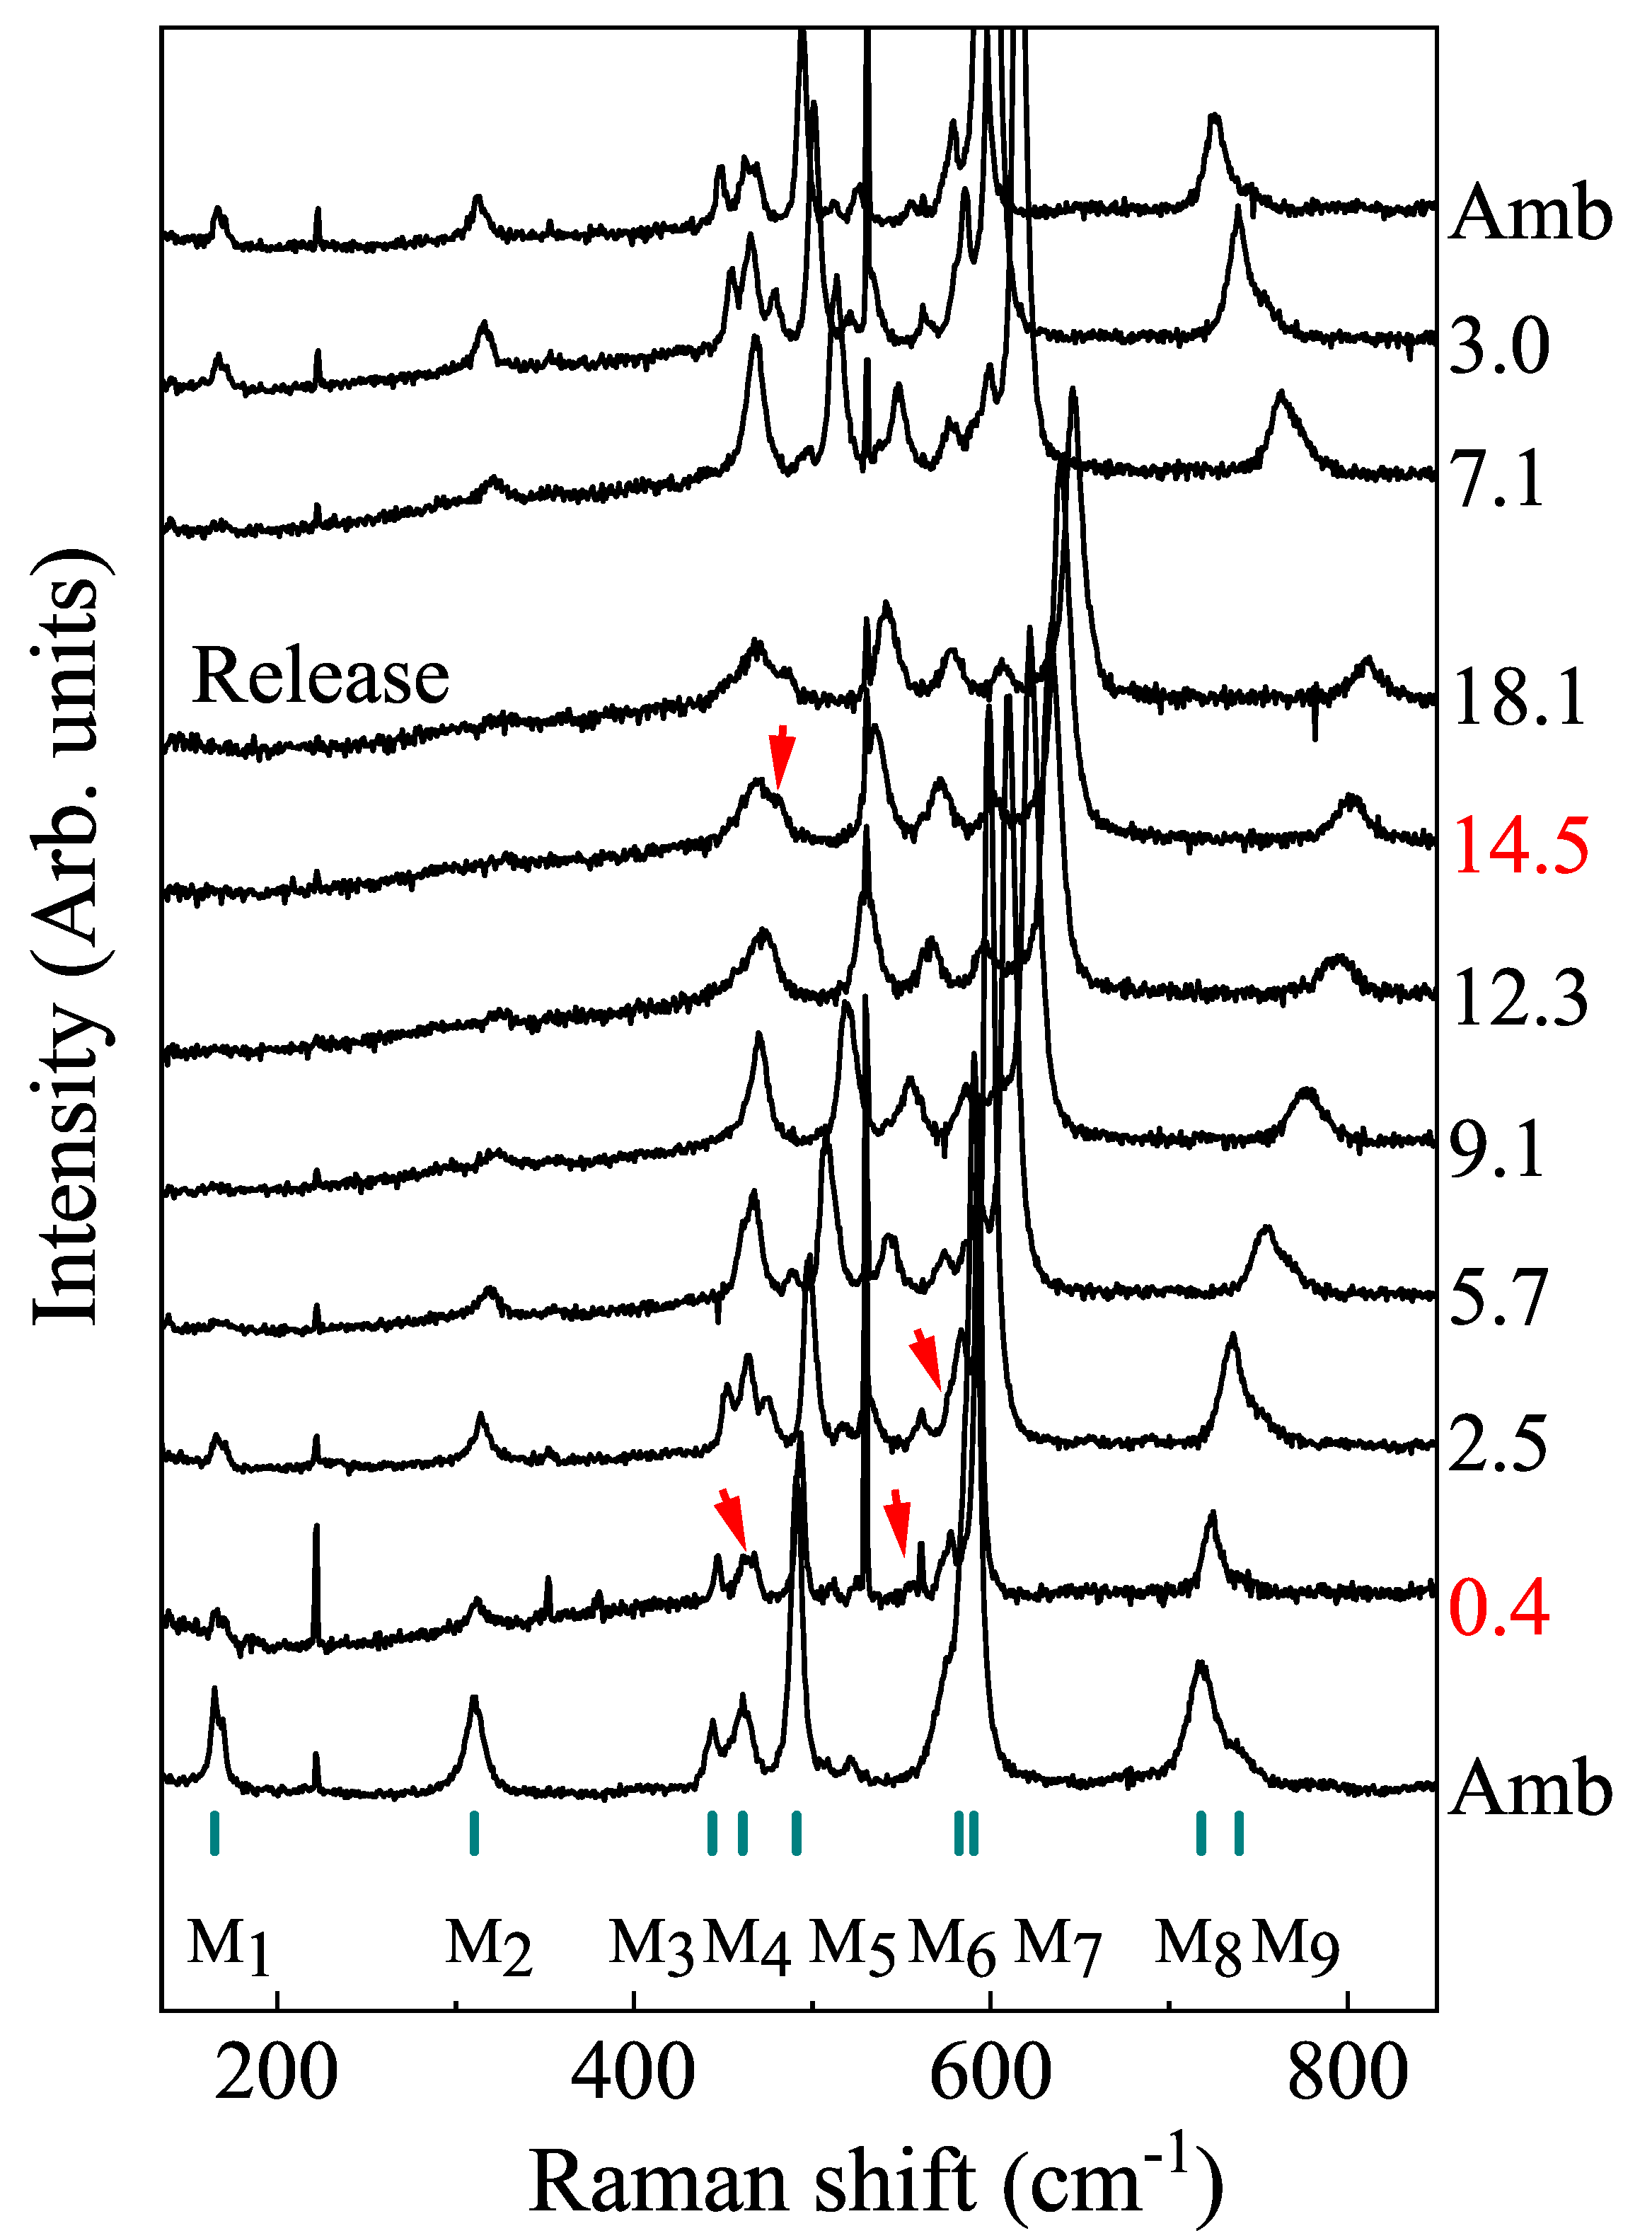
From the expected 13 Raman-active modes at ambient conditions, we experimentally observe nine modes, which are denoted as M
, M
, … M
in
Figure 3. Due to the loss of inversion symmetry in comparison with conventional spinels, LiInCr
O
has T
modes which are both IR- and Raman-active. The weak mode at ∼530 cm
has been assigned to Cr
O
[
23,
24]. The peak observed at ∼220 cm
is a plasma line from the excitation source used, which served as an internal calibrant. The ambient pressure Raman spectrum of LiInCr
O
in
Figure 3 matches well with a recently reported study [
25], except for the low-energy Raman mode M
, which is not observed in the recorded spectral range of Ref. [
25]. Because there has been no detailed report on the vibrational properties of LiInCr
O
, DFPT calculations were carried out for explicit assignment of Raman and IR modes. These calculations were performed on a primitive cell consisting of 14 atoms using the Martins–Trouilier pseudopotentials with LDA approximations. The phonon modes were assigned with the help of Molden, a visualization software [
26]. Simulations were also performed using PAW potentials with GGA approximations at ambient volume. The theoretical results are compared with experimental findings, summarized in
Table 3.
Predominantly, the observed Raman modes can be classified as the internal vibrations of polyhedral units (viz., LiO
, InO
and CrO
). Due to the covalent nature of In–O and Cr–O bonds, they are expected to have stronger contributions in the Raman spectrum. The symmetry of a free CrO
ion is reduced inside the crystal site.
Table 4 shows the changes in the internal modes of a free CrO
ion at the crystal site (C
) of the ambient pressure cubic phase (T
). Of these CrO
modes, only the A
and T
modes are Raman active in LiInCr
O
.
From the DFPT calculations, the Raman-active T
mode observed at 164 cm
is assigned to the translation motion of In. The modes M
and M
at 310 cm
and 443 cm
, respectively, are both assigned to the translation motion of Li ions. The Raman modes at 460 cm
and 491 cm
(M
& M
) are associated with asymmetric and symmetric O–Li–O bending vibrations, respectively. The strongest Raman mode observed at ∼590 cm
is related to the O–Cr–O symmetric bending and O–In symmetric stretching vibrations, whereas the adjacent T
mode at ∼582 cm
is related to the O–Cr–O asymmetric bending and In-O asymmetric stretching vibrations. In a recent study, the DFT-based calculations for LiGaCr
S
show large differences in the calculated Cr–Cr distances in magnetic and non-magnetic configurations of the system [
27]. This could explain the large difference in the calculated and observed M
and M
modes, as all the calculations are performed in a non-magnetic configuration in the present study. The Raman modes at 718 cm
and 739 cm
(M
and M
) are assigned to asymmetric and symmetric stretching vibrations of Li–O. A study on LiFeCr
O
has assigned the strongest observed mode to Cr–O stretching vibration [
9]. However, as the CrO
octahedra have shared edges, they restrict the Cr–O stretching motion in this structure, and hence only the bending modes are prominent.
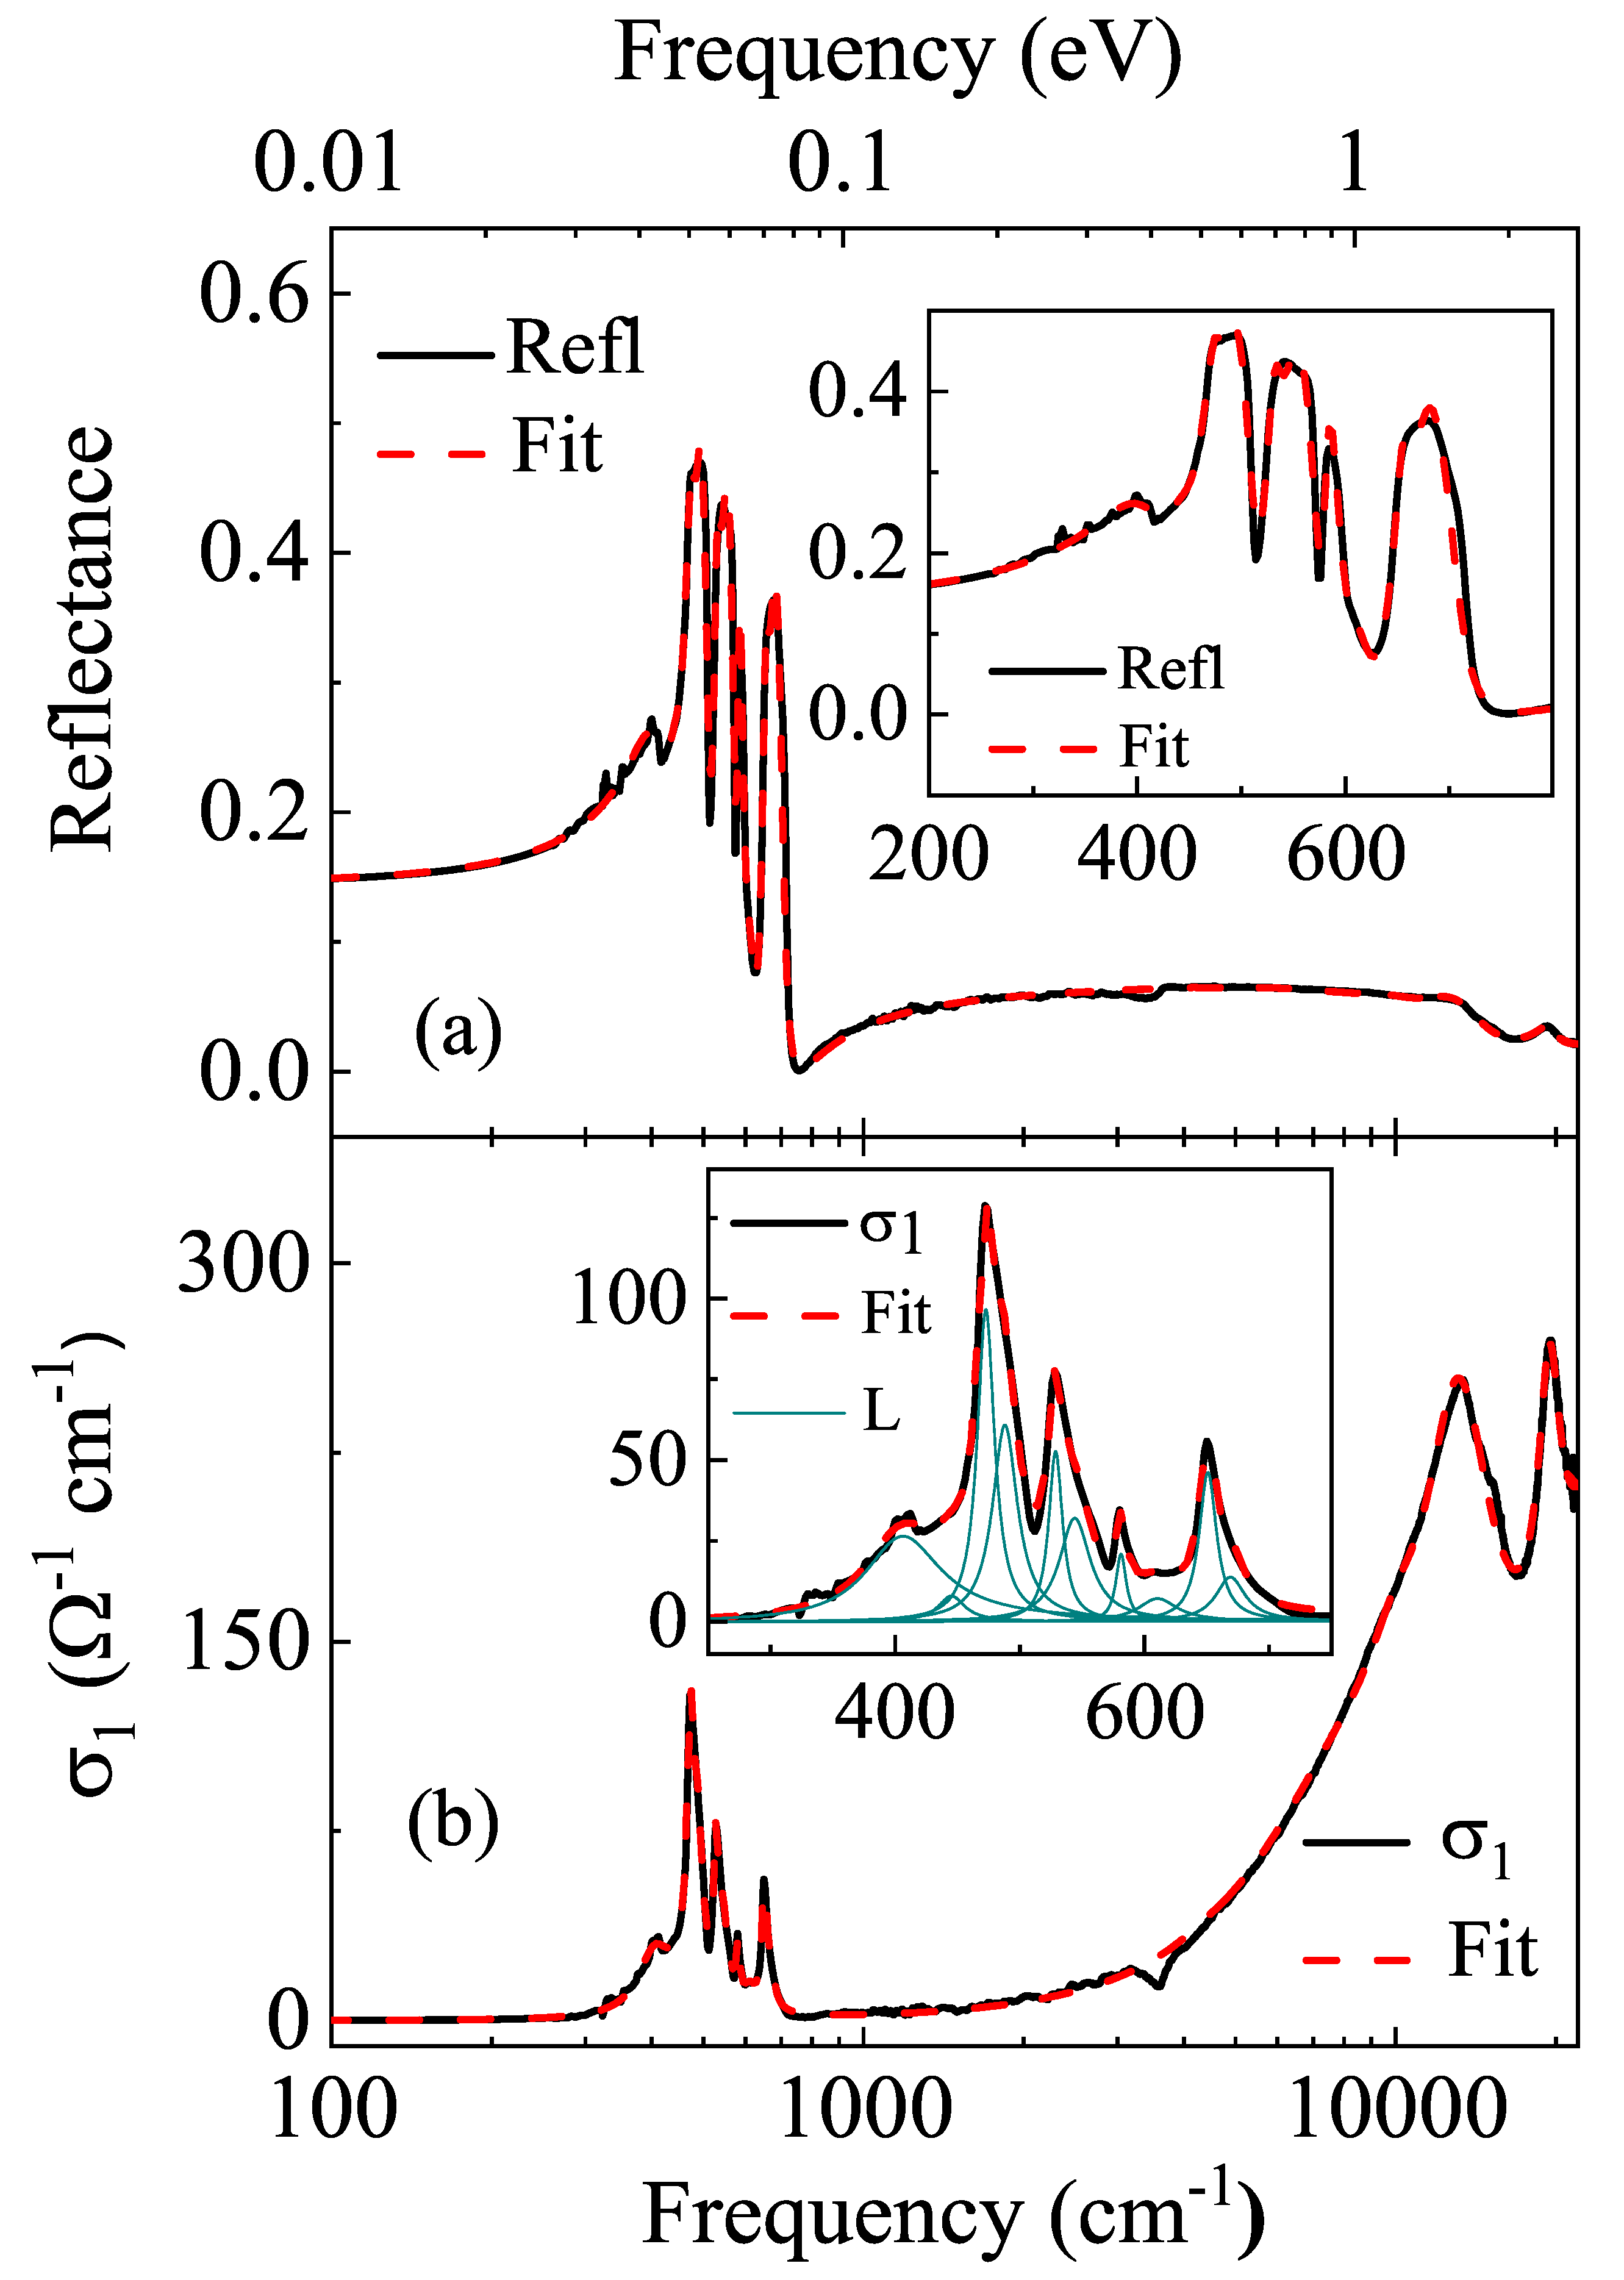
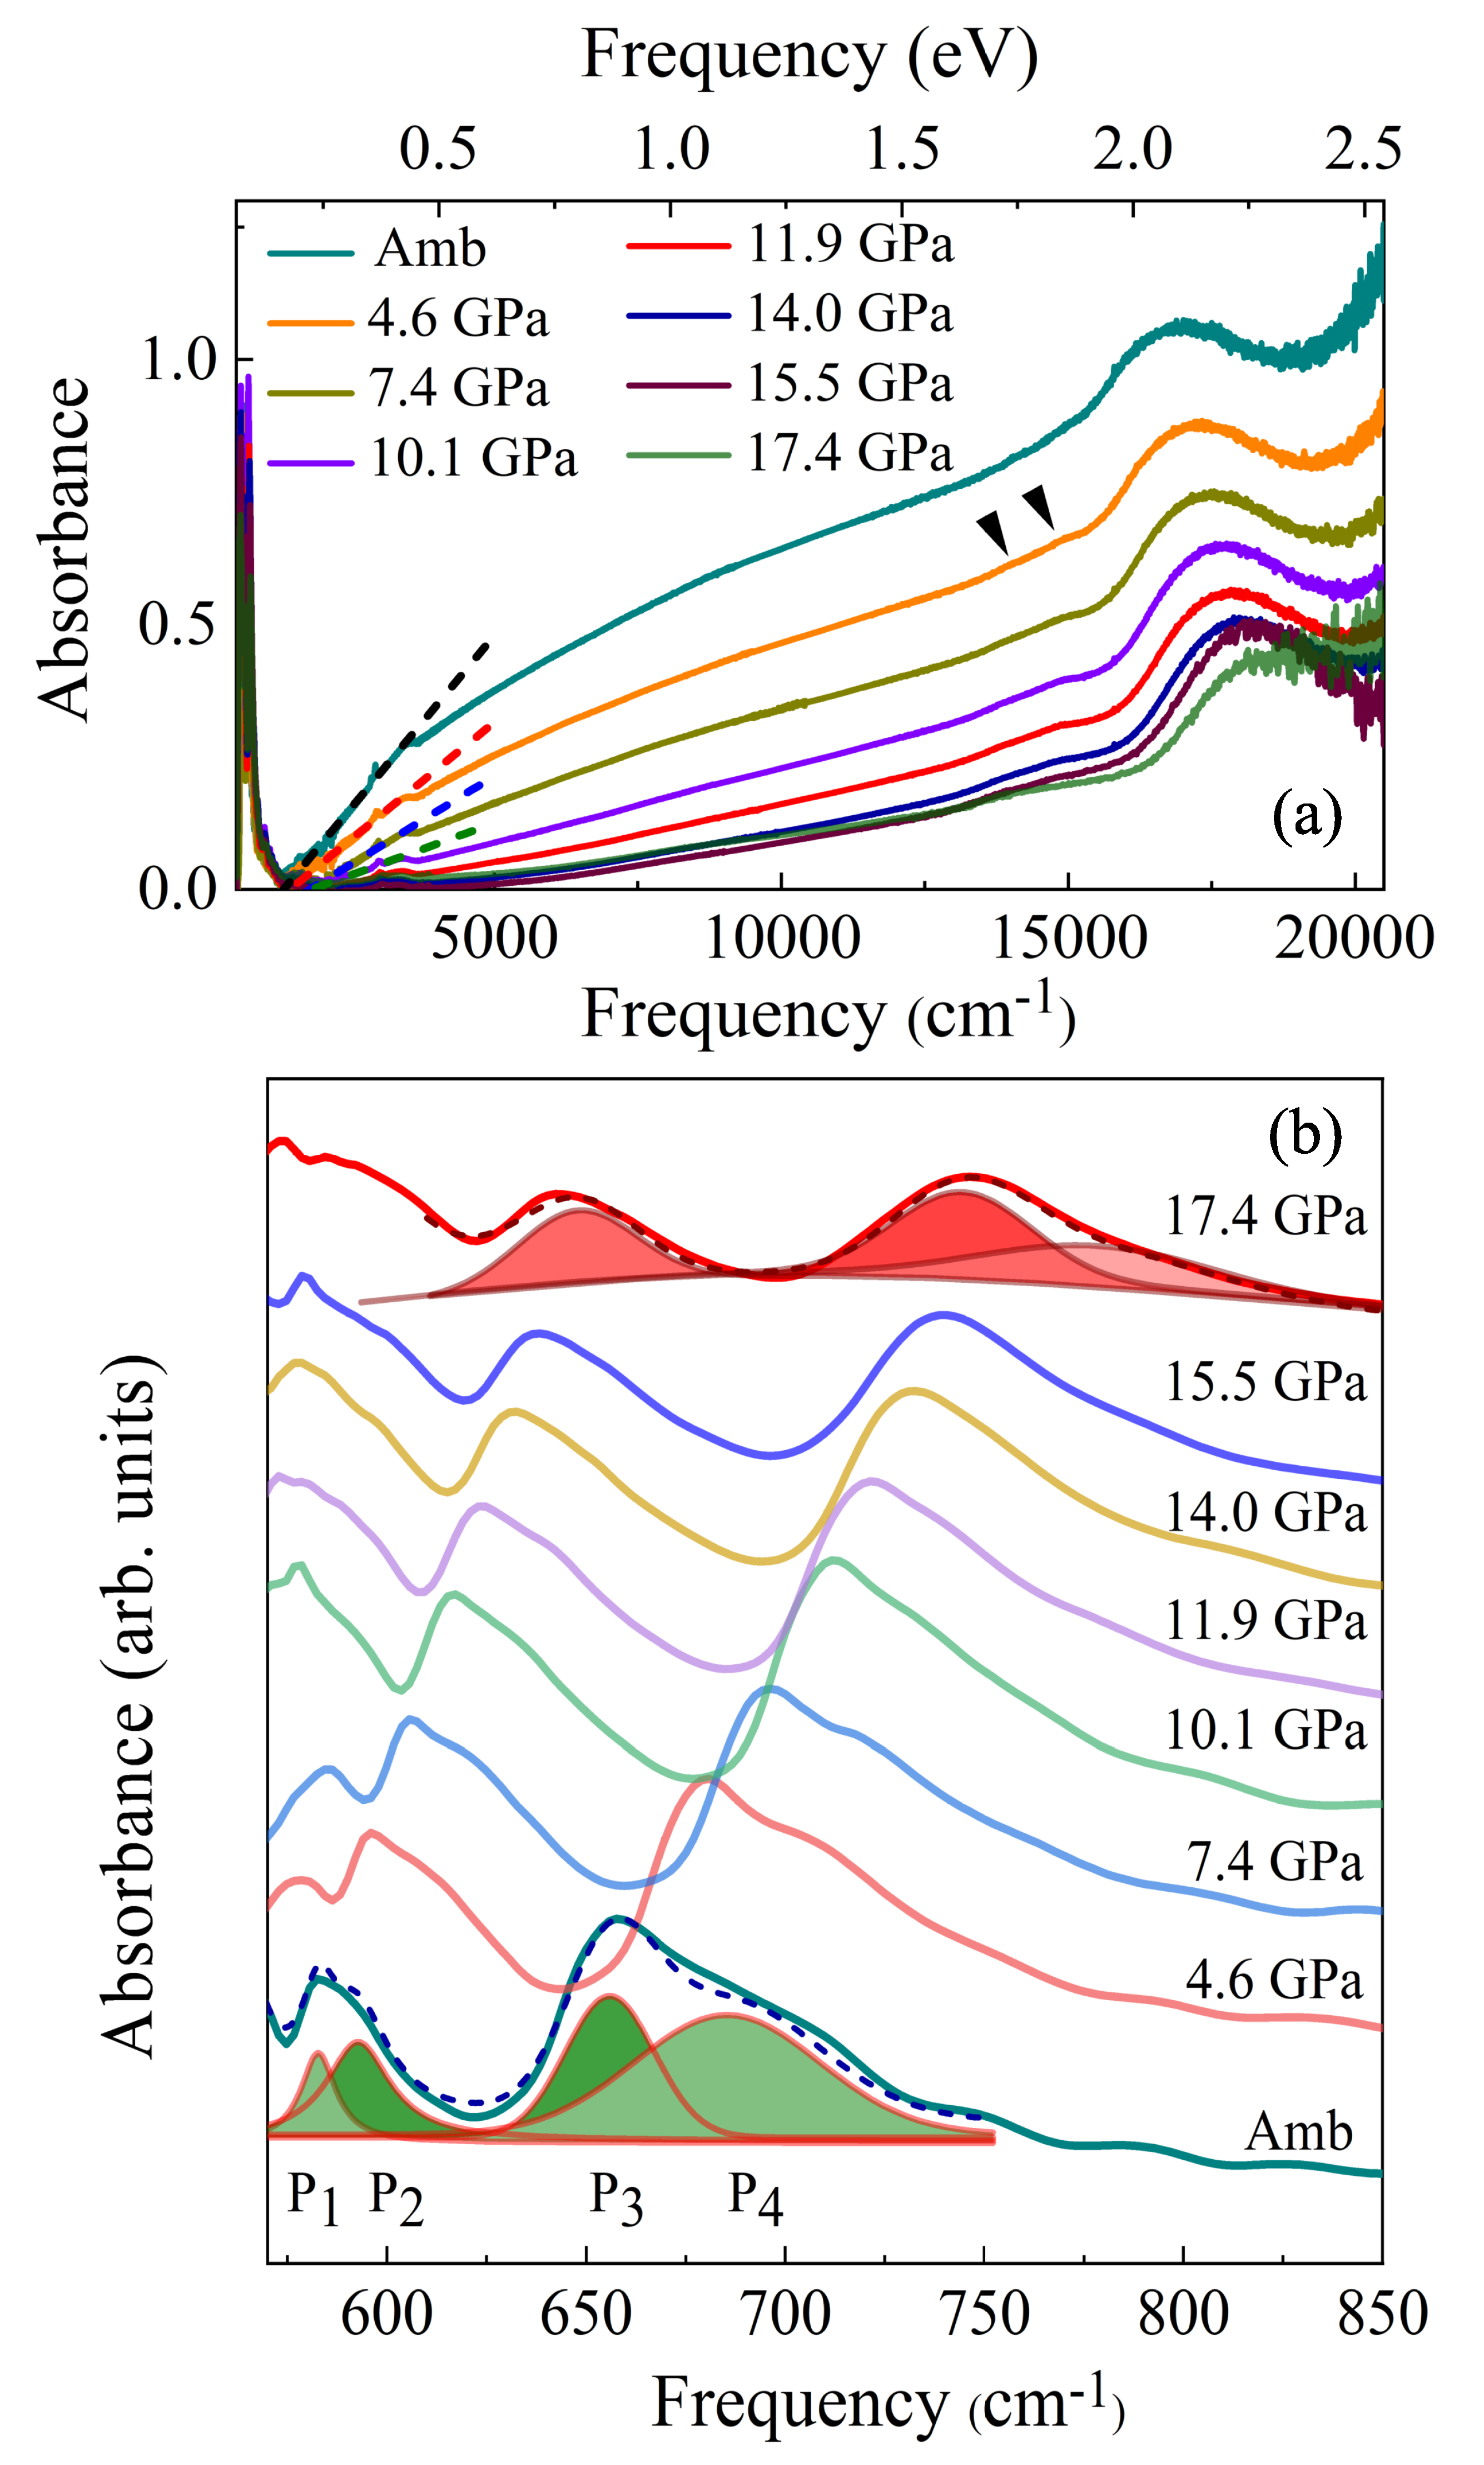
Figure 4a depicts the ambient pressure reflectivity spectrum of LiInCr
O
over a broad frequency range, together with the Lorentz fitting. The inset shows the low-frequency range up to 800 cm
, where the phonon modes are located. The corresponding optical conductivity
obtained from the KK transformation is depicted in
Figure 4b. The
spectrum shows strong phonon contributions in the far-infrared range, which is followed by the onset of electronic excitations around ∼0.1 eV, which gradually increases to two prominent absorption bands centred at ∼1.65 and 2.4 eV. Based on previous studies, the absorption bands can be assigned to intra-atomic
d-
d excitations, i.e., crystal field (CF) excitations, of the Cr
ions in an octahedral environment. Electronic excitations from the
ground state to the
and
excited states are expected in the spectral ranges of ∼13,000 to 17,000 cm
and ∼13,000 to 17,000 cm
, respectively, and the spin-forbidden transitions from
to
and
are expected in the spectral ranges of 13,000 to 14,400 cm
and 18,000 to 19,200 cm
, respectively, [
28,
29,
30,
31,
32,
33,
34,
35,
36].
The inset in
Figure 4b shows the observed ten phonon modes fitted with Lorentzian oscillators. However, the group theoretical analysis predicts only seven T
modes for LICO. Therefore, modes were assigned to the strongest modes after comparison with DFPT calculations to the closest calculated values (see
Table 3). An earlier infrared spectroscopic study on LiFeCr
O
has assigned the observed five phonon modes to the internal vibrations of the polyhedral units, viz., Li–O stretching modes in the range 400–500 cm
and CrO
and FeO
vibrations around 500 cm
and ∼640 cm
, respectively [
37]. In the present study, based on the DFPT calculations, the phonon modes above 600 cm
are assigned to the Li–O stretching vibrations. The low-energy modes are assigned to the In–O vibrations and those observed around ∼500 cm
belong to the CrO
internal vibrations.


