Abstract
It is known that the meso- and microstructures of metals determine the physical, mechanical and operational properties of their final products. Scientific and technological progress of recent decades has given impetus to the elaboration and use of models capable of describing the evolving structure of materials. The most promising are multilevel models that include internal variables and are based on physical theories of elastoplasticity (elastoviscoplasticity). This paper presents the structure and basic relationships of a three-level (macro-, meso-1 and meso-2 levels) elastoviscoplastic model. The developed model operates on such internal variables as dislocation densities on slip systems, barriers on split dislocations and sources of edge dislocations. The model describes the mechanisms of production, annihilation, formation of barriers and sources of dislocations. The law of hardening directly takes into account the densities of dislocations and barriers. The mechanism of inelastic deformation is the gliding of edge dislocations along slip systems. Special emphasis is placed on the influence of split dislocations (prone to forming hard Lomer–Cottrell and Hirth barriers) on the deformation of the material. The model is used to describe the behavior of an elastoviscoplastic polycrystalline aggregate with an FCC lattice. Geometric nonlinearity is taken into account by utilizing decomposition of the crystallite motion into quasi-rigid and deformation components. For this purpose, a rigid moving coordinate system for the crystal lattice is introduced. Examples of the application of the model for analyzing the simple and complex deformation mechanisms of materials with different stacking fault energies and, consequently, with different tendencies toward the decomposition of dislocations and barrier formation are given.
1. Introduction
Products made of alloys and metal have wide applications in areas of human life. Large portions of metal products are produced by methods of plastic deformation. The significance of mathematical modeling approaches and methods for developing technological processes has been recognized by many experts for several recent decades. Constitutive models (or constitutive relations) for describing the behavior of materials have proven themselves to be the most important element of the mathematical formulation of the resulting boundary value problems of nonlinear solid mechanics. Macro-phenomenological theories that rely heavily on the results of the experiments conducted on the macrosamples produced from the materials under study are extensively applied to different technological problems. One of the theories frequently used to solve applied problems is the classic J2 plasticity and its numerous modifications [1,2,3,4], integrated into many application software packages. The theories of this class are generally formulated based on the analysis of the results of uniaxial tests, i.e., simple (proportional) loads (strain trajectories in the five-dimensional strain space are straight lines). As many theoretical and experimental works have shown, the classical theory of plastic flow satisfactorily describes loading processes, yet only those developing along the small curvature strain trajectories [5,6,7,8].
At the same time, in real treatment processes, materials experience very heterogeneous (in the volume of billets) and complex loads. These loading processes are usually investigated during experiments on tubular samples (in most cases) [7,9]. Tests on solid samples with a change in the type of loading are also often carried out for this purpose; for instance, the results of the experiments performed on pure copper and aluminum samples subjected to compression with and without preliminary torsion at different strain rates are given in refs. [10,11]. In refs. [12,13,14], one can find the test data obtained during the torsion and tension tests on pure copper samples.
Based on the results of macro-experiments, numerous attempts have been made both to modify the known theories of plasticity and to construct new ones [15,16,17,18,19]. It is worth noting that, at present, experiments on complex loading are limited in the dimension of space. The use of tubular samples makes it possible to conduct the experiments only in the three-dimensional subspaces of the combined five-dimensional stress and strain space [5,20].
In this case, the magnitudes of the strain tensor components are substantially restricted. For example, when thin-walled tubular samples are under torsion loading, shear deformations usually do not exceed 5–7%, and, in real technological forming processes, there occur strains of hundreds to thousands of percent. Moreover, the formulation of macro-phenomenological constitutive relationships does not include consideration of the evolution of the structure of materials, whereas the meso- and microstructures are the key factors governing the physical and mechanical characteristics of metals and alloys.
Since the macro-phenomenological theories have some disadvantages mentioned above, such as the constitutive models being based on the introduction of internal variables [21,22], a multilevel approach [23,24,25,26,27,28,29,30,31] has become increasingly popular in recent decades. Because the formulation of constitutive models of this type is based on the physical laws and mechanisms characteristic of entire classes of materials, they have significant universality.
The internal variables used in these models characterize the meso- and microstructures of materials, which enables describing their structure evolution. Thus, it has been established that internal variables are able to carry information about memory [32] and about changes in the structure and physical and mechanical properties of materials that occur under external thermomechanical effects. In addition, physically oriented models are not “tied” to the type of loading, simple or complex. This knowledge motivates researchers to apply multilevel physics-based models for analyzing the behavior of materials which undergo complex deformation paths.
The results of the experimental and theoretical studies (obtained with the viscoplastic self-consistent model) on the complex loading (tension–compression in the plane of the sheet and in the transverse direction in various combinations) of the samples made of magnesium alloy sheets (HCP-lattice) are presented in [33].
In refs. [34,35,36], a two-level dislocation-oriented elastoplastic model was considered, and the results of calculations obtained in the framework of the model applied to single- and two-phase steels under monotonic (tension, simple shear) and complex (tension–compression, tension–simple shear, biaxial tension) loadings were described. It was shown that the theoretical results are in satisfactory agreement with the experimental data. References [37,38] are devoted to the description of active and latent hardening of FCC polycrystals under complex loading conditions. Two self-consistent elastoviscoplastic models and one direct model were considered to be used for describing deformation processes. For identification, the authors employed the results of their own full-scale experiments on complex loading of polycrystalline copper samples.
In ref. [39], the application of a dislocation-oriented self-consistent viscoplastic two-level model for analyzing the deformation of magnesium alloy samples along the two-link deformation trajectories was studied. In ref. [40], a two-level elastoviscoplastic model was employed to study the influence of loading complexity on the evolution of the yield surface of a polycrystalline AA6061 alloy sample. For tubular samples, both proportional (tension, torsion, in-phase tension with torsion) and non-proportional (torsion accompanied by tension and vice versa) were investigated; the theoretical results showed good agreement with the experimental results.
The results of the application of a multilevel model for describing the responses of the representative macrovolumes of face-centered cubic (FCC) metals and alloys under complex loading conditions are given in ref. [41]. The model was used to describe the deformation of a 316 L stainless steel specimen; the theoretical results showed satisfactory agreement with the experimental results for the mono- and polycrystalline samples subjected to monotonic and cyclic loading and subsequent complete unloading.
In the authors’ opinion, there are relatively few works devoted to the use of multilevel physically oriented models for studying the physical causes of experimentally observed complex loading effects (stress intensity “dive”, “delay” of vector properties in a neighborhood of break points of the deformation trajectory, etc.). In the authors’ opinion, more emphasis should be placed on studying the influence of dislocation splitting, including the formation of strong barriers (of the Lomer–Cottrell and Hirth types), on the complex loading effects.
In addition to the introduction, this paper includes two sections and a conclusion. Section 2 presents a description of the three-level dislocation-oriented model, which allows explicit consideration of the interaction between the dislocations of different slip systems, including the generation and annihilation of dislocations and the formation of barriers of a dislocation nature in alloys with low stacking fault energy. It also contains a brief description of the algorithm for implementation of the model. Section 3 includes analysis of the results of applying the model to a study of simple and complex loading of samples made of materials with different values of stacking fault energy (SFE). The conclusion section highlights the key points and findings of the research.
2. Structure and Basic Relations of the Three-Level Elastoviscoplastic Model
The main source of all changes in material, including their deformations and transformation of meso- and microstructures, are the mechanical effects to which the sample is exposed at the macrolevel. At mesolevels, the main mechanisms of structure changes are the movement of dislocations, their interactions with each other, the formation of their compounds (barriers of various types) and self-organization, controlled by the principle of internal energy reduction.
This paper proposes a three-level dislocation-based model. The model allows the deformation of a polycrystalline aggregate to be described and includes three levels of structural scale: macrolevel, mesolevel-1 and mesolevel-2 [42].
The only mechanism of inelastic deformation is the gliding of edge dislocations. At the lower structural level, mesolevel-2, the dislocation densities on slip systems (SSs) and the average dislocations slip velocities are directly described. At mesolevel-1, shear rates on SSs are considered, determined using the Orowan equation, using parameters transmitted from mesolevel-2. To establish connections between levels, internal variables are introduced into the structure of constitutive relations at each scale level, used to describe the stress–strain state and the defect structure of deeper levels.
The representative macrolevel volume is a set of several hundred grains. Grains consist of a statistically significant number (tens and hundreds) of crystallites (subgrains and fragments, for which the lattice orientation is assumed to be the same, and the internal variables can be considered homogeneous).
These elements correspond to mesolevel-1 (EM1) and have small (up to two degrees) random orientation deviations in the reference configuration within each grain. The mesolevel-2 elements (EM2) coincide in scale with the EM1 elements; the difference concerns the variables used to describe the state of the elements. At the macrolevel, loading is prescribed by the velocity gradient, dependent on the time.
Temperature and kinematic variables are transferred as an influence on EM1 from the macrolevel, and the Voigt hypothesis is used (equality of the velocity gradients in the macrolevel and EM1). In EM1, shear stresses on slip systems (SSs) and components of the inelastic component of the strain rate measure are determined. The shear stresses, which are founded on mesolevel-1 SSs, serve as the external influences for the elements of mesolevel-2, on which described defects (densities of dislocations and barriers on split dislocations) evolve, as well as the average dislocation velocities and the hardening. The quantity called hardening characterizes the change in critical shear stresses on slip systems. The shear rates along the SS determined using the Orowan equation are transferred from EM2 to mesolevel-1.
The EM2 submodel uses the division of dislocation densities on slip systems into positive and negative, depending on the direction of an extra plane. The internal variables in the EM2 submodel are as follows: dislocation densities (positive and negative), densities of dislocation sources on SSs and slip barriers formed on these SSs [43]. When constructing the model, most attention is given to a physically substantiated description of dislocation sliding and dislocation interactions, including those of split dislocations accompanied by the formation of Lomer–Cottrell and Hirth barriers.
Hereinafter, the “related” characteristics of the macrolevel and EM1 are denoted by the same letters: uppercase letters for the macrolevel and lowercase letters for EM1. According to a highly nonlinear problem, a staggered procedure is applied to find a solution. The entire time interval of loading is represented as a series of successive time steps. At each step, the (transposed) velocity gradient , set at the macrolevel, is transferred, according to the Voigt (Taylor) hypothesis, to mesolevel-1 (the numbers of the mesolevel-1 elements are omitted):
where is the gradient (Hamilton) operator defined in the current configuration, and is the transposed velocity gradient at the macrolevel (mesolevel-1).
The model is focused to describe the deformation process at large displacement gradients. Therefore, for the mesolevel elements, the decomposition of the motion into quasi-rigid and deformation components is applied [26,44]. The corotational moving coordinate system with an orthonormal basis , linked with one of the axes and one plane of the crystal lattices, is responsible for the quasi-rigid motion; the rotation rate of this coordinate system is determined by the spin ω (the crystallite numbers are omitted).
The indifferent measure of the strain rate recorded by a moving observer is . The spin ω is used to determine the corotational derivatives when writing the hypoelastic law. We accept a hypothesis about the additive decomposition of the rate of change in strains: z = ze+ zin. At EM1, using the plastic part of the strain rate measure zin, determined from the analysis of the dislocation velocities and dislocation densities found in terms of EM2, the components of the stress rate tensor () and the Cauchy stress tensor σ can be calculated based on the hypoelastic law.
At the end of each step, the speeds of the characteristics are integrated, and the values of these characteristics are determined at the end of the step under consideration. By averaging the tensor σ over a set of crystallites aggregated into the representative volume at the macrolevel, the Cauchy macrostress tensor is determined.
Analysis of the stresses σ, normal unit vectors and the sliding directions yields the tangential stresses acting on each k-th SS at EM1. The shear rates are calculated through the dislocation velocities and dislocation current densities at EM2.
The evolution of mesolevel-1 internal variables is described by the following system of equations (for all crystallites) [26]:
where is the fourth-order elastic tensor, ze and zin are the elastic and inelastic parts of the strain rate, o, ω are the orientational tensor and spin for the corotational coordinate system, respectively [44], I is the unit tensor of rank 2, the unit vector in the direction of the Burgers edge dislocation is b, n is the normal unit vector to the dislocation slip system, is the shear rate, the index k denotes the slip system number, and K is the number of slip systems.
As mentioned above, the dislocation substructure evolution of substructures is fully described at EM2. Temperature and the tangential stresses along SSs are transferred as responses from mesolevel-1 to EM2. The most significant mechanisms are considered: dislocation nucleation due to the operation of Frank–Read sources, annihilation of dislocations of different signs on equal SSs and changes in the density of barriers on SSs [45].
At mesolevel-2, the average velocities of positive and negative dislocations are calculated, which depend on the value of tangential stresses , temperature θ, the density of dislocations and the barriers . For this purpose, we employ an additive decomposition of the rate of change in critical shear stress depending on the changes in the densities of dislocations and in the densities of barriers ; in the reference configuration, the critical stresses are defined by the lattice resistance . Shear rates are determined by the Orowan equation [46], which is written in rate form. The system of equations for describing the behavior of crystallites at EM2 takes the following general form [47]:
where b(k) is the value of the Burgers vector on the k-th SS, and K is the number of SSs.
The average velocities of dislocations of opposite signs , which differ on the same crystallographic plane in both sign and magnitude, play an important role in describing dislocation interactions. Therefore, we use the modified Orowan equation:
To calculate the average velocities of dislocations, the following relations [48,49] are applied:
where , are the activation energies of dislocation gliding in the absence of stresses, and in the case where the shear stress affects SS, respectively, kB is the Boltzmann constant, θ is the absolute temperature, the Heaviside function denoted as H(), is the free path of dislocations length, the Debye frequency is denoted as ν (the maximum frequency of vibrations of atoms around their equilibrium positions) and parameters g, α, β, δ are established using identification procedure dimensionless parameters.
Isothermal plastic deformation causes new dislocations, generated by the Frank–Read sources in the form of closed expanding dislocation loops. Analysis of the experimental data indicates that a source can generate a limited number of loops. In order to describe the generation of dislocations, we introduce the density of Frank–Read sources (dimension m–3), and a change in this density is expressed as follows [47]:
where the distance between the barriers in the source is denoted as L, the density of the barriers at the intersection of the k-th and j-th SSs is denoted as , and the initial density of the barriers is .
Dislocation sources’ contribution to the growth of dislocation densities is proportional to the current loop’s density and works only at required stresses. The source is activated when the acting tangential stresses are higher than the critical activation stresses , determined for specified sources via the relation of the same type (one of the two given below) [49]:
where rav is the mean radius of the loop; A, B, p are the material parameters (dimensionless), shear modulus μ, the minimum length of the fastened segment capable of generating dislocation loops r0, the Burgers vector’s value is b, and the function is .
Dislocation annihilation occurs as a result of the reaction of dislocations with different signs belonging to the same crystallographic slip system. Such a reaction occurs when dislocations with different signs are at a short distance. This phenomenon plays a leading role in deformation processes, especially when reverse loading conditions occur. The dislocations of opposite signs attract each other, and those on the parallel slip systems can climb towards each other and annihilate when approaching the distance hann. The annihilation rate is proportional to the volume swept by dislocations (per unit length of dislocations) and the density of dislocations on slip systems. The equation for annihilation is as follows [47]:
To describe the processes of the barrier’s formation, the authors in this work developed a matrix characterizing the possibility of a barrier forming. In this matrix, the unit values of the components are at the intersection of row k and column l, which denote the SS, where split dislocations can react to form the Lomer–Cottrell or Hirth barrier. Other components of the matrix are zero components. The rate of change in the density of barriers on the reacting systems depends on dislocation densities, acting shear stresses and temperature [47]:
where is the dimensionless parameter, which characterizes the rate of barrier generation for a specified material (established during the parameter identification procedure), is the mean dislocation splitting width, and is the dimensionless value of SFE (, —SFE energy). The matrix of barrier densities on SS contains the data for all barriers (24 for the FCC lattice) that may appear on split dislocations. The components of the matrix describe the rate of change in the densities of barriers formed at the intersection of dislocations on the k-th and l-th SSs.
As a result, the barrier densities that occurred in the course of reactions are determined, and interactions between the dislocations of both signs are taken into account.
When formulating the law of hardening, the hypothesis is accepted about the possibility of additively dividing the rate of change in critical stresses on the SS into contributions from: the lattice resistance (a value that depends only on temperature), stress fields of dislocations and Lomer–Cottrell and Hirth barriers. A hardening matrix component needed to describe the influence of accumulated defects is determined by evaluating the interaction between the stress fields of dislocations observed on different SSs. The matrix Mki (Table 1 and Table 2) was constructed to assess the interaction stresses of dislocations on the k-th and i-th SSs at the intersection of the k-th row and i-th column of the matrix Mki. These matrix elements are determined for the class of materials with an FCC lattice; to determine the hardening for a specific material, it is necessary to use the procedure for identifying the multiplier in the hardening law.

Table 1.
Matrix Mki for assessing the interaction of dislocations of different SSs.
Table 2.
Values of matrix components Mki for assessing the interaction of dislocations.
The intensity of hardening due to the interaction of dislocations located in the same and different SSs can be assessed by classes of interactions (from Table 1), where the interaction of dislocations belonging to the same SS (indicated by the letter a) is estimated at 0.19, coplanar SS (b) at 0.36, dislocations with the same Burgers vector located in different SSs (c) at 0.14, systems forming barriers (d) at 1 and non-coplanar and non-collinear (e and f) at 0.3 and 0.09.
The introduction of a barrier on split dislocations as a complex of two partial and sessile dislocations makes it possible to assess the influence of a barrier on the hardening of k-th SS due to the barrier on the i-th SS. The matrix Bki, similar to the matrix Mki, is constructed to describe this effect. The components of the matrix Bki are normalized to the initial critical stresses (Peierls stresses) and are introduced in the matrix as the dimensionless material parameters. The matrix components for assessing the interaction between the dislocations of different SSs are defined by applying the well-known representation of dislocations in an isotropic elastic medium. This approach yields six types of interactions between dislocations of different SSs. The resulting matrix is symmetrical with respect to the principal diagonal. Based on these matrices, the evolutionary equations for changes in the critical shear stress and its components are written as [50]:
where are the dimensionless material parameters; the derived hardening law can be used to describe the anisotropic hardening of the material when considering the interactions between dislocations on different SSs and barriers on split dislocations.
Parameters for the hardening law (10) are identified on the basis of the experimental data obtained under simple and complex (tension and tension with shear) loads. The parameter identification procedure is reduced to finding the minimum of an objective function by the Nelder–Mead method. As an objective function, we use the sum of squared differences in stress intensities, determined theoretically (by means of the model under study) and experimentally for a finite number of values of accumulated deformation. For model parameters, pure copper and a copper–aluminum alloy (materials with different SFE values and yield strengths) are employed. The hardening law parameters are identified using the results of the full-scale simple tensile tests, and the verification was carried out via the analysis of the results of shear and tensile tests. For identification and verification, the full-scale experimental data obtained in [10,13,14,51,52] are applied.
The identification of the hardening law parameters found in the full-scale simple tensile tests (proportional tension–compression and shear) is in relation (10)3 and in relation (10)4 for copper and for copper–aluminum alloy (Table 3).
Table 3.
Values of matrix components Mki for assessing the interaction of dislocations.
3. Analysis of the Results
The model proposed in this study was used to perform a series of numerical experiments aimed at describing the response of FCC polycrystalline macrosamples subjected to simple and complex deformation along a two-link trajectory. The macrolevel representative volume (macrosample) consisted of 1024 crystallites, oriented according to a uniform distribution law in the initial configuration. The numerical experiments were carried out on the model macrosamples of copper and copper alloy (95% Cu and 5% Al), and these metals had different values of elastic tensor components and initial critical stresses on SSs (due to the lattice resistance) and SFE magnitude (81 MJ/m2 for copper; 37 MJ/m2 for copper–aluminum alloy). The initial densities of dislocations are assumed to be the same and equal to 1010 m–2, and the initial densities of barriers are equal to zero.
The numerical experiments were carried out on the representative macrovolumes (analogs of macrosamples) of the materials under study with different trajectory bend angles (0°, 90°) and at different values of strains (8, 12%) of the first segment (Figure 1, Figure 2, Figure 3 and Figure 4).
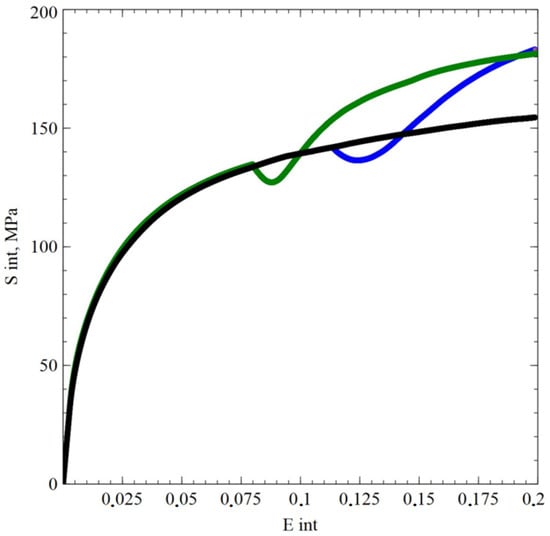
Figure 1.
Dependence of stress intensities (S int) on accumulated deformations (E int) for the trajectories with simple (black line, uniaxial tension) and complex (green line up to 8% and blue line up to 12% accumulated deformations, tension with subsequent shear) loading programs for copper. AH = 16.8% and 17.1%.
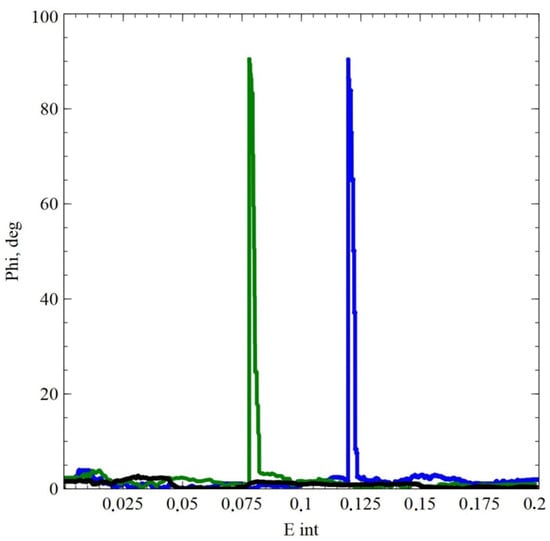
Figure 2.
Dependence of the angle between the stress vector and the tangent to the trajectory for the trajectories on accumulated deformations (E int) with simple (black line) and complex (green and blue lines) loading modes for copper.
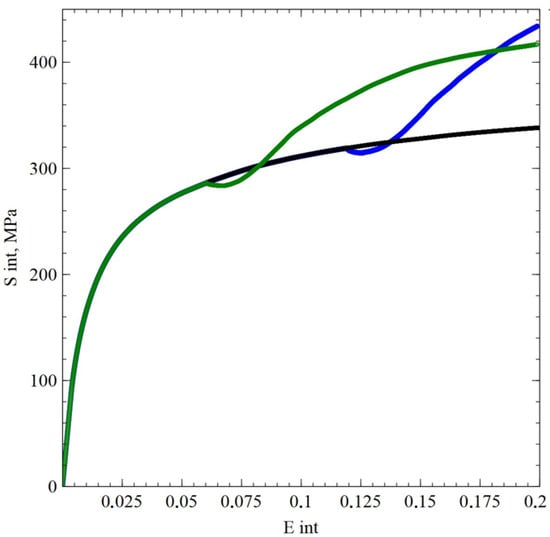
Figure 3.
Dependence of stress intensities (S int) on accumulated deformations (E int) for the trajectories with simple (black line, tension) and complex (green line up to 6% and blue line up to 12%, tension with subsequent shear) loading modes for the Cu-5Al alloy. AH = 23.4% and 28.6%.
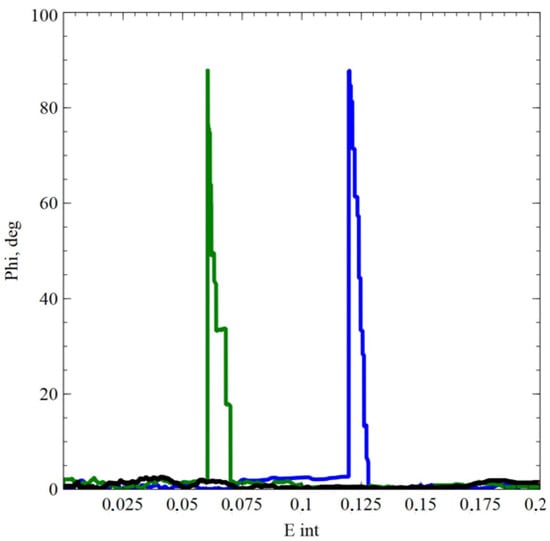
Figure 4.
Dependence of the angle between the stress vector and the tangent to the trajectory for the deformation trajectories on accumulated deformations (E int) with simple (black line) and complex (green and blue lines) loading modes for the Cu-5Al alloy.
The value of additional hardening (AH) was determined—the plastic limit (expressed in percent form) during the deformation according to a given program is higher than that obtained for the deformation according to a simple tensile loading; the values of accumulated deformations are equal. Based on the results of numerical experiments, we can state the following: The AH for a copper alloy exceeds that for copper, and the sample made of an alloy with a lower stacking fault energy demonstrates a lower rate of memory decay in terms of vector properties (the rate at which the stress vector approaches a tangent to the deformation trajectory). These facts are associated with a more intense formation of barriers on split dislocations for a copper alloy compared to pure copper. This leads to an increase in latent hardening and a decrease in the rate of stress relaxation in the first segment of the deformation trajectory after its break.
An increase in critical stresses on the SS due to the interaction of six types (Table 1) of dislocation interactions (described by relations (10)) in individual randomly selected crystallites was analyzed (Figure 5 and Figure 6).
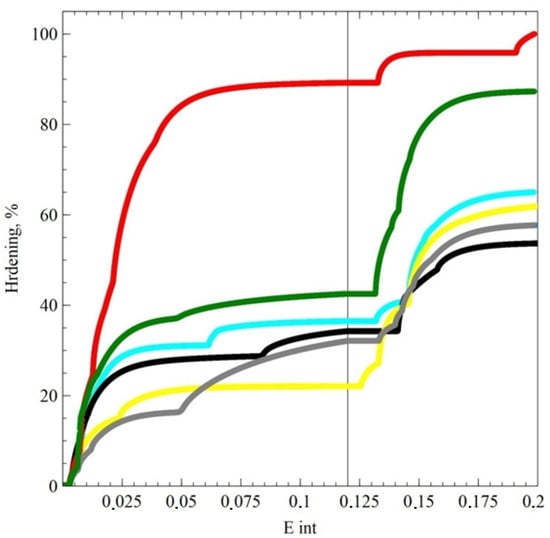
Figure 5.
Dependence of the intensity of hardening on the accumulated strains for complex loading (tension up to 12% of the accumulated strains followed by shear) for a copper crystallite. The colors depict strengthening by six types of dislocation interactions, according to Table 1 and Table 2: a—gray (belonging to the same SS); b—red (coplanar); c—green (same Burgers vector located in different SSs); d—yellow (systems forming barriers); e—black (non-coplanar); f—turquoise (non-collinear).
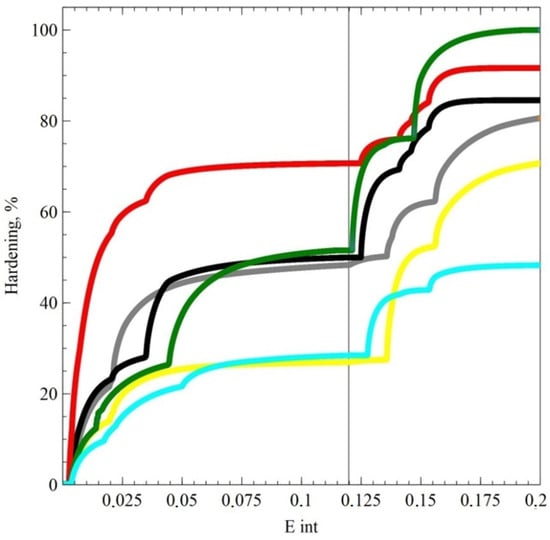
Figure 6.
Dependence of the intensity of hardening on the accumulated strains for a trajectory according to a complex loading program (tension up to 12% of accumulated strains followed by shear) for a crystallite of a copper alloy; the colors depict strengthening by six types of dislocation interactions, and the color legend corresponds to Figure 5.
Under loading conditions, when the loading changes to close to the opposite of the first stage, the stress drop may be due to the implementation of accumulated energy on the dislocation clusters pressed against the barriers, formed at the previous stage of loading. With random change in the loading trajectory, the dive in stress intensity may be associated with a less intense formation of barriers in the first loading section on those sliding systems that are activated at the second stage of loading.
Hardening was taken into account separately for each of the six types of dislocation interactions; the hardening value was normalized to the maximum value. The results demonstrated differences in the behavior of the flow stress after a break in the loading trajectory: the depth and length of the stress intensity “dive” for copper significantly exceed similar characteristics for the Cu-5Al alloy. These differences were due to a more intensive formation of barriers of a dislocation nature in the alloy. These barriers impeded the motion of inactive dislocations accumulated at the first deformation stage after a change in the direction of loading. For the alloy, one can also observe a more uniform (compared to pure copper) contribution of various types of dislocation interactions to hardening. It is also worth noting that there is a significant difference in hardening caused by the interactions between the dislocations, which belong to the same plane (coplanar slip systems, the graph is highlighted in red), and the dislocations of the same slip system (collinear, green) for copper and alloy (Figure 5 and Figure 6). The greater uniformity of strengthening of different CCs in the alloy is associated with a more intense generation of dislocations, caused by the formation of barriers on split dislocations, which play the role of stoppers in Frank–Read sources, and, consequently, an increase in the density of the latter.
Based on the results of numerical experiments, the following differences can also be noted when deforming materials with different SFEs: for materials with a high SFE, a larger magnitude of stress “dive” is observed when changing the direction of deformation than for an alloy with a low SFE. This deeper dive may be associated with the accumulation of dislocations pressed against the barriers, capable of moving freely in the direction “away from the barrier” when changing the direction of deformation, while for low SFE materials, barriers on split dislocations are formed more actively and at different SSs; therefore, the “reverse” movement will be difficult. At the same time, for the same reasons, in materials with low SFE, the rotation of the stress vector to the tangent vector and to the deformation trajectory occurs more slowly (i.e., for materials with low SFE, the “dive” is smaller in amplitude but longer in extent in deformations).
4. Conclusions
In this paper, the models for describing the deformation of materials were reviewed with an emphasis on physically based theories of plasticity, and the main mechanisms responsible for changes in defect densities were identified. The structure and mathematical formulation of a three-level model for describing the response of polycrystalline materials, which enables the consideration of changes in the defective microstructure during the deformation process, were considered. Identification and verification of the model proposed were conducted. The results of a number of numerical experiments on simple and complex loading of the macrosamples made of materials with different stacking fault energies (copper and a copper–aluminum alloy) were described. The differences in hardening effects and microstructure changes observed for two materials under different loading programs were analyzed.
Author Contributions
P.V.T.: conceptualization, review and editing and supervision. D.S.G.: writing—original draft preparation and software. K.A.K.: visualization, data curation. All authors have read and agreed to the published version of the manuscript.
Funding
Ministry of Education and Science of the Russian Federation as part of the implementation of the national project “Science and Universities” (the state task fulfillment in the laboratory of multilevel structural and functional materials modeling, project no. FSNM-2021-0012).
Data Availability Statement
The data presented in this study are available in this article.
Conflicts of Interest
The authors declare no conflict of interest.
References
- Hill, R. The Mathematical Theory of Plasticity; Geoffrey Cumberlege, Oxford University Press: Oxford, UK, 1950; p. 356. [Google Scholar] [CrossRef]
- Kachanov, L.M. Foundations of the Theory of Plasticity; North-Holland Pub. Co.: Amsterdam, The Netherlands, 1969; p. 420. [Google Scholar]
- Kolarov, D.; Baltov, A.; Boncheva, N. Mechanics of Plastic Media; Mir: Moscow, Russia, 1979; p. 302. [Google Scholar]
- Ishlinsky, A.Y.; Ivlev, D.D. Mathematical Theory of Plasticity; FIZMATLIT: Moscow, Russia, 2001; p. 704. [Google Scholar]
- Ilushin, A.A. Plasticity: Foundations of the General Mathematical Theory; Lenald: Moscow, Russia, 1963; 272p. [Google Scholar]
- Vasin, R.A. Constitutive relations in the theory of plasticity. In Advances in Science and Technology; Mechanics of Solids Series; VINITI: Moscow, Russia, 1990; Volume 21, pp. 3–75. [Google Scholar]
- Annin, B.D.; Zhigalkin, V.M. Behavior of Materials under Conditions of Complex Loading; SO RAN: Sakha, Russia, 1999; 342p. [Google Scholar]
- Zubchaninov, V.G. Mechanics of Solids; TverSTU Publ.: Tver, Russia, 2000; 703p. [Google Scholar]
- Vasin, R.A. Properties of Plasticity Functionals for Metals Determined in Experiments on Two-Link Strain Trajectories Elast.Inelast; MSU: Moscow, Russia, 1987; pp. 115–127. [Google Scholar]
- Hasebe, T.; Imaida, Y.; Nakamoto, H.; Shibahara, K. Strain rate and strain history effects on hardening behavior of fcc metals under dynamic loading—Constitutive modelling based on the crystalline plasticity. In Advances in Engineering Plasticity and Its Applications; Elsevier: Amsterdam, The Netherlands, 1996; pp. 357–362. [Google Scholar]
- Hasebe, T.; Kumai, S.; Imaida, Y. Impact compression behavior of FCC metals with pre-torsion strains. J. Mater. Process. Technol. 1999, 85, 184–187. [Google Scholar] [CrossRef]
- Chen, C.; Beygelzimer, Y.; Toth, L.S.; Estrin, Y.; Kulagin, R. Tensile Yield Strength of a Material Preprocessed by Simple Shear. J. Eng. Mater. Technol. 2016, 138, 031010. [Google Scholar] [CrossRef]
- Gu, J.; Ni, S.; Song, M. Effects of Torsional Deformation on the Mechanical Properties and Microstructures of a Commercial Pure Copper. J. Mater. Eng. Perform. 2019, 28, 543–548. [Google Scholar] [CrossRef]
- Zhou, J.; Xu, Y.; Lopez, M.A.; Farbaniec, L.; Patsias, S.; Macdougall, D.; Reed, J.; Petrinic, N.; Eakins, D.; Siviour, C.; et al. The mechanical response of commercially pure copper under multiaxial loading at low and high strain rates. Int. J. Mech. Sci. 2022, 224, 107340. [Google Scholar] [CrossRef]
- Mróz, Z. On the description of anisotropic workhardening. J. Mech. Phys. Solids 1967, 15, 163–175. [Google Scholar] [CrossRef]
- Valanis, K.C. A theory of viscoplasticity without a yield surface. Part I: General theory. Arch. Mech. Stos. 1971, 23, 517–533. [Google Scholar]
- Valanis, K.C. A theory of viscoplasticity without a yield surface. Part II: Application to the mechanical behavior of metals. Arch. Mech. Stos. 1971, 23, 535–551. [Google Scholar]
- Ohashi, Y.; Tokuda, M.; Tanaka, Y. Formulation of stress-strain relation for plastic deformation of mild steel for strain trajectory consisting of two straight branches. J. Mech. Phys. Solids 1977, 25, 385–407. [Google Scholar] [CrossRef]
- Bell, F.; Khan, A.S. Finite plastic strain in annealed copper during non-proportional loading. Int. J. Solids Struct. 1980, 16, 683–693. [Google Scholar] [CrossRef]
- Bondar, V.S.; Danshin, V.V. Plasticity. Proportional and Non-Proportional Loads; Fizmat: Moscow, Russia, 2008; p. 176. [Google Scholar]
- Rice, J.R. Inelastic constitutive relations for solids: An internal-variable theory and its application to metal plasticity. J. Mech. Phys. Solids 1971, 19, 433–455. [Google Scholar] [CrossRef]
- Maugin, G.A. The saga of internal variables of state in continuum thermo-mechanics (1893–2013). Mech. Res. Commun. 2015, 69, 79–86. [Google Scholar] [CrossRef]
- Roters, F. Advanced Material Models for the Crystal Plasticity Finite Element Method: Development of a General CPFEM Framework; RWTH Aachen: Aachen, Germany, 2011; p. 226. [Google Scholar] [CrossRef]
- Roters, F.; Eisenlohr, P.; Hantcherli, L.; Tjahjanto, D.; Bieler, T.; Raabe, D. Overview of constitutive laws, kinematics, homogenization and multiscale methods in crystal plasticity finite-element modeling: Theory, experiments, applications. Acta Mater. 2010, 58, 1152–1211. [Google Scholar] [CrossRef]
- McDowell, D.L. A perspective on trends in multiscale plasticity. Int. J. Plast. 2010, 26, 1280–1309. [Google Scholar] [CrossRef]
- Trusov, P.V.; Shveykin, A.I. Multilevel Models of Mono- and Polycrystalline Materials: Theory, Algorithms, Application Examples; Siberian Branch of Russian Academy of Sciences: Novosibirsk, Russia, 2019; p. 605. [Google Scholar] [CrossRef]
- Taylor, G.I. Plastic strain in metals. J. Inst. Met. 1938, 62, 307–324. [Google Scholar]
- Bishop, J.F.; Hill, R. A theory of the plastic distortion of a polycrystalline aggregate under combined stresses. Lond. Edinb. Dublin Philos. Mag. J. Sci. 1951, 42, 414–427. [Google Scholar] [CrossRef]
- Bishop, J.F.; Hill, R. A theoretical derivation of the plastic properties of a polycristalline face—Centered metal. Lond. Edinb. Dublin Philos. Mag. J. Sci. 1951, 42, 1298–1307. [Google Scholar] [CrossRef]
- Lin, T.H. Analysis of elastic and plastic strains of a face-centred cubic crystal. J. Mech. Phys. Solids 1957, 5, 143–149. [Google Scholar] [CrossRef]
- Asaro, R.J.; Needleman, A. Texture development and strain hardening in rate dependent polycrystals. Acta Metall. 1985, 33, 923–953. [Google Scholar] [CrossRef]
- Truesdell, C. A First Course in Rational Continuum Mechanics; The Johns Hopkins University: Baltimore, MD, USA, 1972; p. 304. [Google Scholar]
- Proust, G.; Tomé, C.N.; Jain, A.; Agnew, S.R. Modeling the effect of twinning and detwinning during strain-path changes of magnesium alloy AZ31. Int. J. Plast. 2009, 25, 861–880. [Google Scholar] [CrossRef]
- Franz, G.; Abed-Meraim, F.; Ben Zineb, T.; Lemoine, X.; Berveiller, M. Role of intragranular microstructure development in the macroscopic behavior of multiphase steels in the context of changing strain paths. Mater. Sci. Eng. A 2009, 517, 300–311. [Google Scholar] [CrossRef]
- Franz, G.; Abed-Meraim, F.; Ben Zineb, T.; Lemoine, X.; Berveiller, M. Strain localization analysis using a multiscale model. Comput. Mater. Sci. 2009, 45, 768–773. [Google Scholar] [CrossRef][Green Version]
- Franz, G.; Abed-Meraim, F.; Ben Zineb, T.; Lemoine, X.; Berveiller, M. Impact of intragranular microstructure development on ductility limits of multiphase steels. Mater. Sci. Eng. A 2011, 528, 3777–3785. [Google Scholar] [CrossRef]
- Gérard, C.; Bacroix, B.; Bornert, M.; Cailletaud, G.; Crépin, J.; Leclercq, S. Hardening description for FCC materials under complex loading paths. Comput. Mater. Sci. 2009, 45, 751–755. [Google Scholar] [CrossRef][Green Version]
- Gérard, C.; Cailletaud, G.; Bacroix, B. Modeling of latent hardening produced by complex loading paths in FCC alloys. Int. J. Plast. 2013, 42, 194–212. [Google Scholar] [CrossRef]
- Wen, W.; Borodachenkova, M.; Tomé, C.N.; Vincze, G.; Rauch, E.; Barlat, F.; Grácio, J. Mechanical behavior of Mg subjected to strain path changes: Experiments and modeling. Int. J. Plast. 2015, 73, 171–183. [Google Scholar] [CrossRef]
- Iftikhar, C.M.; Li, Y.L.; Kohar, C.P.; Inal, K.; Khan, A.S. Evolution of subsequent yield surfaces with plastic deformation along proportional and non-proportional loading paths on annealed AA6061 alloy: Experiments and crystal plasticity finite element modeling. Int. J. Plast. 2021, 143, 102956. [Google Scholar] [CrossRef]
- Zirkle, T.; Zhu, T.; McDowell, D.L. Micromechanical crystal plasticity back stress evolution within FCC dislocation substructure. Int. J. Plast. 2021, 146, 103082. [Google Scholar] [CrossRef]
- Trusov, P.V.; Gribov, D.S. The Three-Level Elastoviscoplastic Model and Its Application to Describing Complex Cyclic Loading of Materials with Different Stacking Fault Energies. Materials 2022, 15, 760. [Google Scholar] [CrossRef]
- Khan, A.S.; Liu, J. A deformation mechanism based crystal plasticity model of ultrafine-grained/nanocrystalline FCC polycrystals. Int. J. Plast. 2016, 86, 56–69. [Google Scholar] [CrossRef]
- Trusov, P.V.; Shveykin, A.I. On motion decomposition and constitutive relations in geometrically nonlinear elastoviscoplasticity of crystallites. Phys. Mesomech. 2017, 20, 377–391. [Google Scholar] [CrossRef]
- Lin, P.; El-Azab, A. Implementation of annihilation and junction reactions in vector density-based continuum dislocation dynamics. Model. Simul. Mater. Sci. Eng. 2020, 28, 045003. [Google Scholar] [CrossRef]
- Orowan, E. Problems of plastic gliding. Proc. Phys. Soc. 1940, 52, 8–22. [Google Scholar] [CrossRef]
- Gribov, D.S.; Trusov, P.V. Three-Level Dislocation-Based Model for Describing the Deformation of Polycrystals: Structure, Implementation Algorithm, Examples for Studying Nonproportional Cyclic Loading. Phys. Mesomech. 2022, 25, 557–567. [Google Scholar] [CrossRef]
- Shtremel, M.A. The Strength of Alloys. Part I. The Lattice Faults; MiSiS: Moscow, Russia, 1999; 384p. [Google Scholar]
- Orlov, A.N. Introduction to the Theory of Defects in Crystals; High School Press: Moscow, Russia, 1983; p. 144. [Google Scholar]
- Madec, R.; Devincre, B.; Kubin, L.P. Simulation of dislocation patterns in multislip. Scr. Mater. 2002, 47, 689–695. [Google Scholar] [CrossRef]
- Tian, Y.Z.; Zhao, L.J.; Chen, S.; Terada, D.; Shibata, A.; Tsuji, N. Optimizing strength and ductility in Cu–Al alloy with recrystallized nanostructures formed by simple cold rolling and annealing. J. Mater. Sci. 2014, 49, 6629–6639. [Google Scholar] [CrossRef]
- Tian, Y.; Shibata, A.; Zhang, Z.; Tsuji, N. Ductility Sensitivity to Stacking Fault Energy and Grain Size in Cu–Al Alloys. Mater. Res. Lett. 2016, 4, 112–117. [Google Scholar] [CrossRef]
Disclaimer/Publisher’s Note: The statements, opinions and data contained in all publications are solely those of the individual author(s) and contributor(s) and not of MDPI and/or the editor(s). MDPI and/or the editor(s) disclaim responsibility for any injury to people or property resulting from any ideas, methods, instructions or products referred to in the content. |
© 2023 by the authors. Licensee MDPI, Basel, Switzerland. This article is an open access article distributed under the terms and conditions of the Creative Commons Attribution (CC BY) license (https://creativecommons.org/licenses/by/4.0/).